


This paper uses a resource-based perspective and balanced panel data analysis to explore whether the representation of women on the boards of directors of Spanish companies is associated with an increase in voluntary disclosure of information concerning intellectual capital [IC]. We find that gender diversity is a complementary corporate governance mechanism that has a significant positive effect on levels of disclosure of IC information. This appears due to the presence of women on boards serving to prompt stronger monitoring and oversight behaviour. Our findings should encourage support for policies that will increase current levels of representation of women on corporate boards and influence the setting of corporate governance requirements relating to disclosure by capital market regulators.
We respond to a call to generate “knowledge and insights that can compel positive change in the representation and status of women on corporate boards” (Bilimoria, 2000, p. 25). We explore whether representation of women on boards increases the level of voluntary disclosure of intellectual capital [IC] information, including disclosures of knowledge-based intangibles (Erickson & Rothberg, 2015).
This study is timely because of the recent profusion of regulatory recommendations regarding gender balance on corporate boards (Masselot & Maymont, 2015). Increasing the representation of women on company boards has fast become a policy goal for many national governments (Senden & Visser, 2013). This study is important too because of the strong influence IC now has on long-term corporate value. If stakeholders are informed fully about how a company manages IC, they can better assess its capacity to sustain, and increase, long-term value. However, because access to information regarding IC generally has been asymmetric, stakeholders rely strongly on voluntary disclosures of IC to inform their decision making (Tejedo-Romero, 2016).
The first regulatory initiatives seeking gender balance on company boards were instituted in 2003 in Norway. Public companies were required to have at least 40 percent of either gender as board members by 2008. Such initiatives have spread throughout the world. For example, the Indian Companies Bill 2012 recommended that company boards include at least one woman director (Kamalnaath & Peddada, 2012). In Malaysia, the Code of Corporate Governance (2012) required public companies to have at least 30 per cent of women on their boards by 2016. In 2012, the European Union [EU] required publicly listed companies in member countries to voluntarily increase women on boards to 30% by 2015, and 40% by 2020 (EU, 2012). In Spain, the Equality Law (Law 3/2007) pressed companies to increase the proportion of women on boards to 40% by 2015.1
The empirical data we draw on are sourced in the voluntary disclosures regarding IC that were made in 125 sustainability reports of major Spanish companies, 2007–2011. The decision to study Spain is motivated by the historically low level of representation of women on boards in that country. In 2013, the European Commission (EC) reported that women represented 12.3% of board members of Spain's largest listed companies (IBEX 35 index), well below the EU average of 15.8%. The rate of increase of women on boards in Spain between 2003 and 2012 was 1% per annum. The EC observed that “at this rate of change, boards with at least 40% of each gender are 30 odd years away and the 2015 deadline stipulated in the quota law of 2007 will pass unmet” (EC, 2013).
We adopt a resource-based perspective to contend that boards perform better if members have diverse views, skills and professional experience (including in terms of gender). We conduct static and dynamic panel data analysis of the impact on IC disclosures of the representation of women on boards. We isolate the “proportion of women on boards” as the principal independent variable. Gender diversity is found to be statistically significant (1% level) in explaining the level of disclosure of IC information. When controls are introduced for four corporate governance characteristics (board size, board activity, independent directors, and ownership concentration) and three company characteristics (company size, listing on a sustainability index, and industry), gender diversity remains significant (1% level).
The variable “external independent directors” is related negatively to disclosures of IC information (10% level). Thus, voluntary disclosure of IC decreases slightly as the number of external independent directors increases – in contrast to the effect of appointing women to boards. The presence of more independent directors appears to substitute for the need to disclose more information. We find too that a higher level of board activity (as measured by the number of board meetings) means a slightly lower level of IC disclosure (significant at the 10% level). Board size and ownership concentration are not significant. In terms of firms’ characteristics, size and industry are related positively to IC disclosure (5% level) and listing in sustainable indexes (10% level).
This study adds to the corpus of empirical evidence that has investigated whether increased representation of women on boards leads to favourable outcomes for stakeholders and improves board effectiveness. The findings aid understanding of how gender diversity increases voluntary disclosures (in this case of IC information) in listed companies. The study reveals that increased representation of women on boards is likely to improve board oversight, enhance transparency, and reduce information asymmetry in respect of IC information. The results partially vindicate public policy in Spain (and other countries) which impose(s) quotas on the representation of women on company boards. Resource-based perspectives help to explain the positive contribution of women in terms of the different personal-social attributes, and the gender-related values they bring to boards (Eckes & Trautner, 2000).
The remainder of this paper is organised as follows. Section 2 reviews relevant literature and outlines the regulatory setting in Spain. Section 3 describes research method. Section 4 presents results and discusses findings. Section 5 draws conclusions and enters recommendations for further research.
2Theoretical framework and regulatory settingDespite strong research into the effects of corporate governance on disclosure (Cerbioni & Parbonetti, 2007) much is still to be learnt about the effect of corporate governance on the quantity and quality of voluntary disclosures (including of IC information). Understanding the effect that the appointment of women to boards of directors has on voluntary disclosures is inadequate, especially in societies such as Spain which are viewed predominantly as “masculine.” The lingering legacy of the Franco regime (1939–1975) renders Spain an ideal setting to study the traction gender diversity initiatives are having on corporate behaviour. Franco “actively opposed the advancement of women's rights […] and established numerous policies against women's paid employment” (Valiente, 2002, p. 767, p. 773).
2.1Theoretical frameworkOur central premise is that increased representation of women on boards is associated with an increase in voluntary disclosures of IC information. Theoretical support for this premise is provided by resource-based perspectives (Arroyo, Fuentes, de, & Jiménez, 2016). In particular, a board of directors provides a valuable resource that renders competitive advantage to a firm (Arosa, Iturralde, & Maseda, 2013; Branco & Rodrigues, 2006). The EU Corporate Governance Framework (2011) points out that board members should have diverse views, skills and professional experience – these are all value-creation characteristics emphasised by resource-based perspectives. Diversity in members’ profiles (including gender) gives the board a range of competencies, a pool of resources and expertise, a set of different leadership experiences, and a capacity to generate new ideas (Quintana García, 2016).
Women directors invest a board with leadership behaviour that is communal, is strong in considering strategic issues and policies pertaining to corporate social responsibility, and possesses “a concern with the welfare of other people and being affectionate, helpful, kind, sympathetic, interpersonally sensitive, nurturing and gentle” (Neilsen & Huse, 2010, p. 138). The EU Green Paper (2011) considers diversified expertise essential in ensuring that a board understands a company's financial objectives, and the impact of its business on different stakeholders. Gender diversity is considered to enhance the collective intelligence of a board and to “contribute to increasing the pool of talent available for a company's highest management and oversight functions” (p. 7). (For further review of the benefits of board gender diversity, see Liao, Luo, & Tang, 2015).
Gender representation regulations have been based on belief that women will improve commercial effectiveness (Quintana García, 2016) by increasing the competency, expertise, collective judgement, and intelligence of a board (EC, 2011). There is strong contention that company performance will improve because women are better than men at multi-tasking, risk management and communication (Schubert, 2006); and because they have a “more participative and process-oriented” communication style (Lucas-Pérez, Mínguez-Vera, Baixauli-Soler, Martín-Ugedo, & Sánchez-Marín, 2015, p. 267). Additionally, because women directors bring different viewpoints to the boardroom, they will inevitably increase transparency and reduce information asymmetry (Srinidhi, Gul, & Tsui, 2011, p. 1613). In this regard, Abad, Lucas-Pérez, and Minguez-Vera (2015, p. 23) report evidence from Spain “that gender-diverse boards improve the information environment by ameliorating information asymmetry problems” in the capital market.
Two major factors explain the propensity of women directors to reduce information asymmetry. The first is that women employ “a more trust-building leadership style than men”, such that their commitment to “trust-building requires more information exchange and lower information asymmetry” (Srinidhi et al., 2011, p. 1614). The second is that “female directors exhibit greater diligence in monitoring” (Adams & Ferreira, 2009; Srinidhi et al., 2011, p. 1611). Better monitoring by gender-diverse boards is claimed to lead to better oversight of managers, enhanced transparency, and a “richer information environment” (Lucas-Pérez et al., 2015, p. 267). Such an environment is likely to witness the disclosure of IC information because higher levels of representation of women on boards “implies a better knowledge of the market and better identification with customers and employees” (Lucas-Pérez et al., 2015, p. 268). Market, customer and employee matters are strong components of IC disclosures. Furthermore, studies have found that women directors are more diligent than male directors (Huse & Solberg, 2006). They are better monitors (Adams & Ferreira, 2009), more innovative (Torchia, Calabrò, & Huse, 2011), and stronger advocates for “community values” (Swartz & Firer, 2005) and “women's issues” (Huse & Solberg, 2006).
Swartz and Firer (2005, p. 151) highlight the important connection of IC with “a company's reputation with its external stakeholders, including the community.” They argue “that boards of directors with a higher percentage of women will make decisions on the future intellectual capital performance of the entity with more sensitivity to community concerns than male-only boards” (p. 151). Boulouta (2013, p.188) offers support by arguing that women on boards “are likely to comply with the feminine stereotype,” be more socially sensitive, have greater concerns for “soft” issues, and have “a positive impact on board tasks of a qualitative nature, such as strategic and CSR [corporate social responsibility] issues” (p. 187) (also see Liao et al., 2015). Empirical support for Boulouta's view is reported in Ben-Amar, et al.'s (2017) study of Canadian companies, 2008–2014: the likelihood of voluntary climate-change disclosures increased as the percentage of women on boards increased. Similarly, based on a study of practice in 22 countries, Fernandez-Feijoo et al. (2014) showed that boards with more women disclose more CSR information. Furthermore, Lucas-Pérez et al. (2015, p. 267) concluded that women “exert a better influence on the firm on tasks related to corporate social responsibility [CSR] and strategic control.” Consistent with the literature cited above, and the conclusion of Swartz and Firer (2005) that the presence of women on boards has a positive effect on IC performance, there are strong grounds to believe that increased representation of women on boards will increase disclosures of IC information.
Prior studies of whether gender diversity of directors influences decisions about information disclosure have been based on expectation that gender diversity will increase levels of voluntary disclosure. However, the findings are not unanimous. Nalikka (2009) examined the impact of directors’ gender on voluntary disclosures in company annual reports (for 2005–2007) of 108 companies listed on the Helsinki Stock Exchange. She found that the proportion of women board members did not have a significant impact on levels of voluntary disclosure. In contrast, Barako and Brown's (2008) study of Kenyan banks found that the representation of women on boards was associated positively with the extent of CSR information disclosed voluntarily in annual reports. Drawing from the above, the following hypothesis is examined:H1 The higher the proportion of women directors on the board, the higher the voluntary disclosure of information about IC.
In the past twenty years, the Spanish Stock Exchange Commission (Comisión Nacional del Mercado de Valores, referred to as CNMV) has published three major corporate governance “best practice” reports (Aldama Report, 2003; Código Unificado de Buen Gobierno Corporativo, 2006 [CUBGC] [Unified Code of Good Corporate Governance], updated in 2013; Olivencia Report, 1998). In 2003, the Aldama Report emphasised the need to increase the transparency of listed companies. In 2006, amendments to the Fourth European Directive (78/660/EEC) required issuers of securities traded on a regulated market to incorporate an annual corporate governance section in their management reports. The CUBGC was issued in 2006 (and updated in 2013) to promote ethical behaviour in corporate governance. The CUBGC (2006, 2013) has directed that companies without female board representation should appoint female candidates to any board vacancy. This directive was consistent with Spanish Law 2/2007 requiring a quota of 40% of women on corporate boards by 2015.
To increase the efficiency and quality of decision making, the CUBGC (2006, 2013) recommended a board size of between 5 and 15 members, and that at least one third of directors should be independent. To help a board exercise oversight and monitoring, the CUBGC recommended regular board meetings, and the establishment of a range of board committees. Some of these had been mandated previously by other regulatory initiatives. For example, in 2003, the Aldama Report recommended that boards establish an Executive Committee, a Nomination and Compensation Committee, and a Strategy and Investment Committee.
3Research method3.1Sample and dataThe sample analysed comprises sustainability reports of all 25 companies listed continuously on Spain's IBEX 35 share market index from 2007 to 2011. Sustainability reports are a major means of business communication to stakeholders (Rodríguez Gutiérrez, Fuentes García, & Sánchez Cañizares, 2013; Tejedo-Romero, 2016) and feature a high rate of IC reporting (Oliveira, Rodrigues, & Craig, 2010a). They contain more IC information than the annual report, due to overlap between IC information and sustainability information (especially in the economic part of the sustainability report) (Cinquini, Passetti, Tenucci, & Frey, 2012; Tejedo-Romero, 2016). Companies report IC information in sustainability reports to improve transparency, attain social legitimacy, and enhance reputation (Cinquini et al., 2012). In Spain, sustainability reports are issued voluntarily. They have been found to be better suited than annual reports for analyzing levels of voluntary disclosure of IC information (Tejedo-Romero, 2016).
During the analysis period several companies listed on IBEX 35 introduced a “combined report”: an annual report containing a clearly demarcated sustainability report. Where this occurred, we focused on information disclosed in the sustainability report section. One company presented combined reports for all five years; three companies for four years; four for two years; and none for one year. Thus, the source data relied on comprised 125 company-year observations (25 companies for 5 years). These were drawn from 100 standalone sustainability reports and 25 combined reports. All were accessed on company web sites.
Balanced panel data analysis was used to test H1, consistent with Oliveira, Rodrigues, and Craig (2010b) and Pérez-Calero and Barroso-Castro (2015). The number of time periods (t) was the same for all companies. Panel data permitted the control of unobserved individual and/or time-specific heterogeneity that was correlated with explanatory variables (Baltagi, 2014). By combining time-series and cross-sectional data, unobservable individual-specific effects (possibly correlated with other explanatory variables) were controlled too (Hausman & Taylor, 1981). The industry membership profile of the 25 sample companies was Consumer Services (2), Financial Services and Real Estate (7), Oil and Energy (6), Basic Materials, Industry and Construction (7), Consumer Goods (1), and Technology and Telecommunications (2). There were five observations per company, making 125 in total.
3.2Measurement of variablesTo explore which IC information is disclosed voluntarily, the chosen dependent variable was an IC disclosure index (ICI). This was constructed using content analysis (Rodríguez Gutiérrez et al., 2013; Tejedo-Romero, 2016). Disclosure indexes calculate “the number of information-related items that a given report contains based on a pre-defined list of the possible items” (Bukh, Nielsen, Gormsen, & Mouritsen, 2005, p. 719). The items comprising the ICI were chosen cautiously, influenced by the studies of Bukh et al. (2005), Oliveira et al. (2010a), and Tejedo-Romero (2016).
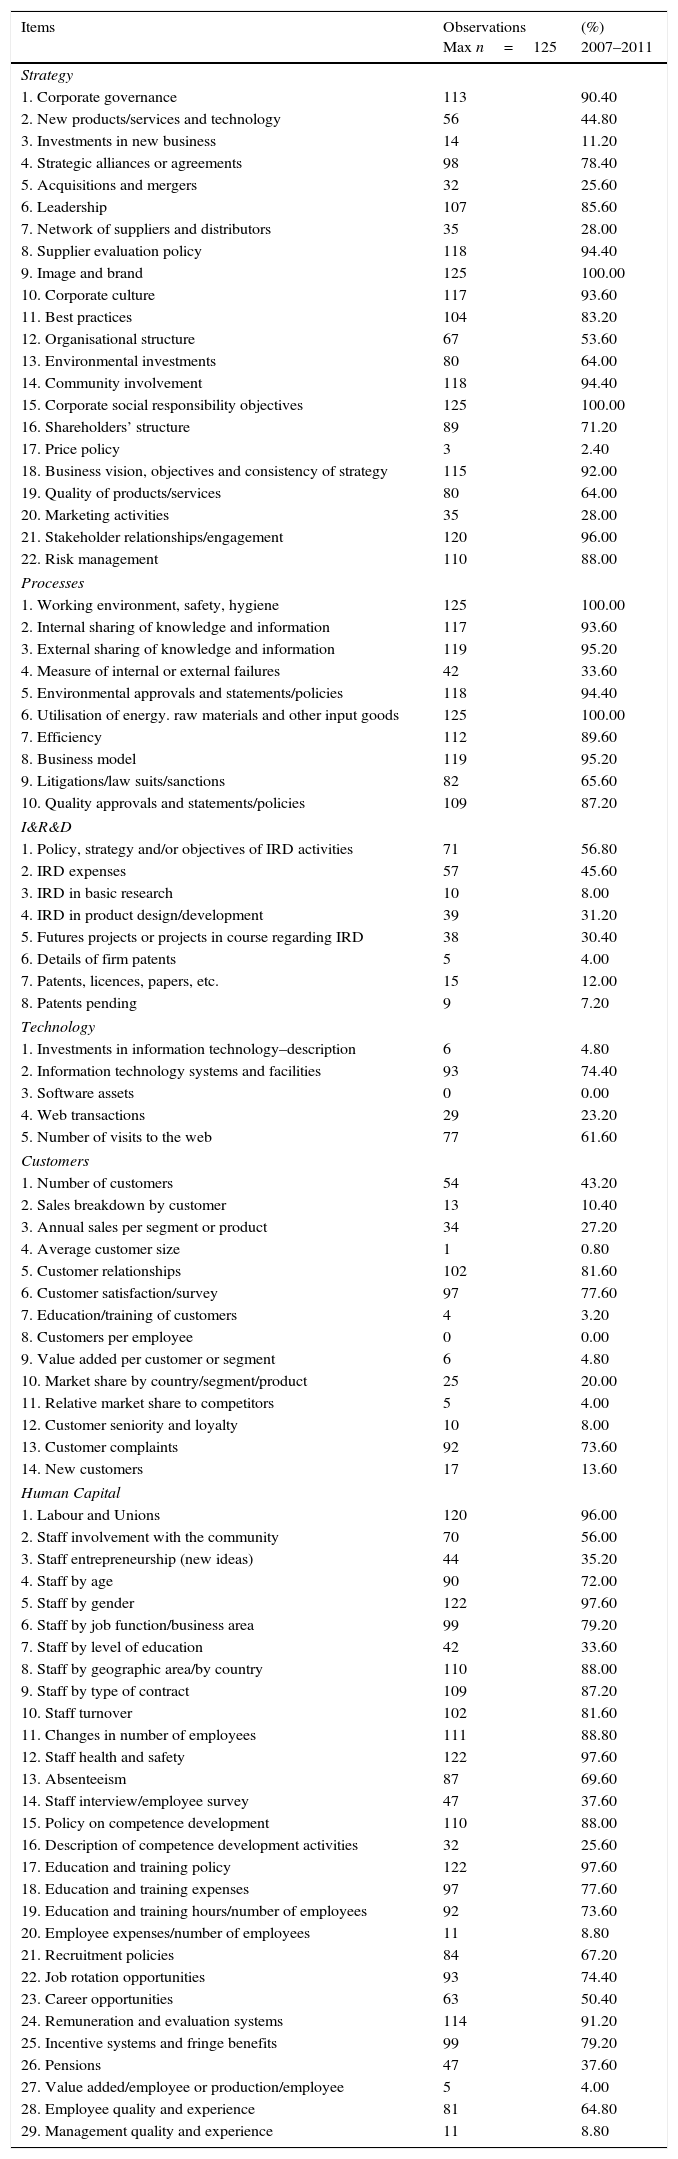
Five randomly chosen reports were pilot tested to modify the initially constructed index so that it better reflected the diverse nature of IC items companies could disclose. The final list shown in Table 1 includes 88 IC items (Strategy 22; Processes 10; Innovation, Research and Development 8; Technology 5; Customers 14; Human Capital 29). Manual coding was used because software-assisted searches for words, sentences, or portions of pages, are insufficiently robust to capture the nature of IC disclosures (Beattie & Thomson, 2007).
Intellectual capital items disclosed by firms.
| Items | Observations Max n=125 | (%) 2007–2011 |
|---|---|---|
| Strategy | ||
| 1. Corporate governance | 113 | 90.40 |
| 2. New products/services and technology | 56 | 44.80 |
| 3. Investments in new business | 14 | 11.20 |
| 4. Strategic alliances or agreements | 98 | 78.40 |
| 5. Acquisitions and mergers | 32 | 25.60 |
| 6. Leadership | 107 | 85.60 |
| 7. Network of suppliers and distributors | 35 | 28.00 |
| 8. Supplier evaluation policy | 118 | 94.40 |
| 9. Image and brand | 125 | 100.00 |
| 10. Corporate culture | 117 | 93.60 |
| 11. Best practices | 104 | 83.20 |
| 12. Organisational structure | 67 | 53.60 |
| 13. Environmental investments | 80 | 64.00 |
| 14. Community involvement | 118 | 94.40 |
| 15. Corporate social responsibility objectives | 125 | 100.00 |
| 16. Shareholders’ structure | 89 | 71.20 |
| 17. Price policy | 3 | 2.40 |
| 18. Business vision, objectives and consistency of strategy | 115 | 92.00 |
| 19. Quality of products/services | 80 | 64.00 |
| 20. Marketing activities | 35 | 28.00 |
| 21. Stakeholder relationships/engagement | 120 | 96.00 |
| 22. Risk management | 110 | 88.00 |
| Processes | ||
| 1. Working environment, safety, hygiene | 125 | 100.00 |
| 2. Internal sharing of knowledge and information | 117 | 93.60 |
| 3. External sharing of knowledge and information | 119 | 95.20 |
| 4. Measure of internal or external failures | 42 | 33.60 |
| 5. Environmental approvals and statements/policies | 118 | 94.40 |
| 6. Utilisation of energy. raw materials and other input goods | 125 | 100.00 |
| 7. Efficiency | 112 | 89.60 |
| 8. Business model | 119 | 95.20 |
| 9. Litigations/law suits/sanctions | 82 | 65.60 |
| 10. Quality approvals and statements/policies | 109 | 87.20 |
| I&R&D | ||
| 1. Policy, strategy and/or objectives of IRD activities | 71 | 56.80 |
| 2. IRD expenses | 57 | 45.60 |
| 3. IRD in basic research | 10 | 8.00 |
| 4. IRD in product design/development | 39 | 31.20 |
| 5. Futures projects or projects in course regarding IRD | 38 | 30.40 |
| 6. Details of firm patents | 5 | 4.00 |
| 7. Patents, licences, papers, etc. | 15 | 12.00 |
| 8. Patents pending | 9 | 7.20 |
| Technology | ||
| 1. Investments in information technology–description | 6 | 4.80 |
| 2. Information technology systems and facilities | 93 | 74.40 |
| 3. Software assets | 0 | 0.00 |
| 4. Web transactions | 29 | 23.20 |
| 5. Number of visits to the web | 77 | 61.60 |
| Customers | ||
| 1. Number of customers | 54 | 43.20 |
| 2. Sales breakdown by customer | 13 | 10.40 |
| 3. Annual sales per segment or product | 34 | 27.20 |
| 4. Average customer size | 1 | 0.80 |
| 5. Customer relationships | 102 | 81.60 |
| 6. Customer satisfaction/survey | 97 | 77.60 |
| 7. Education/training of customers | 4 | 3.20 |
| 8. Customers per employee | 0 | 0.00 |
| 9. Value added per customer or segment | 6 | 4.80 |
| 10. Market share by country/segment/product | 25 | 20.00 |
| 11. Relative market share to competitors | 5 | 4.00 |
| 12. Customer seniority and loyalty | 10 | 8.00 |
| 13. Customer complaints | 92 | 73.60 |
| 14. New customers | 17 | 13.60 |
| Human Capital | ||
| 1. Labour and Unions | 120 | 96.00 |
| 2. Staff involvement with the community | 70 | 56.00 |
| 3. Staff entrepreneurship (new ideas) | 44 | 35.20 |
| 4. Staff by age | 90 | 72.00 |
| 5. Staff by gender | 122 | 97.60 |
| 6. Staff by job function/business area | 99 | 79.20 |
| 7. Staff by level of education | 42 | 33.60 |
| 8. Staff by geographic area/by country | 110 | 88.00 |
| 9. Staff by type of contract | 109 | 87.20 |
| 10. Staff turnover | 102 | 81.60 |
| 11. Changes in number of employees | 111 | 88.80 |
| 12. Staff health and safety | 122 | 97.60 |
| 13. Absenteeism | 87 | 69.60 |
| 14. Staff interview/employee survey | 47 | 37.60 |
| 15. Policy on competence development | 110 | 88.00 |
| 16. Description of competence development activities | 32 | 25.60 |
| 17. Education and training policy | 122 | 97.60 |
| 18. Education and training expenses | 97 | 77.60 |
| 19. Education and training hours/number of employees | 92 | 73.60 |
| 20. Employee expenses/number of employees | 11 | 8.80 |
| 21. Recruitment policies | 84 | 67.20 |
| 22. Job rotation opportunities | 93 | 74.40 |
| 23. Career opportunities | 63 | 50.40 |
| 24. Remuneration and evaluation systems | 114 | 91.20 |
| 25. Incentive systems and fringe benefits | 99 | 79.20 |
| 26. Pensions | 47 | 37.60 |
| 27. Value added/employee or production/employee | 5 | 4.00 |
| 28. Employee quality and experience | 81 | 64.80 |
| 29. Management quality and experience | 11 | 8.80 |
The total disclosure score reported is the unweighted sum of the scores of each item, consistent with Oliveira et al. (2010a) and Tejedo-Romero (2016). All items were assumed to be relevant to all firms. No particular stakeholder was the subject of special focus. All stakeholders were of interest because different stakeholders confer different levels of importance to individual information items. An assumption of equal weights for all items was viewed as likely to result in a smaller bias than from assigning subjective (and different) weights to items (Lopes & Rodrigues, 2007). Thus, the total ICI score for a company was calculated as:
where di=0 or 1, and di=0 if the disclosure item is found; di=1 if the disclosure item is not found; and m=the maximum number of items a company can disclose (88).
Content analysis of the entire sample was informed by our prior coding of an initial sample of five reports. The inter-rater reliability measure obtained (Scott's pi=0.80) is considered acceptable in analysing corporate report disclosures (Hackston & Milne, 1996).
Table 1 reveals disclosure levels for items comprising the sub-indexes. The results are consistent with analysis by Oliveira et al. (2010a) of voluntary disclosures of IC items in sustainability reports for 2006 of Portuguese firms. The major items reported in the sub-indexes were: Strategy: image and brand (100%), CSR and objective (100%), stakeholder relationships/engagement (96%); Processes: efforts related to the working environment (100%), utilisation of energy, raw materials and other input goods (100%); Innovation, research and development (I&R&D): policy strategy and/or objectives of I&R&D activities (57%); Technology: information technology systems and facilities (74%); Customers: customer relationships (82%); and Human capital: staff by gender (98%), staff health and safety (98%), education and training policy (98%).
The independent variable (gender diversity) was measured by the proportion of women directors on a board (Barako & Brown, 2008; Prado-Lorenzo & García-Sánchez, 2010). The seven control variables comprised four corporate governance variables and three company variables, explained immediately below.
3.2.1Corporate Governance variablesBoard size is defined as the number of directors on a board (Arosa et al., 2013; Pérez-Calero & Barroso-Castro, 2015). Despite claims that the monitoring capacity of boards increases with the number of directors, Lipton and Lorsh (1992) suggested limiting boards to ten members, with a preferred size of eight or nine. However, although larger boards could improve monitoring and diversity, this could be outweighed by the costs of slower decision making and less candid discussions of managerial performance (Arosa et al., 2013; Lipton & Lorsh, 1992).
Several studies have reported a quadratic relationship between board size and economic performance (e.g., López & Morrós, 2014), corporate social disclosure (Cormier, Ledoux, & Magnan, 2011); and IC disclosure (Hidalgo, García-Meca, & Martínez, 2011). Thus, there appears to be an inverted “U” relationship, with the optimal board size being the mid-point number of directors (Cerbioni & Parbonetti, 2007; Cormier et al., 2011; Hidalgo et al., 2011; Prado-Lorenzo & García-Sánchez, 2010). To control for potential diminishing marginal effects on IC disclosure after the optimal board size is passed, the square of the “board size” variable was considered also.
Board activity is represented by the number of board meetings during a financial year (Arosa et al., 2013). There are explanations for, and against, the existence of a positive relationship between the frequency of meetings and efficiency. Boards whose meetings are more frequent have been found to monitor management more effectively and to be more diligent (Lipton & Lorsh, 1992). Thus, a company with an active board is likely to increase levels of disclosure to publicise work undertaken. On the other hand, given that the CEO is charged with setting the agenda of board meetings, and that routine tasks compose a large proportion of the board's time, more meetings do not necessarily imply better monitoring (Andres, Azofra, & Lopez, 2005, p. 200). There appears to be an inverted “U” relationship, with optimal board activity identified in terms of a midpoint number of meetings. To control for potential diminishing marginal effects on IC disclosure after the optimal level of board activity is passed, the square of the “board activity” variable was considered also.
Independent directors represents the percentage of independent directors on a board (Arosa et al., 2013; Hidalgo et al., 2011; Pérez-Calero & Barroso-Castro, 2015). Some previous studies have concluded that as the percentage of independent directors increases, so too does the level of voluntary disclosure (Cerbioni & Parbonetti, 2007). Nevertheless, the presence of more independent directors can substitute for the need to disclose more information. Indeed, an increase of independent directors was found to reduce voluntary disclosure in Singaporean firms (Eng & Mak, 2003).
Ownership concentration is the proportion of ordinary shares owned by substantial shareholders (those holding equity of 5% or more) (Hidalgo et al., 2011). This is a relevant variable because the business context of listed Spanish companies is characterised by high levels of ownership concentration. Many prior studies have reported an inverse relationship between ownership concentration and voluntary disclosure (Firer & Williams, 2005).
3.2.2Company characteristic variablesCompany size is the number of employees of a company (Bukh et al., 2005). Many studies have found that firm size has a positive effect on levels of disclosure (Lopes & Rodrigues, 2007; Oliveira, Rodrigues, & Craig, 2006).
Industry is represented by a dummy variable with a value of 1 if a company is in a sensitive industry, and 0 otherwise. Sensitive industries were regarded to be “Financial Services and Real Estate”; “Oil and Energy”; and “Technology and Telecommunications” (Sierra-García, García-Benau, & Zorio, 2014). All other industries classified by the CNMV were considered non-sensitive (“Basic Materials”, “Industry and Construction”; and “Consumer Goods”). More voluntary information about IC was expected to be disclosed by firms in sensitive industries (Kolk & Perego, 2010).
Listing on a sustainability index was represented by a dummy variable with a value of 1 if the company is included in at least one major sustainability index (e.g., Dow Jones Sustainability Index [DJSI] or FTSE4Good), and 0 otherwise (Prado-Lorenzo, Rodríguez-Domínguez, Gallego-Álvarez, & García-Sánchez, 2009). The DJSI, launched in 1999, tracks the financial performance of leading sustainability-driven companies worldwide. It includes companies that “follow a best-in-class approach, including companies across all industries that outperform their peers in numerous sustainability metrics.” This variable was included as a proxy for reputation: if a company belonged to these indices, it was considered “best-in-class” (Michelon & Parbonetti, 2012).
4Results4.1Descriptive statistics and univariate analysisDescriptive statistics for the observed disclosure levels of the main ICI index and the six sub-indexes are available on request to the lead author. Disclosure of the 88 ICI items ranged from 25% to 74%. On average, each company disclosed information about 56% of the 88 disclosure items, with a standard deviation of 10%. In the sub-indexes, there was a substantial range of disclosure. The highest average level was for Processes (85%) and the lowest average level was for I&R&D (24%). Descriptive statistics for the independent and control variables for the 125 company-year observations are available on request to the lead author. On average, women comprised 9.7% of board members. There was an increase from 6.9% in 2007 to 12.4% in 2011. The progress in increasing the proportion of women on boards was slow when juxtaposed against the Spanish government's target of 40% by 2015 (Equality Law of 2007, articles 60 and 75).
Board size ranged from 8 to 24, with a mean of 15. This is much greater than the ideal size of 8 or 9 suggested by Lipton and Lorsh (1992). It is at the upper range recommended by the CUBGC (2006, 2013). On average, boards met 11 times per year; 42% of directors were independent; and approximately one third of shareholders had equity of 5% or more. Sixty per cent of company-year observations were in sensitive industries. Companies listed on sustainability indices comprised 87% of observations.
4.2ModelsThe ICI score is a linear combination of explanatory variables, including gender diversity (Gender) and a vector of control variables (Z). Mathematically, the principal model is expressed as:
where α is a scalar; β1 and β2 are the estimable parameter vectors; i=1, …, 25; t=2007, …., 2011; μi represents the unobservable company-specific effect; δt represents the unobservable specific time effect (common to all companies); ¿it is the remainder stochastic disturbance term, and νit=μi+δt+εit.
The following models were explored:
Model 1:

Model 2:

Model 3:

We used panel data to estimate Eqs. (2)–(4). There were two different approaches for each model. The first estimated static panel data regression models of ICI as a function of gender diversity, including various controls. The four estimator panels considered were: Pooled Ordinary Least Squares (POLS), Fixed Effects (FE), Random Effects (RE), and Generalised Method of Moments (GMM). The POLS estimator assumes that all μi and δt are equal. By allowing μi and δt to differ, but assuming they are fixed numbers, the FE panel was generated. The RE panel assumes that unobserved effects are random variables. The GMM is an instrumental-variable (IV) method based on the fact that fixed and random effects models do not use all the information available in a given sample (Pérez-Calero & Barroso-Castro, 2015). Second, we also tested for dynamic effects in each model. Dynamic panel data estimation addresses the impact of past ICI on the present through the inclusion of a lagged dependent variable. A dynamic approach such as this seems likely to be particularly relevant for the relationship between ICI and gender diversity. This approach leads to a dynamic specification for ICIit, as:

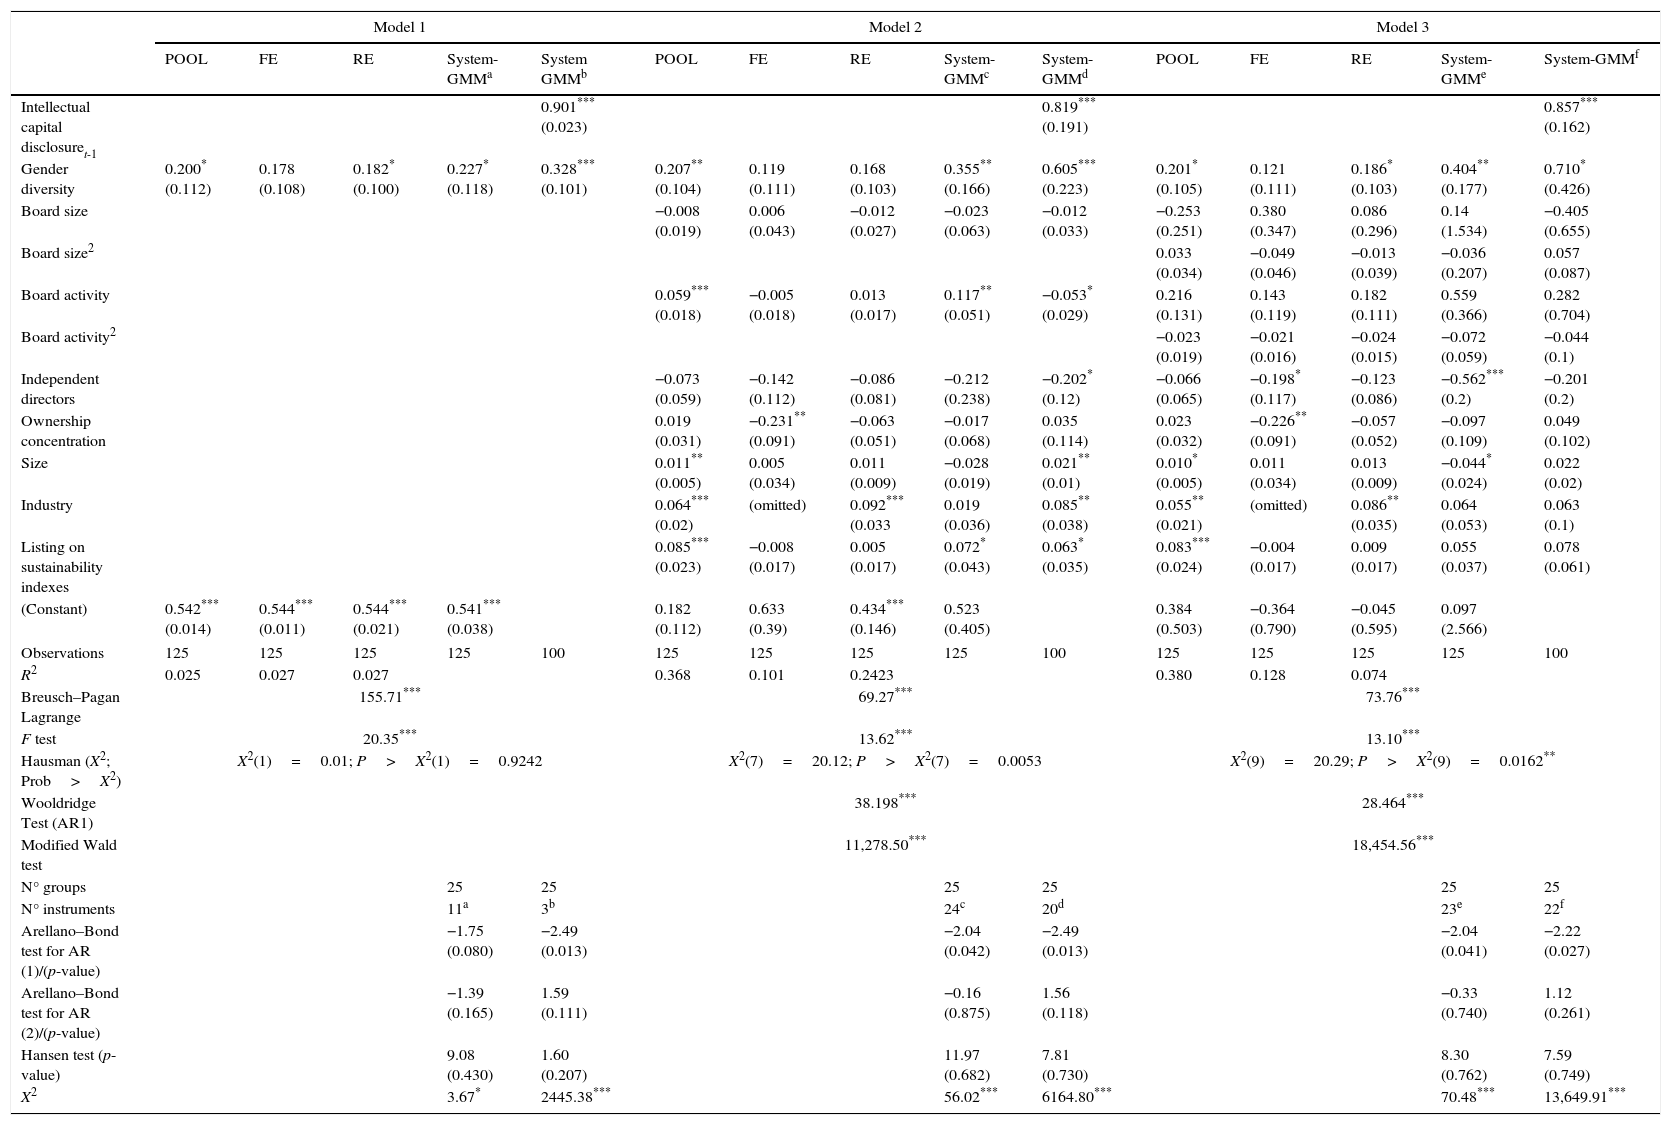
Table 2 presents panel data regressions for the three models. In the static approach, columns 2–5 are for Model 1, columns 7–10 are for Model 2, columns 12–15 are for Model 3. To determine whether the correct estimator was used, we applied the Breusch–Pagan Lagrange Multiplier [LM] Test, the F-test for FE, and the Hausman Specification test (Wooldridge, 2002). The Breusch–Pagan LM Test (p-value=0.00) confirmed that the RE model was more appropriate than the pooled OLS model. The F-test showed that the FE model was more appropriate than the POLS model (p-value=0.00). To identify the most appropriate model (FE or RE), we applied the Hausman test. The RE model was the most suitable for Model 1 (X12=0.01,P>X12=0.9242). The FE model was more appropriate for Models 2 and 3 (X72=20.12, P>X92=0.0053; and X92=20.29, P>X92=0.0162, respectively).
Panel-regression models.
| Model 1 | Model 2 | Model 3 | |||||||||||||
|---|---|---|---|---|---|---|---|---|---|---|---|---|---|---|---|
| POOL | FE | RE | System-GMMa | System GMMb | POOL | FE | RE | System-GMMc | System-GMMd | POOL | FE | RE | System-GMMe | System-GMMf | |
| Intellectual capital disclosuret-1 | 0.901*** (0.023) | 0.819*** (0.191) | 0.857*** (0.162) | ||||||||||||
| Gender diversity | 0.200* (0.112) | 0.178 (0.108) | 0.182* (0.100) | 0.227* (0.118) | 0.328*** (0.101) | 0.207** (0.104) | 0.119 (0.111) | 0.168 (0.103) | 0.355** (0.166) | 0.605*** (0.223) | 0.201* (0.105) | 0.121 (0.111) | 0.186* (0.103) | 0.404** (0.177) | 0.710* (0.426) |
| Board size | −0.008 (0.019) | 0.006 (0.043) | −0.012 (0.027) | −0.023 (0.063) | −0.012 (0.033) | −0.253 (0.251) | 0.380 (0.347) | 0.086 (0.296) | 0.14 (1.534) | −0.405 (0.655) | |||||
| Board size2 | 0.033 (0.034) | −0.049 (0.046) | −0.013 (0.039) | −0.036 (0.207) | 0.057 (0.087) | ||||||||||
| Board activity | 0.059*** (0.018) | −0.005 (0.018) | 0.013 (0.017) | 0.117** (0.051) | −0.053* (0.029) | 0.216 (0.131) | 0.143 (0.119) | 0.182 (0.111) | 0.559 (0.366) | 0.282 (0.704) | |||||
| Board activity2 | −0.023 (0.019) | −0.021 (0.016) | −0.024 (0.015) | −0.072 (0.059) | −0.044 (0.1) | ||||||||||
| Independent directors | −0.073 (0.059) | −0.142 (0.112) | −0.086 (0.081) | −0.212 (0.238) | −0.202* (0.12) | −0.066 (0.065) | −0.198* (0.117) | −0.123 (0.086) | −0.562*** (0.2) | −0.201 (0.2) | |||||
| Ownership concentration | 0.019 (0.031) | −0.231** (0.091) | −0.063 (0.051) | −0.017 (0.068) | 0.035 (0.114) | 0.023 (0.032) | −0.226** (0.091) | −0.057 (0.052) | −0.097 (0.109) | 0.049 (0.102) | |||||
| Size | 0.011** (0.005) | 0.005 (0.034) | 0.011 (0.009) | −0.028 (0.019) | 0.021** (0.01) | 0.010* (0.005) | 0.011 (0.034) | 0.013 (0.009) | −0.044* (0.024) | 0.022 (0.02) | |||||
| Industry | 0.064*** (0.02) | (omitted) | 0.092*** (0.033 | 0.019 (0.036) | 0.085** (0.038) | 0.055** (0.021) | (omitted) | 0.086** (0.035) | 0.064 (0.053) | 0.063 (0.1) | |||||
| Listing on sustainability indexes | 0.085*** (0.023) | −0.008 (0.017) | 0.005 (0.017) | 0.072* (0.043) | 0.063* (0.035) | 0.083*** (0.024) | −0.004 (0.017) | 0.009 (0.017) | 0.055 (0.037) | 0.078 (0.061) | |||||
| (Constant) | 0.542*** (0.014) | 0.544*** (0.011) | 0.544*** (0.021) | 0.541*** (0.038) | 0.182 (0.112) | 0.633 (0.39) | 0.434*** (0.146) | 0.523 (0.405) | 0.384 (0.503) | −0.364 (0.790) | −0.045 (0.595) | 0.097 (2.566) | |||
| Observations | 125 | 125 | 125 | 125 | 100 | 125 | 125 | 125 | 125 | 100 | 125 | 125 | 125 | 125 | 100 |
| R2 | 0.025 | 0.027 | 0.027 | 0.368 | 0.101 | 0.2423 | 0.380 | 0.128 | 0.074 | ||||||
| Breusch–Pagan Lagrange | 155.71*** | 69.27*** | 73.76*** | ||||||||||||
| F test | 20.35*** | 13.62*** | 13.10*** | ||||||||||||
| Hausman (X2; Prob>X2) | X2(1)=0.01; P>X2(1)=0.9242 | X2(7)=20.12; P>X2(7)=0.0053 | X2(9)=20.29; P>X2(9)=0.0162** | ||||||||||||
| Wooldridge Test (AR1) | 38.198*** | 28.464*** | |||||||||||||
| Modified Wald test | 11,278.50*** | 18,454.56*** | |||||||||||||
| N° groups | 25 | 25 | 25 | 25 | 25 | 25 | |||||||||
| N° instruments | 11a | 3b | 24c | 20d | 23e | 22f | |||||||||
| Arellano–Bond test for AR (1)/(p-value) | −1.75 (0.080) | −2.49 (0.013) | −2.04 (0.042) | −2.49 (0.013) | −2.04 (0.041) | −2.22 (0.027) | |||||||||
| Arellano–Bond test for AR (2)/(p-value) | −1.39 (0.165) | 1.59 (0.111) | −0.16 (0.875) | 1.56 (0.118) | −0.33 (0.740) | 1.12 (0.261) | |||||||||
| Hansen test (p-value) | 9.08 (0.430) | 1.60 (0.207) | 11.97 (0.682) | 7.81 (0.730) | 8.30 (0.762) | 7.59 (0.749) | |||||||||
| X2 | 3.67* | 2445.38*** | 56.02*** | 6164.80*** | 70.48*** | 13,649.91*** | |||||||||
Standard errors are in parentheses. The square root transformation is used for board size & board activity variables. Logarithm transformation is used for size variable.
1% significance.
Instruments for first differences equations and levels equation (respectively) are:
D.(year, sector, ownership concentration & gender variables), L(1/.) listing on sustainability indexes; and listing on sustainability indexes, DL2 ownership concentration, D.gender, D.L.intellectual capital, DL(2/.) size, D.independent directors variables; and year, sector, ownership concentration, gender, DL(1/2) board size, DL(1/.) (independent directors & size) variables.
L2.board size, L(1/.) gender, L(1/.) L.intellectual capital, L.independent directors, L(2/.) board activity variables; and listing on sustainability indexes, sensible sector, DL2 ownership concentration, D.gender, D.L.intellectual capital, DL(2/.) size, D.independent directors variables.
Instruments for first differences equation: D.(year, sector, ownership concentration & gender), L.size & L(1/.) listing on sustainability indexes variables; and year, sector, ownership concentration, gender, D.size, DL(1/2).board size & DL(1/.) independent directors variables.
Instruments for first differences equation: D.(board size2 & board activity2), L2.board size, L(1/.) gender, L(1/.) L.intellectual capital, L.independent directors & L(2/.) board activity variables; and listing on sustainability indexes, sensible sector, DL2.ownership concentration, D.gender, D.L.intellectual capital, DL(2/.).size & D.independent director variables.
The appropriateness of the FE model was investigated further by testing for autocorrelation, heteroskedasticity, and contemporaneous correlation. This detected heteroskedasticity in the models (X252=11278.50, p=0.0000; X252=18454.56, p-value=0.0000, respectively), thereby supporting use of the GMM method.
Therefore, we used a static panel estimation, known as System GMM2 (Arellano & Bover, 1995). This approach is based on a system of two simultaneous equations, one in first differences, and the other in levels. To address potential endogeneity in the regressors, lagged first differences are used as instruments in the level equations, and lagged levels are used as instruments in the first difference equations (see Table 2). In addition to lagged levels and differences, the list of instruments can include other strictly exogenous regressors. For instance, to further improve our estimation, we include additional instrumental variables to complement the instruments generated by the GMM procedure. So, we included dummy variables for each year and industry, according to the stock market industry classification published by the CNMV. We estimated robust standard errors using the two-step version of the system GMM estimator with a finite-sample correction3 (Windmeijer, 2005). The tests conducted confirmed the validity of instruments and the correct specification of the model.
In Model 1, the lagged values of the dependent variable (ICI) were significant (1% level): that is, the amount of information disclosed on IC depends on the amount that has been provided in previous years. In addition, a higher percentage of women on boards of directors (H1) exerts a positive influence on the level of IC disclosure (1% level). When controls were introduced for the other corporate governance and company characteristics variables (Model 2), gender and the lagged dependent variable were significant (1% level). Additionally, for Model 2, there was a negative relationship (10% level) between board activity and IC disclosure. That is, fewer meetings of boards are more efficient in delivering a greater amount of IC information.
We confirm the previous results for Model 3, although the gender variable is only significant at 10%. We could not confirm the quadratic relationship between board size and IC disclosure; and between board activity and IC disclosure. Thus, when more women are on the board of Spanish listed companies, ICI increased, validating our general hypothesis, H1.
The variable “external independent directors” is related negatively to ICI (5% level), consistent with Eng and Mak (2003). This suggests a substitution effect: the appointment of more independent directors results in a lower level of voluntary disclosure. We also found that sensitive industries and larger companies have a higher level of disclosure of IC information (5% level). The “listing in sustainability indexes” also has a positive and significant impact (10% level) on ICI. The control variables of board size and ownership concentration are not significant.
5ConclusionsThis study contributes to the corpus of empirical evidence on whether increased representation of women on boards of directors leads to favourable outcomes for stakeholders and improves board effectiveness. The findings aid understanding of how gender diversity increases voluntary disclosures (in this case, of IC information) in listed companies. The results are consistent with a view that increased representation of women on boards will improve board oversight, enhance transparency, and reduce information asymmetry in respect of IC information. The results partially vindicate public policy in Spain (and other countries) which impose(s) quotas on the representation of women on company boards.
The finding of a statistically significant association between the representation of women on company boards and levels of IC disclosures should reinforce global initiatives to revise corporate governance regulations by promoting gender diversity. The findings suggest that women directors improve board monitoring and that this leads to improved transparency and increased IC disclosure. The findings can be explained using a resources-based perspective: women bring new skills and resources (different personal-social attributes and gender-related values) to boards and seem likely to be effective in prompting increased IC disclosure (Eckes & Trautner, 2000).
The Spanish Equality Law of 2007 appears to have had a complementary corporate governance effect by reducing information asymmetry and improving the comprehensiveness and quality of corporate reporting of IC information. Such an outcome should be contrasted with the negative outcome on levels of IC disclosure that are associated with the inclusion of more external independent directors on boards. The latter has had a substitutive governance effect by leading to less information being disclosed about IC. Thus, regulators should promote the increase of gender diversification on boards and should place less emphasis on the need to increase the number of independent directors.
Board size and ownership concentration are not significant variables in explaining IC disclosure in Spain. Nor is there a quadratic relationship (inverse U) between board size and IC disclosure; or number of board meetings and IC disclosure. Board activity seems to decrease IC disclosure (10% level). Additionally, there is higher disclosure of IC information in sensitive industries and larger companies (5% level), and listed companies in sustainability indexes (10% level). Thus, we confirm results reported by Oliveira et al. (2006) and Michelon and Parbonetti (2012).
This paper adds new evidence of the relationship between levels of female representation on a company board and levels of IC disclosure. Those seeking better oversight and monitoring of companies should support initiatives to increase the representation of women on boards. The findings are consistent with resource-based perspectives because they point to the skills, personal attributes and gender-related values women directors bring to companies, improving disclosure and transparency.
The findings should be assessed mindful of the small sample analysed. This was inevitable because the Spanish benchmark stock market index of the Bolsa de Madrid (IBEX 35) is small. Further research using different samples, or the same type of sample for post-2011 outcomes, or drawn from similar and dissimilar cultural and environmental contexts, would help verify the positive effect women directors have on levels of voluntary disclosure of IC information.
This work was supported financially by the research unit on Governance, Competitiveness and Public Policy (project POCI-01-0145-FEDER-006939), through funds provided by COMPETE2020 - Programa Operacional Competitividade e Internacionalização (POCI); and Fundação para a Ciência e a Tecnologia.
For further review of the global response to demands to increase female board participation, including discussion of the benefits of female representation, see Ben-Amar, Chang, and McIlkenny (2017).
- Direct and moderating effects of COVID-19 on cultural tourist satisfaction
- Destination recovery during COVID-19 in an emerging economy: Insights from Perú
- The impact of the COVID-19 crisis on consumer purchasing motivation and behavior
- Covid-19 vaccines: A model of acceptance behavior in the healthcare sector
recomendados

www.publicationethics.org.