


The present paper studies the mean–variance efficiency of the sustainable investment (SI) practice in Mexico by proving the existence of a statistical equality in the performance levels of the IPC sustainability (IPCS) index against the broad market IPCcomp one. Using daily standard deviation and Sharpe ratio levels from November 2008 to August 2013, along with variance ratio and a one-factor CAPM spanning tests, our results showed that the SI strategy in Mexico is as mean–variance efficient as the broad market one, being a good substitute of the latter in the long term. Our results also refuted the assumption of a loss of mean–variance efficiency in the sustainable subset due to a lower diversification.
Sustainable investment (also known as socially responsible investment) is a tried and true activity that comes from religious practices such as the ones followed by Muslim, Jewish and Puritan groups who apply religious and ethical codes for doing business and investing. In the 1960s, the US financial industry formally adopted this investment strategy in the climate of political, social, and anti-war movements. Since then, several statements about the appropriateness of sustainable investment (SI) have arisen, such as “sustainable investment is more profitable than common (broad market) one” (Mexican Stock Exchange, 2013, pp. 18–24). From another perspective, several Modern Portfolio Theory (MPT) questions have been presented, such as the ones related to the mean–variance efficiency of the sustainable portfolio subset against a broader market investment universe.
In the case of Mexico, SI is a recent practice and started formally in 2008 when the Mexican Stock Exchange launched the sustainable IPC index (or IPCS) with stock members from the broad market IPCcomp index. This was done by following a positive sustainability screening process that is similar to the ones followed in prestigious and widely used indexes such as the Domini 400 Social Index, the Dow Jones Sustainability Index, or the FTSE4good. In the particular case of the Mexican index, the social screening process is executed with the economic, environmental and social pillars (Mexican Stock Exchange, 2006). These screenings are performed by Anahuac University and Ecovalores, a Mexican firm associated with EIRIS. By following a confidential contract with the Mexican Stock Exchange, these two rating firms evaluate all the IPCcomp members by using a similar scale and indicators of the KLD sustainability index1 that are based and also consistent with the aforementioned three pillars of sustainability ratified by the United Nations. These indicators are also consistent with the ISO/1400 standard and with the OCDE and World Bank recommendations for corporate governance. The joint rating for each of the sustainable stocks is determined in a weighted manner.2 By receiving a separate report from these two firms (Anahuac university and Ecovalores), the Mexican Stock Exchange determines, from the universe of the IPCcomp, the 30 stocks that have the highest sustainability score and, therefore, will be members of the IPCS. This task is done each February.3 With this, the IPCS is a small, mid and large-cap sustainability index that has at most 30 members, setting aside the potential benefit of investing in a wider sustainable portfolio of more than 30 stocks.4
As will be mentioned in the literature review, almost all the sustainable investment research has focused on the mean–variance efficiency property of either sustainable mutual funds or sustainable equity indices. To our knowledge there are no previous studies about SI in Mexico, being the present a first test in the Mexican Stock Exchange by comparing the performance of the IPC sustainability index (henceforth IPCS) against the broad market IPCcomp index.
Due to diversification issues that are the corner stone of MPT's theoretical assumptions, it is not theoretically acceptable for a subset (portfolio) to be as mean–variance efficient as either the broader market portfolio (index) or a larger set. Despite this, as Roll (1977) or Amenc, Goltz, Lodh, and Martellini (2012) stated, not all the assumptions of MPT (as the market portfolio efficiency) prove out in real life. For this reason two portfolios with different but similar cardinalities could lead to similar efficiency results even if they are not as efficient as the portfolios that belong to the efficient set (frontier).
Examples of previous research that perform this sort of test are Statman (2006) and Schröder (2007) where the conclusions show that the sustainable investment is as mean–variance efficient as the broad market one. Following this finding and noting that, to our knowledge, there are no studies applied to the sustainable investment in Mexico, the present paper tests the next hypothesis: “The IPC sustainability index is as mean–variance efficient as the IPC or the IPCcomp indexes”.
Once the aim and potential results in the paper have been stated, we present the results about the Mexican sustainable investment in four parts with the next sequence: In the literature review we present some of the previous papers that study the effects of sustainable investment and also search for the main mean–variance differences between the SI and the conventional one (i.e. the investment style that does not distinguish between sustainable stocks and non-sustainable ones). Following this review, in the data and methodology part, we describe how did we processed the data, which are our main sources and how did we run the hypothesis tests. Once this is done, we discuss our findings in the results and discussion part, in order to expose our main conclusions and guidelines for further research in the concluding remarks.
2Literature reviewSustainable investment (SI) has been studied in different countries. Moskowitz (1972) carried out one of the first reviews by testing SI mutual funds, suggesting that their extra returns against broad market investment funds were due to the mispricing of social responsibility. The literature review that follows is just the beginning of some of the most quoted or recent studies about sustainable investment.
Following Statman (2000) tested the Domini 400 Sustainable Index against the S&P500 and also studied the performance of SI funds against common ones. He carried out his study by using a statistic based in Modigliani and Modigliano (1997) performance measure. What he found was that even though the SI funds performed better than non-SI ones, no statistical proof existed to support this result. Boutin-Dufresne and Savaria (2004) also studied the performance of Canadian SI funds against their common counterparts. They also compared SI funds against a broad market index (S&P-TSX index), finding the same results as in Statman's study and noting that SI funds have less diversifiable risk.
With another performance measure, Schröder (2004) analyzed the performance of 56 SI funds from the US, Germany and Switzerland, along with 10 SI benchmarks by using the Jensen's alpha with data from 2000 to 2002. He tested the potential underperformance of the SI against the broad market funds and his results showed no statistical evidence to support his hypothesis.
By using the same performance measure in Carhart (1997) multi-factor model, Bauer, Koedijk, and Otten (2005) tested the German, US and UK SI funds against their respective market and SI index. With their test, they found no over performance against the broad market index and the SI benchmark, and observed that the US funds were highly concentrated in blue chip stocks whereas the UK and the German ones preferred small cap stocks. By using Carhart's multifactor model and a standard CAPM one, Scholtens (2005) also studied the performance of Dutch SRI mutual funds against the AEX market index. Like the two previous studies, he found no statistical significance in the Jensen's alpha.
In order to confirm his previous results, Schröder (2007) tested 29 SI worldwide indexes by using Huberman and Kandel (1987) one factor CAPM spanning test with the next null hypothesis H0: α=0, β=1. He also used his own version of the Fama and French (1992) model in a regression equation system solved with the Seemingly Unrelated Regression approach. With his tests, he did not find any significant alpha of the studied sustainable benchmarks against the broad market indexes and observed that even though the risk level in SI investment was higher against the broad market one, the performance was the same among them. He also concluded that, thanks to the spanning test results, the broad market indexes could not be used as a substitute of the SI ones, suggesting that both indexes should not be used indistinctly in a stock portfolio.
To study the Dow Jones Sustainability Stoxx (DJSS) index, Consolandi, Jaiswal-Dale, Poggiani, and Vercelli (2008) created a surrogate non-sustainable index with the stocks that do not belong to the DJSS and are members of the Stoxx 600 index. Their results demonstrated that sustainable investment did not lead to a higher performance against the non-sustainable one. In the same paper, the authors performed an event study to test the stock price reaction after the inclusion or exclusion of the stock in the DJSS. With this, they found an important positive impact when a stock was included in a SI index but a more significant negative one when it was excluded. In another event-driven study of 827 sustainable stocks from the US, UK, Japan, Germany and France, Capelle-Blancard and Couderc (2009) tested the inclusion and exclusion from their country's sustainable index and found that the stocks price impact was observed only in the short term, finding no influence of these sorts of events in the long term.
With a global perspective, Lee and Faff (2009) tested the DJ Global Index against the DJ sustainability index by creating leading and lagging social screening sustainability indexes and by testing two versions of the DJSI: one with the stocks that matched with similar non SI stocks, and the original index. This group of indexes was tested with a six-factor model that used the global market, book value, market cap, momentum, country, and sector indexes. The results found no positive and significant alpha with this model, suggesting that the market did not value the SI status of a company.
By studying Morningstar's sustainable fund category in the 1990–2008 period, Blanchett (2010) tested the performance of SI funds against similar non-SI ones and ran a standard (one factor) CAPM model with the Russell 1000 index. His results showed no significant over performance of the SI funds against the non-SI ones, and presented no significant alpha against the broad market benchmark.
In order to give an explanation for these results, Derwall, Koedijk, and Ter Horst (2011) suggested two theories to explain the behavior of the sustainable investor: The “shunned-stock hypothesis” that states that sustainable investors want to sacrifice return in order to follow a value-driven behavior and the “errors in expectations hypothesis” that claims that the SI shows higher returns than the conventional one because sustainability and good performance factors were not valued in the stock price. Once they gave this possible explanation they formed two portfolios, one with value-driven criteria (employee relations) and another by using a positive screening process with the KLD sustainable factors. They performed their test with data of US sustainable stocks from 1992 to 2008 and used Carhart (1997) four factor model to calculate the “abnormal” return or Jensen's alpha. They found that the abnormal return or alpha of the “errors in expectations” that used a positive screening converged to the value driven one, suggesting that the “shunned-stock hypothesis” holds in the long term and the “errors in expectations” one in the short term. Therefore, they concluded that SI investors were value-driven and not profit-seeking agents.
Following this, El Ghoul, Guedhami, Kwok, and Mishra (2011) confirmed the results of Derwall et al. by using several cost of capital models and a robust multivariate regression model with industry, country, and time control factors, along with Fama and French (1992) ones in US stocks from 1992 to 2007.
As noted in this not exhaustive literature review, almost all the studies about sustainable investment have been focused either on the performance of SI mutual funds or the SI stock indexes. Almost all the studies concurred on the absence of significant difference in the performance of SI investment against either the broad market or the “sinful” portfolios. Moreover, as noted in the introduction, no similar studies have been made on the Mexican stock market and by the fact that only a couple of sustainable mutual funds exist in Mexico, the present paper will test the mean–variance efficiency of the IPCS against the IPCcomp index in an ex post scenario. This has been done in order to determine if the SI in Mexico is equally efficient as the broad market index. Now that we have presented the theoretical background and some of the previous studies that motivate the present one, in the next section we will describe the test that will prove the hypothesis stated in the introduction: “The IPC sustainability index is as mean–variance efficient as the IPC or the IPCcomp indexes”.
3Data and methodologyIn order to prove our hypothesis, we performed three tests with daily data of the IPCS and IPCcomp indexes from November 28, 2008 to August 28, 2013. In a first test, we used a visual comparison of the performance and the daily return Δ%Ii of each index (Ii), given the next expression:
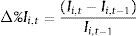
In the same test, we also performed a visual comparison of the standard deviation σ(Δ%Ii,t) in the last t−30 labor days. In a second test, these two measures were mixed in a mean–variance space by using a daily Sharpe (1966) ratio, given the next expression:
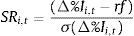
The risk free rate (rf) in this study was the daily 28 CETES rate published in the daily price vector provided by Banco de México (2013) and the value of Δ%Ii,t in (2) is determined with the return from date t to date t−30 (one month).5 The daily levels of this performance measure in each index were tested jointly with a one-way ANOVA test, using the next null hypothesis H0: “The Sharpe ratios of the IPCS and the IPCcomp are statistically equal”. If H0 holds, the Sharpe ratio levels would give a first proof of our hypothesis.
Following Schröder (2007) we ran the Huberman and Kandel (1987) spanning test in a one factor CAPM model in order to test the next null hypothesis H0: α=0, β=1. In this null hypothesis, we are using Jensen's alpha (α) and the market risk β value that are (especially Jensen's alpha) the most widely used performance metrics in the investment industry. We want to test this null hypothesis because, as Huberman and Kandel suggest, a portfolio is preferable to a benchmark by the fact that the beta value is different to one (a clear sign that the benchmark has a strong one to one influence and a high systemic risk) and there is not, as consequence, a negative or positive alpha. If the null hypothesis holds, we will show strong evidence that the broad market IPCcomp index and the IPCS have similar performance (statistically equal) and the latter can substitute the former as investment strategy benchmark. If this happens, we can give a strong argument in favor of sustainable investment by the fact that there is no loss of performance against the broad market one (sustainable and non sustainable).
Therefore, even though there are more portfolio performance measures, such as the Sortino ratio, the Treynor ratio or the Modigliani–Modigliani ratio (to name some of the most influential), we will use only the Sharpe ratio, the beta and the Jensen's alpha because we want to test the mean–variance in a straight perspective and because these are the most used performance metrics in the portfolio management practice.
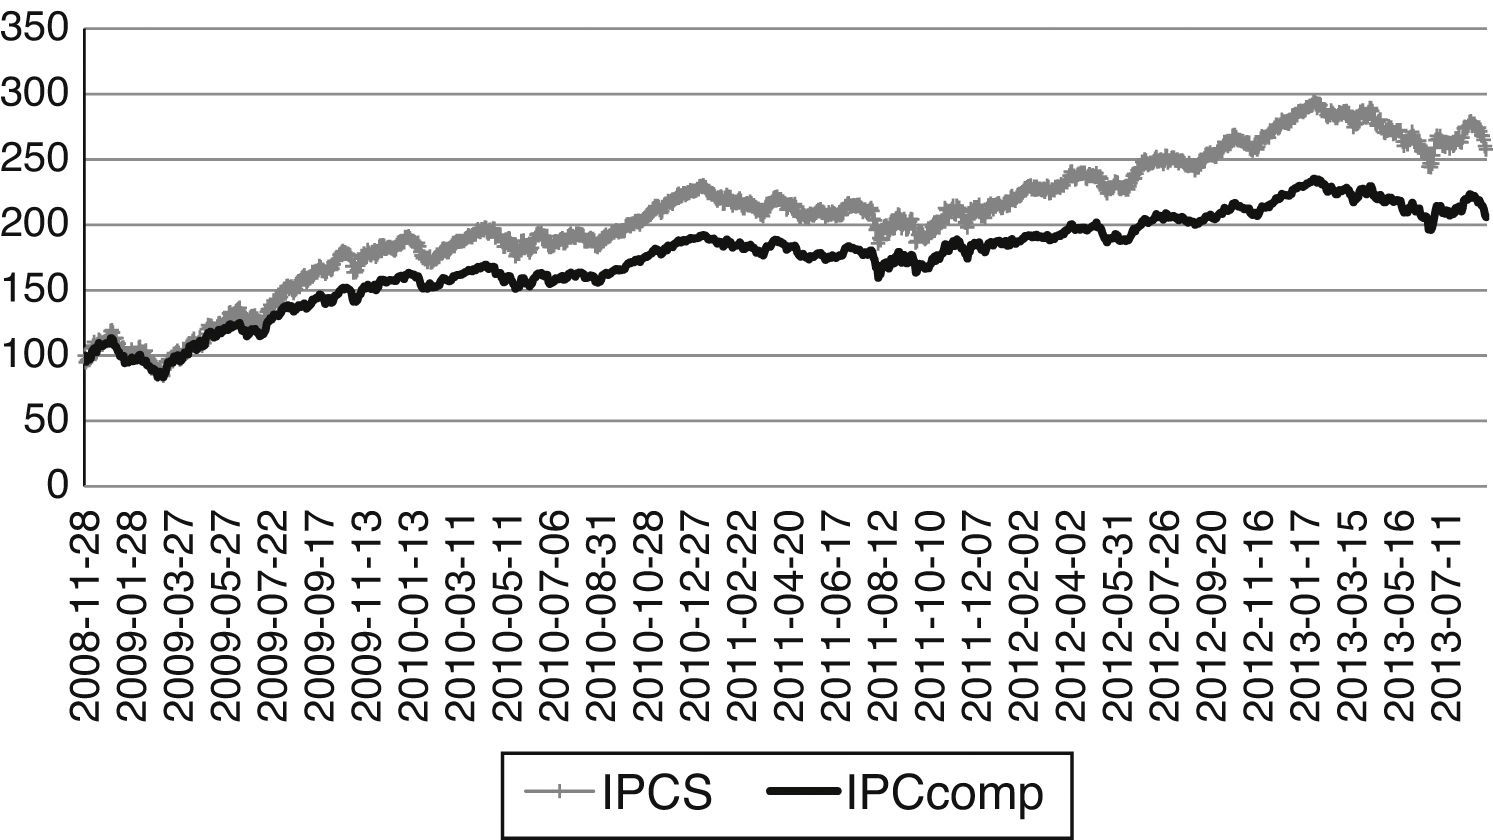
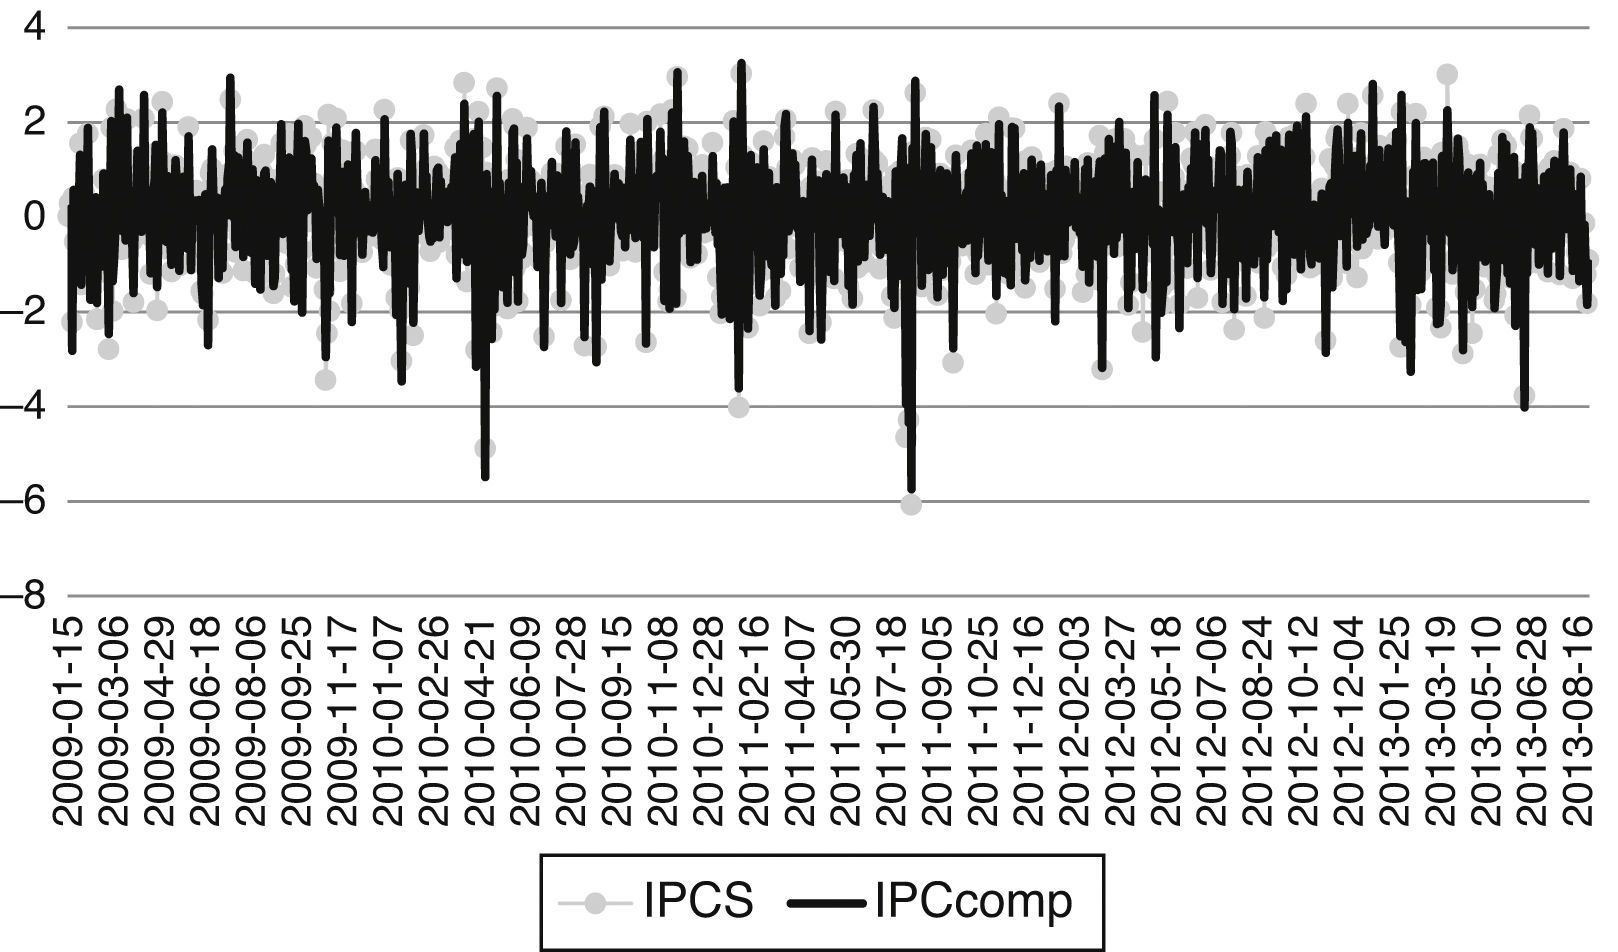
4Results and discussionIn order to discus the results that will prove the general hypothesis, it was necessary to observe the performance (ex post performance) of the two indexes in Fig. 1. As noted, the IPCS showed a better performance despite the financial and economic events in the 2008–2009 and 2010–2011 periods i.e. the financial turmoil and global recession – 2008–2009 – and the impact of credit and economic events in the Euro area and the US from 2010 to 2011.
 performance of the IPCS, IPC and IPCcomp indexes from November 28, 2008 to August 28, 2013. Source: Data from Bloomberg and the Mexican Stock Exchange.")
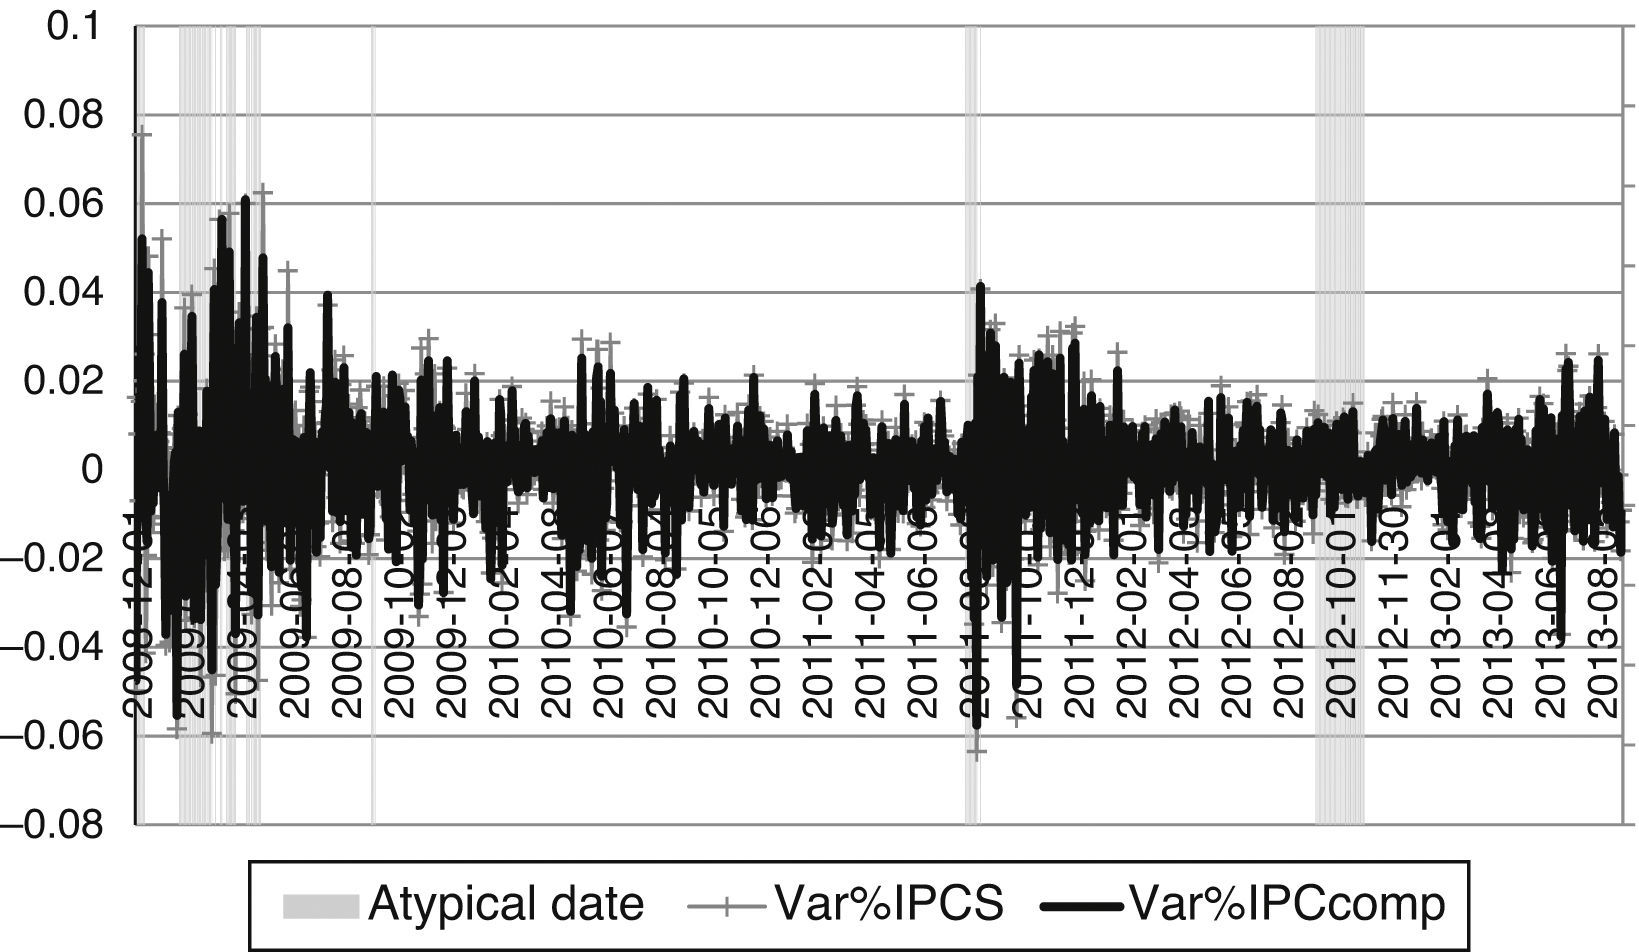
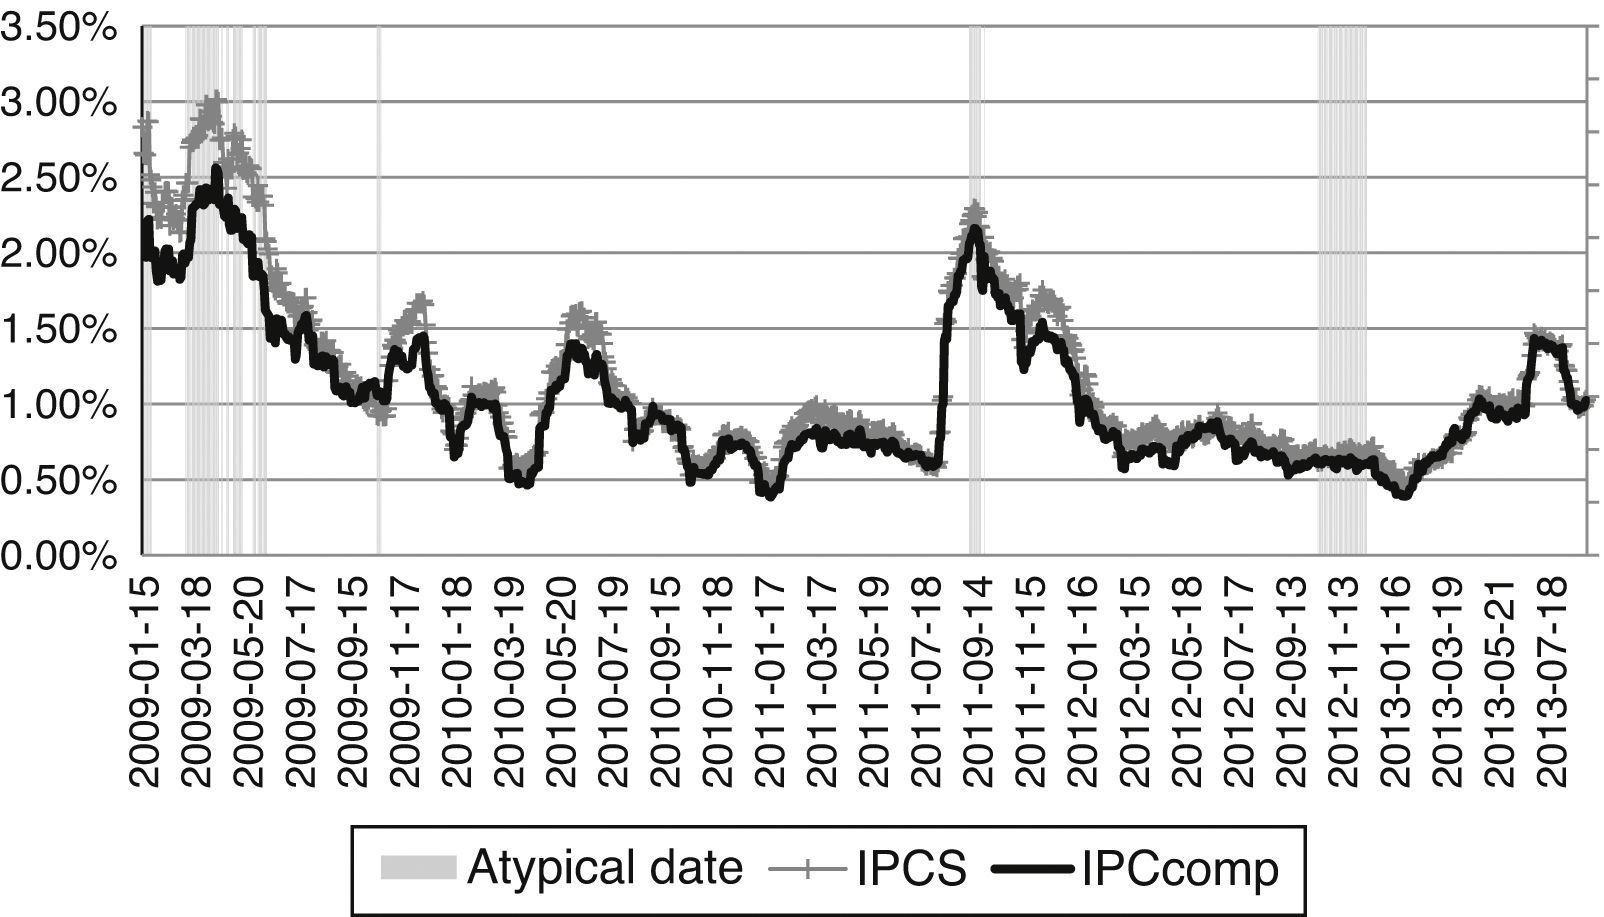
Fig. 2 presents the daily returns determined with (1) and Fig. 3 shows the historical 30-day standard deviation calculated in the context of (2). As noted in both figures, the volatility levels in both indexes were high in the atypical dates (grey areas). By observing Fig. 3, the IPCS contradicts the theoretical assumption that a subset had more risk exposure than its broad market portfolio, or that the IPCS was expected to have a higher standard deviation than the IPCcomp. Despite the fact that the nominal values of the standard deviation of the IPCS were higher in Fig. 3, only in the atypical dates,6 the risk values between both indexes were different.
. This figure shows data from November 28, 2008 to August 28, 2013. Source: Data from simulations.")
IPCS and IPCcomp's observed daily returns. This figure shows the historical daily returns of the IPCS and IPCcomp indexes, along with the atypical dates determined with (3). This figure shows data from November 28, 2008 to August 28, 2013. Source: Data from simulations.
. Source: Data from simulations.")
IPCS and IPCcomp's historical standard deviation. This figure shows the historical daily standard deviation of the IPC and IPCcomp indices from January 15, 2009 to August 8, 2013 along with the atypical dates determined with (3). Source: Data from simulations.
As methodological note, we determined the “atypical dates” by using a weighted Euclidean distance as in Chow, Jacquier, Kritzman, and Lowry (1999):
where r=[Δ%IPCSt, Δ%IPCcompt]′ was the vector of the percentage variations of the IPCS and IPCcomp at t, and m0 and C0 were, respectively, the mean vector and variance–covariance matrix of the entire time series of percentage variations of the IPCS and IPCcomp in the simulation. In order to determine which date was atypical, we used dt in a 95% upper confidence interval by assuming that dt⊲Xi2 (df=2).
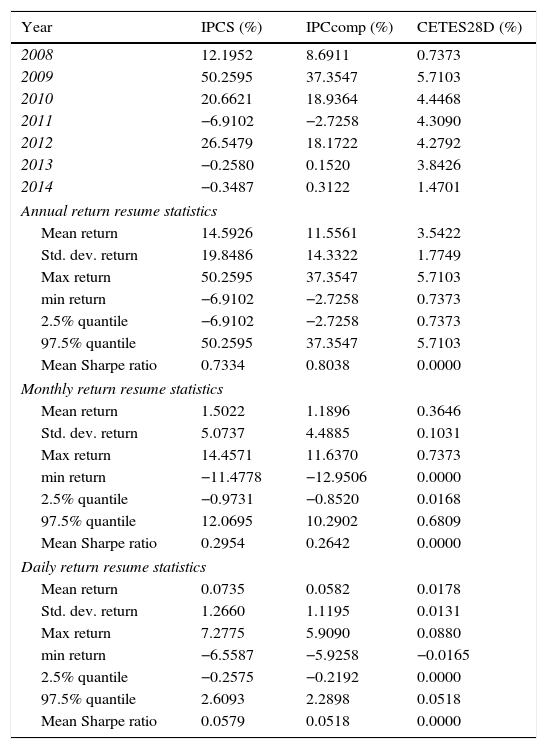
In Table 1 we present a resume of the daily percentage variations (returns) of the three IPCS, the IPccomp and an index that present the performance of a 100 base portfolio invested in the risk free asset or CETES28D. This is done in order to show the performance of the IPCS and the IPCcomp in an annual, monthly and daily basis.
Yearly, monthly and daily effective return comparison of the IPCS, IPCcomp and CETES28D.
| Year | IPCS (%) | IPCcomp (%) | CETES28D (%) |
|---|---|---|---|
| 2008 | 12.1952 | 8.6911 | 0.7373 |
| 2009 | 50.2595 | 37.3547 | 5.7103 |
| 2010 | 20.6621 | 18.9364 | 4.4468 |
| 2011 | −6.9102 | −2.7258 | 4.3090 |
| 2012 | 26.5479 | 18.1722 | 4.2792 |
| 2013 | −0.2580 | 0.1520 | 3.8426 |
| 2014 | −0.3487 | 0.3122 | 1.4701 |
| Annual return resume statistics | |||
| Mean return | 14.5926 | 11.5561 | 3.5422 |
| Std. dev. return | 19.8486 | 14.3322 | 1.7749 |
| Max return | 50.2595 | 37.3547 | 5.7103 |
| min return | −6.9102 | −2.7258 | 0.7373 |
| 2.5% quantile | −6.9102 | −2.7258 | 0.7373 |
| 97.5% quantile | 50.2595 | 37.3547 | 5.7103 |
| Mean Sharpe ratio | 0.7334 | 0.8038 | 0.0000 |
| Monthly return resume statistics | |||
| Mean return | 1.5022 | 1.1896 | 0.3646 |
| Std. dev. return | 5.0737 | 4.4885 | 0.1031 |
| Max return | 14.4571 | 11.6370 | 0.7373 |
| min return | −11.4778 | −12.9506 | 0.0000 |
| 2.5% quantile | −0.9731 | −0.8520 | 0.0168 |
| 97.5% quantile | 12.0695 | 10.2902 | 0.6809 |
| Mean Sharpe ratio | 0.2954 | 0.2642 | 0.0000 |
| Daily return resume statistics | |||
| Mean return | 0.0735 | 0.0582 | 0.0178 |
| Std. dev. return | 1.2660 | 1.1195 | 0.0131 |
| Max return | 7.2775 | 5.9090 | 0.0880 |
| min return | −6.5587 | −5.9258 | −0.0165 |
| 2.5% quantile | −0.2575 | −0.2192 | 0.0000 |
| 97.5% quantile | 2.6093 | 2.2898 | 0.0518 |
| Mean Sharpe ratio | 0.0579 | 0.0518 | 0.0000 |
The results of the historical performance (returns) of the IPCS, IPCcomp and CETES28D indexes. Source: Mexican Stock Exchange and data from simulations.
As noted in the first panel of Table 1, the IPCS had a superior performance in the years where there has not been any crisis such as 2010 and 2012. In the years such as 2011, 2013 and 2014 the index had a more negative return than the IPCcomp but, despite this, the IPCS showed a preferable performance than the IPCcomp. As a first conclusion to this annual analysis, it is observed that, when the IPCcomp has a positive return, the IPCS has a preferable one, giving a first hint of the short-term over-performance and possibly a mispricing of the sustainable investment.
In the three other panels of Table 1, we present a statistical resume of the percentage variation (return) in the three indexes in the three periodicities of interests (daily, monthly and annual). As noted, the IPCS had the highest mean value and standard deviation but, despite this, this index shows the highest mean Sharpe ratio, calculated with (2) and using, as inputs, the mean return, the standard deviation of the returns of all the time series and the mean return of the CETES28D index.
In order to strengthen the conclusion about the risk levels we calculated, with the observed daily variance levels, a variance ratio with the 30 days used in the standard deviation calculation:

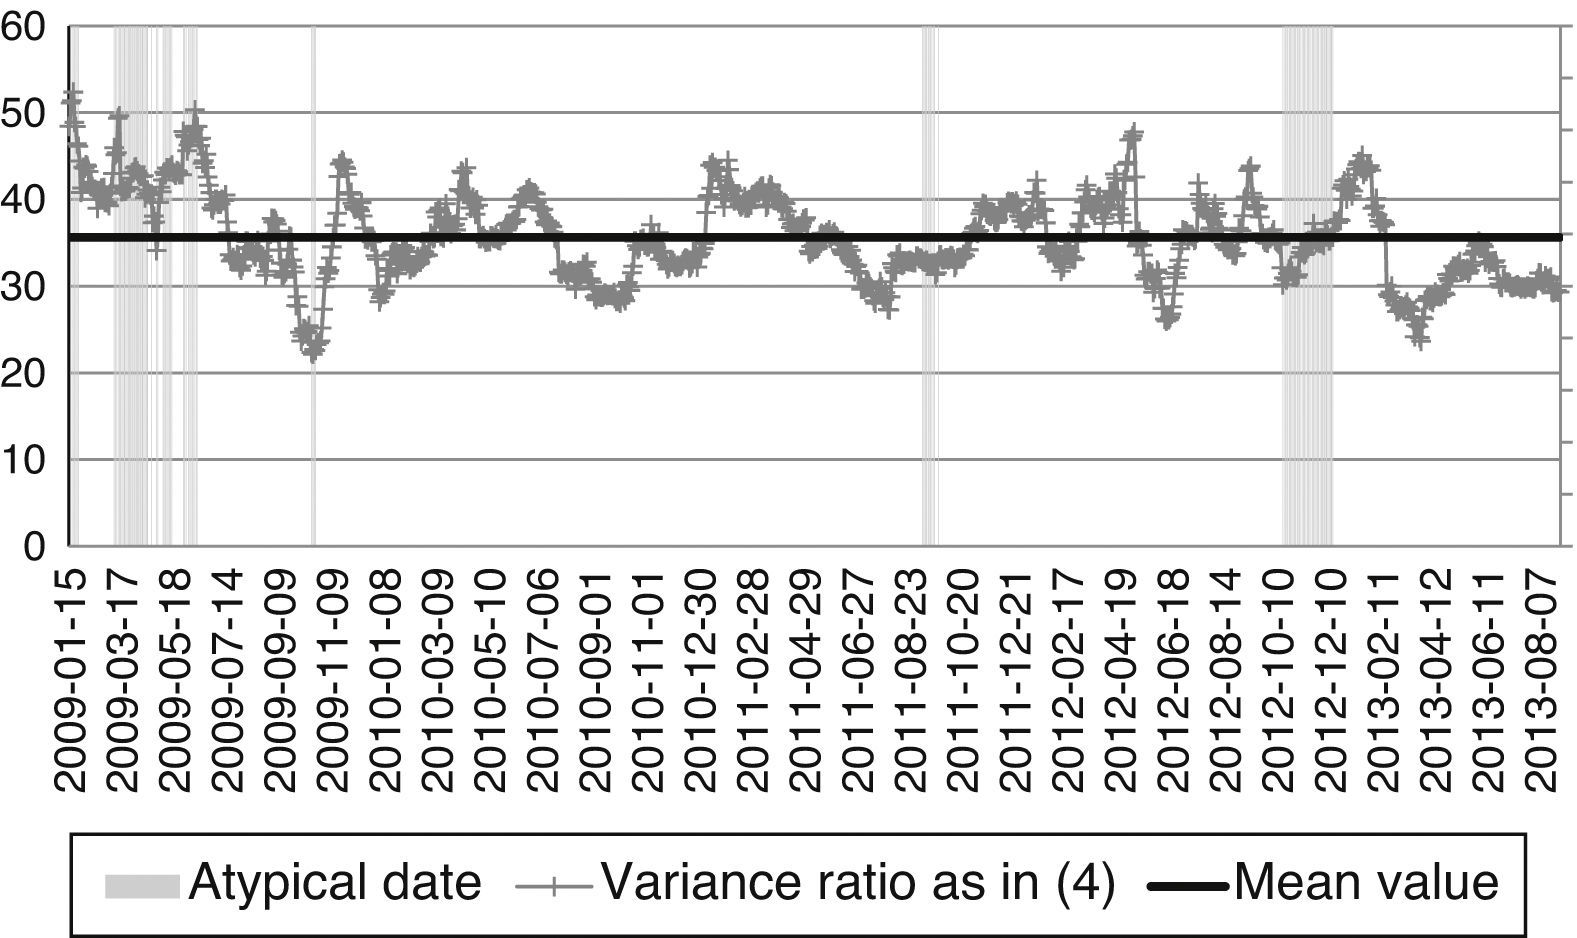
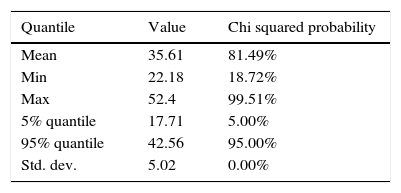
The historical values results are shown in Fig. 4 and a summary of the conclusions about the statistical equality test performed in all the simulated dates is presented in Table 2. As noted, the historical mean value for the VR is 35.61. The hypothesis test rule used to accept the equality of variances was H0: “The variances among benchmarks is equal if q5%<VR<q95%”, being qp% the 5th or 95th percentile of the chi-squared probability function, given T−1=30−1=29 degrees of freedom. By the fact that the mean VR value is 35.61, the null is accepted in practically all the dates, leading to conclude, as previously shown, that the risk levels in the IPCS and the IPCcomp are statistically equal. This is so despite the fact that, in the atypical dates, the values of VR were higher than in normal ones.
. This figure shows the historical daily standard deviation of the IPC and IPCcomp indices from January 15, 2009 to August 8, 2013 along with the atypical dates detected with (3). Source: Data from simulations.")
IPCS and IPCcomp historical variance ratio (VR). This figure shows the historical daily standard deviation of the IPC and IPCcomp indices from January 15, 2009 to August 8, 2013 along with the atypical dates detected with (3). Source: Data from simulations.
Variance ratio (VR) historical values summary table.
| Quantile | Value | Chi squared probability |
|---|---|---|
| Mean | 35.61 | 81.49% |
| Min | 22.18 | 18.72% |
| Max | 52.4 | 99.51% |
| 5% quantile | 17.71 | 5.00% |
| 95% quantile | 42.56 | 95.00% |
| Std. dev. | 5.02 | 0.00% |
The summary of the historical variance ratio calculated with (4). As noted by the mean value, practically all the VR values are between the 5th and 95th percentile, suggesting that the statistical equality between the risk levels of both indexes held in all the dates. Source: Data from simulations.
With this result and contrary to Schröder (2007), we found that the SI in Mexico did not present a higher risk level against the broad market one in the studied time frame.
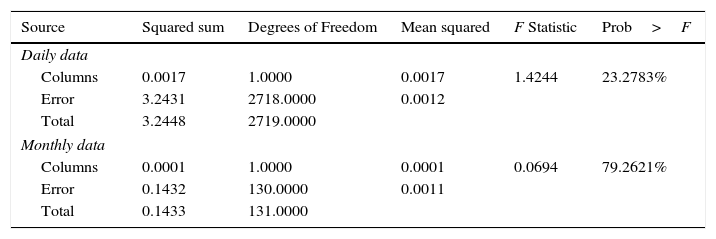
Once the equality in the volatility level in the IPCS and the IPCcomp indexes was proved, we tested the ex post mean–variance efficiency of both indexes. To do this, we compared the Sharpe ratios calculated as in (2) and tested them by using a one-way ANOVA test for daily and monthly data.7 In Fig. 4, the historical daily Sharpe ratios show that both indices have similar performance or mean–variance efficiency. The one way ANOVA test for daily and monthly data show in Table 3 suggest that the Sharpe ratio levels were statistically equal, a result that was consistent with the results of Statman (2000) and Schröder (2004, 2007).
One-way ANOVA test results of the historical Sharpe ratios.
| Source | Squared sum | Degrees of Freedom | Mean squared | F Statistic | Prob>F |
|---|---|---|---|---|---|
| Daily data | |||||
| Columns | 0.0017 | 1.0000 | 0.0017 | 1.4244 | 23.2783% |
| Error | 3.2431 | 2718.0000 | 0.0012 | ||
| Total | 3.2448 | 2719.0000 | |||
| Monthly data | |||||
| Columns | 0.0001 | 1.0000 | 0.0001 | 0.0694 | 79.2621% |
| Error | 0.1432 | 130.0000 | 0.0011 | ||
| Total | 0.1433 | 131.0000 | |||
The one-way ANOVA test of the historical Sharpe ratios and tests the hypothesis that the Sharpe ratio levels are statistically equal. The high probability value at the upper right corner accepts this hypothesis. Source: Data from simulations.
In spite of the fact that these authors used another performance measure, this first result gave a first hint about the mean–variance efficiency of the Mexican sustainability index.
The results presented thus far give a proof of the general hypothesis: “The IPC sustainability index is as mean–variance efficient as the broad market IPCcomp index” and helped us to make a favorable statement about sustainable investment in Mexico by the fact that the statistical risk level was equal to the broad market investment strategy and was as mean–variance efficient as the latter.
Following this first result, we could say that sustainable investment (SI) in Mexico is as efficient as the broad market investment, and moreover that SI could substitute the latter. To test this last statement is important because institutional investors, such as pension funds, are more concerned in the ethical, environmental and economical perspective of their portfolios. If they want to invest in a sustainable portfolio, they would like to know not only if it would have a similar or a lower risk level than a broad market strategy but also if they would achieve alpha and, if not possible, that the performance in their equity exposure would lead to a similar performance than the broad market strategy.
In order to address this issue and following Schröder (2007), we ran a one-factor model for the IPCS daily and monthly returns with the IPCcomp index (also with daily and monthly data) as market portfolio:

With the regression parameters (α,β) we performed Huberman and Kandel (1987) spanning test to prove the next null H0: α=0, β=1. If H0 holds, then the IPCcomp could replicate the performance of the IPCS, supporting the indistinct use of both indexes without the loss of performance and mean–variance efficiency.
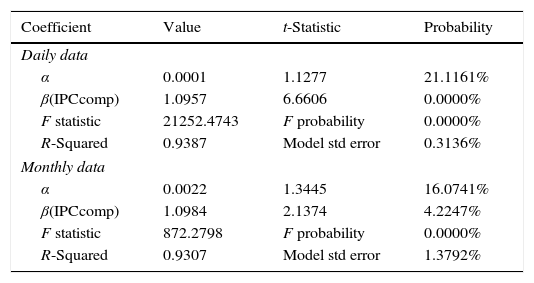
Table 4 presents the results of this test in daily and monthly periods.8 As noted, the IPCS did not generate alpha because the intersection level (α) was not significant and also had a value of zero. On the other hand, we found the value of β was close to 1 (1.0957) significant when we ran the next t-statistic:

IPCS spanning test with the IPCcomp index as market benchmark.
| Coefficient | Value | t-Statistic | Probability |
|---|---|---|---|
| Daily data | |||
| α | 0.0001 | 1.1277 | 21.1161% |
| β(IPCcomp) | 1.0957 | 6.6606 | 0.0000% |
| F statistic | 21252.4743 | F probability | 0.0000% |
| R-Squared | 0.9387 | Model std error | 0.3136% |
| Monthly data | |||
| α | 0.0022 | 1.3445 | 16.0741% |
| β(IPCcomp) | 1.0984 | 2.1374 | 4.2247% |
| F statistic | 872.2798 | F probability | 0.0000% |
| R-Squared | 0.9307 | Model std error | 1.3792% |
The results of the spanning test (H0: α=0, β=1) for the IPCS index with the IPCcomp as market benchmark (nominal returns were used). Source: Data from simulations.
As Table 4, shows, the Huberman and Kandel spanning test hypothesis H0: α=0, β=1 did not held for the daily data but it did for the monthly time series at a 1% and almost to a 5% significance level (probability of 4.22% in the β coefficient). Once we noted this, we found that Fig. 2 and Table 1 have a potential answer to this issue by the fact that the data is too short and because there are two “crisis” or atypical periods in the historical data. This suggests that the present study must be extended to a longer time series and also to the use of an econometric study with at least two regimes in the returns (crisis and no crisis). Because the first solution requires the calculation of a new sustainable index with data at least from year 2000 and also the second solution needs the determination of the proper econometric model with changes in regime, these two tasks will be left as future research duties that depart from the present one (Fig. 5).

Even though the spanning test needs more historical data and studies, it is worthwhile to observe that the performance, mean–variance efficiency (measured with the Sharpe ratio) and variance levels suggest a superior performance in the IPCS and a similar exposure to risk levels in both indexes. This last remark suggest that the sustainable investment is as risky and as efficient as the broad market one in Mexico and, as a consequence, the IPCS could be used as a substitute benchmark for the IPCcomp in the equity factor of a portfolio or benchmark in a pension fund or institutional investor.
5Concluding remarksThe results from our tests proved that the hypothesis “The IPC sustainability index is as mean–variance efficient as the IPC or the IPCcomp indexes” holds in certain conditions. In the present paper we tested, in an ex post fashion, the risk levels of the IPC sustainability (IPCS) and the IPCcomp (broad market) indexes with a chi-squared test. The results prove that the IPCS has a statistically equal volatility level than the IPCcomp i.e. sustainable investment in Mexico does not has higher risk level due to the lack of diversification against a broad market investment strategy.
Complimentary to this, we tested the mean–variance efficiency in daily and monthly periods with an ANOVA test of the Sharpe ratio and we found that this measure was statistically equal in both indices. This last result strengthens the use of SI by the fact that the former could replicate the performance of the latter.
In order to complement these results, we ran a Chi-square volatility test and a spanning CAPM test (H0: α=0, β=1). The former proved that the sustainable investment in Mexico (IPCS) had the same level of risk as the broad market one (IPCcomp). And suggest that the sustainable investment could be used as a substitute of the conventional one (IPCcomp) by the fact that the risk exposure is statistically equal.
On the contrary, we found opposite results with the spanning test. In the daily periods the null hypothesis did not hold but, in a monthly basis, the null holds at a 1% significance level and almost to the 5% one (a beta probability of 4.22%). As a potential cause of these results, we found that the lack of historical data (i.e. the index is relatively new compared with another sustainable benchmarks) limited the nature of our test. Also we found that the use of a change of regime test is necessary. Therefore the calculation of a longer sustainable benchmark and also the use of stronger econometric models are left as guidelines for further research.
In spite of the weak results of this last test, we observed that the other two hold and we also saw a marginally higher turnover in the IPCS that suggests that even though the performance of the IPCcomp and the IPCS were ex post equal, the latter present a higher return in the short-term.
What are the implications of this remark? If we follow Derwall's et al. (2011), we can observe that their “errors in expectations hypothesis” holds in the Mexican market, giving proofs that sustainability is not priced. Despite this conclusion, we need, as we previously told, a longer data set in order to test if this hypothesis or the “value-driven investor” hypothesis would hold in the long-term. As a final remark, we could observe that there was no loss of performance due to a lower diversification in the IPCS against the IPCcomp, supporting the use of the SI strategy in Mexico.
As guidelines for further research, a robust Monte Carlo simulation could be performed and a more detailed review of the factors that cause the mean–variance efficiency equality could be on the agenda. Also, we note that we tested our results only in the original time frame (2008–2013) and we need more data to check if these results hold. Had we have a longer story, we could have check if our conclusions remain intact, noting that a test with multiple volatility regimes is also in the agenda as part of current research activities to be published soon in academic papers.
All this guidelines will lead, as a parallel result and technological innovation, to the creation of growth and value stock indexes in Mexico (indexes that do not exist in this country), along with the review of the proper broad market index proxy as necessary future tasks.
An index known today as the MSCI ESG (environmental, social and governance, ESG) index.
Please refer to Mexican Stock Exchange (2013, p. 6) for further details.
For further details about the cardinality restrictions (max and min weights), please refer to Mexican Stock Exchange (2006).
We are not going to study the impact of the sustainable investment in the sustainable stocks that are not members of the IPCS because, as of 2014, there were no more tan 30 members from the IPCcomp with a high sustainability score and because the impact in the asset pricing of non-sustainable stocks is on current research by some of the authors.
This has been done in order to ensure a consistent calculation by using daily returns with one month of data.
As noted in Fig. 2, the standard deviation in the IPCS remained high after the atypical dates. This is so because we used the conventional standard deviation calculation and not a GARCH process to quantify the risk level. The use of the proper GARCH model to quantify the risk level in this sort of index is outside the scope of the present paper.
We used daily and monthly periods in order to check the robustness of our findings. We could not use annual data by the fact that the time series that we have are very short (only from 2008).
We did not run the test in an annual basis by the fact that the time series are too short and the loss of degrees of freedom could lead us to inaccurate standard errors and t-values.
- Direct and moderating effects of COVID-19 on cultural tourist satisfaction
- Destination recovery during COVID-19 in an emerging economy: Insights from Perú
- The impact of the COVID-19 crisis on consumer purchasing motivation and behavior
- Covid-19 vaccines: A model of acceptance behavior in the healthcare sector
recomendados

www.publicationethics.org.