


Sport event promoters aim to organize them to get the best return on their investment. The purpose of this study is to learn better how to manage the event to maximize the benefit to the host area. Most studies on economic impact of sporting events focus on mega events or look for an impact in medium to large size cities. This study estimates the effect of a two-day event, the Rally Ourense, that takes place in a small town in Spain. Economic impact is estimated based on surveys of spectators and interviews of competitors in the 2009, 2010, and 2011 editions of the rally. The results show that the race has favorable effects, but also suggest that the impact could be increased with some simple changes to the event structure.
The economic impact studies determine the profitability of an investment for a territory and its inhabitants. In the field of sport, such studies are performed for sporting events, facilities (infrastructure) or sports associations.
Sport events are typically regarded as major generators of economic activity and jobs (Dwyer, Forsyth, & Spurr, 2005). Often estimating the economic impact of these events justifies their implementation based on economic and social reasons. However, many authors point out that an economic impact assessment alone cannot justify public support for hosting sporting events (Barget & Gouguet, 2011). Furthermore, misinterpretations and miscalculations of these studies are well documented in the literature (Baade & Matheson, 2006; Késenne, 1999; Taks, Kesenne, Chalip, & Green, 2011).
Economic impact studies of sporting events are increasingly demanded by policy makers and cities considering a bid to host large-scale events. Tyrrell and Johnston (2001) assert that policy makers often rely on the results of economic impact analysis to assess economic consequences of major events. Barajas, Salgado, and Sánchez (2012) state that the validity of economic impact results depends on a variety of methodological issues, including the type of competition, geographic scope, duration, participants, federation, spectators, location, infrastructure needs and schedule. Based on these features, events can be classified within a typology proposed by Gratton, Dobson, and Shibli (2000) and later expanded by Wilson (2006).
The characterization of sports events helps in the selection of the methodology to study impact; Li and Jago (2013) offer a review of the most common methods. The classification of sport events also provides information on their positive aspects and what to focus on to generate profits, and those facets that are not as beneficial and can improve or change.
To date, the literature on small-scale sport events is sparse (Gibson, Willmin, & Holdnak, 2003; Lee, Harris, & Lyberger, 2010) with the focus of impact studies on large scale or mega-events. The lack of studies of small-scale events is a consequence of the difficulties in carrying out studies as the size of the event decreases, as indicated by Mondello and Rishe (2004) and Matheson (2006). Nevertheless, Higham (1999) and Coates (2012) suggest that small-scale sports events might have positive effects for host communities. There also are few ex post studies of small events, also because of problems related to their size.
One last aspect that should be pointed out is related to studies that require surveys. The degree of difficulty in carrying them out during the event should not be underestimated. For example, surveys conducted in open spaces, like at cycling and road racing events, are more difficult to implement than those at events confined to an indoor venue (Desbordes, 2007). Possibly for this reason, economic impact studies of these events are not as frequent as in other sports. Nevertheless, there are examples like those by Hassan and McCulloch (2007) and Hassan and Connor (2009) on rallies, Chmura Economics and Analytics (2011) and Collins, Roberts, and Munday (2012) on cycling events or Barquet, Brida, Osti, and Schubert (2011) and Kruger, Botha, and Saayman (2012) on marathons. This study analyzes an event with these characteristics: a Rally included in the Spanish National Championship that takes place in an area not densely populated, the Rally Ourense.
There are two main reasons for analyzing this sport event. First, this event happens on a regular basis having been held more than 40 times. The authors have collected data for three consecutive years which allow for more accurate inferences about the impact of the event, and lessons for how to improve its impact. Second, while it is a small event, it is part of a national competition attracting spectators and competitors from outside the area. Most studies on economic impact focus on the estimation of the impact or methodological issues but they do not extract practical conclusions about how to use the study to enhance the event's creation of value for the host community. For that reason, the present paper draws experiences to design better this kind of analysis and to learn about the key elements on which to act for increasing the value for the area. Therefore, our study consists not only in the presentation of the main results of the economic impact of Rally Ourense for three years but how this kind of research could be used as a management tool by organizers and policy makers.
2Key issues in economic impact studiesTaks et al. (2011) compare and contrast the standard economic impact analysis (EIA) and a cost-benefit analysis (CBA). They consider the opportunity cost, among the costs, and the increase in the consumption of locals and the consumer surplus on the benefit side. Preuss, Könecke, and Schütte (2010) maintain that only the spending produced by viewers who stay in town for the event and visitor spending should be taken into account in the analysis as a positive effect. They also remark that there is a negative cash flow when residents travel outside the region for attending events. However, gathering the information about the spectators that attend the same kind of event outside the town requires a different survey design. Moreover, for a small event in a small town, it is likely that the figure for travelers is small.
In line with Lee and Taylor (2005) and Baade and Matheson (2006), the direct expenditure should be taken as a starting point for calculating the economic impact of a sporting event. This direct expenditure includes spending by the (out-of-town) spectators, competitors and the organizer as generators of economic impact. This study estimates the direct monetary effect of the event. We do not attempt to estimate either the opportunity cost or the consumer surplus attributed to the event. For a cost-benefit analysis (CBA) of the Rally, both opportunity cost and consumer surplus are necessary (Taks et al., 2011), but we are only interested in the economic impact analysis in this study. So, we consider only tangible direct effects related to cash inflows and outflows from the main actors related to the event.
2.1Identifying the sources of cash flowsThe first step in order to estimate the economic impact of a sport event is to identify the agents that are going to bring or draw money to the selected area of study. In a small event like a Rally, this task may be relatively easy as the sources of cash flows are the spectators, competitors, media staff, and organizing committee. Of these four groups, the last three are easily identified and, in most cases, detailed information about them can be obtained. This is not the case for the spectators. For them it is necessary to estimate attendance. This estimation is simple in an indoor event or an event where the organization sells the seating or standing tickets in a specific space. The problem arises in sports like road cycling or rallies. In these types of events, the estimation of attendance can be a real challenge.
In most ex ante analyses, attendance may be set using a rule of thumb. In their assessment of the impact on Richmond, Virginia from hosting the 2015 World Road Cycling Championship, Chmura Economics and Analytics (2011) apply directly the figure from the International Cycling Union (UCI from Union Cycliste Internationale in French). The justification is based on the estimation for the Melbourne Championship in 2010 (300,000 visitors) and a survey conducted in Hamilton, Ontario, Canada, which hosted the 2003 World Road Cycling Championships. In the case of Richmond, a more populated area closer to Europe, the UCI increased the figure to 452,580.
Hassan and McCulloch (2007) present a report on the socio-economic impact of the World Rally Championship. They include the study of 5 rallies throughout 2007. For the Rally Deutschland, the number of spectators is not available. The data for the Vodafone Rally de Portugal are given and in the Rally New Zealand the estimation method is not reported. Police forces and the organizers provide the estimated figure for Rally Ireland. The Rally RACC (Catalunya) is the only case in which the authors offer estimation based on the increases in hotel occupancy. Nevertheless, with this method the day visitors and visitors that spend the night in other kind of accommodation are not accounted for.
Even though the estimation of the number of spectators can be difficult in an event like a Rally, there is a method for estimating that figure. The race takes place in branches of roads distant from the populated areas. The spectators have to arrive mostly by car to the zones enabled to attend the pass of the competing vehicles. So, an accurate estimation can be done measuring the length of the roads with parked cars in every access to the tranches. Then the number of cars can be estimated considering the average length of a vehicle. Asking the questionnaire about the number of occupants in the respondent's cars and multiplying the average occupancy obtained by the estimated number of cars produces an approximate number of spectators for each tranche. Unfortunately, simply adding together the number of spectators at each tranche could result in double, or multiple counting of a single spectator, as an individual can attend the race in different tranches. Spectators may view a tranche of the race, then drive off to another location to see another tranche. If that person viewed several tranches, he could be counted many times in the attendance figure. For that reason, the survey includes a question asking about the tranches the individual plans to visit. To avoid this double counting of visitors, we multiply the total number of attendees by a coefficient that is the ratio of the number of non-locals that responded to the survey to the total number of tranches that they indicated they were going to visit. So, with this coefficient the number of attendees for each tranche can be estimates avoiding duplicates.
A further difficulty in estimating the non-local attendance arises because the organizers of the Rally, looking to attract spectators, include street shows in the town. With these street shows, an attendee can arrive by foot or public transport which means the estimation of attendees cannot be done in the same way as with the out of town tranches. Nevertheless, this number can be obtained from the data on the other tranches and the responses in the survey about the intention of attending the race in town using the coefficient explained in the previous paragraph.
A final issue with the measurement of non-local attendance must be addressed. Spending from non-locals may be the result of a visitor who has altered his or her date of visit to coincide with the Rally Ourense rather than as a result of making an additional visit to the city. Likewise, a visitor may have been in town for another purpose and decided to attend the race since it was available. For these reasons, spending from time-switchers and casuals has to be excluded as the race did not attract them to the city. Including their spending would, of course, make the results more positive. Crompton (1995, 2006) considers counting expenditures from time-switchers and casuals as one of the common mistakes in analyzing economic impact.
2.2Estimating the expenses from the different agents2.2.1Expenses from spectatorsIn addition to the number of spectators, to estimate the economic impact of the event it is necessary to have data on the length of stays and the average amount spent per person. People are often reluctant to answer monetary questions. For that reason, the questionnaire for this study uses a novel design as an attempt to elicit as large a response rate as possible to the spending question. Respondents were potentially asked three questions about spending. The first question asked specifically about spending on the most common items, lodging, meals, etc. If the person did not want to answer that question, then the interviewer asked about the total amount of money that the respondent intended to spend in the town. Finally, for those who did not want to answer the second question, a third question was asked. In this case, the respondent was able to choose among several ranges of expenditures.
2.2.2Inflows from the competitorsThe competitors (including drivers, co-drivers, mechanics and other auxiliary staff) represent the second group of persons that will bring monetary inflows to the area. The number of teams is limited, for that reason it is not difficult to interview a spokesperson for each team. The interviews include questions about the team spending in the area. It was expected that the main expenditures would be accommodation, food and drink, registration fees, petrol and spare parts or accessories.
2.2.3Inflows from the mediaMass media plays a fundamental role in an event like the Rally. The staff here includes journalists, photographers, cameramen and, in general, any person authorized by a media provider to cover the event. As with spectators and competitors, all who travel from out of town generate an economic impact on the community through the expenditure incurred during the time they stay in town.
A different issue is the impact of the event on the media. Specialized companies produce reports which provide estimates of the economic value to the city by advertising campaigns on television and radio, in the press and via the Internet. These studies attempt to assess the number of viewers, listeners or readers that the media coverage of the event produces and the costs of such coverage had the local council or government purchased these advertisements. However, these savings are purely theoretical since the local government may never have undertaken such campaigns. Moreover, the real benefit of the media coverage is increased visitors in the future, something that should be tracked to learn the influence that the media had on tourist spending.
2.2.4Inflows and outflows from the organizerThe difference between the money that the organizing committee attracts from outside the area and the money that it spends with external suppliers will be the direct monetary economic impact. The maximum positive impact would happen if the organizers attract all the revenues from entities, sponsors, authorities, etc. from outside the area and spend all the money with firms inside the area. On the contrary, if all the funds come from local agents and the organizers spend all the money outside the area, then the maximum loss will occur.
The information about revenues split by their origin and expenses identified by destination is crucial to estimate the impact. There are some companies or institutions that clearly are sited in an external area, but in some cases the institution may cover a wider area that includes the local area. For example, if the regional government provides some funds, the town is included in the region. In that sense a pro rata distribution should be done to determine the proportion of funds that really come from outside the area.
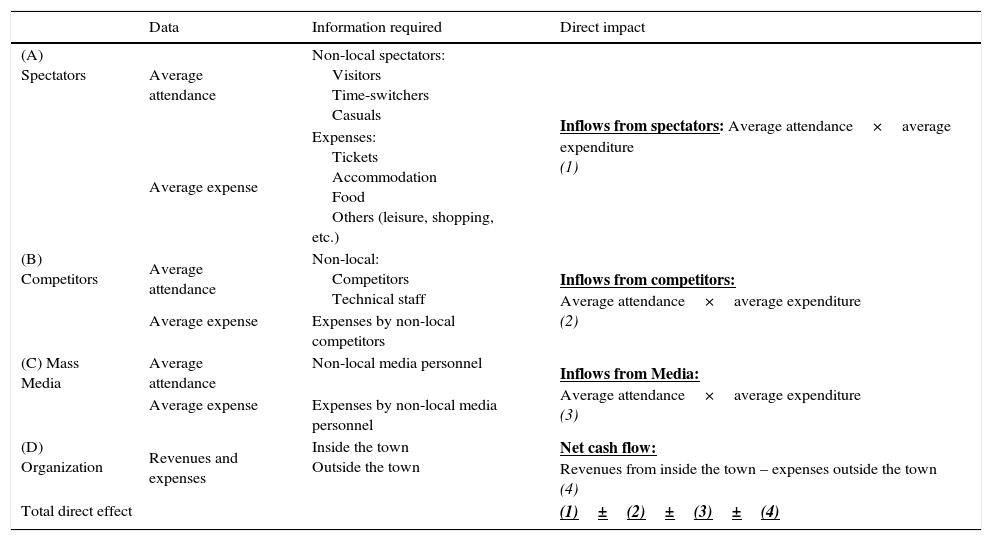
2.3Estimating the direct monetary economic impactOnce the direct impact from the different agents involved in the event has been estimated, the total direct economic impact is just to add those figures. Table 1 summarizes the different components of the direct monetary economic impact.
Estimation of the direct monetary economic impact of an event.
| Data | Information required | Direct impact | |
|---|---|---|---|
| (A) Spectators | Average attendance | Non-local spectators: Visitors Time-switchers Casuals | Inflows from spectators: Average attendance×average expenditure (1) |
| Average expense | Expenses: Tickets Accommodation Food Others (leisure, shopping, etc.) | ||
| (B) Competitors | Average attendance | Non-local: Competitors Technical staff | Inflows from competitors: Average attendance×average expenditure (2) |
| Average expense | Expenses by non-local competitors | ||
| (C) Mass Media | Average attendance | Non-local media personnel | Inflows from Media: Average attendance×average expenditure (3) |
| Average expense | Expenses by non-local media personnel | ||
| (D) Organization | Revenues and expenses | Inside the town Outside the town | Net cash flow: Revenues from inside the town – expenses outside the town (4) |
| Total direct effect | (1)±(2)±(3)±(4) | ||
The public money invested in the organization of events or building arenas or sports venues has been justified with economic impact studies. Crompton (1995) and Coates (2007) identify doubts about the benefits of funding those facilities with public money. Coates and Humphreys (2008) suggest that economists largely agree that subsidies for franchises, sport venues and mega-events are undesirable. Even more, Crompton (1995) warns about the misapplication of these studies. In the present study, the misuses pointed out by Crompton (1995, 2006) have been avoided.
3Event, data and methodology for the economic impact studyBegun in 1967 and organized by Escudería Ourense, Rally Ourense is one of the leaders among the asphalt rallies in Spain. Currently, the rally is included in the National Asphalt Rally Championship organized by the Royal Spanish Automobile Federation (Real Federación Española de Automovilismo – RFEdeA). Rally Ourense also is a component of other competitions both at the national and international level. For example, in 2013, Rally Ourense counted toward the Copa Suzuki Swift, the Mitsubishi Evo Cup Asfalto, and the Renault Challenge Twingo R2. The Ourense contest is of an asphalt car race. Cars compete on closed public roads in “special stages”, leaving from the starting point in regular intervals. Each pilot races against the clock. The course need not be the same from year to year, either in the distance covered in total or in each section. For example, in the 46th edition of the race, the shortest segment was 3.1km and the longest was 29.78km but in the 44th edition the shortest segment was 2.05km and the longest was 30.73km. A further interesting aspect of the Rally format is that after completing a section of the race in which roads are closed to the public, the cars must drive to another location, obeying traffic laws, to get to another section closed to the public.
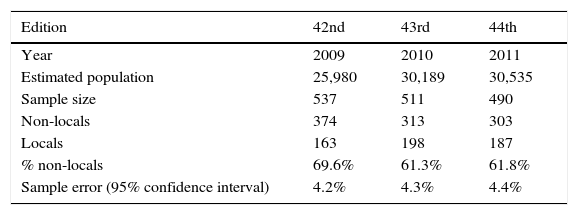
An impact study has been performed for the Rally Ourense in each of three years, 2009, 2010, and 2011. Table 2 summarizes the information about the surveys conducted among the spectators. Around 500 persons answered the survey during the two days of the event. The surveys were conducted in all the different “special stages” where the public attended the Rally. The surveyed persons were chosen randomly, asking every fifth person and avoiding groups of people.
Moreover, each year, the manager or spokesman of each competitor team was interviewed using an open questionnaire.
In the 42nd edition of the race, a separate assessment of the spending by the media staff was carried out. For all three editions, detailed information about the different media registered with the number of professionals and their origin was provided by the organizers. Finally, before, during and after every edition of the race, the organizing committee provided the detailed budget to the researchers, including all the revenues and expenses classified according to their origin or final destination.
The study on the economic impact has followed the approach presented by Salgado, Barajas, Lera-López, and Sánchez-Fernández (2013) but considering only the direct monetary flows. Due to the small dimension of the event and the fact that there are no input–output tables for the area, the indirect effect is not estimated. So, the process started with the identification of the different sources of cash flows. Then the flows of the different agents were estimated using the information from the surveys and interviews. With that information, the direct monetary economic impact was computed as well as the return from the public money invested in the event. In the next section, the results are introduced.
4Results: direct monetary economic impact of the eventThis section presents step by step the results obtained in the study of the three successive editions of the event analyzed, the Rally Ourense.
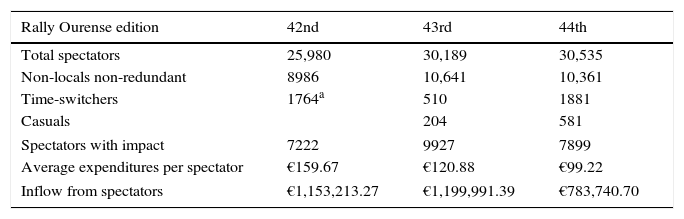
4.1Estimation of the expenditures from the different agents4.1.1Expenditure from spectatorsFollowing the methodology described previously, the estimated number of spectators whose spending should be considered varies from some 7000 to almost 10,000 persons. The figures related to the estimation are shown in Table 3.
Estimation of inflow from attendants.
| Rally Ourense edition | 42nd | 43rd | 44th |
|---|---|---|---|
| Total spectators | 25,980 | 30,189 | 30,535 |
| Non-locals non-redundant | 8986 | 10,641 | 10,361 |
| Time-switchers | 1764a | 510 | 1881 |
| Casuals | 204 | 581 | |
| Spectators with impact | 7222 | 9927 | 7899 |
| Average expenditures per spectator | €159.67 | €120.88 | €99.22 |
| Inflow from spectators | €1,153,213.27 | €1,199,991.39 | €783,740.70 |
As described in the methodology, the question about spending in the town was presented sequentially with different levels of information. Using this technique, the response rate is over 98% in the last two editions. With that information there are three sources for estimating the average expenditure of the attendees. The first one is the sum of all the different types of spending divided by the number of respondents to that question; the second is just the average of the responses to the second spending question; and the last estimate of spending is based on the ranges of spending selected by the respondents. The weighted average of the amounts obtained will be the average expenses per attendee.
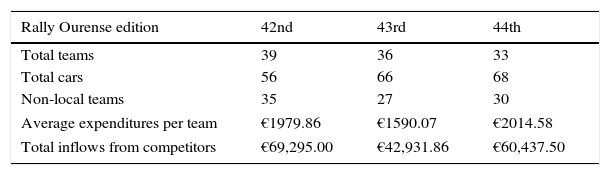
4.1.2Inflows from the competitorsThe relatively small number of competitors makes it possible to interview all the teams. From the interview, the researchers wish to learn components of the race team spending and whether the money was spent locally or outside of Ourense. In this type of competition, one of the main expenditures is for fuel. In the case of the Rallies included in the Spanish Championship, the teams have to use the fuel provided by the RFEdeA. For this reason, the expenses on fuel do not have positive impact on the race's host area. That leaves only a small amount of spending on fuel done before and after the days of the race. Something similar happens with spare parts, tires or accessories. Teams bring with them these items. Tire manufacturers even attend the championship in order to provide the tires directly to the teams. Finally, the registration fee has to be excluded to avoid double counting because this money will be included among the inflows received by the organizing committee. Obviously, the local teams must be excluded in order to correctly calculate the financial inflows from which the area will benefit (Table 4).
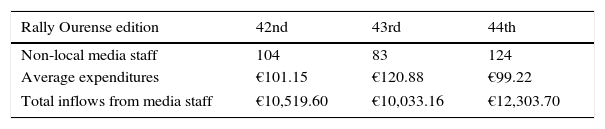
4.1.3Inflows from the mediaFor the 44th Edition of the Rally, 81 media organizations covered the event. This includes 20 newspapers, 9 of them specialized in sport, 16 television stations or TV producers, 7 radio stations, 10 photography agencies, 5 press agencies and 23 Internet press. In total 209 persons from these media were registered and 124 of them came from outside the city. Considering the number of journalists and other staff from the media, it is easy to estimate the inflows from them.
In the 42nd Edition of the Rally, a survey was conducted among the media staff in order to calculate their spending in the city. In the absence of this figure, one can just employ the same average expenditures estimated from the spectators. As the number of journalists is relatively small in comparison to the number of spectators, the effect of a variation on their expenses is not influential. In the case of the 42nd edition, if the spectator average expenses were used instead of the estimation obtained from the survey of the media, there would be an increase in the inflows of some €6000. This figure represents only 0.5% of the total inflows from the spectators. In that sense, even the inflows from the media staff could be excluded from the analysis with little effect on the outcome (Table 5).
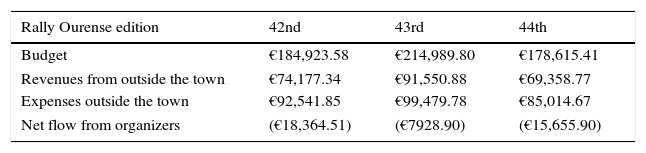
4.1.4Inflows and outflows from the organizerIn the case of the Rally, on average, 40.5% of the revenues originate from areas other than Ourense while 48.0% of the spending is done outside the town. This implies that the organizing committee has a negative direct impact (see Table 6). Nevertheless, most of these expenses cannot be avoided and are necessary. Moreover, some of them cannot be replaced with local suppliers. This is the case of the payments to the RFEdeA (37.6% of the expenses outside the town in the 44th Edition). The RFEdeA is the governing body that decides whether to include the Rally in the Spanish Championship schedule. Moreover, the Rally gets its insurance through the Federation.
Estimation of the direct impact from the organizers.
| Rally Ourense edition | 42nd | 43rd | 44th |
|---|---|---|---|
| Budget | €184,923.58 | €214,989.80 | €178,615.41 |
| Revenues from outside the town | €74,177.34 | €91,550.88 | €69,358.77 |
| Expenses outside the town | €92,541.85 | €99,479.78 | €85,014.67 |
| Net flow from organizers | (€18,364.51) | (€7928.90) | (€15,655.90) |
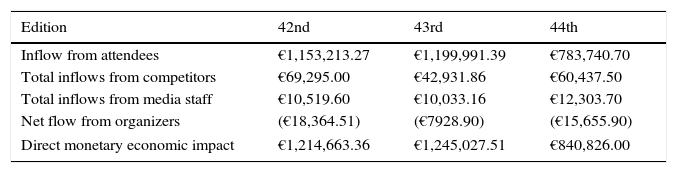
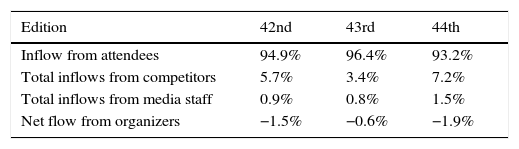
Table 7 summarizes the direct impact that the Rally Ourense had on the city during three editions of the race. The largest impact comes from the spectators though there is a large reduction in spectator spending in the 44th edition. This decrease is explained by the fall in the average expenditures (17.9% from €120.88 in 2010 to €99.22 in 2011) together with a reduction (20.4%) of the non-local persons attending the Rally.
Estimation of the direct monetary economic impact of the Rally Ourense.
| Edition | 42nd | 43rd | 44th |
|---|---|---|---|
| Inflow from attendees | €1,153,213.27 | €1,199,991.39 | €783,740.70 |
| Total inflows from competitors | €69,295.00 | €42,931.86 | €60,437.50 |
| Total inflows from media staff | €10,519.60 | €10,033.16 | €12,303.70 |
| Net flow from organizers | (€18,364.51) | (€7928.90) | (€15,655.90) |
| Direct monetary economic impact | €1,214,663.36 | €1,245,027.51 | €840,826.00 |
The study of the weights that the different agents have on the direct economic impact can shed light on the key elements on which to focus for creating value. Table 8 shows that, on average, almost 95% of the direct economic impact has its origin in the spectators. Competitors contribute some 5% and the effect from the media staff about compensates for the negative effect from the event organizers. In this sense, in order to create more value, organizers should focus their efforts on attracting more spectators from out of town and in increasing the spending done while attending the event. Actions to raise the number of spectators are directly in the control of the event organizers but increasing average spending will be more difficult for the organizers to affect because most attendee expenditures are not directly related with the Rally. For example, the bulk of visitor spending is for food and lodging.
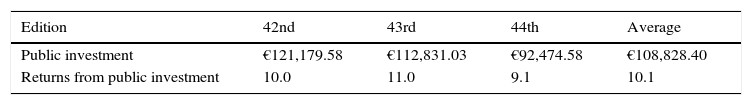
4.3Returns from public investmentPublic investment for Rally Ourense was over €100,000 in each of the three editions. This represents the money that the organizers receive as grants to subsidize some expenses they have to cover. The return from this public investment was highly positive. On average, the public institutions, directly through grants or via sponsorship agreements, have expended some €108,828.40 per year during the period. This means that, on average, for each Euro expended in the Rally, the town has had a return of €10.1. Why is this ratio so positive? This happens mostly because the public expenses are low relative to the total direct impact from the non-local spectators. The public money funding the event can stay low because it is unnecessary to invest in venues and because the total budget of the Rally is small. Over time, as the economic crisis in Spain has grown, the public money expended in the Rally decreased 18.0% in the edition of 2011. Moreover, there has been a process of substitution of private for public funds (the percentage of public money funding the Rally in 2009 was 65.5%, 52.5% in 2010 and 51.8% in 2011) (Table 9).
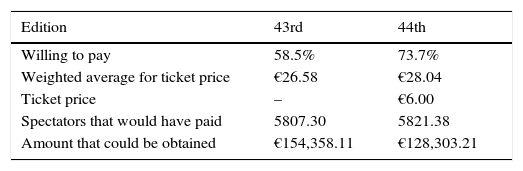
4.4Increasing the private moneyTraditionally, racing in rallies has been done in closed roads. But the need to attract new fans and increase incomes has resulted in the offer of new shows. In the 43rd edition, for the first time, Rally Ourense provided an exhibition in the streets of an industrial area in the town. This exhibition was free for spectators just as is watching any other segment of the race. The survey for the 43rd and 44th editions of the Rally included a question about the willingness to pay to attend the Rally. The results are shown in Table 10. Nearly 60% of the spectators expressed a willingness to pay at the 43rd edition, while the figure rose to 73.7% in the next edition. The average reported willingness to pay of the survey respondents was €26.58 and €28.08, respectively.
Applying the number of non-local spectators to the percentage of spectators with a positive willingness to pay produces the number of out-of-town spectators with a willingness to pay. The organizers could have collected extra revenue that comes from the difference between the price that the spectators on average would have paid and the ticket price (in the 43rd edition no fees were charged). Based on this information, the organizers could have obtained enough revenues from admissions to replace the public subsidies. However, it is worth noting that the start of charging to attend the exhibition, the 44th edition of the race, coincides with a reduction in the number of spectators and the lowest total inflow from spectators over the three study years. Better understanding of willingness to pay information can be a powerful tool in the event management process.
5Conclusions and implications for managementDespite widespread use, economic impact studies still are frequently misused due to misinterpretations of the results or because the limitations of the analysis are not understood. These errors can lead policy makers to make poor decisions. The sport event which has been presented in this paper allows us to draw some practical conclusions. The experience of estimating the direct economic impact of three editions of the Rally Ourense highlights different issues that must be addressed in impact studies. Namely, these issues are:
- •
The specification of the area of interest
- •
The determination of the population under scrutiny
- •
The selection of the sample avoiding overlaps
- •
The need to know details of the design of the event.
Nevertheless, there is a clear advantage when conducting economic impact studies for these events regarding the information required. Economic impact studies only need to focus on the direct impact. In this way, lack of accurate or appropriate multipliers for the geographic area of the study is avoided. Furthermore, the risk of exaggerating the economic impact is reduced.
Regarding practical issues in the methodology, as the spending by the attendees is a crucial piece of information, a high response rate on spending questions is important. This study tested the use of sequential questions about this spending, each allowing the survey respondent to provide a less specific answer to the tough and highly personal question of how much spending they will do. With these different levels of information specificity, the study generated a high response rate (over 98% in the last two editions) to the spending question. Importantly, it does not seem that the different questions involve large variation in the impact estimated here.
A useful result obtained from the impact analysis has to do with the return on public money expended for the Rally. The results show that, on average, for each Euro spent by public authorities, the town experiences about a €10 increase in spending. Thus, we conclude that the Rally has a high return on the public investment and is likely a very good use of a rather small amount of public funds. We have not addressed the possibility that other investments of about €100,000 each year could have as large or larger a return in net new spending for the city though we think it unlikely that many alternative uses of the funds would produce a ten-fold return.
The economic impact analysis should not be limited to study the impact of one event for a specific occasion. An overview of the steps carried out allows us to identify elements of the event that are critical in order to increase the economic impact in future editions of the race. Once these key issues are identified, it is possible to focus the organizer's efforts where they are most profitable for the city.
As an example, in the Rally Ourense, and all events, there are two critical elements that should be taken into account: the number of spectators and their daily average expenditures. In this case, it is argued that it is easier for event organizers to affect the number of spectators, and therefore it is easier to influence the economic impact of the event with policies targeting attendance than with policies targeting spending per person by attendees. Therefore, organizers and policy makers should design programs intended to attract more spectators during the celebration of the Rally.
Our surveys also reveal that the organizers of sport events like the Rally Ourense ought to consider the possibility of charging for attendance to the event, especially in some designated areas. The willingness to pay from the fans might surprise the organizers. Of course, with charges there might also come a reduction in attendees, so organizers should learn as much as possible about spectator willingness to pay before embarking on new or higher admissions fees.
Finally, given the consistency of the results from the ex post analysis across the three editions of the Rally, predictions of the impact of future editions can reasonably be based on these previous results. As these studies are cheaper in terms of implementation, this would be also an advantage for management purposes.
