


This paper examines whether and how ownership structure affects the trade credit policies in small- and medium-sized firms (SMEs) using a sample obtained from a survey of Chinese enterprises. Specifically, we examine how ownership concentration affects SMEs’ use of trade credit through influencing the availability of bank credit. We also examine whether the ownership of the ultimate controller influences the effect of ownership structure on trade credit. The results show that there is a significant negative relation between bank credit and trade credit when most of the firms’ shares are controlled by a dominant shareholder, indicating that concentrated ownership may lower firms’ ability to access bank credit, and SMEs use trade credit as a substitute for unavailable bank credit. The results also show that the effect of ownership concentration on the aforementioned relation is significant in private and state-controlled SMEs but not in foreign-controlled SMEs. Overall, our results suggest that ownership structure plays an important role in determining SMEs’ trade credit policies.
Este artículo analiza cómo afecta la estructura de propiedad las políticas de crédito comercial en las pequeñas y medianas empresas (PYME) por medio de una muestra que se ha obtenido de una encuesta a empresas chinas. Específicamente se examina cómo la concentración de la propiedad afecta al uso del crédito comercial de las PYME al influir en la disponibilidad del crédito bancario. Asimismo, se estudia si la propiedad del controlador último influye en el efecto de la estructura de la propiedad en el crédito comercial. Los resultados revelan que existe una relación negativa significativa entre el crédito bancario y el crédito comercial cuando la mayoría de las acciones de la empresa son controladas por un accionista mayoritario, lo que indica que la propiedad concentrada podría reducir la capacidad de las empresas para acceder a créditos bancarios, y que las PYME utilizan el crédito comercial como sustituto del crédito bancario no disponible. Asimismo, se observa que el efecto de la concentración de la propiedad en esta relación es relevante en las PYME privadas y estatales, pero no en las PYME de control externo. En conjunto, los resultados sugieren que la estructura de propiedad desempeña un papel importante para determinar las políticas de crédito comercial de las PYME.
Trade credit is an important external financing source for firms of all sizes (Demirgüç-Kunt & Vojislav, 2001), which is also considered a substitute for unavailable bank credit especially during periods of monetary tightening or financial crisis (Choi & Kim, 2005; Love, Preve, & Sarria-Allende, 2007; Nilsen, 2002). For a long period of time, however, a puzzling question has remained unanswered: why do suppliers provide credit to customers when banks do not? The common explanation is that suppliers have a monitoring advantage over banks. In business, suppliers can obtain information about their customers automatically or at a low cost for long-term buyer/seller relationships, but banks can only obtain it at a higher cost (Burkart & Ellingsen, 2004). The higher monitoring cost results in banks having less incentive to lend to small or newly established firms.
However, if this explanation is correct, as Burkart and Ellingsen (2004) argued, why do suppliers regularly lend input but not cash directly to their customers? The main reason is that it is easy to divert cash but not input (Burkart & Ellingsen, 2004; Giannetti, Burkart, & Ellingsen, 2011). Since information is asymmetric between lenders and borrowers, bankers do not know whether the cash would be used as pre-commitment when they lend cash directly to borrowers. In other words, bankers face potential moral hazard in lending, which results in that they have less incentive to lend to firms with severe agency problems. However, the potential losses caused by moral hazard are not as large for suppliers as for banks for the difficulty in diverting input. Therefore, even if there is no significant difference in information about borrowers and thereby in monitoring cost between suppliers and banks, suppliers still have more incentive than banks to extend credit to their customers because their potential losses are lower.
In this paper, we shed light on the influence of agency conflict between banks and borrowers on firms’ trade credit policies. Particularly, we explore how the agency conflict induced by ownership structure affects firms’ trade credit policies through influencing the availability of bank credit. Firms in which the dominant shareholders have higher proportions of control rights have greater possibilities of undertaking moral hazard activities (Lin, Ma, Malatesta, & Xuan, 2011), which increases the credit risk faced by banks and in turn lowers the borrowers’ ability to borrow from banks. However, the cost of potential moral hazard is different for banks and suppliers. Suppliers lend input but not cash directly, which reduces the possibility of borrowers misusing cash. Moreover, once borrowers go bankrupt, suppliers also can extract more salvage value than banks due to their liquidation advantage (Burkart & Ellingsen, 2004; Fabbri & Menichini, 2010; Giannetti et al., 2011). Therefore, lending to firms whose largest owner controls most of the shares is riskier for banks than for suppliers.
From the side of borrowers, given the non-financial motivation, anticipating the difficulty of obtaining financing from banks, firms in which the dominant shareholders have higher proportions of control rights have to rely more on trade credit in their financing strategies than those in which the dominant shareholders have lower proportions of control rights. In this case, higher trade credit is a suboptimal financing strategy for firms in which the largest owner controls most of shares due to unavailable bank credit. However, once they have opportunity to obtain bank credit, these firms will rearrange their trade credit policies and reduce the use of trade credit. But for firms with lower owners’ control right proportion, obtaining bank credit should not affect the use of trade credit because their trade credit policies are independent of their financial positions.
Using data from a survey of enterprise in China, we first compare the account payable percentage (as a proxy of trade credit) between firms with higher and lower ownership concentration. We find that there is a significant difference of the account payable percentage in firms with higher ownership concentration, but no special difference in firms with lower ownership concentration. The regression results also show that bank credit has no effect on the account payable percentage when the ownership is relatively dispersed, but has a strong effect when the ownership concentration is relatively high and the effect becomes stronger as the ownership concentration increases. This result is robust after controlling for potential endogeneity, implicating that firms with higher ownership concentration have fewer possibilities to obtain bank credit, and thus rely more on trade credit in their financing strategies.
We also explore what role the ownership of the ultimate controller plays in determining SMEs’ trade credit policies. Previous studies have found that the ownership of the ultimate controller has an important influence on firms’ governance and thereby on financial decisions. In this paper, we examine how ownership of the ultimate controller affects the aforementioned relation. We find that, in firms with higher ownership concentration, the account payable percentage of privately controlled firms decreases significantly when bank credit is available, but keeps unchanged in state- and foreign- controlled firms when bank credit is available. This result can be partly attributable to the difference in governance. It implicates that the better governance can increase the firms’ probability of accessing bank credit and result in the independence of its trade credit policy.
Our study contributes to the related literature in two dimensions. Firstly, we explain the use of trade credit from the aspect of agency conflict. To the best of our knowledge, very few existing studies have attempted to explain trade credit from this perspective, with the exception of Bastos and Pindado (2007).1 Our study provides the empirical evidence that the agency conflict induced by ownership structure affects firms’ ability of borrowing from banks, which is an important reason for firms’ use of trade credit as a substitute for unavailable bank credit. Secondly, unlike previous studies in which most of the sample firms are listed companies, our study focus on the trade credit policy in SMEs. The ownership structure and financial policy in SMEs are different from those in listed companies. In SMEs, a few large owners always control most of the shares with very little monitoring by others, which may result in a more severe agency problem and thus a lower probability to access bank credit. On the other sides, the financing sources of SMEs, however, are relatively simple, which can help us to control other financing sources and explain the relationship between trade credit and bank credit well.
The rest of the paper is organised as follows. Section 2 reviews the related literature, Section 3 presents the methodology and describes the data, Section 4 analyses the results and Section 5 is the conclusion.
2Related literature reviewIn this section, we review the related studies on trade credit. Generally, the existing explanations of trade credit fall into two categories: explanations from the financial aspect and from the non-financial aspect. The financial explanation considers trade credit as a substitution financing strategy when traditional financing is unavailable (e.g. Burkart & Ellingsen, 2004; Garcia-Appendini & Montoriol-Garriga, 2013; Petersen & Rajan, 1994; Petersen & Rajan, 1997). The main reason why suppliers provide credit to customers when banks do not is that suppliers have a monitoring advantage over banks (Burkart & Ellingsen, 2004; Feenstra, Li, & Yu, 2014; Jain, 2001). This advantage arises due to the specialisation of suppliers, that is, suppliers are mostly engaged in the same transaction as the borrowers (Jain, 2001). Therefore, suppliers can more easily obtain information about their customers than banks which can only obtain information at a cost. In this case, suppliers should have more incentives than banks to lend to their customers.
Suppliers also have advantage in preventing the opportunism of borrowers and in extracting the liquidation value from the collateralised inputs in case of default (Burkart & Ellingsen, 2004; Fabbri & Menichini, 2010). Since suppliers only provide in-kind financing but not cash directly as banks done, it is difficult for borrowers to divert tangible input for their private use, and therefore, the opportunistic activity of borrowers can be prevented automatically. But it is difficult for banks to avoid borrowers’ opportunistic activity unless they pay extra monitoring costs. In another side, as Cuñat (2007) and Giannetti et al. (2011) argued, if the suppliers provide differentiated products and services to firms, especially when they are vital to borrowers’ business for lacking alternative producers, the borrowers have less incentive strategically to default on the suppliers than on the banks because the switch cost is too high. Hence, the potential moral hazard cost for the suppliers of differentiated products and services is less than for banks.
The collateralised inputs are also more valuable to suppliers than to banks. If the borrowers default, suppliers can seize the input and resell it at a lower cost using their networks, whereas banks must pay more costs to extract the same value from liquidation (Mian & Smith, 1992; Petersen & Rajan, 1997). This comparative advantage of suppliers over banks, as Giannetti et al. (2011) argued, depends on the type of product. Standardised products have a reference price and all lenders can resell them at a similar price. While, for differentiated products, suppliers have collateral advantages over banks. Most of these products are tailored for specific customers and the price is not opened, thus it is difficult for banks to resell them as suppliers do.
The comparative advantage incents suppliers providing credit to their customers when banks do not. Considerable studies also provide the empirical evidence that firms which have the advantage in accessing financial market, for instance, large and creditworthy firms, can obtain the outside financing source at a lower cost and reallocate it, as the form of trade credit, to small, financially constrained firms (Kashyap, Stein, & Wilcox, 1993; Love et al., 2007; Shenoy and Williams, 2017). And the use of trade credit is more popular during the financial crisis and monetary contracting period. For example, Coulibaly, Sapriza, and Zlate (2013) use data from manufacturing firms in six Asian emerging markets during the global financial crisis to study the role of the credit crisis and conclude that firms using more inter-company lending but not bank credit exhibit relatively higher sales. Lin and Chou (2015) employing Chinese firms’ data explore how the recent global financial crisis affects the relation between trade credit and bank loans, and highlight the substitution relationship between bank credit and the demand for trade credit. Casey and O’Toole (2014) use the SMEs’ data from the survey on euro area firms to examine the impact of the credit ration on the use of trade credit, who give the conclusion that trade credit from supply partners is likely to play a substitute role for bank credit in lending-constrained firms. In other words, they tend to rely more on trade credit.
Another strand studies think that trade credit plays a non-financial role in business course. For instance, trade credit is used as a means of price discrimination when it is illegal (Brennan, Maksimovic, & Zechner, 1988; Mian & Smith, 1992). By offering different credit terms to different customers, suppliers can offer preferential treatments to important customers, through which the suppliers can exploit more market power. Sometimes, however, the market power is controlled by the buyers but not the suppliers. In this case, large and creditworthy firms (which always have more market power) can squeeze their small suppliers and use a large volume of trade credit even though they are not credit constrained (Giannetti et al., 2011; Klapper, Laeven, & Rajan, 2012)
Trade credit can also be used as a guarantee of products quality (Engemann, Eck, & Schnitzer, 2014; Kim & Shin, 2012; Lee & Stowe, 1993; Long, Malitz, & Ravid, 1993). Asymmetric information on product quality between suppliers and their buyers may preclude the purchasing of products. With trade credit, if the product cannot fulfil the buyer's expectation, the buyer can refuse payment and return the merchandise with little cost. Buyers who pay early bear the product risk. Trade credit, in this case, can be used as a warranty of product quality, which endows the buyers an option to refuse payment when the product has a quality risk. So firms whose suppliers in industries that product quality has more asymmetric information may use more trade credit than others (Giannetti et al., 2011; Lee & Stowe, 1993).
Previous literature explains the using of trade credit from the perspectives of financial and non-financial motivation. In this paper, we extend the related literature by examining whether and how firms’ ownership structure affects their trade credit policies through influencing the availability of bank credit. However, as Cuñat (2007) proved both in the theoretical and empirical ways, given their financial situation, the firms in our paper are assumed to make the optimal trade credit policies according to their financial and non-financial motivations simultaneously.
3Data and specification3.1Data collectionThe data used in this study are from the World Bank's enterprise survey. The survey collects data from key manufacturing and service sectors in every region of the world, through which the constraints to private sector growth and significant business environment can be assessed. The survey follows a stratified random sampling methodology, and uses standardised survey instruments and a uniform methodology to minimise the measurement error.
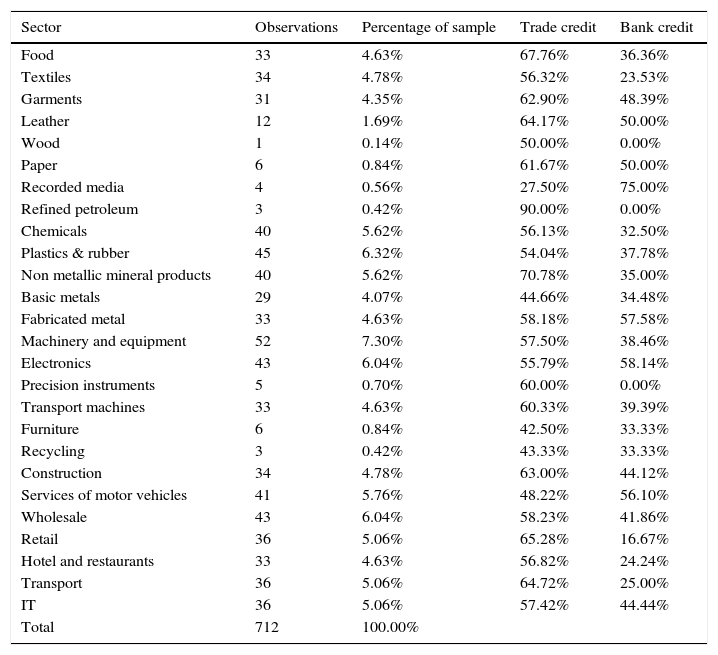
The enterprise survey for China was carried out between December 2011 and February 2013. Data were collected from 25 cities and 27 industries with a restriction on minimum firm size, where the size is defined by the number of employees. The minimum number of employees in the survey is set at five for all industries. The initial sample includes 2700 firms, of which 1916 firms are SMEs2 according to the classification of World Bank. After eliminating missing data in all of the variables, a total of 712 observations are included in our study. Table 1 shows the sectoral distribution of the sample firms, the average use of trade credit and the proportion of firms accessing bank credit in each industry.
Sectoral distribution of the sample and the use of trade credit and bank credit by industry.
| Sector | Observations | Percentage of sample | Trade credit | Bank credit |
|---|---|---|---|---|
| Food | 33 | 4.63% | 67.76% | 36.36% |
| Textiles | 34 | 4.78% | 56.32% | 23.53% |
| Garments | 31 | 4.35% | 62.90% | 48.39% |
| Leather | 12 | 1.69% | 64.17% | 50.00% |
| Wood | 1 | 0.14% | 50.00% | 0.00% |
| Paper | 6 | 0.84% | 61.67% | 50.00% |
| Recorded media | 4 | 0.56% | 27.50% | 75.00% |
| Refined petroleum | 3 | 0.42% | 90.00% | 0.00% |
| Chemicals | 40 | 5.62% | 56.13% | 32.50% |
| Plastics & rubber | 45 | 6.32% | 54.04% | 37.78% |
| Non metallic mineral products | 40 | 5.62% | 70.78% | 35.00% |
| Basic metals | 29 | 4.07% | 44.66% | 34.48% |
| Fabricated metal | 33 | 4.63% | 58.18% | 57.58% |
| Machinery and equipment | 52 | 7.30% | 57.50% | 38.46% |
| Electronics | 43 | 6.04% | 55.79% | 58.14% |
| Precision instruments | 5 | 0.70% | 60.00% | 0.00% |
| Transport machines | 33 | 4.63% | 60.33% | 39.39% |
| Furniture | 6 | 0.84% | 42.50% | 33.33% |
| Recycling | 3 | 0.42% | 43.33% | 33.33% |
| Construction | 34 | 4.78% | 63.00% | 44.12% |
| Services of motor vehicles | 41 | 5.76% | 48.22% | 56.10% |
| Wholesale | 43 | 6.04% | 58.23% | 41.86% |
| Retail | 36 | 5.06% | 65.28% | 16.67% |
| Hotel and restaurants | 33 | 4.63% | 56.82% | 24.24% |
| Transport | 36 | 5.06% | 64.72% | 25.00% |
| IT | 36 | 5.06% | 57.42% | 44.44% |
| Total | 712 | 100.00% |
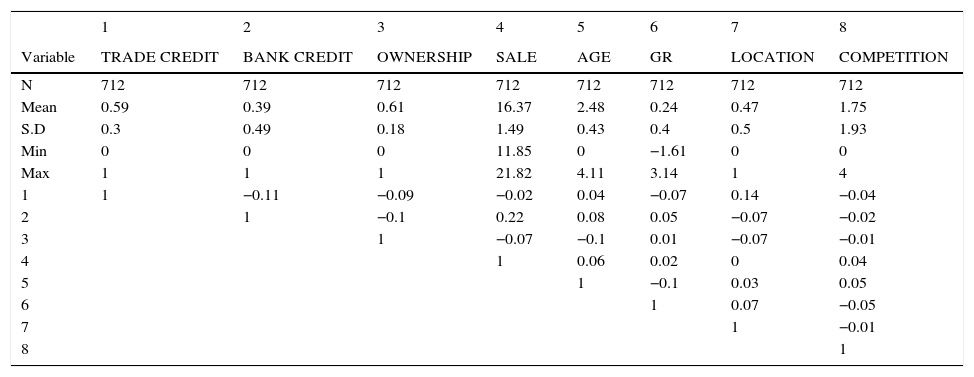
The definitions of all the variables used in the paper are collected in Table A1. Ownership concentration (OWNERSHIP) is measured by the proportion of share of the largest owner. As shown in Table 2, the average proportion of shares held by largest owner is 0.61, indicating that most of the shares in SMEs are controlled by the largest owner. The higher ownership concentration means the less monitoring from small shareholders and relatively higher agency cost.
Descriptive statistics and Pearson correlations.
| 1 | 2 | 3 | 4 | 5 | 6 | 7 | 8 | |
|---|---|---|---|---|---|---|---|---|
| Variable | TRADE CREDIT | BANK CREDIT | OWNERSHIP | SALE | AGE | GR | LOCATION | COMPETITION |
| N | 712 | 712 | 712 | 712 | 712 | 712 | 712 | 712 |
| Mean | 0.59 | 0.39 | 0.61 | 16.37 | 2.48 | 0.24 | 0.47 | 1.75 |
| S.D | 0.3 | 0.49 | 0.18 | 1.49 | 0.43 | 0.4 | 0.5 | 1.93 |
| Min | 0 | 0 | 0 | 11.85 | 0 | −1.61 | 0 | 0 |
| Max | 1 | 1 | 1 | 21.82 | 4.11 | 3.14 | 1 | 4 |
| 1 | 1 | −0.11 | −0.09 | −0.02 | 0.04 | −0.07 | 0.14 | −0.04 |
| 2 | 1 | −0.1 | 0.22 | 0.08 | 0.05 | −0.07 | −0.02 | |
| 3 | 1 | −0.07 | −0.1 | 0.01 | −0.07 | −0.01 | ||
| 4 | 1 | 0.06 | 0.02 | 0 | 0.04 | |||
| 5 | 1 | −0.1 | 0.03 | 0.05 | ||||
| 6 | 1 | 0.07 | −0.05 | |||||
| 7 | 1 | −0.01 | ||||||
| 8 | 1 |
Note: This table reports the number of observations, mean, standard deviation (S.D), minimum and maximum value for all variables used in this paper.
Similar to Demirgüç-Kunt and Vojislav (2001), in this paper, we use the account payable percentage to measure firms’ use of trade credit (TRADE CREDIT). Exactly, the proportion of the value of total annual purchases of material inputs or services that are paid after delivery is used to measure firms’ trade credit. Table 2 shows that the average percentage of account payable in SMEs is 0.59, indicating that most of the materials or services in SMEs are paid using trade credit.
We construct a dummy to measure the availability of bank credit (BANK CREDIT), which takes a value of 1 if a firm has a line of credit or loan from a financial institution, and 0 otherwise. The mean of the dummy is 0.39, indicating that on average, only 39% sample firms can access bank credit. Partially, the lower probability of accessing bank credit explains the higher proportion of account payable in the purchase. The detailed information on the use of trade credit and accessing bank credit for sample firms is reported in Table 1 by industry.
Except the ownership concentration and bank credit, we also control for the effect of firms’ characteristics on the use of trade credit, which includes the age (AGE), the growth rate (GR) and the sales of the sample firms (SALE). The age of a firm is measured by the natural logarithm of the number of years from the firm's establishment to 2011. The growth rate of a firm is measured by the log change in total sales and is computed from 2009 to 2011. The sales are measured by the natural logarithm of sales in 2011. To control the effect of the financial environment on firms’ financing strategy, we construct the dummy variable LOCATION, which takes a value of 1 if a firm is located in an official capital city of a province and 0 otherwise. In China, most of financial sources are concentrated in official capital cities. Therefore, firms those located in the official capital cities have higher possibilities to access bank credit than firms those located in other cities. Following Ayyagari, Demirgüç-Kunt, and Maksimovic (2010), we identify the number of competitors of the firm by using five competition dummies (0, 1, 2, 3 and 4) for one to three competitors, four to six competitors, seven to fifteen competitors, sixteen to one hundred competitors, and over one hundred competitors, respectively. We also include INDUSTRY dummies to control for the variations of potential factors across different industries. Table 2 reports the descriptive statistics result.
3.3SpecificationThe goal of our study is to examine whether and how ownership structure affects firms’ use of trade credit through influencing the availability of bank credit in SMEs. To achieve the goal, we construct the following regression model.

In the model, we use the variable of BANK CREDIT to examine the effect of accessing bank credit on firms’ use of trade credit. Previous studies find the evidence that trade credit is always used as a substitute for unavailable bank credit. If so, obtaining bank credit should result in a severe reduction of trade credit except the firms where trade credit policies are completely independent of their financial positions.
An interaction between BANK CREDIT and OWNERSHIP is used to explore how ownership structure affects firms’ use of trade credit by influencing the availability of bank credit. In SMEs, the higher ownership concentration always means the more agency cost, which in turn results in the lower possibilities of accessing bank credit. Therefore, firms with higher ownership concentration may use more trade credit in their business. In this case, firms’ trade credit policies partially depend on their financial positions, and they also have incentives to reduce the use of trade credit once bank credit is available. So, a significant and negative coefficient on the interaction between BANK CREDIT and OWNERSHIP indicates that firms with higher ownership concentration are more likely to reduce the dependence on trade credit when bank credit is available. In other words, the agency cost induced by the ownership structure results in the unavailable of bank credit and then influences the trade credit policy of firms.
4Empirical result4.1Univariate analysisTo examine how ownership structure affects the firms’ trade credit policy through influencing the availability of bank credit, we first divide the sample firms into two groups according to firms’ ownership concentration, and then use the T-test and Wilcoxon test to examine the difference of account payable percentage between firms those obtained bank credit and those not obtained under different groups. Here, firms are categorised in the group with higher ownership concentration if the control right proportion of the largest owner is higher than the median of the full sample, and in the group with lower ownership concentration if the proportion is lower than the median. Table 3 reports the univariate analysis result.
Result of univariate analysis.
| Variable | Lower ownership concentration | Higher ownership concentration |
|---|---|---|
| BANK CREDIT=0 | 0.633 | 0.580 |
| BANK CREDIT=1 | 0.590 | 0.463 |
| Difference | 0.043 | 0.117 |
| T-test | 1.509 | 3.057*** |
| Wilcoxon test | 1.598 | 2.867*** |
| Observations | 436 | 276 |
Note: This table reports the univariate analysis result on the effect of ownership structure on the firms’ trade credit policy through influencing the availability of bank credit. The firms are classified into two groups according to whether the control right proportion of the largest owner is higher (group with higher ownership concentration) or lower (group with lower ownership concentration) than the median of the full sample. BANK CREDIT is a dummy variable that takes a value of 1 if a firm has a line of credit or loan from a bank or other financial institution, and 0 otherwise. *, **, and *** indicate the 10%, 5% and 1% levels of significance, respectively.
The result in Table 3 shows that firms those obtained bank credit use less account payable in their purchase than those not obtained bank credit in both groups. However, the difference is not significant in the group with lower ownership concentration (T-test=1.509, Wilcoxon test=1.598). While the difference is significant in the group with higher ownership concentration (T-test=3.057, Wilcoxon test=2.867). On average, the account payable percentage in firms those obtained bank credit is less than those not obtained by 11.7% in the group with higher ownership concentration. This result indicates that firms with higher ownership concentration use less account payable in their purchases once bank credit is available, while firms with lower ownership concentration will not use bank credit as a substitute for trade credit even they can access bank credit. Partially, it implicates that the trade credit policies of firms with less agency conflict between firms and banks are independent of their financial positions.
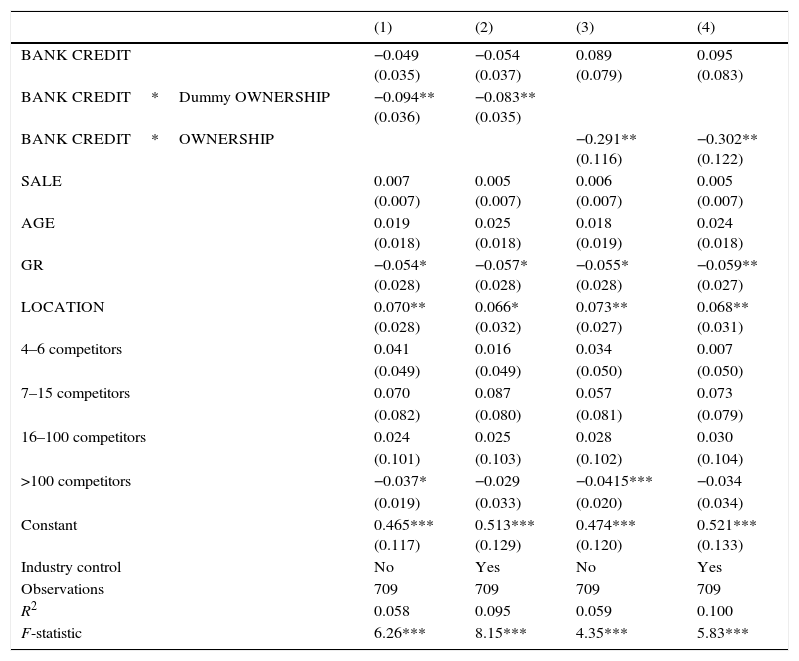
4.2Multivariate analysisIn this subsection, we examine how ownership concentration affects firms’ trade credit policy through multivariate analysis. In columns (1) and (2) of Table 4, we use a dummy as the key independent variable. While in columns (3) and (4), we use a continuous variable instead. We run two specifications for each set of regressions. The first only controls for firms’ characteristics except the key independent variable and the interaction; the second adds the industry effect to control for the industrial difference of the use of trade credit. Table 4 reports the estimated result.
The effect of ownership structure on the relation between bank credit and trade credit.
| (1) | (2) | (3) | (4) | |
|---|---|---|---|---|
| BANK CREDIT | −0.049 (0.035) | −0.054 (0.037) | 0.089 (0.079) | 0.095 (0.083) |
| BANK CREDIT*Dummy OWNERSHIP | −0.094** (0.036) | −0.083** (0.035) | ||
| BANK CREDIT*OWNERSHIP | −0.291** (0.116) | −0.302** (0.122) | ||
| SALE | 0.007 (0.007) | 0.005 (0.007) | 0.006 (0.007) | 0.005 (0.007) |
| AGE | 0.019 (0.018) | 0.025 (0.018) | 0.018 (0.019) | 0.024 (0.018) |
| GR | −0.054* (0.028) | −0.057* (0.028) | −0.055* (0.028) | −0.059** (0.027) |
| LOCATION | 0.070** (0.028) | 0.066* (0.032) | 0.073** (0.027) | 0.068** (0.031) |
| 4–6 competitors | 0.041 | 0.016 | 0.034 | 0.007 |
| (0.049) | (0.049) | (0.050) | (0.050) | |
| 7–15 competitors | 0.070 | 0.087 | 0.057 | 0.073 |
| (0.082) | (0.080) | (0.081) | (0.079) | |
| 16–100 competitors | 0.024 | 0.025 | 0.028 | 0.030 |
| (0.101) | (0.103) | (0.102) | (0.104) | |
| >100 competitors | −0.037* | −0.029 | −0.0415*** | −0.034 |
| (0.019) | (0.033) | (0.020) | (0.034) | |
| Constant | 0.465*** (0.117) | 0.513*** (0.129) | 0.474*** (0.120) | 0.521*** (0.133) |
| Industry control | No | Yes | No | Yes |
| Observations | 709 | 709 | 709 | 709 |
| R2 | 0.058 | 0.095 | 0.059 | 0.100 |
| F-statistic | 6.26*** | 8.15*** | 4.35*** | 5.83*** |
Note: This table reports the regression results on the effect of ownership structure on the relation between bank credit and trade credit. The regressions employed here are specified as TRADECREDITi=α+β1BANKCREDITi+β2BANKCREDITi*OWENERSHIPi+ControlVariables+εi. The dependent variable is the firms’ use of trade credit. Exactly, the proportion of the value of total annual purchases of material inputs or services that are paid after delivery is used to measure it. BANK CREDIT is a dummy variable that takes a value of 1 if a firm has a line of credit or loan from a bank or other financial institution, and 0 otherwise. The ownership concentration is indicated by Dummy OWNERSHIP (equals 1 for higher than the median ownership concentration of the full sample and 0 otherwise) in columns (1) and (2), and by the continuous variable defined by the proportion of shares of the largest owner in columns (3) and (4) instead. The other variable definitions are collected in Table A1 of Appendix. Robust standard errors clustered by industry are presented in brackets. *, **, and *** indicate the 10%, 5% and 1% levels of significance, respectively.
In columns (1) and (2), the coefficient on BANK CREDIT reflects the effect of obtaining bank credit on the use of trade credit in firms whose ownership concentration is lower than the median of the full sample. And the interaction between BANK CREDIT and dummy OWNERSHIP captures the difference of the substitution effect of bank credit on trade credit between the firms with higher ownership concentration and those with lower ownership concentration. The insignificant coefficient on BANK CREDIT, as shown in column (1), suggests that obtaining bank credit does not reduce the use of trade credit in the firms with lower ownership concentration. While the coefficients on the interaction between BANK CREDIT and dummy OWNERSHIP are significantly negative (at the 5% significant level), indicating that firms with higher ownership concentration have more incentives to reduce their trade credit once the bank credit is available. To be concrete, despite of the insignificant coefficient on BANK CREDIT, obtaining bank credit would result in the account payable percentage of the firms with higher ownership concentration decreasing by 9.4%. After considering the industry effect in column (2), the finding is robust.
In columns (3) and (4), we use a continuous variable instead of the dummy variable of ownership. In column (3), the coefficient on the interaction between BANK CREDIT and OWNERSHIP is -0.291 (significant at the 5% level). The result indicates that, on average, a 1% increase of ownership concentration results in the substitute effect of obtaining bank credit on the use of trade credit decreases by 2.91%, which remians robust after considering for the industry effect.
Concerning control variables, the coefficients of SALE and AGE are all insignificant. Although the coefficients of the competition dummies indicate that the number of competitors above 100 in columns (1) and (3) is significantly different with 0 at the 10% and 1% significance levels respectively, they turn out to be insignificant after considering the industry effect, which indicates that the competition dummies affect the use of trade credit in an insignificant way. The coefficients of the GR variable are negative and significant at the level of 10%, which means that the increase of growth rate on sales would result in the use of trade credit significantly decreases. However, the coefficients of GR are not robust in later regressions. Moreover, the coefficients on the LOCATION variable are all significantly positive (at the 10% significance level), which implies that firms in the official capital cities averagely use more trade credit than the other surveyed firms.
Generally, these results indicate that there is no substitutive relation between bank credit and trade credit in firms whose largest owner controls a relatively lower proportion of shares, but there is a significant substitute relationship when the largest owner controls most of the shares. An explanation of this finding is that it is relatively difficult for firms with higher ownership concentration to obtain bank credit because of the agency conflict between firms and banks, and these firms have to use trade credit as a substitute for the unavailable bank credit. Therefore, once bank credit is available, the firms would rearrange their trade credit. However, firms with relatively less ownership concentration have more possibility to obtain bank credit. Therefore, their trade credit policies are independent of the availability of bank credit.
4.3Robustness checksOne concern about the result in Table 4 is the issue of possible endogeneity. Biais and Gollier (1997) point out that trade credit is not only used as a substitute for unavailable bank credit but also a signal which could reduce the asymmetrical information between banks and firms and increase the possibility of accessing bank credit. Therefore, higher trade credit may associate with higher bank credit but not lower bank credit, which affects the causal relation between bank credit and trade credit.
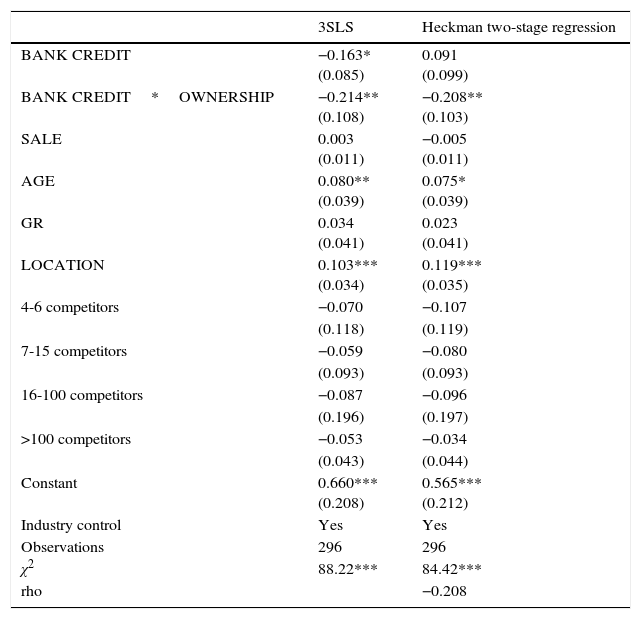
In this subsection, we use the three-stage least squares (3SLS) regression and Heckman two-stage regression to address the potential endogeneity problem. The 3SLS system consists of our trade credit model and a bank credit model. We model the bank credit as a function of trade credit, ownership concentration, growth rate, sales, age, location and collateral, where the collateral, following Ayyagari et al. (2010), is a dummy variable that equals 1 if the financing of the firm requires collateral and 0 if not. In the Heckman two-stage regression, the bank credit model mentioned above is used to reduce the sample selection bias. Table 5 reports the regression results. According to the data of World Bank, only 574 firms of the 1916 surveyed SMEs disclosed information of collateral in financing. For the presence of omitted data in the variables, there are only 296 observations used in the regressions.
Estimating results of robustness checks.
| 3SLS | Heckman two-stage regression | |
|---|---|---|
| BANK CREDIT | −0.163* (0.085) | 0.091 (0.099) |
| BANK CREDIT*OWNERSHIP | −0.214** (0.108) | −0.208** (0.103) |
| SALE | 0.003 (0.011) | −0.005 (0.011) |
| AGE | 0.080** (0.039) | 0.075* (0.039) |
| GR | 0.034 (0.041) | 0.023 (0.041) |
| LOCATION | 0.103*** (0.034) | 0.119*** (0.035) |
| 4-6 competitors | −0.070 | −0.107 |
| (0.118) | (0.119) | |
| 7-15 competitors | −0.059 | −0.080 |
| (0.093) | (0.093) | |
| 16-100 competitors | −0.087 | −0.096 |
| (0.196) | (0.197) | |
| >100 competitors | −0.053 | −0.034 |
| (0.043) | (0.044) | |
| Constant | 0.660*** (0.208) | 0.565*** (0.212) |
| Industry control | Yes | Yes |
| Observations | 296 | 296 |
| χ2 | 88.22*** | 84.42*** |
| rho | −0.208 |
Note: This table reports the regression results of the three-stage least squares (3SLS) regression and Heckman two-stage regression which are specified as TRADECREDITi=α+β1BANKCREDITi+β2BANKCREDITi*OWENERSHIPi+ControlVariables+εi, BANKCREDITi=ω+φ1TRADECREDITi+φ2OWENERSHIPi+φ3GRi+φ4SALEi+φ5CollateralDummyi+φ6LOCATIONi, and TRADECREDITi=α+β1BANKCREDITi+β2BANKCREDITi*OWENERSHIPi+ControlVariables+εi, BANKCREDITi=ω+φ1OWENERSHIPi+φ2GRi+φ3SALEi+φ4CollateralDummyi+φ5LOCATIONi respectively. Both model systems consist of the trade credit model aforementioned and a bank credit model. Here, the collateral dummy is added as an explanatory variable to the bank credit models of both regressions, which equals 1 if the financing of the firm requires collaterals and 0 if not. The dependent variable is the firms’ use of trade credit, which is indicated by the proportion of the value of total annual purchases of material inputs or services that are paid after delivery. BANK CREDIT is a dummy variable that takes a value of 1 if a firm has a line of credit or loan from a bank or other financial institution, and 0 otherwise. Ownership concentration (OWNERSHIP) is indicated by the proportion of share of the largest owner. The other variable definitions are collected in Table A1 of Appendix. Robust standard errors clustered by industry are presented in brackets. *, **, and *** indicate the 10%, 5% and 1% levels of significance, respectively.
From the estimates in column (1) in Table 5, we see that the coefficient on BANK CREDIT is significantly negative, but the coefficient on the interaction between BANK CREDIT and OWNERSHIP is still negative and significant at the 5% level. In addition, in column (2), after controlling for the sample selection bias, the coefficient on the interaction is also negative and significant. Generally, these results are consistent with the earlier finding and support the view that the higher ownership concentration leads to the higher substitution between bank credit and trade credit. In other words, the firms with higher ownership concentration use trade credit as a substitute for unavailable bank credit.
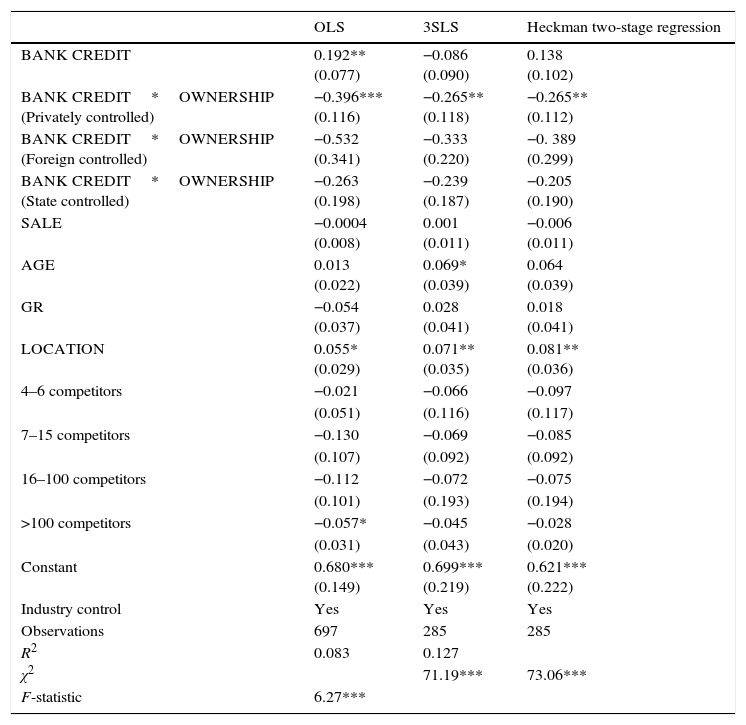
4.4The influence of the ultimate controllerIn this subsection, we examine whether the ownership of ultimate controller affects the effect of ownership concentration on trade credit. We construct an ultimate controller dummy that takes a value of 1, 2, or 3 if the largest shareholder of the firm is private, foreign, or state, respectively, and otherwise 0. The estimated result is shown in Table 6.
The effect of ownership of the controlling shareholder on the relation between bank credit and trade credit.
| OLS | 3SLS | Heckman two-stage regression | |
|---|---|---|---|
| BANK CREDIT | 0.192** (0.077) | −0.086 (0.090) | 0.138 (0.102) |
| BANK CREDIT*OWNERSHIP (Privately controlled) | −0.396*** (0.116) | −0.265** (0.118) | −0.265** (0.112) |
| BANK CREDIT*OWNERSHIP (Foreign controlled) | −0.532 (0.341) | −0.333 (0.220) | −0. 389 (0.299) |
| BANK CREDIT*OWNERSHIP (State controlled) | −0.263 (0.198) | −0.239 (0.187) | −0.205 (0.190) |
| SALE | −0.0004 (0.008) | 0.001 (0.011) | −0.006 (0.011) |
| AGE | 0.013 (0.022) | 0.069* (0.039) | 0.064 (0.039) |
| GR | −0.054 (0.037) | 0.028 (0.041) | 0.018 (0.041) |
| LOCATION | 0.055* (0.029) | 0.071** (0.035) | 0.081** (0.036) |
| 4–6 competitors | −0.021 | −0.066 | −0.097 |
| (0.051) | (0.116) | (0.117) | |
| 7–15 competitors | −0.130 | −0.069 | −0.085 |
| (0.107) | (0.092) | (0.092) | |
| 16–100 competitors | −0.112 | −0.072 | −0.075 |
| (0.101) | (0.193) | (0.194) | |
| >100 competitors | −0.057* | −0.045 | −0.028 |
| (0.031) | (0.043) | (0.020) | |
| Constant | 0.680*** (0.149) | 0.699*** (0.219) | 0.621*** (0.222) |
| Industry control | Yes | Yes | Yes |
| Observations | 697 | 285 | 285 |
| R2 | 0.083 | 0.127 | |
| χ2 | 71.19*** | 73.06*** | |
| F-statistic | 6.27*** |
Note: This table reports the reestimated results of the effect of ownership of the controlling shareholder on the relation between bank credit and trade credit under the empirical ways of the ordinary least squares (OLS) regression, the three-stage least squares (3SLS) regression and Heckman two-stage regression, respectively. The specifications are TRADECREDITi=α+β1BANKCREDITi+β2BANKCREDITi*OWENERSHIPi+ControlVariables+εi, for the OLS; TRADECREDITi=α+β1BANKCREDITi+β2BANKCREDITi*OWENERSHIPi+ControlVariables+εi, BANKCREDITi=ω+φ1TRADECREDITi+φ2OWENERSHIPi+φ3GRi+φ4SALEi+φ5CollateralDummyi+φ6LOCATIONi, for 3SLS; and TRADECREDITi=α+β1BANKCREDITi+β2BANKCREDITi*OWENERSHIPi+ControlVariables+εi, BANKCREDITi=ω+φ1OWENERSHIPi+φ2GRi+φ3SALEi+φ4CollateralDummyi+φ5LOCATIONi for the Heckman two-stage regression. The ultimate controller dummy is introduced that takes a value of 1, 2, or 3 if the largest shareholder of the firm is private, foreign, or state, respectively, and otherwise 0. For the presence of omitted data in the variables, there are only 285 observations used in the last two regressions. The dependent variable is the firms’ use of trade credit which is indicated by the proportion of the value of total annual purchases of material inputs or services that are paid after delivery. BANK CREDIT is a dummy variable that takes a value of 1 if a firm has a line of credit or loan from a bank or other financial institution, and 0 otherwise. Ownership concentration (OWNERSHIP) is indicated by the proportion of shares of the largest owner. Definitions of all other variables are collected in Table A1 of Appendix. Robust standard errors clustered by industry are presented in brackets. *, **, and *** indicate the 10%, 5% and 1% levels of significance, respectively.
Column (1) reports the OLS estimated results. We can see that the significantly positive coefficient on BANK CREDIT indicates that obtaining bank credit results in increasing of the use of trade credit. This result may be attributed to the adverse causality between bank credit and trade credit. The trade credit provided by suppliers, as Biais and Gollier (1997) noted, can be a signal to banks which may result in the higher possibility of accessing bank credit. In the latter analysis, we control the potential endogenity problem and examine this relation again.
The coefficient on the interaction between BANK CREDIT and OWNERSHIP is negative and significant in privately controlled firms. To be concrete, a 1% increase in ownership concentration in privately controlled firms results in that the substitute effect of obtaining bank credit on the use of trade credit decreases by 3.96%. Unlike the privately controlled firms, the coefficients on the interaction are insignificant in state- and foreign-controlled firms, indicating that obtaining bank credit does not decrease the use of trade credit in these firms. The explanation of the result is that the agency cost induced by ownership concentration in privately controlled firms is more severe than that in state- and foreign-controlled firms. In state-controlled firms, the government can provide the guarantee for bank credit, which reduces the risk of bank and the agency conflict between banks and firms. For foreign-controlled firms, the insignificant coefficient on the interaction between BANK CREDIT and OWNERSHIP may be attributed to a different reason. Firms in China controlled by a foreign shareholder always have relatively better corporate governance, which reduces the agency conflict between banks and firms directly. Overall, firms controlled by the state and foreigners may have higher probabilities in accessing bank credit, and therefore the trade credit policies in these firms is independence of their financial positions. The results, as shown in columns (2) and (3), are robust after controlling for the potential endogenity problem through the 3SLS system and Heckman two-stage regression, confirming our finding in column (1).
5ConclusionIn this paper, we examine whether and how the ownership structure affects the trade credit policy in small- and medium-sized enterprises (SMEs). Unlike large listed firms, in SMEs, a few large owners always control most of the shares but are minimally monitored, which leads to the severe agency conflict between banks and firms and thereby makes it harder for SMEs to access bank credit. We examine whether this agency conflict induced by the ownership structure influences the use of trade credit in SMEs.
Using survey data from Chinese enterprises, we find that trade credit in firms that obtained bank credit is significantly less than those not obtained bank credit when most of shares are controlled by the largest owner, and the effect is greater as the ownership concentration increases. It implicates that firms with higher ownership concentration have more difficulty in obtaining bank credit and use more trade credit as the substitute financial resource. We also find that the ownership of the ultimate controller has an important influence on the relation between bank credit and trade credit in SMEs. Our results show that, in the firms with higher ownership concentration, the use of trade credit in private firms decreases significantly when bank credit is available, whereas the use of trade credit keeps unchanged in firms controlled by the state or foreigners when bank credit is available. This partially implicates that better governance increases the firms’ probability of accessing bank credit and leads to the independence of trade credit policies from firms’ financial positions. Generally, our findings indicate that the ownership structure plays an important role in determining firms’ trade credit policies. It also provides a new explanation for the use of trade credit in SMEs.
Although the paper sheds some new light on the effect of ownership structure on the trade credit policy, it leaves several areas which could effectively be studied in the future. For instance, the use of trade credit could be different for the overall industries to a large extent so that additional interesting and meaningful findings could be achieved by a further discussion at the differences among industries. In addition, in the absence of detailed information on the financing choices of firms, we cannot employ controls such as liquidity measures and indicators of inventories to interpret the firms’ trade credit policy. Thus, more research is needed to test whether our findings are robust after introducing more control variables on firm characteristics. Finally, the empirical models do not capture the situations in which trade credit is “a constituent part of the pre-formulated wording of the sales contract” and a means of price discrimination when it is illegal. Further discussions of these non-financial explanations could be a fruitful area of study and we would like to consider it as a potentially interesting direction for future research.
Conflict of interestThe authors declare that they have no conflicts of interest.
The authors acknowledge the editor of the ESPE and especially two anonymous referees for their valuable insights and suggestions which enormously benefited the paper. All remaining errors in this paper are our own.
Definitions of the variables.
| Variable name | Variable definition |
|---|---|
| Account payable percentage (TRADE CREDIT) | The proportion of the value of total annual purchases of material inputs or services that are paid after delivery |
| Bank credit dummy (BANK CREDIT) | A dummy variable that takes a value of 1 if a firm has a line of credit or loan from a bank or other financial institution, and 0 otherwise |
| Ownership concentration (OWNERSHIP) | The proportion of share of the largest owner |
| Ownership concentration dummy (Dummy OWNERSHIP) | A dummy variable that takes a value of 1 if the control right proportion of the largest owner in a firm is higher than the median of the full sample, and 0 otherwise |
| Sales of sample firms (SALE) | The natural logarithm of sales in 2011 measured in Yuan |
| Age of sample firms (AGE) | The natural logarithm of the period from the year of establishment up to 2011, measured in years |
| Growth rate of sample firms (GR) | The log change in total sales from 2009 to 2011 |
| Location dummy (LOCATION) | A dummy variable that takes a value of 1 if a firm is located in the official capital city and 0 otherwise |
| Competitors dummy (COMPETITION) | A dummy variable which takes a value of 0, 1, 2, 3 or 4, if a firm has 1 to 3 competitors, 4 to 6 competitors, 7 to 15 competitors, 16 to 100 competitors, or over 100 competitors, respectively |
Bastos and Pindado (2007) made similar research, in which they developed an agency model based on adverse selection and moral hazard to explain the trade credit policy, but did not explain the relation between bank credit and trade credit.