

Statistical analyses show that, after controlling for the accumulation of productive factors, the joint effect of the diversification of manufacturing inputs and the urban population purchasing power has a positive and significant impact on the Colombian economic growth. Furthermore, there is statistical evidence that shortages or deficiencies of public infrastructure and public services, as well as the violations of property rights diminish economic growth. These results are consistent with the Smithian vision of economic development.
Análisis estadísticos revelan que, después de controlar por la acumulación de los factores productivos, el efecto conjunto de la diversificación de los insumos manufactureros y la capacidad de compra de la población urbana tiene un impacto positivo y significativo en el crecimiento económico colombiano. Además, se ofrece evidencia estadística de que los recortes o deficiencias de la infraestructura pública y de los servicios públicos, así como las violaciones de los derechos de propiedad disminuyen el crecimiento económico. Estos resultados son consistentes con la visión smithiana del desarrollo económico.
Based on his analysis of the first industrial revolution, Adam Smith (1776) stated that division of labour and extent of the market are both key determinants of economic development. By division of labour Smith understood the diversity of productive activities; and by extent of the market he meant the purchasing power of an integrated community (the effective demand). In his vision, Smith put forward the hypothesis of the circular causation of income: technological change and product diversification increase productivity, expand the production scale, increase income and enhance economic growth. These processes, however, cannot unfold if the increased supply is not matched by an increased effective demand which can only be derived from economic activities where the distribution of remunerations to productive factors is sufficiently homogeneous. In that sense, the extent of the market limits the division of labour. Therefore, the combined effects of productive diversification and effective demand push economic growth in a virtuous circle in spiral form that goes from supply to demand and vice versa. Besides this economic dynamics, Smith proposed that markets do not work without a functional institutional context. He claimed specifically that the government duties for the general well-being of individuals and the best operation of firms are the following: (1) the protection of citizens from violence, (2) the administration of justice, and (3) the provision of public works and public institutions of social interest.1
This is in a nutshell the Smithian vision of economic development. This paper contends that it fits well to the Colombian experience of economic growth. In fact, the statistical analyses carried out here cannot reject the hypotheses that, after controlling for the accumulation of productive factors, the productive diversification, the population purchasing power, the public infrastructure and the respect to property rights impinge decisively on the economic growth of Colombia.
All of these determinants of economic growth have been considered and tested with the exception of effective demand. This paper aims at filling this gap. We claim that effective demand is not only a determinant of the (short-run) economic activity level (Keynes, 1936), but also of the (long-run) economic growth trend.
Some qualifications are in order. It has been recently found that the diversification impact on multifactor productivity is stronger for technologically oriented productive activities, those producing “sophisticated” goods (Hausmann, Hwang, & Rodrik, 2006; Rodrik, 2007). Thus, some sectors characterized by this technological sophistication might lead the economy growth – as the manufacturing sector in the Colombian economy (Ortiz, Uribe, & Vivas, 2009). Hence, diversification of “sophisticated” goods as an engine of economic growth is an important qualification of the Smithian hypothesis, but it preserves its fatherhood.
The effective demand effect also needs some qualification. Smith himself claimed that big cities, where economic activity and population are concentrated in order to take advantage of scale and agglomeration economies, generate the bulk of aggregate demand. Hence, the urban component of effective demand is decisive.
After this introduction, the second section explores the Smithian vision of economic development; the third section analyzes the importance of domestic demand for economic growth with a reference to the Colombian case; the methodological approach is described in the fourth section; the main determinants on the Colombian economic growth are statistically analyzed in the fifth section; the sixth section closes this paper with some conclusions.
2The Smithian theory of economic developmentAdam Smith opens his magnum opus, An Inquiry into the Nature and Causes of the Wealth of Nations, with the following sentence: “The greatest improvement in the productive powers of labour, and the greater part of the skill, dexterity, and judgement with which it is anywhere directed, or applied, seem to have been the effects of the division of labour” (Smith, 1776, I, I [1910,I, 4]).
This statement is indicative of the importance that Smith assigned to division of labour as an engine of development. By division of labour he understood not only the division of activities along a factory production chain (the technical division of labour), but also the diversity of activities within a community, where the allocation of labour is defined by some authority or a market system (the social division of labour).
The technical division of labour is illustrated by Smith with his famous analysis of the pin factory; in this case, labour cooperation is the key factor to increase labour productivity. Smith claims that social division of labour has the same effect on the society's productivity: “In every other art or manufacture, the effects of the division of labour are similar to what they are in this very trifling one [the pin production]; though, in many of them, the labour can neither so much subdivided, nor reduced to so great a simplicity of operation. The division of labour, however, so far as it can be introduced, occasions, in every art, a proportionable increase in the productive powers of labour. The separation of different trades and employments from one another seems to have taken place in consequence of this advantage. This separation, too, is generally carried furthest in those countries which enjoy the highest degree of industry and improvement; what is the work of one man in a rude state of society being generally that of several in an improved one” (Smith, 1776, I, I [1910,I, 5–6]).
As Leontief (1963) would prove it almost two centuries later, Smith states that a country's degree of economic development is directly related to its own degree of productive diversification.
With division of labour, Smith argued, the production scale is increased and real income grows. This is the supply side. But the demand side is also important. Our author warned that the extent of the market limits the scope of division of labour: “As it is the power of exchanging that gives occasion to the division of labour, so the extent of this division must always be limited by the extent of that power, or, in other words, by the extent of the market. When the market is very small, no person can have any encouragement to dedicate himself entirely to one employment (…). There are some sorts of industry, even of the lowest kind, which can be carried out on nowhere but in a great town” (Smith, 1776, I, III [1910,I, 15]).
By extent of the market Smith meant the purchasing power of the population in an integrated community. The last quotation reveals the importance that Smith assigned to big cities as places of high demand. Consequently, according to Smith, division of labour and extent of the market are both key determinants of economic growth. Although the main impulse for economic growth comes from productive differentiation and technological change – the supply side, the population purchasing power – the demand side – should also come along in order to sustain the growth process. This viewpoint is beautifully summarized as follows: “No society can surely be flourishing and happy, of which the far greater part of the members are poor and miserable” (Smith, 1776, I, VIII [1910,I, 70]).
In a positive sense, this sentence implies that a broad-based demand is required to develop the economy and increase social welfare.
According to Smith, the transport system is decisive for integrating a commercial community:
“As by means of water-carriage a more extensive market is opened to every sort of industry than what land-carriage alone can afford it, so it is upon the sea-coast, and along the banks of navigable rivers, that industry of every kind naturally begins to subdivide and improve itself, and it is frequently not till a long time after that those improvements extend themselves to the inland parts of the country” (Smith, 1776, I, III [1910,I, 16]).
With respect to government functions, Smith summarizes his viewpoints in the following quotations:
“Commerce and manufactures can seldom flourish long in any state which does not enjoy a regular administration of justice, in which the people do not feel themselves secure in the possession of their property, in which the faith of contracts is not supported by law, and in which the authority of the state is not supposed to be regularly employed in enforcing the payment of debts from all those who are able to pay. Commerce and manufactures, in short, can seldom flourish in any state in which there is not a certain degree of confidence in the justice of government” (Smith, 1776, V, III [1910,II, 392–393]).
“According to the system of natural liberty, the sovereign has only three duties to attend to; three duties of great importance, indeed, but plain and intelligible to common understandings: first, the duty of protecting the society from the violence and invasion of other independent societies; secondly, the duty of protecting, as far as possible, every member of the society from the injustice and oppression of every other member of it, or the duty of establishing an exact administration of justice; and, thirdly, the duty of erecting and maintaining certain public works and certain public institutions which it can never be for the interest of any individual, or small number of individuals, to erect and maintain; because the profit could never repay the expense to any individual or small number of individuals, though it may frequently do much more than repay it to a great society” (Smith, 1776, IV, IX [1910,II, 180–181]).
Hence, the guaranty and defence of property rights are necessary conditions for economy prosperity; and provision and maintenance of public goods are government functions whose social value is far greater than its private value.
After the Wealth of Nations, the vision of economic unfolding as a process of circular income causation was abandoned or neglected. The classical approach to economic analysis was more interested in the distribution mechanism; Ricardo (1817) stated that the main problem in political economy was the determination of income distribution. And the neoclassical analyses were mainly devoted to characterize the competitive general equilibrium. More than a century and a half after the Wealth of Nations, Allyn Young (1928) rescued the Smithian vision of economic development in order to explain the boom of the United States economy within the context of the second industrial revolution. His paper shined as a lightning, but it was soon forgotten. This is not surprising. After the Big Recession, the macroeconomic theory derived firmly towards the short-term analysis. The macroeconomic approach based on the short-run effect of effective demand (Keynes, 1936) became the mainstream, and the Smithian theory of economic development went again underground. Notwithstanding, the Keynesian analysis of economic growth explicitly included the dynamic role of effective demand; this is the case of the Harrod–Domar model (Domar, 1946; Harrod, 1939). Still, the whole Smithian analysis of economic growth was neglected. Rosenstein-Rodan (1943) and Nurkse (1953) made another attempt to rescue the vision of the circular causality of supply and demand as a key mechanism of the countries’ economic take-off: the “Big Push” theory of economic development claimed that many simultaneous industrial investments taking advantage of scale economies might support each other through pecuniary externalities (income generated in one sector generates demand for other sectors and vice versa). Schumpeter (1934) examined the importance of technological innovation and productive diversification under the entrepreneurs command in order to reach scale economies and enhance economic growth. To explain further how underdeveloped countries take the economy off, Hirschman (1958) pointed out to the dynamic impacts of investment and consumption – demand variables – with his argument of economic linkages: an investment today enables future investments through backward and forward linkages, and by increasing the purchasing power of the population (consumption linkages) and the government revenues (fiscal linkages). Hirschman also revealed the existence of political linkages: the expenditure response to political demands for public goods.2Prebisch (1950), Kaldor (1961, 1966), Leontief (1963), and Chenery, Robinson, and Syrquin (1986) emphasized again on the importance of industrialization and structural change for economic development. A further step in the rescue operation of the Smithian vision of economic development was given by the endogenous growth theories. There exists a long list of relevant models: the model of increasing returns to scale derived from the externalities of scientific and technological knowledge (Romer, 1986); the growth models based on the external impacts of productive diversification (Aghion & Howitt, 1992; Romer, 1987, 1990); the growth models with learning-by-doing (Lucas, 1988; Matsuyama, 1992); the growth model with externalities from public government expenditure (Barro, 1990); and the mathematical modelling of the intuitions of Rosenstein-Rodan (1943) and Nurkse (1953) on the impacts of increasing returns and the purchasing power of the population on productivity and economic growth (Murphy et al., 1989a, 1989b).
Why has the neoclassical economic theory dismissed the importance of effective demand for economic development? Most neoclassical models assume the existence of a representative consumer who is characterized by homothetic preferences and non-satiation. Under these conditions, the economic models obey the so called Say's law: “supply creates its own demand”; regardless of income distribution, the productive activities generate incomes that ensure the realization of merchandises.
After Keynes most economists accept that short-run shortages of effective demand induce falls of economic activity. For the long-run period they usually believe that income and demand follow supply; the papers of Murphy et al. (1989a, 1989b) challenge this conventional wisdom within a neoclassical framework.3 The first one rescues the importance of scale economies at the industrial level and the pecuniary externalities from simultaneous or sequential industrial diversification; and the second one rescues the importance of industrial diversification and effective demand for economic activity. In this last paper an economic model is built where the Say's law might be broken. On the demand side, Murphy et al. assume non-homothetic preferences, a given satiation level on individual food consumption, and diversification of manufactured goods whose individual consumption is also characterized by satiation and diminishing desirability. Hence, the range of consumption goods increases with income, so that richer people consume all the same goods that poorer people do, plus some. The food sector produces with a unique decreasing returns technology. In the manufacturing sector, industrial diversification is carried out by monopolistic firms that assume some fixed costs in order to take advantage of scale economies. Under these circumstances, some minimum level of aggregate demand is required for new firms to cover the fixed costs. Hence, a high degree of income concentration may prevent industrialization – the economy might be stuck in a poverty trap. In this realistic theoretical setup, income distribution and thus the population purchasing power play an important role in economic development, as it was foreseen by Smith.
3The importance of domestic demandThe Smithian argument of the circular causation of income applies clearly for a closed economy; yet, it remains valid for a globalized economy: the experience of economic development has shown that even the economic takeoffs of the more export-oriented countries have had a strong basis on domestic demand (Chenery & Syrquin, 1975; Chenery et al., 1986). These authors estimated that over 70% of the economic growth of the newly industrialized countries was based on domestic demand.
In Colombia, exports accounted on average for 10% of GDP for most of the XX century (Villar & Esguerra, 2007); from “la Apertura” in 1990, when the Colombian government lowered commercial tariffs from an average level of 66% to 11% (Garay, 1998; Ocampo & Villar, 1992), to the end of the XX century such participation did not exceed 15% (Villar & Esguerra, 2007); and from 2000 to 2012 the national accounts show that exports have not exceeded the 15% of aggregate demand (DANE). Therefore, the Colombian domestic market generates nowadays at least 85% of aggregate expenditure. Moreover, based on impulse-response analysis, Alonso and Patiño (2007) found that available data for Colombia do not reject the hypothesis that economic growth has led exports and not the other way round – domestic demand has been decisive.
Murphy et al. (1989b) point out that the best example of the impact of domestic demand on industrialization and economic growth comes from the Colombian history. As a response to global growing demand, the tobacco production in the country experienced a boom between the mid-XIX century and the early XX century. There were several forms of production, but the activity was dominated by large plantations. Tobacco activity took place along the Magdalena River valley, especially in Ambalema (Tolima) and Carmen de Bolívar (Bolívar), and in the states of Santander, Cundinamarca and Cauca. Except for Cúcuta (Santander), whose tobacco exports were shipped through the Zulia River to the Catatumbo River and then to the Lake Maracaibo, all other regions used the Magdalena River as an export route. The journeys by steamboats to the Caribbean coast were long and costly. Now, by the end of the XIX century, the country's coffee production experienced a boom induced also by a growing world demand. As tobacco activity, the coffee production was located initially in the eastern part of the country: Santander and Cundinamarca. And this productive activity was also developed dominantly on large plantations. The survival of servile and semi-servile forms of production allowed revenue to be concentrated in the landowners hands. Therefore, the hacienda economy could not create a sound basis for the national economic takeoff. It only arose when the industrialization of Antioquia in the early XX century met the demand generated by the gold economy in the same Antioquia, and by the coffee economy that was developed with the “Antioqueña” colonization from the late XIX century to the early XX century. This colonization resulted in Antioquia and in the western coffee region – the old Caldas, Tolima in the foothills of the central mountain range, and the north of Cauca – in an economy of family units. They worked hard and increased productivity. Besides, the expansion of the Pacific Railroad from Cali to Buenaventura (1915), and the construction of the Buenaventura port terminal (1916), just after the opening of the Panama Channel (1914), diminished export costs and increased the profitability of coffee activity. As a result, coffee production moved towards the western part of the country. Coffee exports became the main national source of foreign currency for eight decades. And, more importantly, higher incomes, more homogeneously distributed, induced a growing domestic demand for domestic manufactures (Harbison, 1970; Murphy et al., 1989b; Ocampo, 1984, 1987, 1989).
If this demand effect on economic growth was true in the outset of the Colombian industrialization, could it be operating nowadays? We claim that the answer is affirmative. Since Colombia has urbanized rapidly, and most of the GDP is generated by large cities by exploiting scale and agglomeration economies, the following hypothesis is set: the purchasing power of the urban population has been a crucial determinant of the national economic growth.4,5
4The methodological approach4.1Output growth decompositionBased on Hall (1988), Ortiz, Uribe, and Vivas (2013) proposed the following decomposition of economic growth:
where GPIB is the output growth rate, GK is the weighted average of fixed capital growth and human capital growth, ¿ is the output elasticity of entrepreneurial factors, and GA is the productivity growth rate. This last term, in turn, depends on the growth of public assets. By public assets these authors understand the productive public goods as well as the government institutions that provide, supply or preserve those public goods. Moreover, they posit that entrepreneurial factors and productive public assets are complementary, so that the scarcity of the latter impinges on the efficiency of the earlier. Hence, given the existence of public fixed factors and restrictive institutional conditions, it is assumed that ¿ is positive but less than 1 (the economy exhibits decreasing returns to scale in entrepreneurial factors).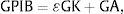
Ortiz et al. (2013) ran the corresponding economic growth regressions for the period 1955–2008 against a measure of entrepreneurial factor accumulation (the weighted average of fixed capital growth and human capital growth), a measure of industrial diversification (the GDP share of manufacturing inputs), a measure of transport infrastructure provision (the GDP share of transport output) and a measure of property rights violations (the kidnappings rate). They found that effectively the data do not reject the hypothesis of a less than unitary scale elasticity of entrepreneurial factors (0<¿<1); they also found a positive and significant relationship between the GDP share of manufacturing inputs and the economic growth rate; finally, both the GDP transport share and the kidnapping rate seem to be negatively related to the economic growth rate in a significant way. From these results they conclude that the provision of quality public goods is crucial for economic development – the economic role of the State is paramount; the sector of manufacturing inputs has been the real leader of the Colombian economic growth6; the negative impact of the transport GDP share on economic growth reflects the shortages and deficiencies of the national transport system; and kidnappings are the most damaging property rights violations for economic growth.
All the Smithian determinants of economic development were taken into account by Ortiz et al. (2013) with the exception of the population purchasing power. They even considered that the Colombian economy has been subject to strong distributive restrictions. Moreover, they stated that these restrictions have impacted negatively on economic growth. Yet, they did not include any measure of income distribution or purchasing power in their regression analysis. This deficiency is corrected here.
4.2Measuring the population purchasing powerSome indicators reveal the strong distributive restrictions of the Colombian economy. MESEP (2012) estimated that the Colombian Gini index of income concentration fluctuated slightly around 56% from 2003 to 2010, one of the highest in Latin America.7 Besides this indicator, DANE (2014) estimated that 30.6% of Colombians is poor, and 9.1% is indigent. In the rural areas the situation is worse because almost half the population, 47%, is poor, and 23% is indigent. These indicators, however, underestimate poverty in terms of purchasing power, for 55% of Colombian workers earn remunerations equal or below to the minimum monthly wage (DANE, 2014).
Wealth has been also highly concentrated. Inequality of land ownership in Colombia has been persistent: the available GINI indices of land concentration (1960, 1970, 1984, 1997, 2002 and 2009) range from 0.80 to 0.89 (IGAC, 2012). The following quotation illustrates the huge concentration of land ownership at the beginning of the XXI century: “According to IGAC and CORPOICA, in 2002 0.4% of the owners, i.e. 15.273 persons, owned 61.2% of rural land registered in Colombia, equivalent to 47.147.680 hectares” (IGAC, 2012, 69). And under the Uribe government (2002–2010) the concentration of land ownership increased even further (Ibáñez & Muñoz, 2010).
Capital concentration is also high. By the mid-90s it was estimated that the Gini index of share ownership in Colombia was above 90% (Garay, 1998); and by the first lustrum of the XXI century, Bonilla and González (2006) estimated that 0.21% of shareholders owned 79.9% of shares in the Colombian stock market.
Regarding the distribution of human capital, there is also a huge social inequality in Colombia. Primary and secondary public education has been diminished both in relative coverage and quality. The space given away by the State has been filled by private supply with polarizing characteristics: poor quality education at low prices is provided for low and middle income population strata, and high-quality education at high prices is available for the upper income population stratum. As a result, the performance of Colombia in the PISA tests has been close to the lowest.
The indicators of wealth concentration of Colombia are not available on continuous time series. The National Survey on Income and Expenditures (ENIG-DANE) is not continuous either. With complete and continuous information on income distribution, wealth distribution and household spending, the purchasing power of the population could be directly measured. Given this impossibility, we use an alternative source of information: the Survey on Construction Licences (ELIC-DANE). This survey is available for the 56 biggest cities of the country from 1952 to 1996, and for the 77 biggest cities from 1998 up today. These cities have covered in these periods more that 90 percent of urban population. Taking into account the evolution of the Colombian urban population according to demographic censuses (DANE), the licensed square metres for lodging construction per citizen (M2PC) are estimated. This variable reveals the aggregate effective demand by estimating the urban population's purchasing power of a fundamental basic good: accommodation.
It could be considered that construction licences are primarily an indicator of housing marginal supply. This is true. However, in the long-run period supply and demand of new lodgings must be balanced, otherwise prices would adjust and the licence applications in subsequent periods would vary in direct relation to net demand. From that perspective, housing construction licenses express the builders’ expectations on the urban population purchasing power. And since buying a new house is by itself an investment in a basic durable good, this expenditure reveals the people's perception on their own wealth.
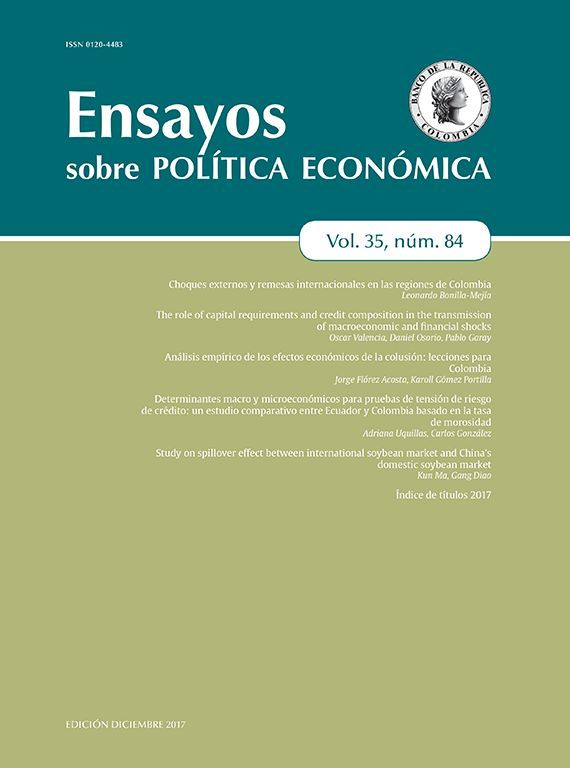
It could be argued that any kind of consumption expenditure is also an indicator of purchasing power. Surely this is so, but accommodation is one of the most important basic goods. By definition, a basic good should be individually consumed in at least a minimum amount per period of analysis. Thus, as for any other basic good, low income population spends relatively more in lodging that upper income population. This is the case for housing and ancillary services as is illustrated in Fig. 1.

The ENIG 2006–2007 estimated that the population of the 24 major Colombian cities spends on average 27% of their income on housing and ancillary services (water, electricity, gas and other fuels). The proportion of expenditure on accommodation amounts to 21.4%. Food spending, which is made up of expenditure on food and non-alcoholic beverages (15.1%) and spending in restaurants and hotels (9%), follows in order of importance; although aggregation of these two items would have a greater weight than the expenditure on accommodation, it is evident that the diversity of these goods prevents defining a simple measure of them, while accommodation is easily measured in terms of area. Therefore, since most of the working population earns subsistence wages, the population purchasing power ought to be highly correlated with the absorption capacity of new lodgings.
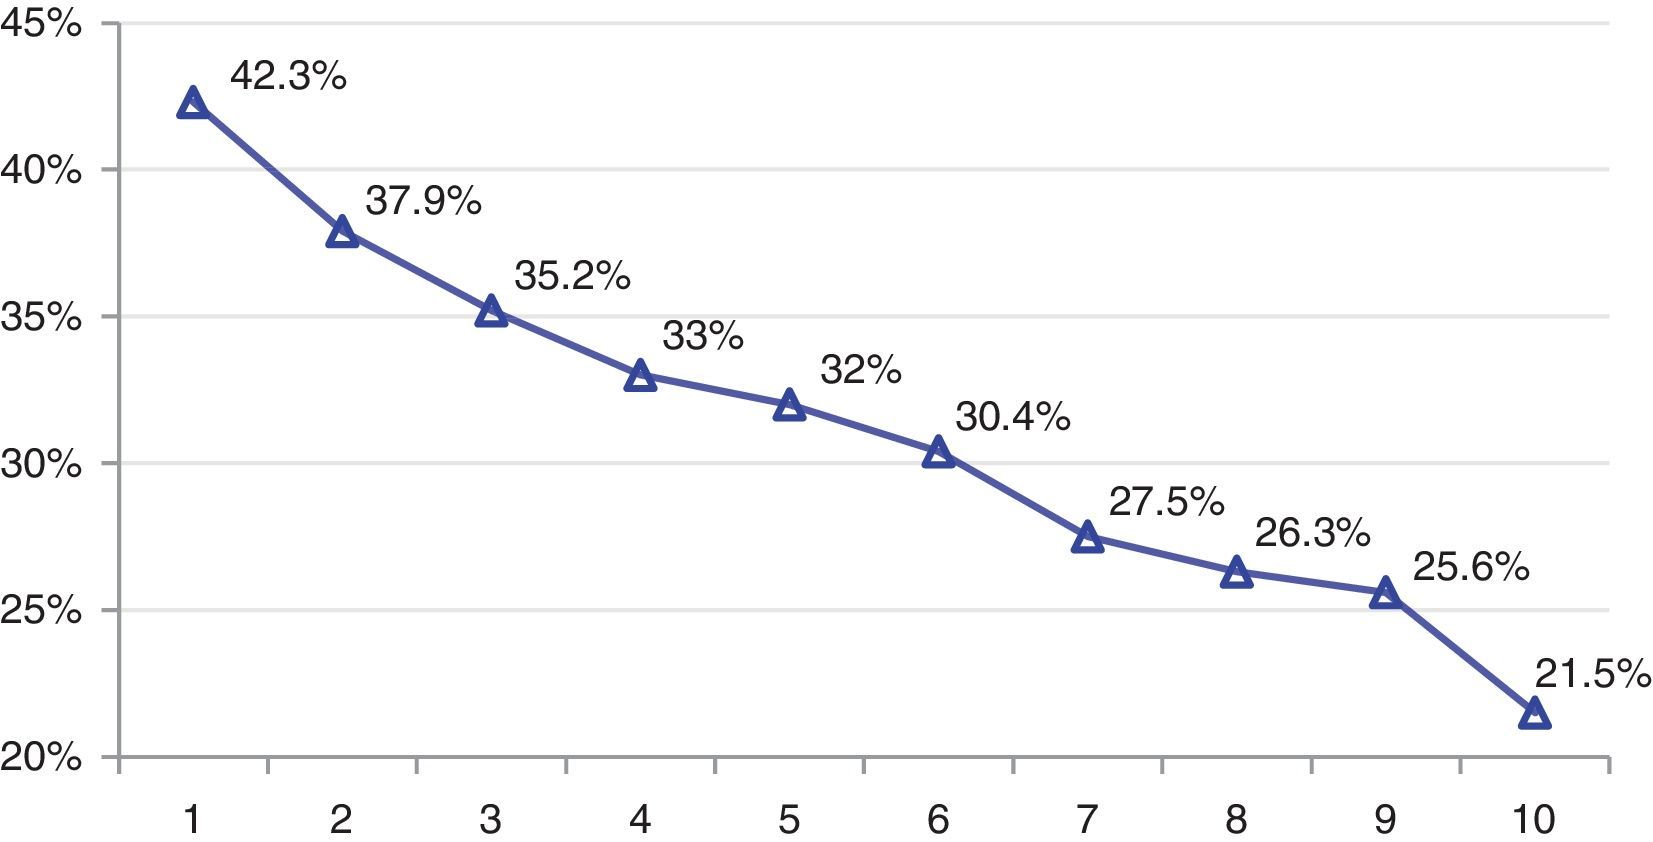
The evolution of new housing supply per urban inhabitant of Colombia (M2PC) is shown in Fig. 2 with the square markers. The units are square metres per city inhabitant. The corresponding trend [M2PC(HP)] is estimated with the Hodrick and Prescott filter. According to this indicator, the urban population purchasing power tends to increase in the fifties (from 0.27m2 in 1951 to 0.38m2 in 1961); it does not tend to increase in the last four decades of the XX century, rather it tends to diminish (it falls to 0.27m2 by 2000); and finally in the XXI century this variable tends to increase rapidly (it reaches 0.45m2 in 2012).

This evolution might be understood tentatively as follows. Up to 1961 the dynamics of the economic model of industrialization supported by the State was high enough to accommodate the urbanization process of Colombia (quality jobs grew, incomes grew, etc.). Hence, the urban purchasing power increased in the 1950s. From 1961 to 1970 the model showed some symptoms of exhaustion – tariff protection, credit subsidies and public investments were granted against no commitment by industrial entrepreneurs towards technological improvements or exports goals; besides, the demographic transition reached the highest rates of population growth (around 3% per year), the urbanization process kept its quick pace (urban population grew even faster), and the dependency on coffee exports for currency supply made crisis. Therefore, the urban purchasing power suffered a first deterioration in the 1960s. Since 1971 Colombia experienced the change of economic model for an increasingly open regime with abandonment by the State of many public assets (including industrial diversification); hence, the economy began a decelerated growth trend until the end of the century (the frozen economic structure did not create as many quality jobs as before). From 1972 to 1991, however, the indexed financial scheme (UPAC) compensated the diminishing trend of economic growth by directing savings towards the construction sector. Thus, in this period the trend of urban purchasing power stayed relatively still. The situation changed in the 1990s when “la Apertura” deepened the deindustrialization process (there was a huge flow of manufacturing imports), and the economic deceleration was also deepened; besides, by the mid-90s the Colombian Central Bank linked the UPAC to the interest rates, so that the increasing financial costs of this period broke massively the mortgage users by the end of the 1990s. Hence, the 1990s saw a further deterioration of the urban population purchasing power. The upturn of this variable in the XXI century is based on the economic recovery, the subsidy scheme for building construction, and the application of direct subsidies to low income families for lodging investment.
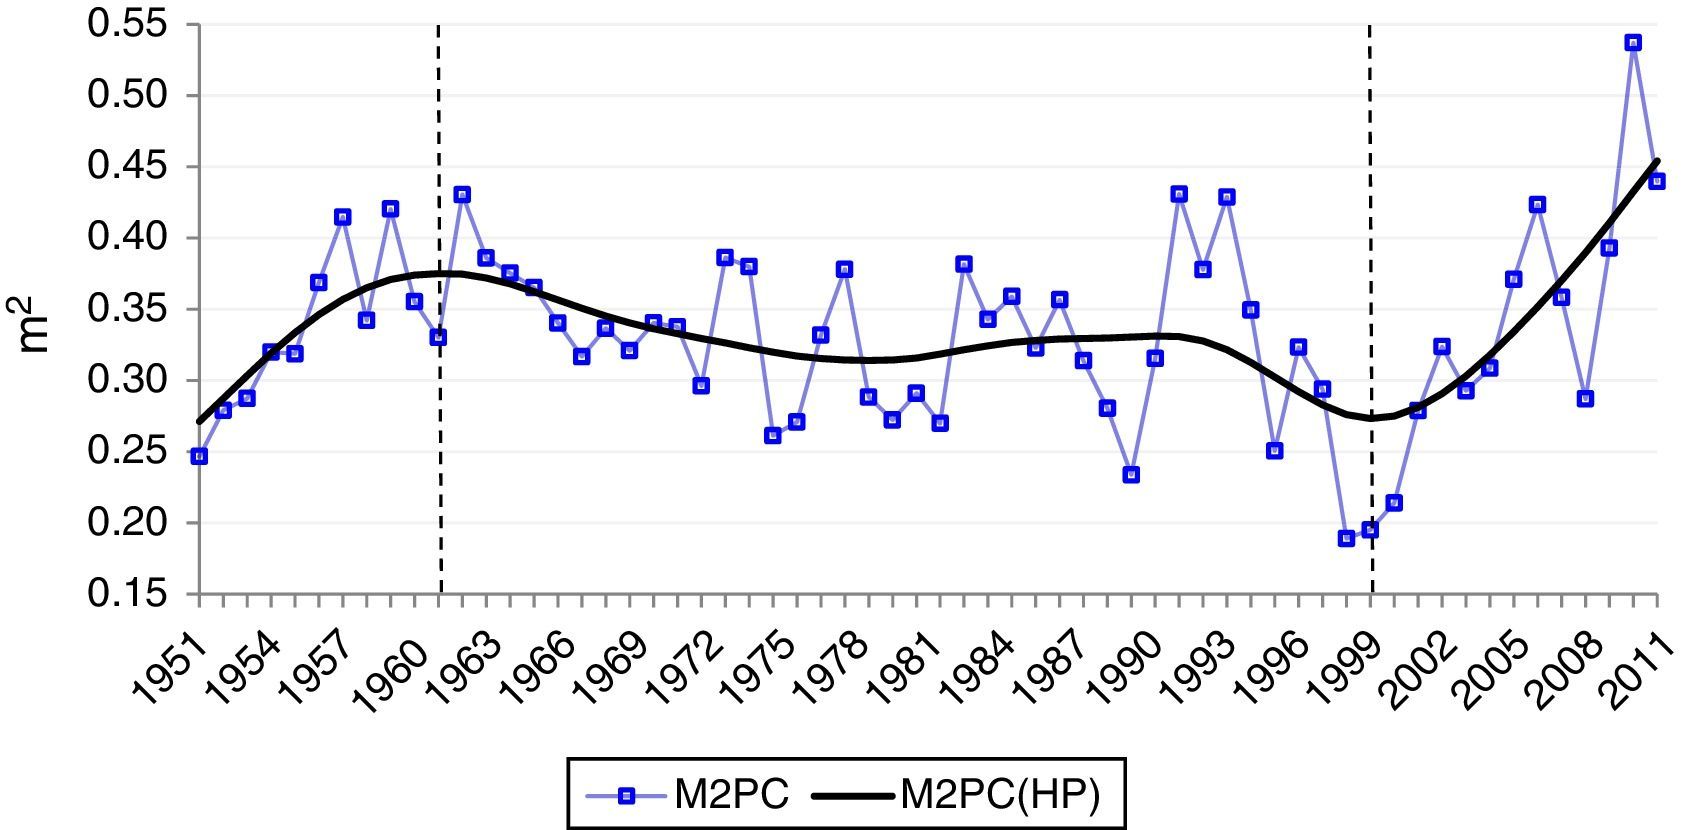
The series of the economic growth rate (GPIB) and the supply of new lodgings per urban inhabitant (M2PC) are jointly shown in Fig. 3.

The economic growth rate (GPIB) is represented by the dotted line and is measured as a percentage on the left axis; new lodging supply per urban inhabitant (M2PC) is represented by the line of square markers and is measured in square metres on the right axis. If this variable reflects the urban population purchasing power, it is possible to claim that there seems to be a high positive correlation between economic growth and effective demand.
5Econometric analysis5.1Economic growth regressionsThe purchasing power of urban population is treated as an omitted variable in the Colombian economic growth regressions of Ortiz et al. (2013). To run the regressions of economic growth (GPIB), it is necessary to estimate the growth of fixed capital (GKF), the growth of human capital (GKH) and the shares of fixed capital and human capital in the entrepreneurial production costs, so that the weighted growth rate of entrepreneurial factors is deduced (GK). Since the productivity growth (GA) is unknown, the regression uses instead its determinants. To begin with, the growth regression only explains the long-term growth rate. Therefore, a dummy variable (R) is used for the recessionary years between 1955 and 2012: it takes the value of 1 in 1999 and 2009, and 0 otherwise.8 It is also assumed that a growth regression may not include all the structural changes along time. Therefore, dummy variables for the seventies (D71–79), the eighties (D80–90), the nineties (D91–00) and the run time of the XXI century (D01–12) are used. Following a central tenet of the structuralist vision of economic development, it is assumed that the productivity growth rate is determined by the production structure of the economy (Ortiz et al., 2009). Therefore, the growth regression includes the GDP composition among 12 economic sectors: The primary sector comprises agriculture, fishing, hunting and forestry (VIVOS), and mining (MIN); the manufacturing sector comprises the agro-industrial activities (AGROIND), the production of manufacturing raw materials (MATPRIM), and the production of capital goods (BK); and the tertiary sector comprises construction (CONST), transport services (TRANSP), public utilities (PUB), government services (GOB), commercial services (CIO), financial services: Banking, insurance and other financial activities (FIN), and, finally, rental, other business services and personal services (ALQUILER). Since the sum of these participations is unity, the last is excluded from the growth regression in order to avoid collinearity. It is also recognized that violence can have a negative impact on economic growth; therefore the homicide rate (HOM) and the kidnapping rate (SEC) are included as explanatory variables. Finally, the generation of new lodgings per urban inhabitant (M2PC) is included in the growth regression as an explanatory variable.
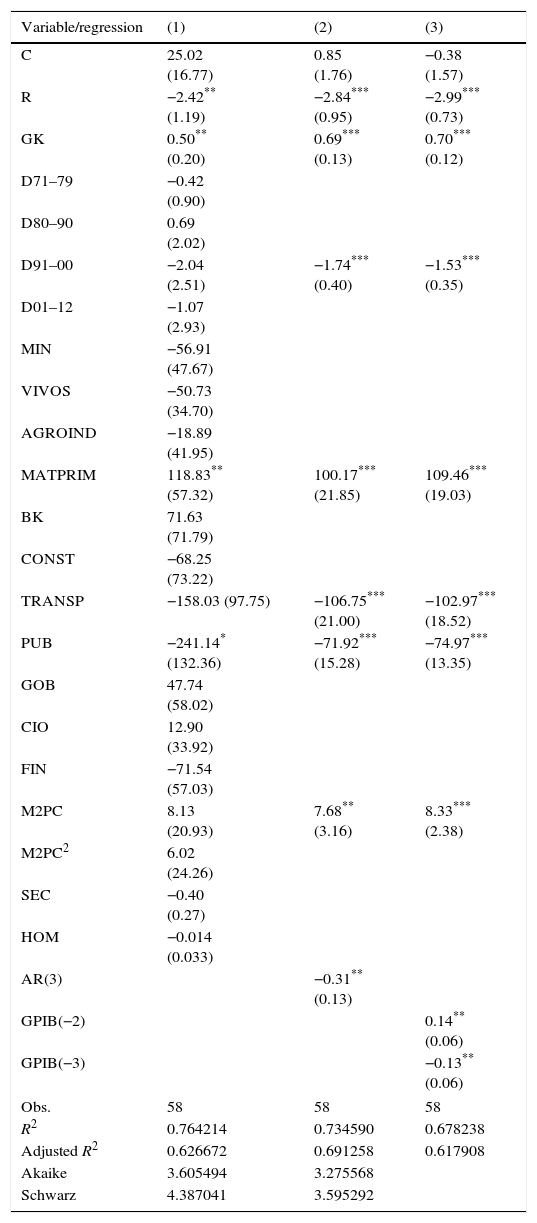
Table 1 shows the econometric estimates of the Colombian economic growth in a linear form. Regression 1 includes all available variables. By dropping step by step every non-significant variable and including a third order autoregressive term in order to control for autocorrelation, regression 2 is obtained. It follows from this regression that the recessive dummy (R) has a negative and significant effect on the economic growth rate. The weighted growth rate of entrepreneurial factors (GK) has a positive and significant effect on economic growth through the corresponding output elasticity, which is estimated positive but less than unity (the hypothesis that the aggregate production function is characterized by decreasing returns to scale in entrepreneurial factors, 0<¿<1, is not rejected by the data). The 1990s (D91–00) have a negative and significant impact on economic growth.9 From all manufacturing sectors only the sector producing industrial inputs (MATPRIM) has a positive and significant impact on economic growth; the coefficient attached to the transport services share (TRANSP) is estimated negative and significant; and the coefficient attached to the utilities share (PUB) is also estimated negative and significant. The homicide rate (HOM) and the kidnapping rate (SEC) seem to have a negative effect on economic growth, but the corresponding coefficients are not statistically significant.10 Finally, the supply of new lodgings per urban inhabitant (M2PC) has a positive and significant effect on economic growth. The third regression is the fully modified ordinary least squares estimation of the second regression. It is easily checked that the significant regressors of the second and third regressions are the same, and the estimated coefficients are quite similar.
Linear economic growth regressions (GPIB) Colombia 1955–2012.
| Variable/regression | (1) | (2) | (3) |
|---|---|---|---|
| C | 25.02 (16.77) | 0.85 (1.76) | −0.38 (1.57) |
| R | −2.42** (1.19) | −2.84*** (0.95) | −2.99*** (0.73) |
| GK | 0.50** (0.20) | 0.69*** (0.13) | 0.70*** (0.12) |
| D71–79 | −0.42 (0.90) | ||
| D80–90 | 0.69 (2.02) | ||
| D91–00 | −2.04 (2.51) | −1.74*** (0.40) | −1.53*** (0.35) |
| D01–12 | −1.07 (2.93) | ||
| MIN | −56.91 (47.67) | ||
| VIVOS | −50.73 (34.70) | ||
| AGROIND | −18.89 (41.95) | ||
| MATPRIM | 118.83** (57.32) | 100.17*** (21.85) | 109.46*** (19.03) |
| BK | 71.63 (71.79) | ||
| CONST | −68.25 (73.22) | ||
| TRANSP | −158.03 (97.75) | −106.75*** (21.00) | −102.97*** (18.52) |
| PUB | −241.14* (132.36) | −71.92*** (15.28) | −74.97*** (13.35) |
| GOB | 47.74 (58.02) | ||
| CIO | 12.90 (33.92) | ||
| FIN | −71.54 (57.03) | ||
| M2PC | 8.13 (20.93) | 7.68** (3.16) | 8.33*** (2.38) |
| M2PC2 | 6.02 (24.26) | ||
| SEC | −0.40 (0.27) | ||
| HOM | −0.014 (0.033) | ||
| AR(3) | −0.31** (0.13) | ||
| GPIB(−2) | 0.14** (0.06) | ||
| GPIB(−3) | −0.13** (0.06) | ||
| Obs. | 58 | 58 | 58 |
| R2 | 0.764214 | 0.734590 | 0.678238 |
| Adjusted R2 | 0.626672 | 0.691258 | 0.617908 |
| Akaike | 3.605494 | 3.275568 | |
| Schwarz | 4.387041 | 3.595292 | |
Note: Standard errors in parentheses.
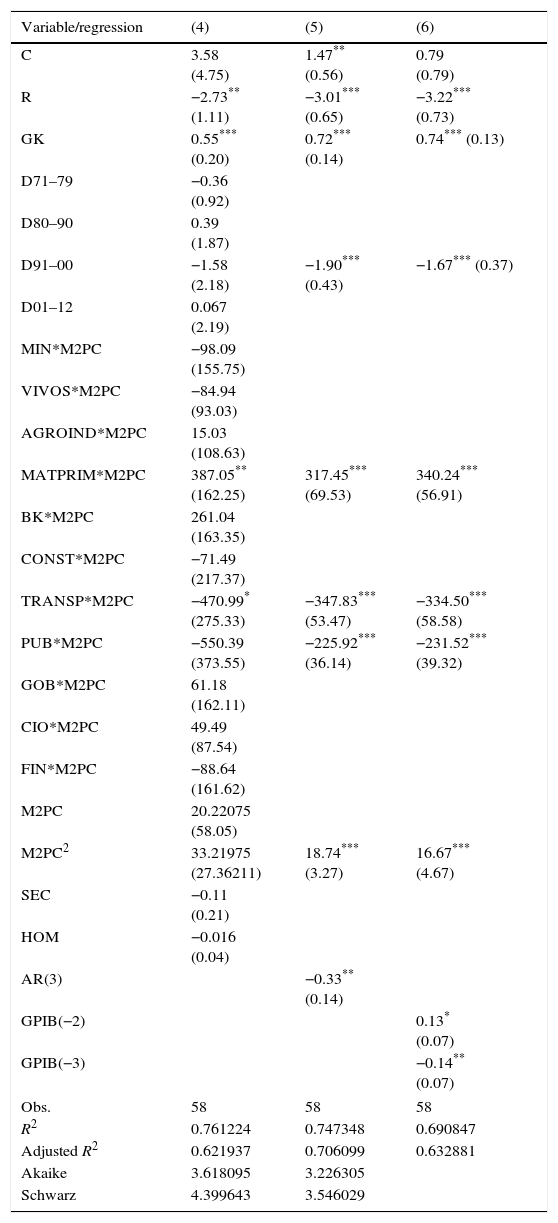
Regressions 4, 5 and 6 in Table 2 explore the possibility of interactive effects between the economic structure (the GDP shares) and the purchasing power of the urban population (M2PC) following the same methodology of regressions 1, 2 and 3. Regressions 4, 5 and 6 have the same significant variables, and they suggest that interaction between manufacturing input diversification and effective demand (MATPRIM*M2PC) has a positive and significant impact on economic growth – as Smith pointed out; the urban population purchasing power (M2PC) has by itself an accelerating impact on economic growth – the square expression has a positive and significant coefficient; and interaction of effective demand with transports services (TRANSP*M2PC) and public utilities (PUB*M2PC) have negative and significant impacts on economic growth – these results are thought to capture the negative externalities of the national public infrastructure's shortages and deficiencies.
Interactive economic growth regressions (GPIB) Colombia 1955–2012.
| Variable/regression | (4) | (5) | (6) |
|---|---|---|---|
| C | 3.58 (4.75) | 1.47** (0.56) | 0.79 (0.79) |
| R | −2.73** (1.11) | −3.01*** (0.65) | −3.22*** (0.73) |
| GK | 0.55*** (0.20) | 0.72*** (0.14) | 0.74*** (0.13) |
| D71–79 | −0.36 (0.92) | ||
| D80–90 | 0.39 (1.87) | ||
| D91–00 | −1.58 (2.18) | −1.90*** (0.43) | −1.67*** (0.37) |
| D01–12 | 0.067 (2.19) | ||
| MIN*M2PC | −98.09 (155.75) | ||
| VIVOS*M2PC | −84.94 (93.03) | ||
| AGROIND*M2PC | 15.03 (108.63) | ||
| MATPRIM*M2PC | 387.05** (162.25) | 317.45*** (69.53) | 340.24*** (56.91) |
| BK*M2PC | 261.04 (163.35) | ||
| CONST*M2PC | −71.49 (217.37) | ||
| TRANSP*M2PC | −470.99* (275.33) | −347.83*** (53.47) | −334.50*** (58.58) |
| PUB*M2PC | −550.39 (373.55) | −225.92*** (36.14) | −231.52*** (39.32) |
| GOB*M2PC | 61.18 (162.11) | ||
| CIO*M2PC | 49.49 (87.54) | ||
| FIN*M2PC | −88.64 (161.62) | ||
| M2PC | 20.22075 (58.05) | ||
| M2PC2 | 33.21975 (27.36211) | 18.74*** (3.27) | 16.67*** (4.67) |
| SEC | −0.11 (0.21) | ||
| HOM | −0.016 (0.04) | ||
| AR(3) | −0.33** (0.14) | ||
| GPIB(−2) | 0.13* (0.07) | ||
| GPIB(−3) | −0.14** (0.07) | ||
| Obs. | 58 | 58 | 58 |
| R2 | 0.761224 | 0.747348 | 0.690847 |
| Adjusted R2 | 0.621937 | 0.706099 | 0.632881 |
| Akaike | 3.618095 | 3.226305 | |
| Schwarz | 4.399643 | 3.546029 | |
Note: Standard errors in parentheses.
Regressions (1)–(6) show no statistical evidence of multicollinearity. Only equations (1) and (6), where all available regressors are included, do not pass the Breusch–Godfrey test of serial correlation. Residuals of all regressions seem to follow a normal distribution. The tests are omitted by space considerations, but data are provided to allow replication (see Annexes I and II).
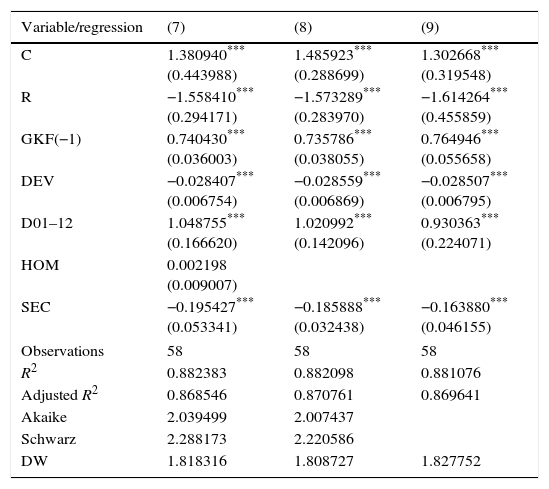
5.2Fixed capital growth regressionsThe growth regressions in Tables 1 and 2 yield that violence indices do not seem to impinge directly on economic growth. It is contended instead that they do it indirectly through its effect on fixed capital accumulation. Table 3 displays the fixed capital growth regressions (GKF). Regression 7 includes all relevant variables. Regression 8 drops the non-significant variable [the homicide rate (HOM)]. Regression 9 is the fully modified ordinary least squares estimation of regression 8. From regressions 7 to 9 it is deduced that recessions, represented by the dummy variable R, have a negative and significant impact on fixed capital accumulation. This variable follows an inertial path: the coefficient associated to the lagged dependent variable [GKF(−1)] is positive and significant. The devaluation rate (DEV), a main component of the user cost of capital, is also a determinant of investment: the impact is negative and significant; this is not surprising if one takes into account that most capital goods in Colombia are imported. The first twelve-year period of the XXI century (D01–12) has a positive and significant impact on fixed capital accumulation; this is also an expected result since fixed capital imports were cheapened by the lower lending rates since 2000, the revaluation since 2002, and the subsidies, grants, gifts and rebates which were granted by the Uribe government (2002–2010). It is assumed that violence, measured by the homicide rate (HOM) and the kidnapping rate (SEC), adversely influences capital accumulation, but only the kidnapping rate has a negative and significant impact. Whilst victims and victimizers of homicidal violence are usually poor (rich people protect themselves from homicidal violence by paying their own security schemes), violence of abduction aims directly at the wealthy, and are them who, for obvious reasons, are responsible for investment. Thus, according to this analysis, the impact of the kidnapping rate on economic growth is not explained by its impact on productivity growth but on fixed capital accumulation.
Fixed capital growth regressions (GKF) Colombia 1955–2012.
| Variable/regression | (7) | (8) | (9) |
|---|---|---|---|
| C | 1.380940*** (0.443988) | 1.485923*** (0.288699) | 1.302668*** (0.319548) |
| R | −1.558410*** (0.294171) | −1.573289*** (0.283970) | −1.614264*** (0.455859) |
| GKF(−1) | 0.740430*** (0.036003) | 0.735786*** (0.038055) | 0.764946*** (0.055658) |
| DEV | −0.028407*** (0.006754) | −0.028559*** (0.006869) | −0.028507*** (0.006795) |
| D01–12 | 1.048755*** (0.166620) | 1.020992*** (0.142096) | 0.930363*** (0.224071) |
| HOM | 0.002198 (0.009007) | ||
| SEC | −0.195427*** (0.053341) | −0.185888*** (0.032438) | −0.163880*** (0.046155) |
| Observations | 58 | 58 | 58 |
| R2 | 0.882383 | 0.882098 | 0.881076 |
| Adjusted R2 | 0.868546 | 0.870761 | 0.869641 |
| Akaike | 2.039499 | 2.007437 | |
| Schwarz | 2.288173 | 2.220586 | |
| DW | 1.818316 | 1.808727 | 1.827752 |
Note: Standard errors in parentheses.
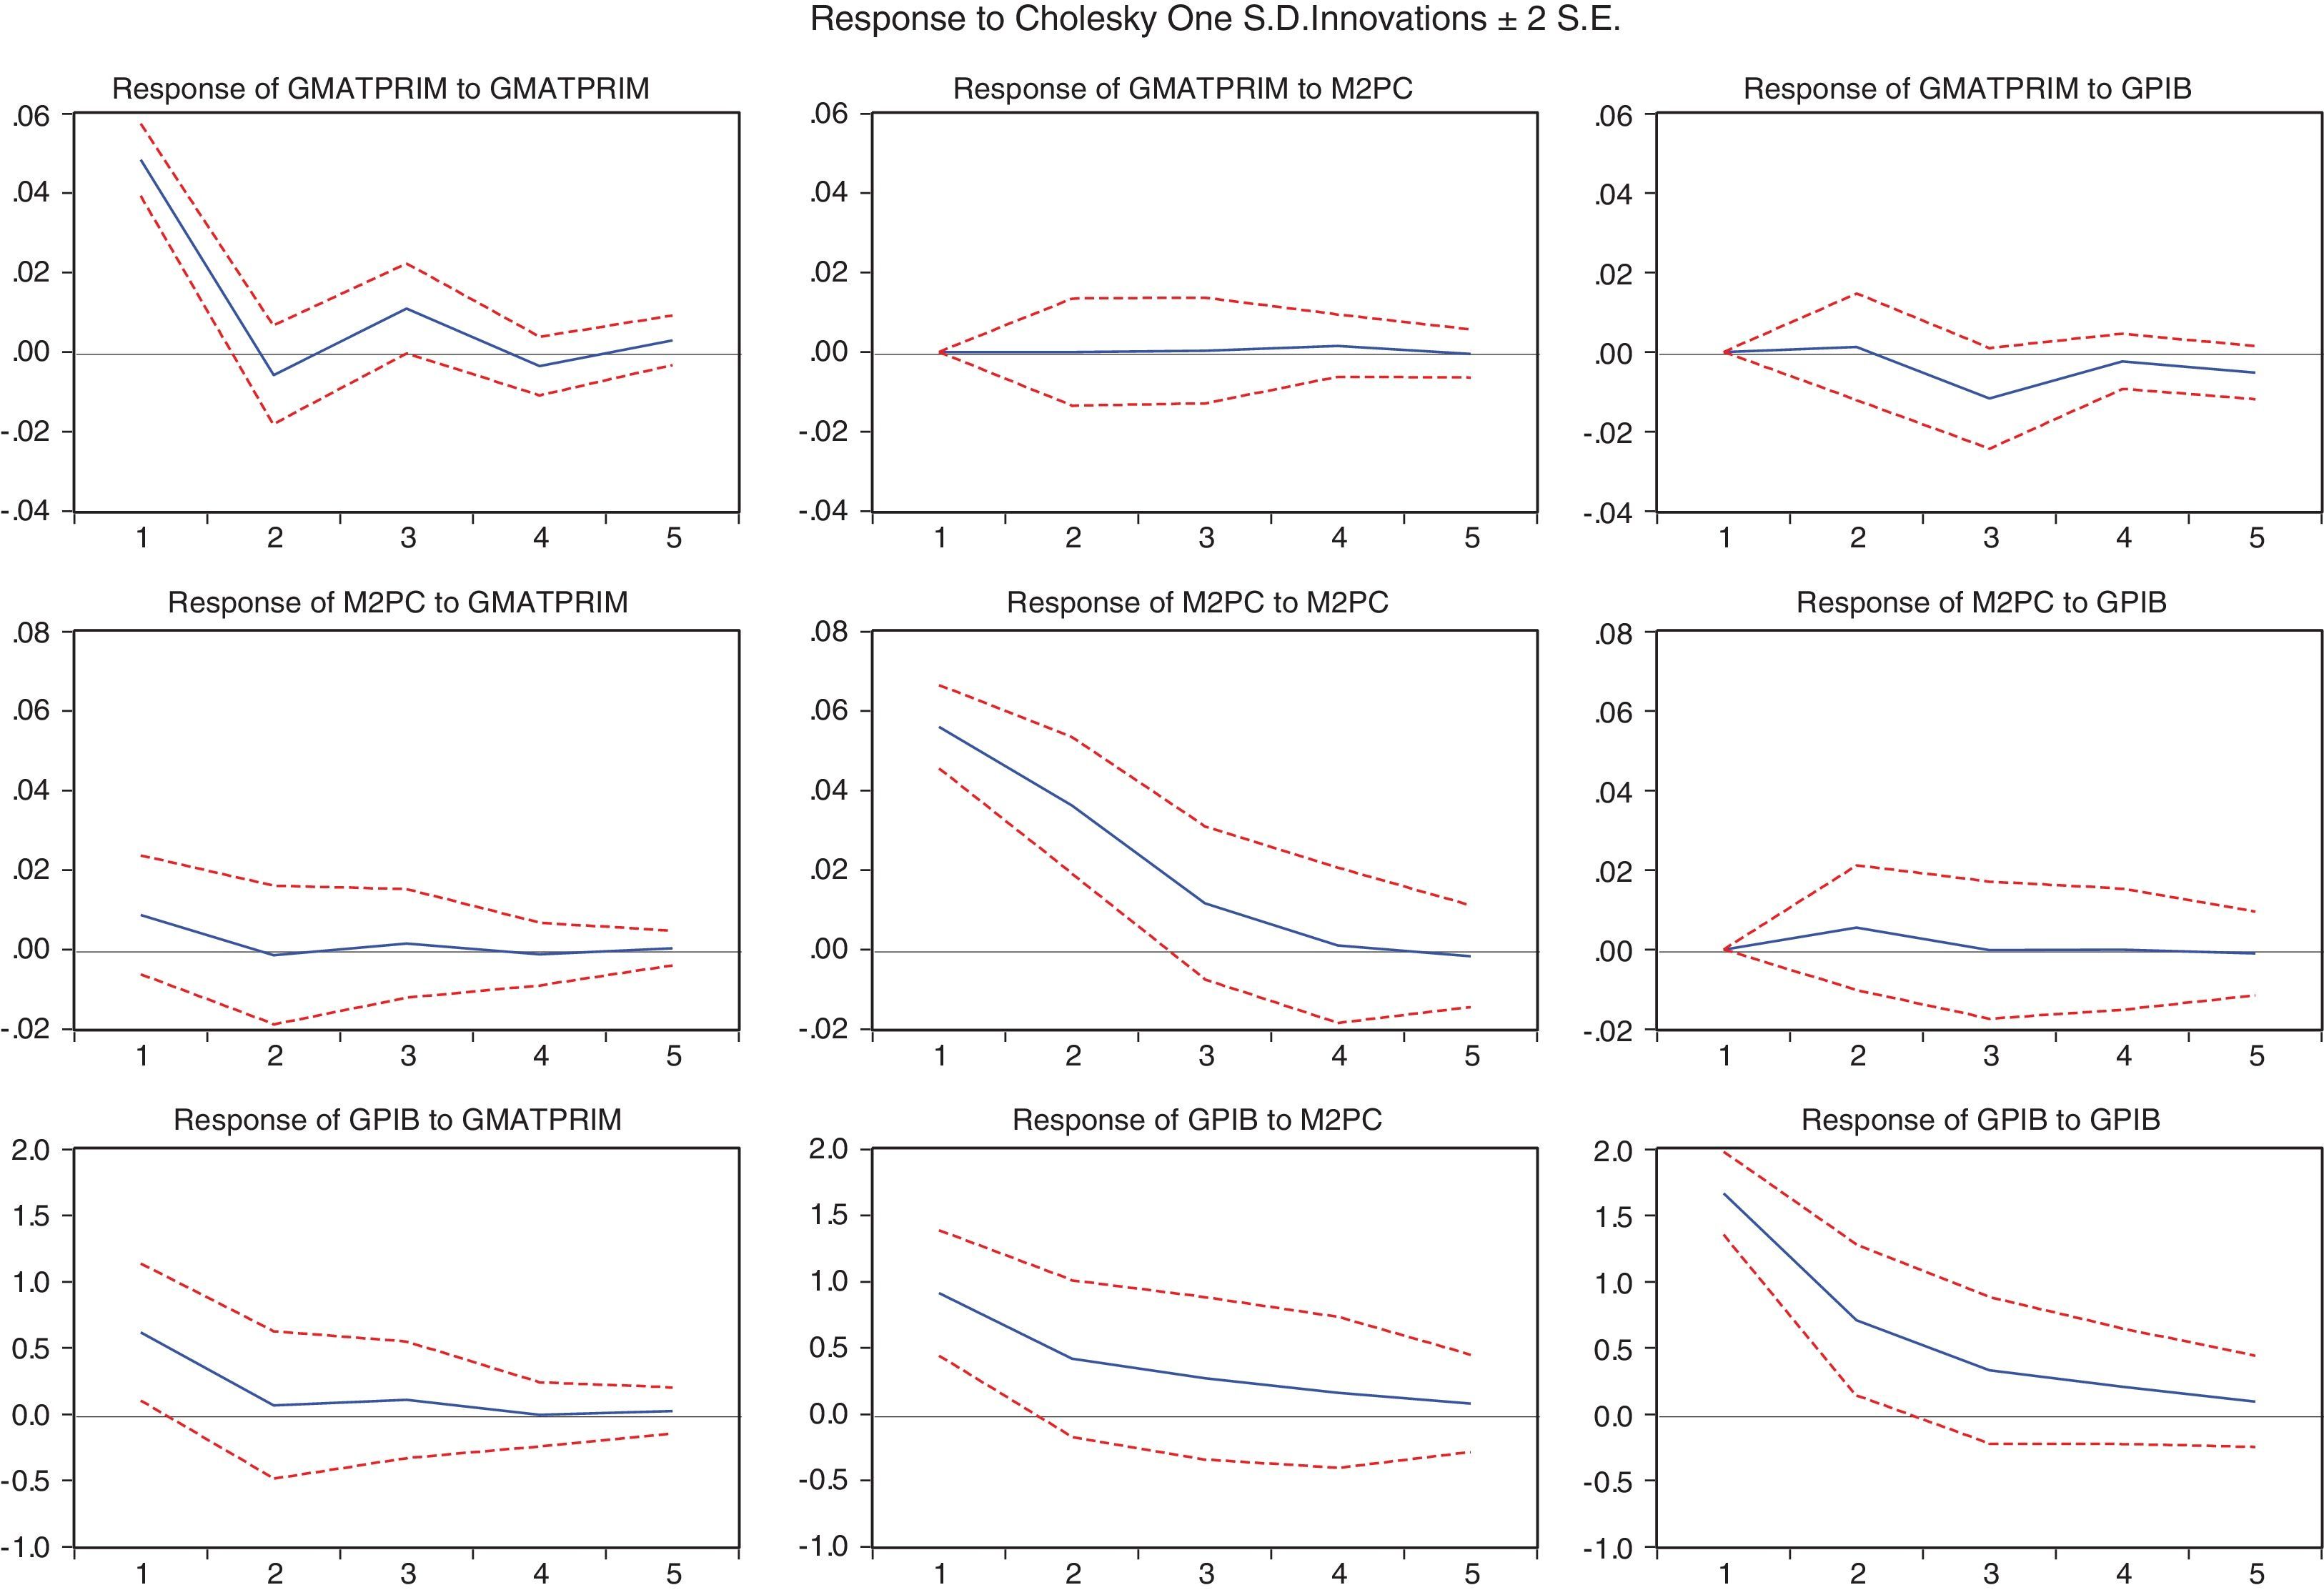
Impulse-response analysis provides an alternative way to corroborate the temporal causal relationships of the variables of interest. In order to do that, a vector autoregressive (VAR) model is estimated where the variables are ordered according to their degree of exogeneity: the diversification degree of the sector producing industrial inputs (MATPRIM), the purchasing power of the urban population as measured by the licensed square metres for lodging construction per citizen (M2PC) and the economic growth rate (GPIB). Since the null hypothesis that MATPRIM has a unitary root cannot be rejected, we used the growth rate of this variable (GMATPRIM) in the VAR model. The information criteria of Akaike, Schwarz and Hannan–Quinn imply that only two lags are required for this estimation.
Fig. 4 depicts all the impacts among these variables. It seems that GMATPRIM and M2PC have no impact but on themselves (see the first two rows of Fig. 4). The last row of Fig. 4 reveals that GMATPRIM and M2PC seem to have a contemporary positive and significant impact on the economic growth rate (GPIB); and this variable seems to follow an autoregressive process of order 1: the growth rate seems to persist for one year in a significant way. This exercise results are unchanged if the variable MATPRIM is used as regressor instead of GMATPRIM.

The economic variables used in these econometric analyses (GPIB, GKF, GKH, GK, HOM, SEC, DEV and M2PC) are collected in Annex I. The GDP composition is provided in Annex II. In both cases the construction of the data sets is fully explained.
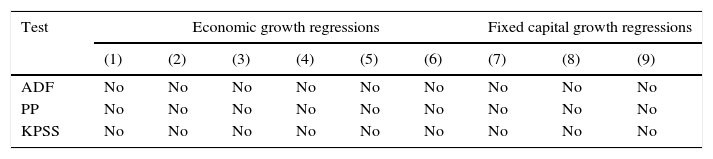
Most variables show no evidence of unit roots. Only the kidnapping rate (SEC) seems to have a unit root, which might explain its marked changes in 1980, 2000 and 2005; however, this behaviour is also consistent with some structural changes: the kidnapping rate soared since the 1980s with the rise of cocaine production; this rate began to decline after 2000 with Plan Colombia; and since 2005 it was stabilized at a high level: it seems that the law of Justice and Peace (2005) was not fully effective (the kidnapping activity was sustained by common criminals, guerrilla groups and paramilitary gangs that were not integrated to legal activities). Hence, the regressions were run using the kidnapping rate in levels and not in differences – differentiation would imply losing relevant information-. On the other hand, a statistical analysis of the non-trended component of the kidnapping rate cannot reject the hypothesis that it has a stationary behaviour. The variables MATPRIM, TRANSP and PUB do not seem to be stationary, but with their complement (other sectors GDP share) they are necessarily bounded. The statistical tests reject the hypothesis that the residuals of the regression equations are non-stationary (see Annex III).
6ConclusionsBased on the above analyses a main policy implication is derived. The State must recover or enhance its role as provider of quality public goods. In particular, and without neglecting the administration of justice and the general provision of public works and public institutions of social interest, as Smith would say, it is essential to recover the industrial policy for increasing the productive diversification with high technological intensity; it is necessary to promote the accumulation of fixed capital and human capital; it is compulsory to develop the multimodal infrastructure of transport; the infrastructure of public utilities should be commensurate with the population needs and the firms demand; property rights should be firmly protected; and, last but not least, the population purchasing power must be enhanced.
The last recommendation is the main contribution of this paper. Either through the creation of quality jobs (implying productive diversification and technological change), or through the use of a progressive redistribution of income and wealth, or a combination of both instruments, the State must fight poverty. In any case, capital accumulation and technologically oriented productive diversification must be preferred to assistentialism in order to reach a higher path of economic growth and better living standards. Finally, this paper contends that the fight against poverty as a social objective does not only stem from a claim for equity and justice, but also from economic efficiency: the population purchasing power is a fundamental condition for sustained economic growth.
Conflict of interestThe authors declare no conflict of interest.
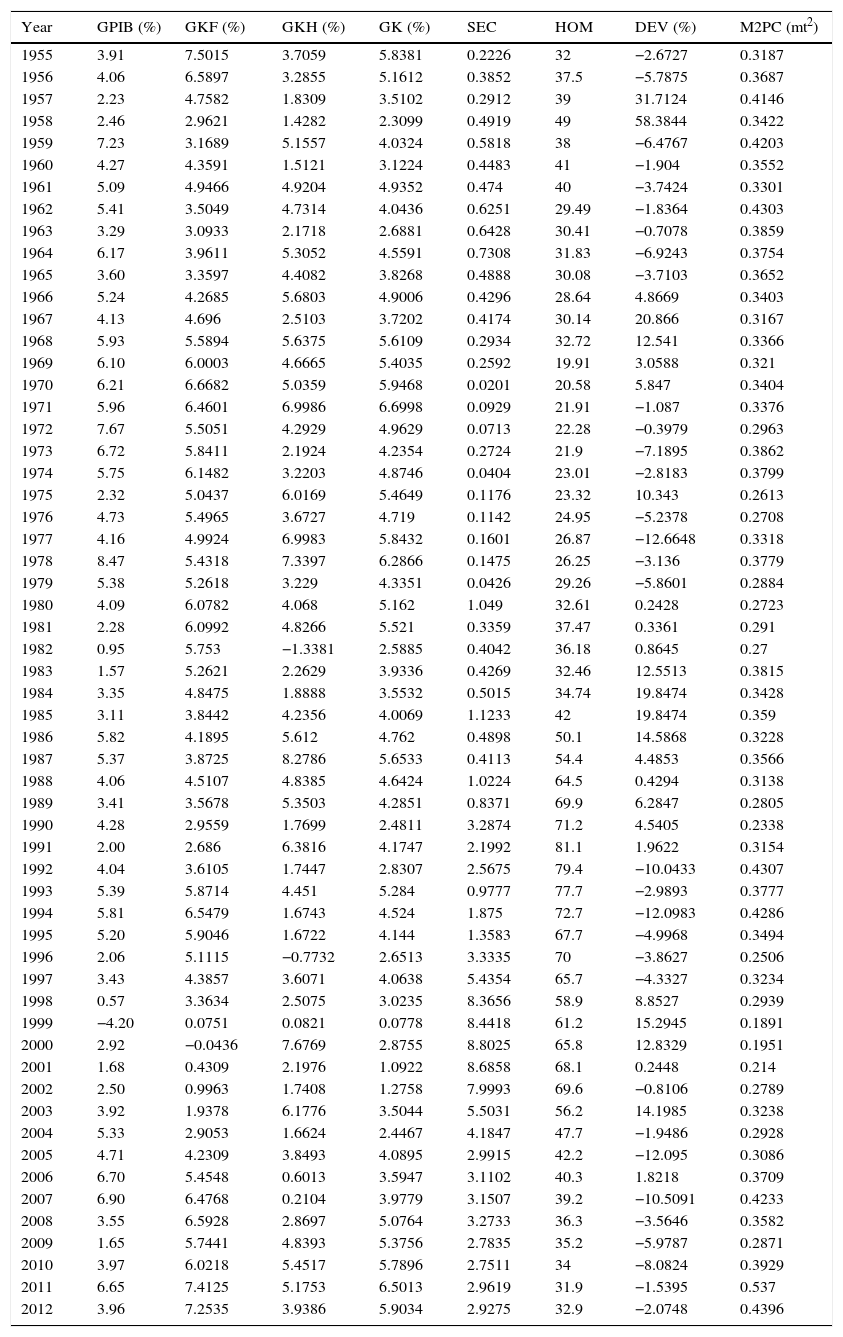
Economic variables. Colombia 1951–2012.
| Year | GPIB (%) | GKF (%) | GKH (%) | GK (%) | SEC | HOM | DEV (%) | M2PC (mt2) |
|---|---|---|---|---|---|---|---|---|
| 1955 | 3.91 | 7.5015 | 3.7059 | 5.8381 | 0.2226 | 32 | −2.6727 | 0.3187 |
| 1956 | 4.06 | 6.5897 | 3.2855 | 5.1612 | 0.3852 | 37.5 | −5.7875 | 0.3687 |
| 1957 | 2.23 | 4.7582 | 1.8309 | 3.5102 | 0.2912 | 39 | 31.7124 | 0.4146 |
| 1958 | 2.46 | 2.9621 | 1.4282 | 2.3099 | 0.4919 | 49 | 58.3844 | 0.3422 |
| 1959 | 7.23 | 3.1689 | 5.1557 | 4.0324 | 0.5818 | 38 | −6.4767 | 0.4203 |
| 1960 | 4.27 | 4.3591 | 1.5121 | 3.1224 | 0.4483 | 41 | −1.904 | 0.3552 |
| 1961 | 5.09 | 4.9466 | 4.9204 | 4.9352 | 0.474 | 40 | −3.7424 | 0.3301 |
| 1962 | 5.41 | 3.5049 | 4.7314 | 4.0436 | 0.6251 | 29.49 | −1.8364 | 0.4303 |
| 1963 | 3.29 | 3.0933 | 2.1718 | 2.6881 | 0.6428 | 30.41 | −0.7078 | 0.3859 |
| 1964 | 6.17 | 3.9611 | 5.3052 | 4.5591 | 0.7308 | 31.83 | −6.9243 | 0.3754 |
| 1965 | 3.60 | 3.3597 | 4.4082 | 3.8268 | 0.4888 | 30.08 | −3.7103 | 0.3652 |
| 1966 | 5.24 | 4.2685 | 5.6803 | 4.9006 | 0.4296 | 28.64 | 4.8669 | 0.3403 |
| 1967 | 4.13 | 4.696 | 2.5103 | 3.7202 | 0.4174 | 30.14 | 20.866 | 0.3167 |
| 1968 | 5.93 | 5.5894 | 5.6375 | 5.6109 | 0.2934 | 32.72 | 12.541 | 0.3366 |
| 1969 | 6.10 | 6.0003 | 4.6665 | 5.4035 | 0.2592 | 19.91 | 3.0588 | 0.321 |
| 1970 | 6.21 | 6.6682 | 5.0359 | 5.9468 | 0.0201 | 20.58 | 5.847 | 0.3404 |
| 1971 | 5.96 | 6.4601 | 6.9986 | 6.6998 | 0.0929 | 21.91 | −1.087 | 0.3376 |
| 1972 | 7.67 | 5.5051 | 4.2929 | 4.9629 | 0.0713 | 22.28 | −0.3979 | 0.2963 |
| 1973 | 6.72 | 5.8411 | 2.1924 | 4.2354 | 0.2724 | 21.9 | −7.1895 | 0.3862 |
| 1974 | 5.75 | 6.1482 | 3.2203 | 4.8746 | 0.0404 | 23.01 | −2.8183 | 0.3799 |
| 1975 | 2.32 | 5.0437 | 6.0169 | 5.4649 | 0.1176 | 23.32 | 10.343 | 0.2613 |
| 1976 | 4.73 | 5.4965 | 3.6727 | 4.719 | 0.1142 | 24.95 | −5.2378 | 0.2708 |
| 1977 | 4.16 | 4.9924 | 6.9983 | 5.8432 | 0.1601 | 26.87 | −12.6648 | 0.3318 |
| 1978 | 8.47 | 5.4318 | 7.3397 | 6.2866 | 0.1475 | 26.25 | −3.136 | 0.3779 |
| 1979 | 5.38 | 5.2618 | 3.229 | 4.3351 | 0.0426 | 29.26 | −5.8601 | 0.2884 |
| 1980 | 4.09 | 6.0782 | 4.068 | 5.162 | 1.049 | 32.61 | 0.2428 | 0.2723 |
| 1981 | 2.28 | 6.0992 | 4.8266 | 5.521 | 0.3359 | 37.47 | 0.3361 | 0.291 |
| 1982 | 0.95 | 5.753 | −1.3381 | 2.5885 | 0.4042 | 36.18 | 0.8645 | 0.27 |
| 1983 | 1.57 | 5.2621 | 2.2629 | 3.9336 | 0.4269 | 32.46 | 12.5513 | 0.3815 |
| 1984 | 3.35 | 4.8475 | 1.8888 | 3.5532 | 0.5015 | 34.74 | 19.8474 | 0.3428 |
| 1985 | 3.11 | 3.8442 | 4.2356 | 4.0069 | 1.1233 | 42 | 19.8474 | 0.359 |
| 1986 | 5.82 | 4.1895 | 5.612 | 4.762 | 0.4898 | 50.1 | 14.5868 | 0.3228 |
| 1987 | 5.37 | 3.8725 | 8.2786 | 5.6533 | 0.4113 | 54.4 | 4.4853 | 0.3566 |
| 1988 | 4.06 | 4.5107 | 4.8385 | 4.6424 | 1.0224 | 64.5 | 0.4294 | 0.3138 |
| 1989 | 3.41 | 3.5678 | 5.3503 | 4.2851 | 0.8371 | 69.9 | 6.2847 | 0.2805 |
| 1990 | 4.28 | 2.9559 | 1.7699 | 2.4811 | 3.2874 | 71.2 | 4.5405 | 0.2338 |
| 1991 | 2.00 | 2.686 | 6.3816 | 4.1747 | 2.1992 | 81.1 | 1.9622 | 0.3154 |
| 1992 | 4.04 | 3.6105 | 1.7447 | 2.8307 | 2.5675 | 79.4 | −10.0433 | 0.4307 |
| 1993 | 5.39 | 5.8714 | 4.451 | 5.284 | 0.9777 | 77.7 | −2.9893 | 0.3777 |
| 1994 | 5.81 | 6.5479 | 1.6743 | 4.524 | 1.875 | 72.7 | −12.0983 | 0.4286 |
| 1995 | 5.20 | 5.9046 | 1.6722 | 4.144 | 1.3583 | 67.7 | −4.9968 | 0.3494 |
| 1996 | 2.06 | 5.1115 | −0.7732 | 2.6513 | 3.3335 | 70 | −3.8627 | 0.2506 |
| 1997 | 3.43 | 4.3857 | 3.6071 | 4.0638 | 5.4354 | 65.7 | −4.3327 | 0.3234 |
| 1998 | 0.57 | 3.3634 | 2.5075 | 3.0235 | 8.3656 | 58.9 | 8.8527 | 0.2939 |
| 1999 | −4.20 | 0.0751 | 0.0821 | 0.0778 | 8.4418 | 61.2 | 15.2945 | 0.1891 |
| 2000 | 2.92 | −0.0436 | 7.6769 | 2.8755 | 8.8025 | 65.8 | 12.8329 | 0.1951 |
| 2001 | 1.68 | 0.4309 | 2.1976 | 1.0922 | 8.6858 | 68.1 | 0.2448 | 0.214 |
| 2002 | 2.50 | 0.9963 | 1.7408 | 1.2758 | 7.9993 | 69.6 | −0.8106 | 0.2789 |
| 2003 | 3.92 | 1.9378 | 6.1776 | 3.5044 | 5.5031 | 56.2 | 14.1985 | 0.3238 |
| 2004 | 5.33 | 2.9053 | 1.6624 | 2.4467 | 4.1847 | 47.7 | −1.9486 | 0.2928 |
| 2005 | 4.71 | 4.2309 | 3.8493 | 4.0895 | 2.9915 | 42.2 | −12.095 | 0.3086 |
| 2006 | 6.70 | 5.4548 | 0.6013 | 3.5947 | 3.1102 | 40.3 | 1.8218 | 0.3709 |
| 2007 | 6.90 | 6.4768 | 0.2104 | 3.9779 | 3.1507 | 39.2 | −10.5091 | 0.4233 |
| 2008 | 3.55 | 6.5928 | 2.8697 | 5.0764 | 3.2733 | 36.3 | −3.5646 | 0.3582 |
| 2009 | 1.65 | 5.7441 | 4.8393 | 5.3756 | 2.7835 | 35.2 | −5.9787 | 0.2871 |
| 2010 | 3.97 | 6.0218 | 5.4517 | 5.7896 | 2.7511 | 34 | −8.0824 | 0.3929 |
| 2011 | 6.65 | 7.4125 | 5.1753 | 6.5013 | 2.9619 | 31.9 | −1.5395 | 0.537 |
| 2012 | 3.96 | 7.2535 | 3.9386 | 5.9034 | 2.9275 | 32.9 | −2.0748 | 0.4396 |
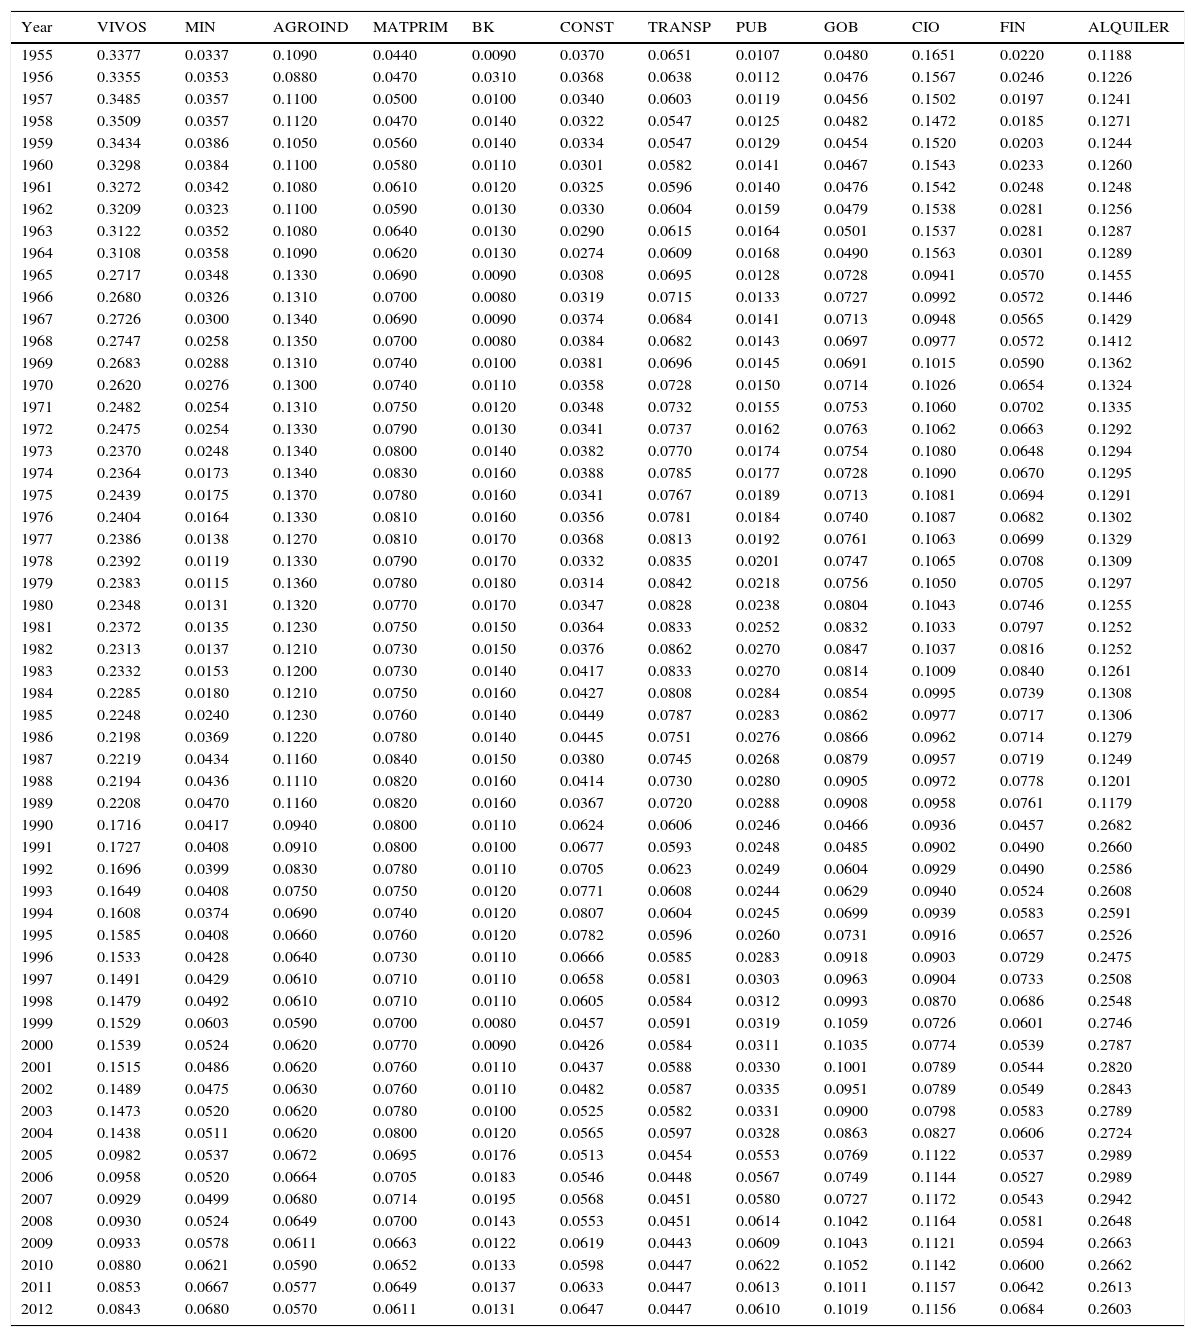
GDP Structure. Colombia 1955–2012.
| Year | VIVOS | MIN | AGROIND | MATPRIM | BK | CONST | TRANSP | PUB | GOB | CIO | FIN | ALQUILER |
|---|---|---|---|---|---|---|---|---|---|---|---|---|
| 1955 | 0.3377 | 0.0337 | 0.1090 | 0.0440 | 0.0090 | 0.0370 | 0.0651 | 0.0107 | 0.0480 | 0.1651 | 0.0220 | 0.1188 |
| 1956 | 0.3355 | 0.0353 | 0.0880 | 0.0470 | 0.0310 | 0.0368 | 0.0638 | 0.0112 | 0.0476 | 0.1567 | 0.0246 | 0.1226 |
| 1957 | 0.3485 | 0.0357 | 0.1100 | 0.0500 | 0.0100 | 0.0340 | 0.0603 | 0.0119 | 0.0456 | 0.1502 | 0.0197 | 0.1241 |
| 1958 | 0.3509 | 0.0357 | 0.1120 | 0.0470 | 0.0140 | 0.0322 | 0.0547 | 0.0125 | 0.0482 | 0.1472 | 0.0185 | 0.1271 |
| 1959 | 0.3434 | 0.0386 | 0.1050 | 0.0560 | 0.0140 | 0.0334 | 0.0547 | 0.0129 | 0.0454 | 0.1520 | 0.0203 | 0.1244 |
| 1960 | 0.3298 | 0.0384 | 0.1100 | 0.0580 | 0.0110 | 0.0301 | 0.0582 | 0.0141 | 0.0467 | 0.1543 | 0.0233 | 0.1260 |
| 1961 | 0.3272 | 0.0342 | 0.1080 | 0.0610 | 0.0120 | 0.0325 | 0.0596 | 0.0140 | 0.0476 | 0.1542 | 0.0248 | 0.1248 |
| 1962 | 0.3209 | 0.0323 | 0.1100 | 0.0590 | 0.0130 | 0.0330 | 0.0604 | 0.0159 | 0.0479 | 0.1538 | 0.0281 | 0.1256 |
| 1963 | 0.3122 | 0.0352 | 0.1080 | 0.0640 | 0.0130 | 0.0290 | 0.0615 | 0.0164 | 0.0501 | 0.1537 | 0.0281 | 0.1287 |
| 1964 | 0.3108 | 0.0358 | 0.1090 | 0.0620 | 0.0130 | 0.0274 | 0.0609 | 0.0168 | 0.0490 | 0.1563 | 0.0301 | 0.1289 |
| 1965 | 0.2717 | 0.0348 | 0.1330 | 0.0690 | 0.0090 | 0.0308 | 0.0695 | 0.0128 | 0.0728 | 0.0941 | 0.0570 | 0.1455 |
| 1966 | 0.2680 | 0.0326 | 0.1310 | 0.0700 | 0.0080 | 0.0319 | 0.0715 | 0.0133 | 0.0727 | 0.0992 | 0.0572 | 0.1446 |
| 1967 | 0.2726 | 0.0300 | 0.1340 | 0.0690 | 0.0090 | 0.0374 | 0.0684 | 0.0141 | 0.0713 | 0.0948 | 0.0565 | 0.1429 |
| 1968 | 0.2747 | 0.0258 | 0.1350 | 0.0700 | 0.0080 | 0.0384 | 0.0682 | 0.0143 | 0.0697 | 0.0977 | 0.0572 | 0.1412 |
| 1969 | 0.2683 | 0.0288 | 0.1310 | 0.0740 | 0.0100 | 0.0381 | 0.0696 | 0.0145 | 0.0691 | 0.1015 | 0.0590 | 0.1362 |
| 1970 | 0.2620 | 0.0276 | 0.1300 | 0.0740 | 0.0110 | 0.0358 | 0.0728 | 0.0150 | 0.0714 | 0.1026 | 0.0654 | 0.1324 |
| 1971 | 0.2482 | 0.0254 | 0.1310 | 0.0750 | 0.0120 | 0.0348 | 0.0732 | 0.0155 | 0.0753 | 0.1060 | 0.0702 | 0.1335 |
| 1972 | 0.2475 | 0.0254 | 0.1330 | 0.0790 | 0.0130 | 0.0341 | 0.0737 | 0.0162 | 0.0763 | 0.1062 | 0.0663 | 0.1292 |
| 1973 | 0.2370 | 0.0248 | 0.1340 | 0.0800 | 0.0140 | 0.0382 | 0.0770 | 0.0174 | 0.0754 | 0.1080 | 0.0648 | 0.1294 |
| 1974 | 0.2364 | 0.0173 | 0.1340 | 0.0830 | 0.0160 | 0.0388 | 0.0785 | 0.0177 | 0.0728 | 0.1090 | 0.0670 | 0.1295 |
| 1975 | 0.2439 | 0.0175 | 0.1370 | 0.0780 | 0.0160 | 0.0341 | 0.0767 | 0.0189 | 0.0713 | 0.1081 | 0.0694 | 0.1291 |
| 1976 | 0.2404 | 0.0164 | 0.1330 | 0.0810 | 0.0160 | 0.0356 | 0.0781 | 0.0184 | 0.0740 | 0.1087 | 0.0682 | 0.1302 |
| 1977 | 0.2386 | 0.0138 | 0.1270 | 0.0810 | 0.0170 | 0.0368 | 0.0813 | 0.0192 | 0.0761 | 0.1063 | 0.0699 | 0.1329 |
| 1978 | 0.2392 | 0.0119 | 0.1330 | 0.0790 | 0.0170 | 0.0332 | 0.0835 | 0.0201 | 0.0747 | 0.1065 | 0.0708 | 0.1309 |
| 1979 | 0.2383 | 0.0115 | 0.1360 | 0.0780 | 0.0180 | 0.0314 | 0.0842 | 0.0218 | 0.0756 | 0.1050 | 0.0705 | 0.1297 |
| 1980 | 0.2348 | 0.0131 | 0.1320 | 0.0770 | 0.0170 | 0.0347 | 0.0828 | 0.0238 | 0.0804 | 0.1043 | 0.0746 | 0.1255 |
| 1981 | 0.2372 | 0.0135 | 0.1230 | 0.0750 | 0.0150 | 0.0364 | 0.0833 | 0.0252 | 0.0832 | 0.1033 | 0.0797 | 0.1252 |
| 1982 | 0.2313 | 0.0137 | 0.1210 | 0.0730 | 0.0150 | 0.0376 | 0.0862 | 0.0270 | 0.0847 | 0.1037 | 0.0816 | 0.1252 |
| 1983 | 0.2332 | 0.0153 | 0.1200 | 0.0730 | 0.0140 | 0.0417 | 0.0833 | 0.0270 | 0.0814 | 0.1009 | 0.0840 | 0.1261 |
| 1984 | 0.2285 | 0.0180 | 0.1210 | 0.0750 | 0.0160 | 0.0427 | 0.0808 | 0.0284 | 0.0854 | 0.0995 | 0.0739 | 0.1308 |
| 1985 | 0.2248 | 0.0240 | 0.1230 | 0.0760 | 0.0140 | 0.0449 | 0.0787 | 0.0283 | 0.0862 | 0.0977 | 0.0717 | 0.1306 |
| 1986 | 0.2198 | 0.0369 | 0.1220 | 0.0780 | 0.0140 | 0.0445 | 0.0751 | 0.0276 | 0.0866 | 0.0962 | 0.0714 | 0.1279 |
| 1987 | 0.2219 | 0.0434 | 0.1160 | 0.0840 | 0.0150 | 0.0380 | 0.0745 | 0.0268 | 0.0879 | 0.0957 | 0.0719 | 0.1249 |
| 1988 | 0.2194 | 0.0436 | 0.1110 | 0.0820 | 0.0160 | 0.0414 | 0.0730 | 0.0280 | 0.0905 | 0.0972 | 0.0778 | 0.1201 |
| 1989 | 0.2208 | 0.0470 | 0.1160 | 0.0820 | 0.0160 | 0.0367 | 0.0720 | 0.0288 | 0.0908 | 0.0958 | 0.0761 | 0.1179 |
| 1990 | 0.1716 | 0.0417 | 0.0940 | 0.0800 | 0.0110 | 0.0624 | 0.0606 | 0.0246 | 0.0466 | 0.0936 | 0.0457 | 0.2682 |
| 1991 | 0.1727 | 0.0408 | 0.0910 | 0.0800 | 0.0100 | 0.0677 | 0.0593 | 0.0248 | 0.0485 | 0.0902 | 0.0490 | 0.2660 |
| 1992 | 0.1696 | 0.0399 | 0.0830 | 0.0780 | 0.0110 | 0.0705 | 0.0623 | 0.0249 | 0.0604 | 0.0929 | 0.0490 | 0.2586 |
| 1993 | 0.1649 | 0.0408 | 0.0750 | 0.0750 | 0.0120 | 0.0771 | 0.0608 | 0.0244 | 0.0629 | 0.0940 | 0.0524 | 0.2608 |
| 1994 | 0.1608 | 0.0374 | 0.0690 | 0.0740 | 0.0120 | 0.0807 | 0.0604 | 0.0245 | 0.0699 | 0.0939 | 0.0583 | 0.2591 |
| 1995 | 0.1585 | 0.0408 | 0.0660 | 0.0760 | 0.0120 | 0.0782 | 0.0596 | 0.0260 | 0.0731 | 0.0916 | 0.0657 | 0.2526 |
| 1996 | 0.1533 | 0.0428 | 0.0640 | 0.0730 | 0.0110 | 0.0666 | 0.0585 | 0.0283 | 0.0918 | 0.0903 | 0.0729 | 0.2475 |
| 1997 | 0.1491 | 0.0429 | 0.0610 | 0.0710 | 0.0110 | 0.0658 | 0.0581 | 0.0303 | 0.0963 | 0.0904 | 0.0733 | 0.2508 |
| 1998 | 0.1479 | 0.0492 | 0.0610 | 0.0710 | 0.0110 | 0.0605 | 0.0584 | 0.0312 | 0.0993 | 0.0870 | 0.0686 | 0.2548 |
| 1999 | 0.1529 | 0.0603 | 0.0590 | 0.0700 | 0.0080 | 0.0457 | 0.0591 | 0.0319 | 0.1059 | 0.0726 | 0.0601 | 0.2746 |
| 2000 | 0.1539 | 0.0524 | 0.0620 | 0.0770 | 0.0090 | 0.0426 | 0.0584 | 0.0311 | 0.1035 | 0.0774 | 0.0539 | 0.2787 |
| 2001 | 0.1515 | 0.0486 | 0.0620 | 0.0760 | 0.0110 | 0.0437 | 0.0588 | 0.0330 | 0.1001 | 0.0789 | 0.0544 | 0.2820 |
| 2002 | 0.1489 | 0.0475 | 0.0630 | 0.0760 | 0.0110 | 0.0482 | 0.0587 | 0.0335 | 0.0951 | 0.0789 | 0.0549 | 0.2843 |
| 2003 | 0.1473 | 0.0520 | 0.0620 | 0.0780 | 0.0100 | 0.0525 | 0.0582 | 0.0331 | 0.0900 | 0.0798 | 0.0583 | 0.2789 |
| 2004 | 0.1438 | 0.0511 | 0.0620 | 0.0800 | 0.0120 | 0.0565 | 0.0597 | 0.0328 | 0.0863 | 0.0827 | 0.0606 | 0.2724 |
| 2005 | 0.0982 | 0.0537 | 0.0672 | 0.0695 | 0.0176 | 0.0513 | 0.0454 | 0.0553 | 0.0769 | 0.1122 | 0.0537 | 0.2989 |
| 2006 | 0.0958 | 0.0520 | 0.0664 | 0.0705 | 0.0183 | 0.0546 | 0.0448 | 0.0567 | 0.0749 | 0.1144 | 0.0527 | 0.2989 |
| 2007 | 0.0929 | 0.0499 | 0.0680 | 0.0714 | 0.0195 | 0.0568 | 0.0451 | 0.0580 | 0.0727 | 0.1172 | 0.0543 | 0.2942 |
| 2008 | 0.0930 | 0.0524 | 0.0649 | 0.0700 | 0.0143 | 0.0553 | 0.0451 | 0.0614 | 0.1042 | 0.1164 | 0.0581 | 0.2648 |
| 2009 | 0.0933 | 0.0578 | 0.0611 | 0.0663 | 0.0122 | 0.0619 | 0.0443 | 0.0609 | 0.1043 | 0.1121 | 0.0594 | 0.2663 |
| 2010 | 0.0880 | 0.0621 | 0.0590 | 0.0652 | 0.0133 | 0.0598 | 0.0447 | 0.0622 | 0.1052 | 0.1142 | 0.0600 | 0.2662 |
| 2011 | 0.0853 | 0.0667 | 0.0577 | 0.0649 | 0.0137 | 0.0633 | 0.0447 | 0.0613 | 0.1011 | 0.1157 | 0.0642 | 0.2613 |
| 2012 | 0.0843 | 0.0680 | 0.0570 | 0.0611 | 0.0131 | 0.0647 | 0.0447 | 0.0610 | 0.1019 | 0.1156 | 0.0684 | 0.2603 |
Note: The primary sector is made of agriculture, cattle, fishing, hunting and forestry (VIVOS), and mining (MIN). The manufacturing industry is made of agroindustry (AGROIND), manufacturing inputs (MATPRIM) and capital goods (BK). The service sector is made of construction (CONST), transport services (TRANSP), public utilities: telecommunications, electricity, gas, water and postal services (PUB), government services (GOB), commercial services (CIO) and financial services (FIN), rentals and other business and personal services (ALQUILER).
Residuals stationarity analysis for the estimated regressions. Unit root presence.
| Test | Economic growth regressions | Fixed capital growth regressions | |||||||
|---|---|---|---|---|---|---|---|---|---|
| (1) | (2) | (3) | (4) | (5) | (6) | (7) | (8) | (9) | |
| ADF | No | No | No | No | No | No | No | No | No |
| PP | No | No | No | No | No | No | No | No | No |
| KPSS | No | No | No | No | No | No | No | No | No |
Currie (1981), Roncaglia (2006), Sandilands (2009), Currie and Sandilands (2013), among others, have attempted to define analytically the Smithian vision of economic growth. For a neoclassical modelling of this vision see Murphy, Shleifer and Vishny (1989a, 1989b).
The authors thank the support from Universidad del Valle.
Unlike Rosenstein-Rodan (1943) and Nurkse (1953), who saw the countries’ economic take off as an explosion of simultaneous investments (balanced growth vision), Hirschman argued that scarcity of productive resources in underdeveloped countries would force them to follow a sequential process of investments under the logic of economic linkages (unbalanced growth vision).
An anonymous referee pointed out that Keynesian and post Keynesian dynamic analyses have preserved the role of effective demand as an important explanatory determinant of economic growth (e.g. Dutt, 2003). As is well known, these analyses do not belong at all to the neoclassical mainstream.
From 1951 to 2005 the Colombian urbanization increased from 38.7% to 75% (DANE).
Five states, out of 32, with the major capital cities of Colombia [Bogotá D.E., Antioquia (Medellín), Valle del Cauca (Cali), Santander (Bucaramanga), and Cundinamarca (Bogotá)], generate around 60% of GDP and concentrate 55% of population (https://www.dane.gov.co/index.php/pib-cuentas-nacionales/cuentas-departamentales).
Causality running from industrialization to economic growth is also postulated for Colombia in García (2002), Poveda Ramos (2005), Sarmiento (2005), Moreno (2008) and Moncayo (2013). This empirical regularity has been proposed by the structuralist school of economic development (Chenery & Syrquin, 1975; Chenery et al., 1986; Hirschman, 1958; Kaldor, 1966; Landes, 1998; Leontief, 1963; Prebisch, 1950; among others).
Brazil has been the most unequal economy of South America for a long time. However, during 2010–2011 Colombia overtook Brazil (http://estadisticas.cepal.org/cepalstat/WEB_CEPALSTAT/Portada.asp).
Although there was not in strict sense a domestic recession in 2009, the international recession lowered significantly the domestic activity level.
Colombia saw many structural transformations in the 1990s: a new political charter; “la Apertura”; new laws on the labour market; the health system was reformed; the fiscal and political regime was decentralized; the concentration of cocaine production; the expansion of guerrilla movements, paramilitary squads and drug-dealers bands; the soaring of violence and terror.
Centro Nacional de Memoria Histórica (2013) showed that the kidnapping rate was stabilized around 3 per 100.000 inhabitants from 2005 to 2012, instead of falling as it was previously informed. That is why the current results about the statistical significance of kidnappings in the growth regressions differ from previous exercises.