
The objective of this study was to update and analyze tuberculosis (TB) mortality data in the European Union between 2000 and 2010 separately for men and women and try to detect if there have been any changes in trends in each country and the association with the economic situation and inequalities.
MethodsData were extracted for tuberculosis deaths in 2000–2010 for 29 European Union countries and for Switzerland, via the World Health Organization (WHO) European detailed mortality database (DMDB), using the Mortality tabulation list 1 (MTL1) codes for men and women separately for one age group (20–85+). We estimated age-standardised mortality rates, and analyzed data using the Joinpoint Regression Program for men and women separately in the European Union overall and by individual country for each year.
ResultsBetween 2000 and 2010, there were 68,771 recorded tuberculosis deaths in the European Union and the mortality rates were higher for men than women in the entire study zone. Overall, TB mortality rates declined linearly for both genders, but more in women than in men (from 5.43/100,000 in 2000 to 2.59/100,000 in 2010 in men and from 1.37/100,000 in 2000 to 0.51/100,000 in 2010 in women). There was decline in both genders for the entire study period, with a significant Estimated Annual Percentage Change (EAPC) of –8.1 for women and –7 for men when alpha<0.05 and with a 95% confidence interval (CI). A higher tuberculosis mortality was associated with lower economic resources and greater inequalities.
ConclusionsTB mortality rates in the European Union decreased overall in 2000–2010 for both genders. Men have higher TB mortality rates than women in all countries. Our findings were consistent with the downward TB mortality trend in many other countries worldwide.
El objetivo de este estudio fue actualizar y analizar los datos sobre la mortalidad por tuberculosis (TB) en la Unión Europea entre 2000 y 2010, separadamente para varones y mujeres, así como tratar de detectar si se han producido cambios en las tendencias para cada país, al igual que la asociación con la situación económica y las desigualdades.
MétodosSe extrajeron los datos sobre muertes por TB durante el periodo 2000-2010 para los 29 países de la Unión Europea y para Suiza, a través de la base de datos detallada europea sobre mortalidad (DMDB) de la Organización Mundial de la Salud (OMS), utilizando por separado los códigos para varones y mujeres de la lista de tabulación de la mortalidad 1 (MTL1) para un grupo de edad (20-85+). Calculamos los índices de mortalidad estandarizados por edad, y analizamos los datos utilizando el programa de regresión Joinpoint, separando varones y mujeres, en la Unión Europea en general, y por país individual para cada año.
ResultadosEntre 2000 y 2010, se produjeron 68.771 muertes por TB registradas en la Unión Europea, siendo los índices de mortalidad superiores en varones que en mujeres en el área total de estudio. En general, los índices de mortalidad por TB descendieron de forma lineal para ambos sexos, aunque más en mujeres que en varones (de 5,43/100.000 en 2000 a 2,59/100.000 en 2010 en varones, y de 1,37/100.000 en 2000 a 0,51/100.000 en 2010 en mujeres). Se produjo un descenso en ambos sexos durante el periodo total de estudio, con un cambio porcentual anual estimado (EAPC) de –8,1 para mujeres y de –7 para varones, siendo alfa<0,05, y con un 95% de intervalo de confianza (IC). La mortalidad superior por TB se asoció a unos menores recursos económicos y a unas mayores desigualdades.
ConclusionesLos índices de mortalidad por TB en la Unión Europea descendieron en general durante el periodo 2000-2010 para ambos sexos. Los varones reflejan unos índices superiores de mortalidad que las mujeres en todos los países. Nuestros hallazgos fueron consistentes con la tendencia a la baja de la mortalidad por TB en muchos otros países a nivel mundial.
Tuberculosis (TB) remains an important public health problem. Despite notable progress in the past decade and the availability of effective drug treatments, TB is still one of the major adverse health issues worldwide and continues to pose a serious threat to individuals and public health in most of the European Region (EU) countries.1
The World Health Organization (WHO) has estimated that 9.6 million people developed TB in 2014 worldwide and 1.5 million people died,2 62,000 of those deaths occurred within the WHO European Region.3 According to the ECDC in 2013, an estimated 360,000 TB cases, 39 cases per 100,000 population. In the last 15 years, new cases of TB have been falling at an average rate of 4.5% per year.4
The TB control demands a strong public health infrastructure to detect and treat infected people. Many countries in the EU are in an economic recession that could have an effect on the population's health, especially with respect to infectious diseases.5 On the other hand, notable differences among the EU countries, including socio-economic aspects, could explain some characteristic of TB mortality in Europe.
The objective of this study was to update and analyze tuberculosis mortality data in EU between 2000 and 2010 for men and women separately and try to detect if there have been changes in trends in each country and the association with economic situation and inequalities.
Material and methodsSource of dataThe data for mortality (tuberculosis age-standardised mortality rates per 100,000 population from 2000 to 2010) was extracted from WHO European Detailed Mortality Database (DMDB). This database contains mortality data by age group, gender, year and predefined, aggregated causes of death for individual member states. According to WHO recommendations, the cause of death that is ICD coded should be taken as the underlying cause of death.6 We used the data file containing the DMDB for the MTL1 (Mortality tabulation list 1; MTL1 1-005 (1005), A15–A16 (Respiratory tuberculosis), MTL1 1-006 (1006), A17–A19 (other tuberculosis) were selected. WHO DMDB showed that data were missing from some countries for certain periods of time, but we have assumed that this missing information is not a huge problem and that it has not affected our interpretations and conclusions. Because of this we did not compute any data imputations.
Zone of studyThis study included all European Union countries and Switzerland and they are referred with the term “European Union” in this study.
Age groups studiedOnly one age group was used, from 20 years. We used the TB age-standardised mortality rates (ASMR) of this age group, but separately for genders within each country for every year studied, giving our findings as number of deaths per 100,000 persons per year.
Statistical analysisAge specific rates ASMR per 100,000 at (20–85+) years for gender were calculated using the direct method on basis of the European standard population.7 ASMR trends by gender and age were estimated by joinpoint regression analysis, and we used it to identify years when changes occurred in the linear slope of the temporal trend. Best-fitting points (the so-called joinpoints) were chosen when the rates changed significantly.8 Joinpoint regression analysis provides the ability to identify the time when there are changes in the trend, and to estimate the magnitude of the increase or the decrease seen in each interval by estimating the Estimated Percentage of Annual Change (EPAC). We used Join-point Regression Program, version 4.1.1.59 to calculate EPAC trends and the statistical significance of ASMR We built segmented models of Poisson regression to estimate the trend changes over time ASMR were used as the dependent variable and year of death as the independent variable. P-value was estimated using Monte Carlo methods, and the overall asymptotic significance level is maintained through a Bonferroni correction. These tests are extended to the situation with non-constant variance to handle rates with Poisson variation and possibly auto correlated errors.9 We collected unemployment rates of 2010, GINI Index of 2009 (GINI Index is a statistical dispersion measure purposed to represent the income or wealth distribution of a residents of the nation, and it is considered as the most commonly used measure of inequality), Gross Domestic Product (GDP) per capita of 2013, evolution of the GDP before and after the crisis (2010–2006) from Eurostat. Pearson correlation was computed, as well as multiple linear regression from each country.10–13
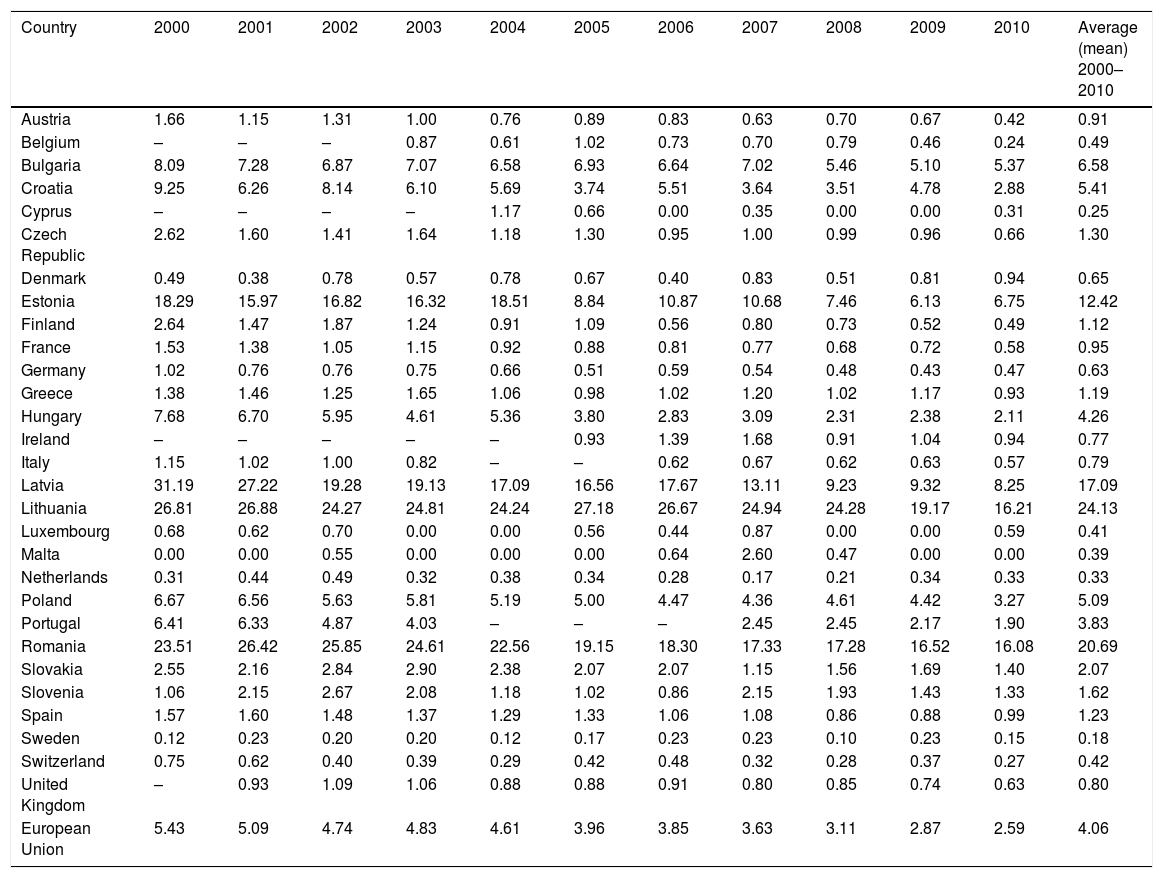
We calculated in Tables 1 and 2 the average (mean) for the ASMR of TB for each country for all the period of study to make a comparison between them.
Age-standardised TB mortality rates per 100,000 European Union for men.
| Country | 2000 | 2001 | 2002 | 2003 | 2004 | 2005 | 2006 | 2007 | 2008 | 2009 | 2010 | Average (mean) 2000–2010 |
|---|---|---|---|---|---|---|---|---|---|---|---|---|
| Austria | 1.66 | 1.15 | 1.31 | 1.00 | 0.76 | 0.89 | 0.83 | 0.63 | 0.70 | 0.67 | 0.42 | 0.91 |
| Belgium | – | – | – | 0.87 | 0.61 | 1.02 | 0.73 | 0.70 | 0.79 | 0.46 | 0.24 | 0.49 |
| Bulgaria | 8.09 | 7.28 | 6.87 | 7.07 | 6.58 | 6.93 | 6.64 | 7.02 | 5.46 | 5.10 | 5.37 | 6.58 |
| Croatia | 9.25 | 6.26 | 8.14 | 6.10 | 5.69 | 3.74 | 5.51 | 3.64 | 3.51 | 4.78 | 2.88 | 5.41 |
| Cyprus | – | – | – | – | 1.17 | 0.66 | 0.00 | 0.35 | 0.00 | 0.00 | 0.31 | 0.25 |
| Czech Republic | 2.62 | 1.60 | 1.41 | 1.64 | 1.18 | 1.30 | 0.95 | 1.00 | 0.99 | 0.96 | 0.66 | 1.30 |
| Denmark | 0.49 | 0.38 | 0.78 | 0.57 | 0.78 | 0.67 | 0.40 | 0.83 | 0.51 | 0.81 | 0.94 | 0.65 |
| Estonia | 18.29 | 15.97 | 16.82 | 16.32 | 18.51 | 8.84 | 10.87 | 10.68 | 7.46 | 6.13 | 6.75 | 12.42 |
| Finland | 2.64 | 1.47 | 1.87 | 1.24 | 0.91 | 1.09 | 0.56 | 0.80 | 0.73 | 0.52 | 0.49 | 1.12 |
| France | 1.53 | 1.38 | 1.05 | 1.15 | 0.92 | 0.88 | 0.81 | 0.77 | 0.68 | 0.72 | 0.58 | 0.95 |
| Germany | 1.02 | 0.76 | 0.76 | 0.75 | 0.66 | 0.51 | 0.59 | 0.54 | 0.48 | 0.43 | 0.47 | 0.63 |
| Greece | 1.38 | 1.46 | 1.25 | 1.65 | 1.06 | 0.98 | 1.02 | 1.20 | 1.02 | 1.17 | 0.93 | 1.19 |
| Hungary | 7.68 | 6.70 | 5.95 | 4.61 | 5.36 | 3.80 | 2.83 | 3.09 | 2.31 | 2.38 | 2.11 | 4.26 |
| Ireland | – | – | – | – | – | 0.93 | 1.39 | 1.68 | 0.91 | 1.04 | 0.94 | 0.77 |
| Italy | 1.15 | 1.02 | 1.00 | 0.82 | – | – | 0.62 | 0.67 | 0.62 | 0.63 | 0.57 | 0.79 |
| Latvia | 31.19 | 27.22 | 19.28 | 19.13 | 17.09 | 16.56 | 17.67 | 13.11 | 9.23 | 9.32 | 8.25 | 17.09 |
| Lithuania | 26.81 | 26.88 | 24.27 | 24.81 | 24.24 | 27.18 | 26.67 | 24.94 | 24.28 | 19.17 | 16.21 | 24.13 |
| Luxembourg | 0.68 | 0.62 | 0.70 | 0.00 | 0.00 | 0.56 | 0.44 | 0.87 | 0.00 | 0.00 | 0.59 | 0.41 |
| Malta | 0.00 | 0.00 | 0.55 | 0.00 | 0.00 | 0.00 | 0.64 | 2.60 | 0.47 | 0.00 | 0.00 | 0.39 |
| Netherlands | 0.31 | 0.44 | 0.49 | 0.32 | 0.38 | 0.34 | 0.28 | 0.17 | 0.21 | 0.34 | 0.33 | 0.33 |
| Poland | 6.67 | 6.56 | 5.63 | 5.81 | 5.19 | 5.00 | 4.47 | 4.36 | 4.61 | 4.42 | 3.27 | 5.09 |
| Portugal | 6.41 | 6.33 | 4.87 | 4.03 | – | – | – | 2.45 | 2.45 | 2.17 | 1.90 | 3.83 |
| Romania | 23.51 | 26.42 | 25.85 | 24.61 | 22.56 | 19.15 | 18.30 | 17.33 | 17.28 | 16.52 | 16.08 | 20.69 |
| Slovakia | 2.55 | 2.16 | 2.84 | 2.90 | 2.38 | 2.07 | 2.07 | 1.15 | 1.56 | 1.69 | 1.40 | 2.07 |
| Slovenia | 1.06 | 2.15 | 2.67 | 2.08 | 1.18 | 1.02 | 0.86 | 2.15 | 1.93 | 1.43 | 1.33 | 1.62 |
| Spain | 1.57 | 1.60 | 1.48 | 1.37 | 1.29 | 1.33 | 1.06 | 1.08 | 0.86 | 0.88 | 0.99 | 1.23 |
| Sweden | 0.12 | 0.23 | 0.20 | 0.20 | 0.12 | 0.17 | 0.23 | 0.23 | 0.10 | 0.23 | 0.15 | 0.18 |
| Switzerland | 0.75 | 0.62 | 0.40 | 0.39 | 0.29 | 0.42 | 0.48 | 0.32 | 0.28 | 0.37 | 0.27 | 0.42 |
| United Kingdom | – | 0.93 | 1.09 | 1.06 | 0.88 | 0.88 | 0.91 | 0.80 | 0.85 | 0.74 | 0.63 | 0.80 |
| European Union | 5.43 | 5.09 | 4.74 | 4.83 | 4.61 | 3.96 | 3.85 | 3.63 | 3.11 | 2.87 | 2.59 | 4.06 |
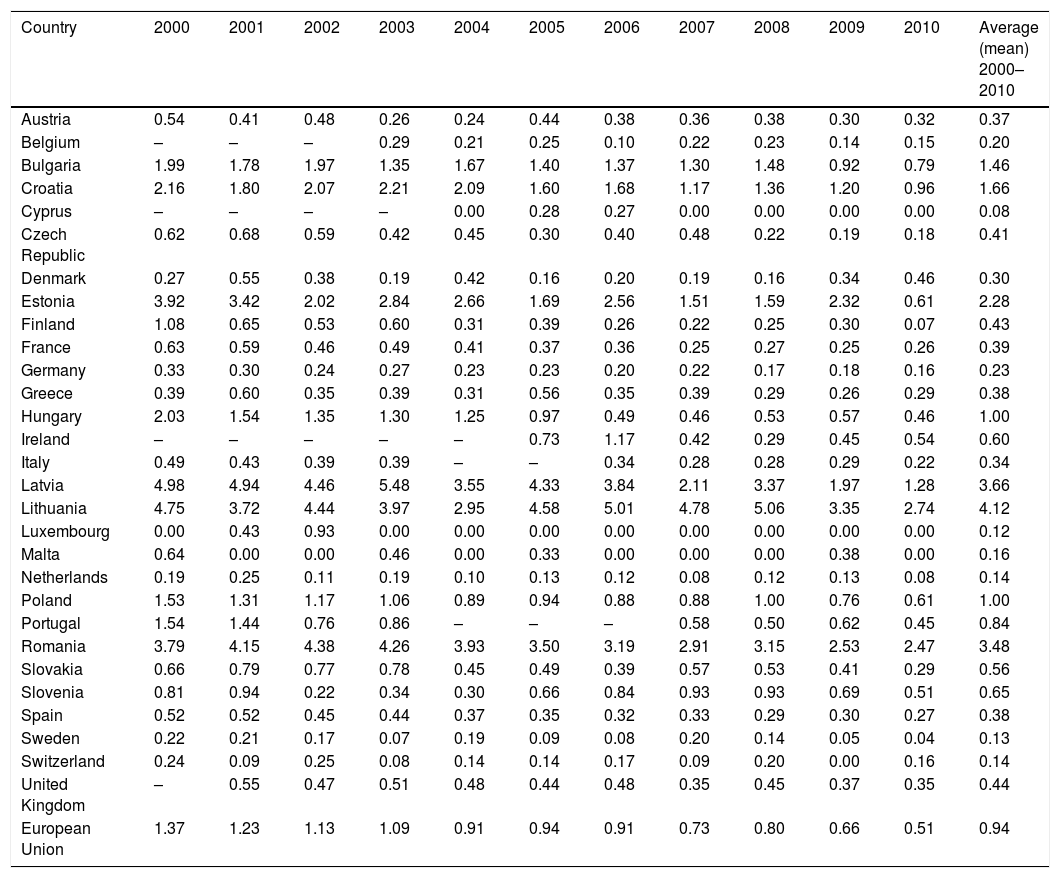
Age-standardised TB mortality rates per 100,000 in European Union for women.
| Country | 2000 | 2001 | 2002 | 2003 | 2004 | 2005 | 2006 | 2007 | 2008 | 2009 | 2010 | Average (mean) 2000–2010 |
|---|---|---|---|---|---|---|---|---|---|---|---|---|
| Austria | 0.54 | 0.41 | 0.48 | 0.26 | 0.24 | 0.44 | 0.38 | 0.36 | 0.38 | 0.30 | 0.32 | 0.37 |
| Belgium | – | – | – | 0.29 | 0.21 | 0.25 | 0.10 | 0.22 | 0.23 | 0.14 | 0.15 | 0.20 |
| Bulgaria | 1.99 | 1.78 | 1.97 | 1.35 | 1.67 | 1.40 | 1.37 | 1.30 | 1.48 | 0.92 | 0.79 | 1.46 |
| Croatia | 2.16 | 1.80 | 2.07 | 2.21 | 2.09 | 1.60 | 1.68 | 1.17 | 1.36 | 1.20 | 0.96 | 1.66 |
| Cyprus | – | – | – | – | 0.00 | 0.28 | 0.27 | 0.00 | 0.00 | 0.00 | 0.00 | 0.08 |
| Czech Republic | 0.62 | 0.68 | 0.59 | 0.42 | 0.45 | 0.30 | 0.40 | 0.48 | 0.22 | 0.19 | 0.18 | 0.41 |
| Denmark | 0.27 | 0.55 | 0.38 | 0.19 | 0.42 | 0.16 | 0.20 | 0.19 | 0.16 | 0.34 | 0.46 | 0.30 |
| Estonia | 3.92 | 3.42 | 2.02 | 2.84 | 2.66 | 1.69 | 2.56 | 1.51 | 1.59 | 2.32 | 0.61 | 2.28 |
| Finland | 1.08 | 0.65 | 0.53 | 0.60 | 0.31 | 0.39 | 0.26 | 0.22 | 0.25 | 0.30 | 0.07 | 0.43 |
| France | 0.63 | 0.59 | 0.46 | 0.49 | 0.41 | 0.37 | 0.36 | 0.25 | 0.27 | 0.25 | 0.26 | 0.39 |
| Germany | 0.33 | 0.30 | 0.24 | 0.27 | 0.23 | 0.23 | 0.20 | 0.22 | 0.17 | 0.18 | 0.16 | 0.23 |
| Greece | 0.39 | 0.60 | 0.35 | 0.39 | 0.31 | 0.56 | 0.35 | 0.39 | 0.29 | 0.26 | 0.29 | 0.38 |
| Hungary | 2.03 | 1.54 | 1.35 | 1.30 | 1.25 | 0.97 | 0.49 | 0.46 | 0.53 | 0.57 | 0.46 | 1.00 |
| Ireland | – | – | – | – | – | 0.73 | 1.17 | 0.42 | 0.29 | 0.45 | 0.54 | 0.60 |
| Italy | 0.49 | 0.43 | 0.39 | 0.39 | – | – | 0.34 | 0.28 | 0.28 | 0.29 | 0.22 | 0.34 |
| Latvia | 4.98 | 4.94 | 4.46 | 5.48 | 3.55 | 4.33 | 3.84 | 2.11 | 3.37 | 1.97 | 1.28 | 3.66 |
| Lithuania | 4.75 | 3.72 | 4.44 | 3.97 | 2.95 | 4.58 | 5.01 | 4.78 | 5.06 | 3.35 | 2.74 | 4.12 |
| Luxembourg | 0.00 | 0.43 | 0.93 | 0.00 | 0.00 | 0.00 | 0.00 | 0.00 | 0.00 | 0.00 | 0.00 | 0.12 |
| Malta | 0.64 | 0.00 | 0.00 | 0.46 | 0.00 | 0.33 | 0.00 | 0.00 | 0.00 | 0.38 | 0.00 | 0.16 |
| Netherlands | 0.19 | 0.25 | 0.11 | 0.19 | 0.10 | 0.13 | 0.12 | 0.08 | 0.12 | 0.13 | 0.08 | 0.14 |
| Poland | 1.53 | 1.31 | 1.17 | 1.06 | 0.89 | 0.94 | 0.88 | 0.88 | 1.00 | 0.76 | 0.61 | 1.00 |
| Portugal | 1.54 | 1.44 | 0.76 | 0.86 | – | – | – | 0.58 | 0.50 | 0.62 | 0.45 | 0.84 |
| Romania | 3.79 | 4.15 | 4.38 | 4.26 | 3.93 | 3.50 | 3.19 | 2.91 | 3.15 | 2.53 | 2.47 | 3.48 |
| Slovakia | 0.66 | 0.79 | 0.77 | 0.78 | 0.45 | 0.49 | 0.39 | 0.57 | 0.53 | 0.41 | 0.29 | 0.56 |
| Slovenia | 0.81 | 0.94 | 0.22 | 0.34 | 0.30 | 0.66 | 0.84 | 0.93 | 0.93 | 0.69 | 0.51 | 0.65 |
| Spain | 0.52 | 0.52 | 0.45 | 0.44 | 0.37 | 0.35 | 0.32 | 0.33 | 0.29 | 0.30 | 0.27 | 0.38 |
| Sweden | 0.22 | 0.21 | 0.17 | 0.07 | 0.19 | 0.09 | 0.08 | 0.20 | 0.14 | 0.05 | 0.04 | 0.13 |
| Switzerland | 0.24 | 0.09 | 0.25 | 0.08 | 0.14 | 0.14 | 0.17 | 0.09 | 0.20 | 0.00 | 0.16 | 0.14 |
| United Kingdom | – | 0.55 | 0.47 | 0.51 | 0.48 | 0.44 | 0.48 | 0.35 | 0.45 | 0.37 | 0.35 | 0.44 |
| European Union | 1.37 | 1.23 | 1.13 | 1.09 | 0.91 | 0.94 | 0.91 | 0.73 | 0.80 | 0.66 | 0.51 | 0.94 |
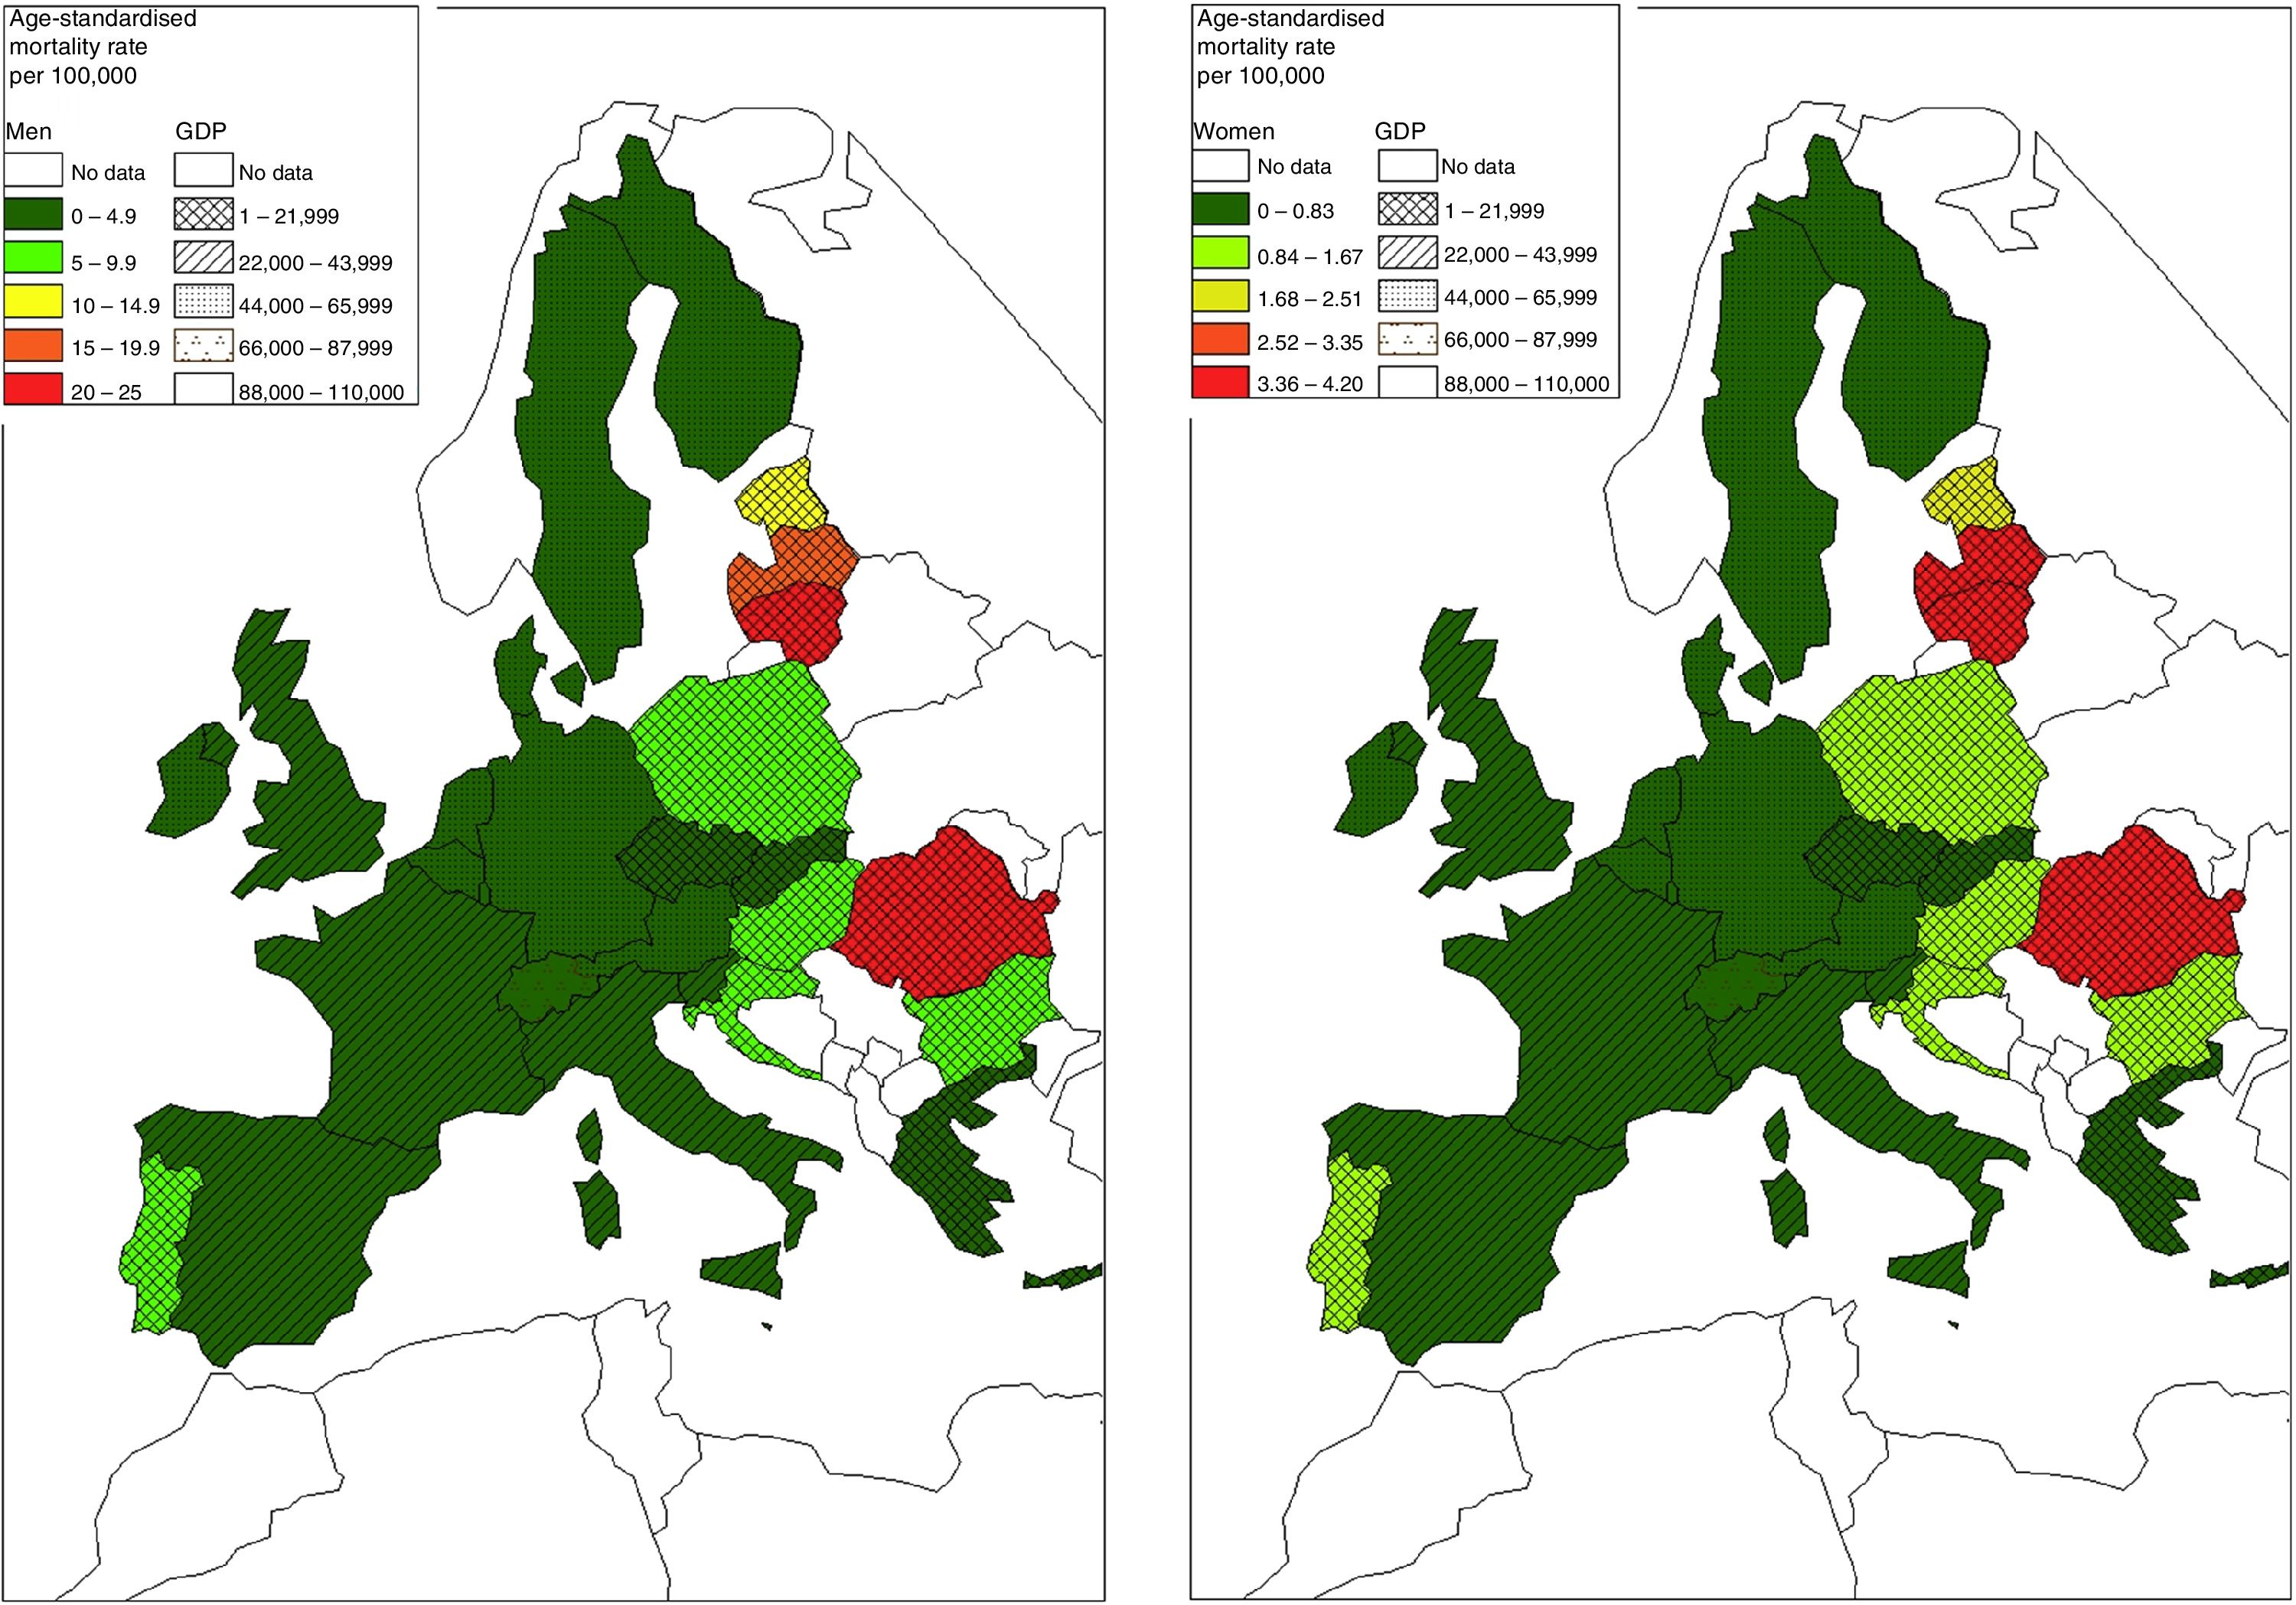
ArcGIS software was used to draw maps of distribution (Fig. 2). In each gender, we made 2 ranges of values divide into 5 equal categories (TB ASMR average and GDP 2013) which include the values of TB ASMR and GDP 2013.
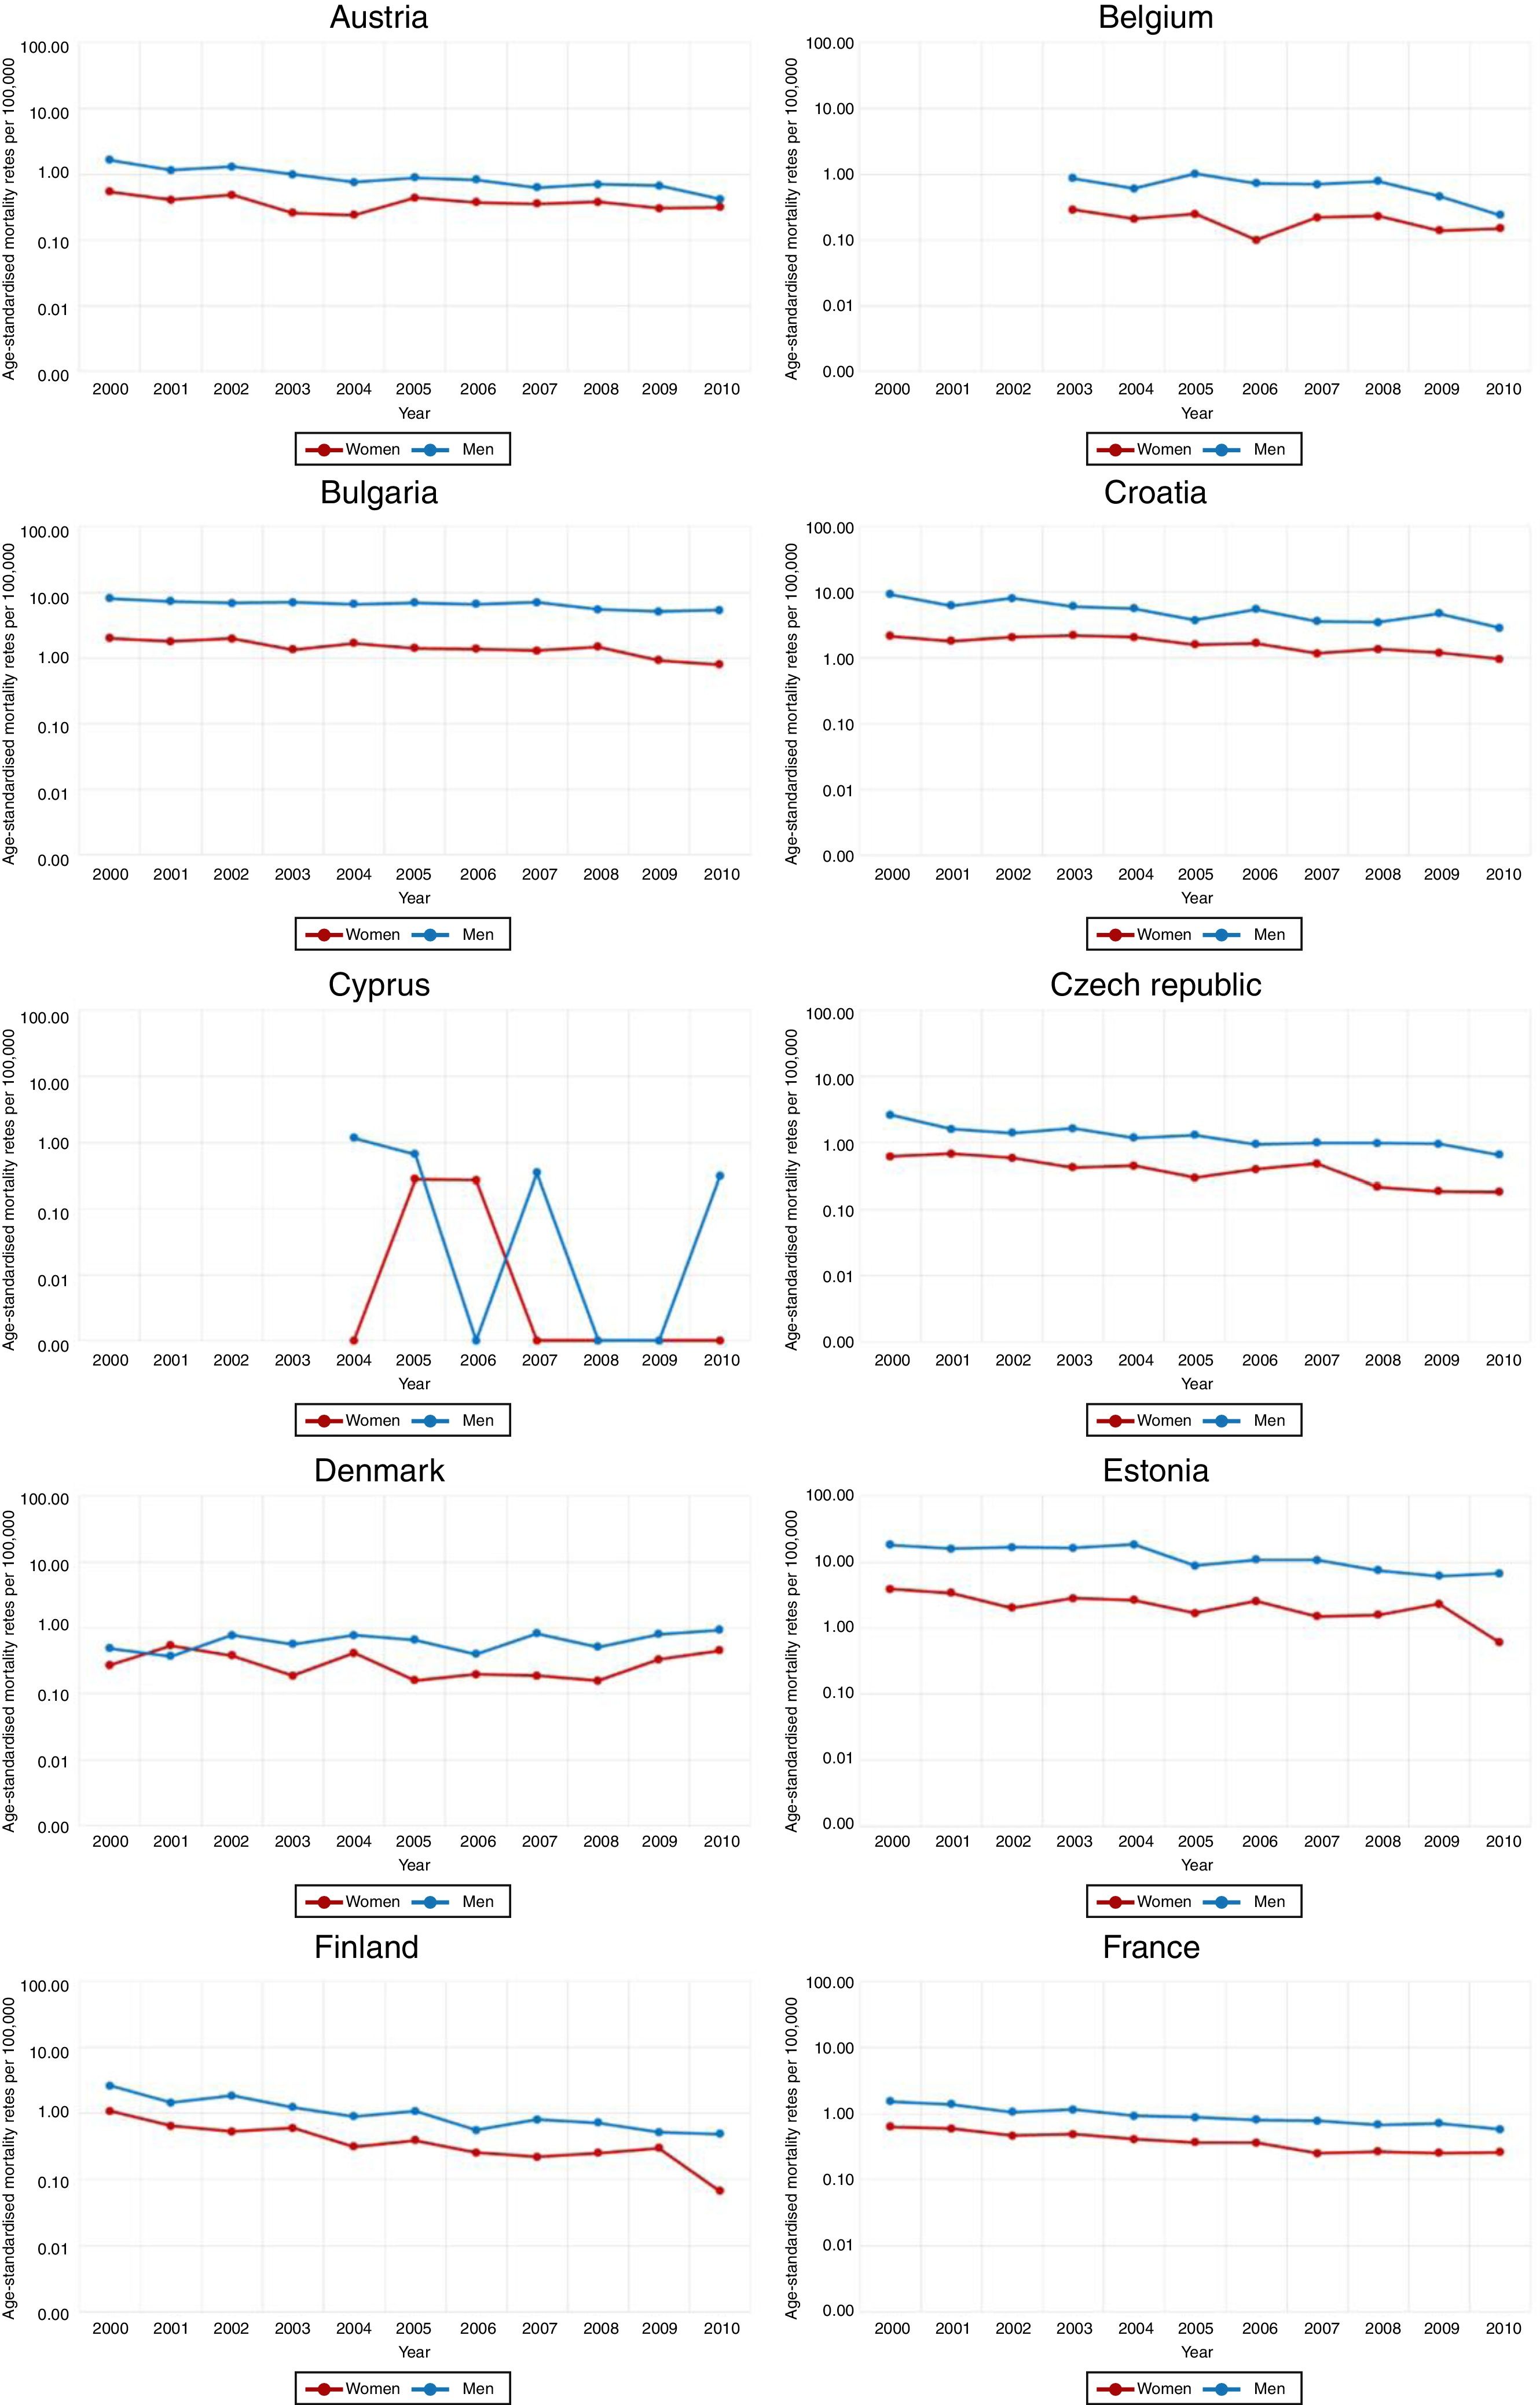
ResultsBetween 2000 and 2010, there were 68,771 recorded TB deaths in the EU, 50,599 in men (73.5%) and 18,172 in women (26.5%). Fig. 1 gives general view of the ASMR of TB trends in each EU country and in EU for general between 2000 and 2010. In this figure we can see that the gap between ASMR of TB for men and women is clear in EU for general and in all countries of study and even greater in countries of Eastern Europe (Bulgaria, Croatia, Poland, Romania) and of Baltic (Estonia, Latvia, Lithuania). For EU for general (last graphic in Fig. 1), the men-to-women ratio in ASMR increased from 3.96 in 2000 to 5.08 in 2010, which means that even the mortality rates declined in both genders, but it declined more so in women than men in relative terms.


Tables 1 and 2 show the ASMR of TB in all EU countries, for both men and women. TB ASMR decreased in men and women linearly in EU as a whole, despite there being variability between countries. However, we can see that the downward trend over the same period is greater in women in the majority of countries, and it is also clear that men have a higher ASMR of TB, which highlights a big gap between men and women (Fig. 1, Tables 1 and 2). The higher ASMR for both genders, correspond to East Europe and Baltic countries (Bulgaria, Croatia, Romania, Estonia, Lithuania, and Latvia). The lower ASMR for both genders correspond to Western European countries (Sweden and Netherlands).
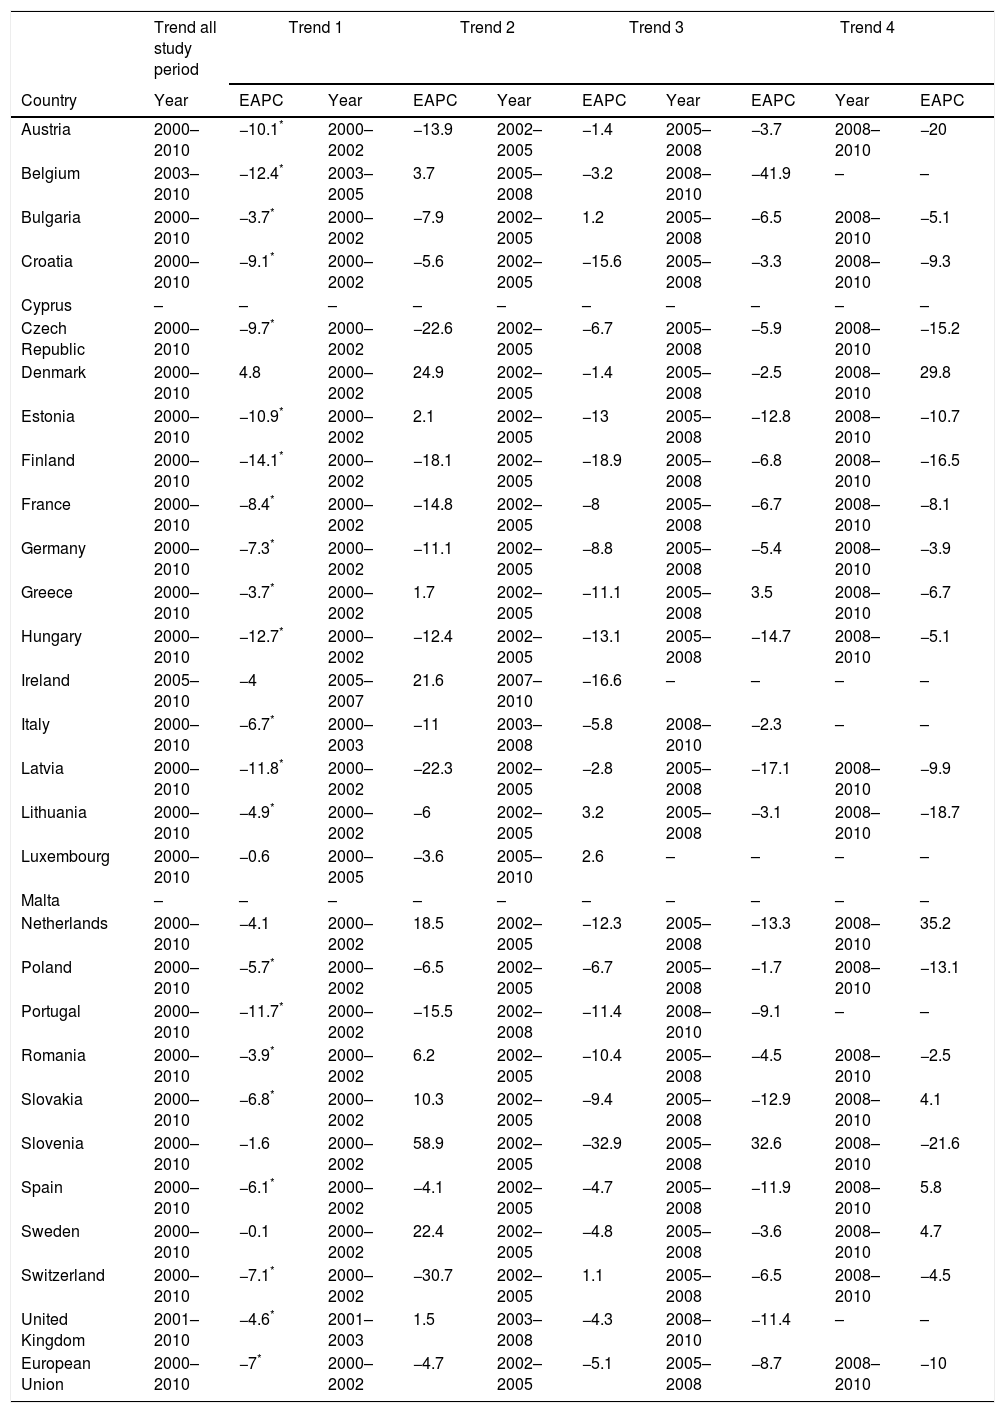
Table 3 shows that there is a significant decline in EU in men, by a significant EAPC (−7%), (p<0.05). It also shows that in all countries except Denmark, the trend in TB for men declined during study period. In addition, the majority of countries had a significant decrement in the trend in TB. In countries such as Finland (EAPC −14.1%), Hungary (EAPC −12.7%), Belgium (EAPC −12.4%), the ASMR of TB fell more than in other countries. Bulgaria (EAPC −3.7%), Greece (EAPC −3.7%) and Romania (EAPC −3.4%) had the lowest significant decline in ASMR of TB, while countries such as Ireland, Netherlands, Slovenia and Sweden did not have a significant decline. Denmark (EAPC 4.8%) is the only country that showed an upward trend in ASMR of TB.
Joinpoint analysis for TB mortality in European Union for men, 2000–2010.
| Trend all study period | Trend 1 | Trend 2 | Trend 3 | Trend 4 | ||||||
|---|---|---|---|---|---|---|---|---|---|---|
| Country | Year | EAPC | Year | EAPC | Year | EAPC | Year | EAPC | Year | EAPC |
| Austria | 2000–2010 | −10.1* | 2000–2002 | −13.9 | 2002–2005 | −1.4 | 2005–2008 | −3.7 | 2008–2010 | −20 |
| Belgium | 2003–2010 | −12.4* | 2003–2005 | 3.7 | 2005–2008 | −3.2 | 2008–2010 | −41.9 | – | – |
| Bulgaria | 2000–2010 | −3.7* | 2000–2002 | −7.9 | 2002–2005 | 1.2 | 2005–2008 | −6.5 | 2008–2010 | −5.1 |
| Croatia | 2000–2010 | −9.1* | 2000–2002 | −5.6 | 2002–2005 | −15.6 | 2005–2008 | −3.3 | 2008–2010 | −9.3 |
| Cyprus | – | – | – | – | – | – | – | – | – | – |
| Czech Republic | 2000–2010 | −9.7* | 2000–2002 | −22.6 | 2002–2005 | −6.7 | 2005–2008 | −5.9 | 2008–2010 | −15.2 |
| Denmark | 2000–2010 | 4.8 | 2000–2002 | 24.9 | 2002–2005 | −1.4 | 2005–2008 | −2.5 | 2008–2010 | 29.8 |
| Estonia | 2000–2010 | −10.9* | 2000–2002 | 2.1 | 2002–2005 | −13 | 2005–2008 | −12.8 | 2008–2010 | −10.7 |
| Finland | 2000–2010 | −14.1* | 2000–2002 | −18.1 | 2002–2005 | −18.9 | 2005–2008 | −6.8 | 2008–2010 | −16.5 |
| France | 2000–2010 | −8.4* | 2000–2002 | −14.8 | 2002–2005 | −8 | 2005–2008 | −6.7 | 2008–2010 | −8.1 |
| Germany | 2000–2010 | −7.3* | 2000–2002 | −11.1 | 2002–2005 | −8.8 | 2005–2008 | −5.4 | 2008–2010 | −3.9 |
| Greece | 2000–2010 | −3.7* | 2000–2002 | 1.7 | 2002–2005 | −11.1 | 2005–2008 | 3.5 | 2008–2010 | −6.7 |
| Hungary | 2000–2010 | −12.7* | 2000–2002 | −12.4 | 2002–2005 | −13.1 | 2005–2008 | −14.7 | 2008–2010 | −5.1 |
| Ireland | 2005–2010 | −4 | 2005–2007 | 21.6 | 2007–2010 | −16.6 | – | – | – | – |
| Italy | 2000–2010 | −6.7* | 2000–2003 | −11 | 2003–2008 | −5.8 | 2008–2010 | −2.3 | – | – |
| Latvia | 2000–2010 | −11.8* | 2000–2002 | −22.3 | 2002–2005 | −2.8 | 2005–2008 | −17.1 | 2008–2010 | −9.9 |
| Lithuania | 2000–2010 | −4.9* | 2000–2002 | −6 | 2002–2005 | 3.2 | 2005–2008 | −3.1 | 2008–2010 | −18.7 |
| Luxembourg | 2000–2010 | −0.6 | 2000–2005 | −3.6 | 2005–2010 | 2.6 | – | – | – | – |
| Malta | – | – | – | – | – | – | – | – | – | – |
| Netherlands | 2000–2010 | −4.1 | 2000–2002 | 18.5 | 2002–2005 | −12.3 | 2005–2008 | −13.3 | 2008–2010 | 35.2 |
| Poland | 2000–2010 | −5.7* | 2000–2002 | −6.5 | 2002–2005 | −6.7 | 2005–2008 | −1.7 | 2008–2010 | −13.1 |
| Portugal | 2000–2010 | −11.7* | 2000–2002 | −15.5 | 2002–2008 | −11.4 | 2008–2010 | −9.1 | – | – |
| Romania | 2000–2010 | −3.9* | 2000–2002 | 6.2 | 2002–2005 | −10.4 | 2005–2008 | −4.5 | 2008–2010 | −2.5 |
| Slovakia | 2000–2010 | −6.8* | 2000–2002 | 10.3 | 2002–2005 | −9.4 | 2005–2008 | −12.9 | 2008–2010 | 4.1 |
| Slovenia | 2000–2010 | −1.6 | 2000–2002 | 58.9 | 2002–2005 | −32.9 | 2005–2008 | 32.6 | 2008–2010 | −21.6 |
| Spain | 2000–2010 | −6.1* | 2000–2002 | −4.1 | 2002–2005 | −4.7 | 2005–2008 | −11.9 | 2008–2010 | 5.8 |
| Sweden | 2000–2010 | −0.1 | 2000–2002 | 22.4 | 2002–2005 | −4.8 | 2005–2008 | −3.6 | 2008–2010 | 4.7 |
| Switzerland | 2000–2010 | −7.1* | 2000–2002 | −30.7 | 2002–2005 | 1.1 | 2005–2008 | −6.5 | 2008–2010 | −4.5 |
| United Kingdom | 2001–2010 | −4.6* | 2001–2003 | 1.5 | 2003–2008 | −4.3 | 2008–2010 | −11.4 | – | – |
| European Union | 2000–2010 | −7* | 2000–2002 | −4.7 | 2002–2005 | −5.1 | 2005–2008 | −8.7 | 2008–2010 | −10 |
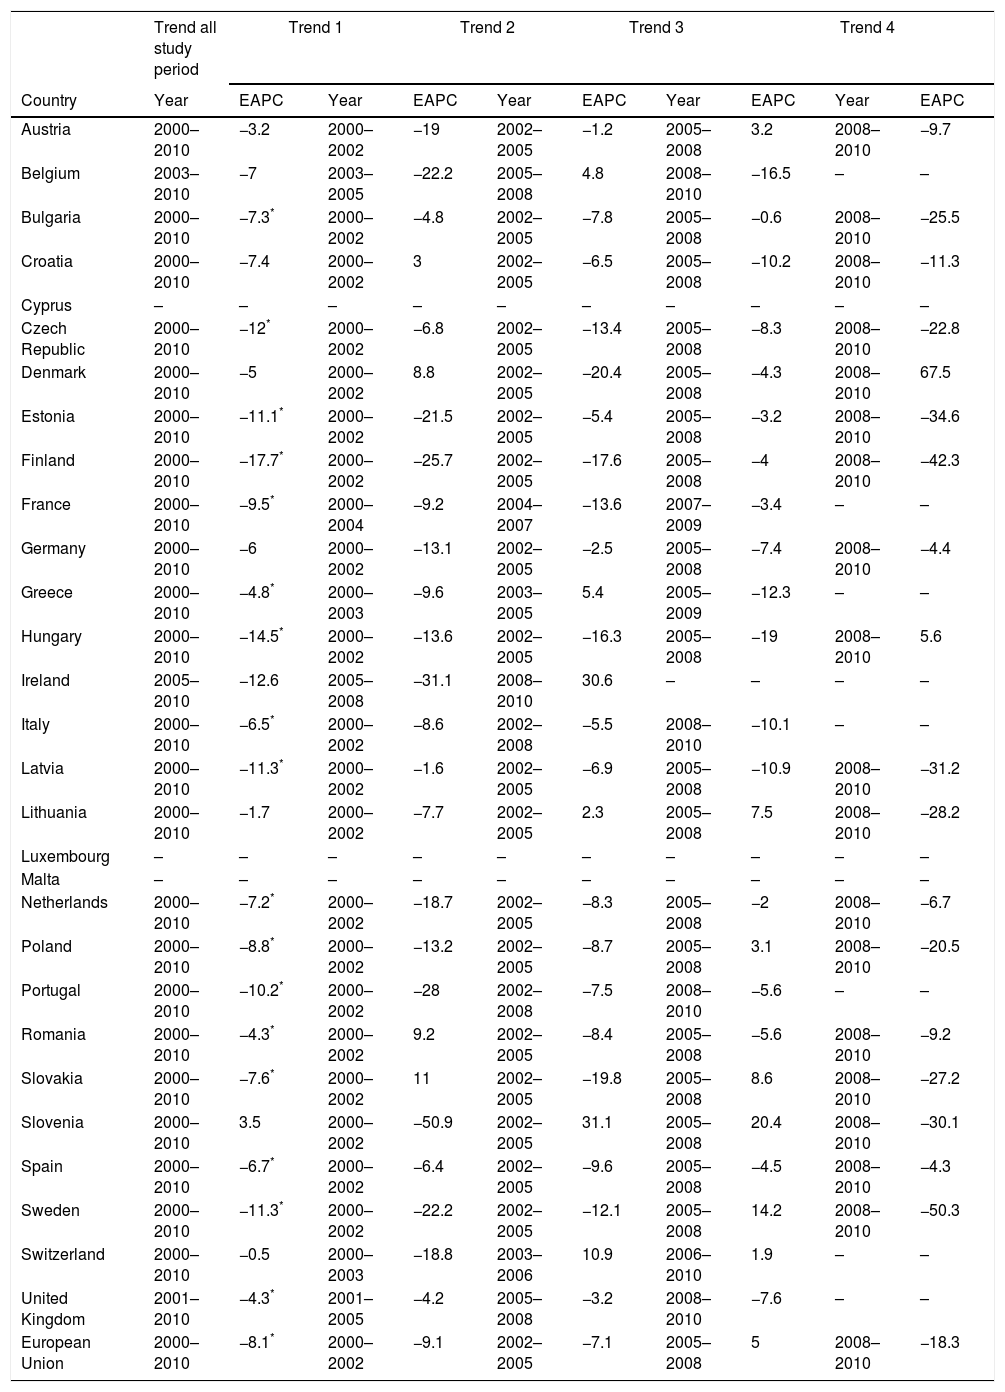
Table 4 shows that there is a significant decline in ASMR of TB in EU in women, by a significant EAPC (p=−8.1%) when (p<0.05). It also shows that in all countries except Slovenia, the trend in TB for women also declined, and the majority of countries had a significant decrement but in fewer countries than in men. Countries such as Finland (EAPC −17.7%), Hungary (EAPC −14.5%), Czech Republic (EAPC −12%) showed a greater decline than the other countries. Greece (EACP −4.8%), UK (EACP −4.3%) and Romania (EACP −4.3%) had lowest significant decline, while some countries had not significant decline. Slovenia (EACP 3.5%) is the only country that showed an upward but not significant.
Joinpoint analysis for TB mortality in European Union for women, 2000–2010.
| Trend all study period | Trend 1 | Trend 2 | Trend 3 | Trend 4 | ||||||
|---|---|---|---|---|---|---|---|---|---|---|
| Country | Year | EAPC | Year | EAPC | Year | EAPC | Year | EAPC | Year | EAPC |
| Austria | 2000–2010 | −3.2 | 2000–2002 | −19 | 2002–2005 | −1.2 | 2005–2008 | 3.2 | 2008–2010 | −9.7 |
| Belgium | 2003–2010 | −7 | 2003–2005 | −22.2 | 2005–2008 | 4.8 | 2008–2010 | −16.5 | – | – |
| Bulgaria | 2000–2010 | −7.3* | 2000–2002 | −4.8 | 2002–2005 | −7.8 | 2005–2008 | −0.6 | 2008–2010 | −25.5 |
| Croatia | 2000–2010 | −7.4 | 2000–2002 | 3 | 2002–2005 | −6.5 | 2005–2008 | −10.2 | 2008–2010 | −11.3 |
| Cyprus | – | – | – | – | – | – | – | – | – | – |
| Czech Republic | 2000–2010 | −12* | 2000–2002 | −6.8 | 2002–2005 | −13.4 | 2005–2008 | −8.3 | 2008–2010 | −22.8 |
| Denmark | 2000–2010 | −5 | 2000–2002 | 8.8 | 2002–2005 | −20.4 | 2005–2008 | −4.3 | 2008–2010 | 67.5 |
| Estonia | 2000–2010 | −11.1* | 2000–2002 | −21.5 | 2002–2005 | −5.4 | 2005–2008 | −3.2 | 2008–2010 | −34.6 |
| Finland | 2000–2010 | −17.7* | 2000–2002 | −25.7 | 2002–2005 | −17.6 | 2005–2008 | −4 | 2008–2010 | −42.3 |
| France | 2000–2010 | −9.5* | 2000–2004 | −9.2 | 2004–2007 | −13.6 | 2007–2009 | −3.4 | – | – |
| Germany | 2000–2010 | −6 | 2000–2002 | −13.1 | 2002–2005 | −2.5 | 2005–2008 | −7.4 | 2008–2010 | −4.4 |
| Greece | 2000–2010 | −4.8* | 2000–2003 | −9.6 | 2003–2005 | 5.4 | 2005–2009 | −12.3 | – | – |
| Hungary | 2000–2010 | −14.5* | 2000–2002 | −13.6 | 2002–2005 | −16.3 | 2005–2008 | −19 | 2008–2010 | 5.6 |
| Ireland | 2005–2010 | −12.6 | 2005–2008 | −31.1 | 2008–2010 | 30.6 | – | – | – | – |
| Italy | 2000–2010 | −6.5* | 2000–2002 | −8.6 | 2002–2008 | −5.5 | 2008–2010 | −10.1 | – | – |
| Latvia | 2000–2010 | −11.3* | 2000–2002 | −1.6 | 2002–2005 | −6.9 | 2005–2008 | −10.9 | 2008–2010 | −31.2 |
| Lithuania | 2000–2010 | −1.7 | 2000–2002 | −7.7 | 2002–2005 | 2.3 | 2005–2008 | 7.5 | 2008–2010 | −28.2 |
| Luxembourg | – | – | – | – | – | – | – | – | – | – |
| Malta | – | – | – | – | – | – | – | – | – | – |
| Netherlands | 2000–2010 | −7.2* | 2000–2002 | −18.7 | 2002–2005 | −8.3 | 2005–2008 | −2 | 2008–2010 | −6.7 |
| Poland | 2000–2010 | −8.8* | 2000–2002 | −13.2 | 2002–2005 | −8.7 | 2005–2008 | 3.1 | 2008–2010 | −20.5 |
| Portugal | 2000–2010 | −10.2* | 2000–2002 | −28 | 2002–2008 | −7.5 | 2008–2010 | −5.6 | – | – |
| Romania | 2000–2010 | −4.3* | 2000–2002 | 9.2 | 2002–2005 | −8.4 | 2005–2008 | −5.6 | 2008–2010 | −9.2 |
| Slovakia | 2000–2010 | −7.6* | 2000–2002 | 11 | 2002–2005 | −19.8 | 2005–2008 | 8.6 | 2008–2010 | −27.2 |
| Slovenia | 2000–2010 | 3.5 | 2000–2002 | −50.9 | 2002–2005 | 31.1 | 2005–2008 | 20.4 | 2008–2010 | −30.1 |
| Spain | 2000–2010 | −6.7* | 2000–2002 | −6.4 | 2002–2005 | −9.6 | 2005–2008 | −4.5 | 2008–2010 | −4.3 |
| Sweden | 2000–2010 | −11.3* | 2000–2002 | −22.2 | 2002–2005 | −12.1 | 2005–2008 | 14.2 | 2008–2010 | −50.3 |
| Switzerland | 2000–2010 | −0.5 | 2000–2003 | −18.8 | 2003–2006 | 10.9 | 2006–2010 | 1.9 | – | – |
| United Kingdom | 2001–2010 | −4.3* | 2001–2005 | −4.2 | 2005–2008 | −3.2 | 2008–2010 | −7.6 | – | – |
| European Union | 2000–2010 | −8.1* | 2000–2002 | −9.1 | 2002–2005 | −7.1 | 2005–2008 | 5 | 2008–2010 | −18.3 |
By observing EAPC data for men and women in EU (Tables 3 and 4) when the EAPC for all period of study in women is −8.1 and it is more than in men −7, whereby the decrease TB ASMR is slightly more in women, it is demonstrated why the men-to-women ratio increased from 3.96 in 2000 to 5.08 in 2010.
Fig. 2 presents the TB ASMR average and GDP 2013 distribution in EU for men and women. There was a negative correlation between GDP and Tuberculosis (r=−0.378, p=0.003) and positive with GINI index (r=0.482, p<0.0005) and unemployment (r=0.402, p=0.002). We did not find any association with the evolution of the GDP.

In a multiple lineal regression the model of Tuberculosis Age-standardised Mortality Rate will be: TMR=−13.735+3.092 (Gender Male)+0.449 (GINI)+0.234 (Unemployment)–0.00003 (GDP). That means that tuberculosis mortality is higher in men by (3.092), increase with inequities (GINI) by (0.449) and unemployment by (0.234) and decrease with GDP by (0.00003).
DiscussionThe fall European ASMR of TB is a global trend. The decrease in ASMR of TB has some notable key features. First, although men have a higher ASMR than women in all countries, the trend in EU overall and by country, is a fall in the mortality rates for both genders, with higher decreases for women than men. The difference in mortality rates between men and women is commonly attributed to biological, including hormonal and immunity differences, behavioral habits such as cigarette smoking or alcoholism, and epidemiological characteristics as well as socio-economic and cultural barriers in access to health care.14,15 Second, these mortality trends differ between countries and gender, with some countries having higher mortality rates than the EU average. Third, the joinpoint analysis allowed identification of time-points at which trends changed in different countries. The multiple regression lineal model found that TB ASMR is higher in the countries with lower economic resources and more inequalities.
Our results showed that Eastern European and Baltic countries (Bulgaria, Romania, Lithuania, Latvia, and Estonia) present higher ASMR of TB in both gender than Western European countries. In addition, two Eastern European countries (Bulgaria and Romania) presented had the lowest significant decline in ASMR of TB for men, and Romania for women. The gap between ASMR of TB for men and women is observed in all countries, but this gap in countries such as Bulgaria, Lithuania, Poland and Romania is more notable, taking into account that these countries have lower income compared with other EU countries, the high ASMR of TB in those countries are consistent with global studies that demonstrates that TB is a disease that thrives where social and economic determinants of ill health and poverty prevail.2,16 In these countries, a higher mortality of MDR-TB patients, including MDR-TB HIV patients, have been observed with some shortcomings in the management and treatment.17,18 On the other hand, health inequalities from studies of mortality in Europe are more prenominated in Eastern Europe and Baltic countries.19
Factors associated with the prevalence of TB including low access to health-care, longer delays in the diagnosis of TB, insufficient quality treatment, and increase of homeless population, migrant groups and prison population.20,21 In addition, unemployment and job insecurity appear to lead to behavior that increases the risk for TB, e.g. increase tobacco consumption, substance abuse and hazardous drinking, all of which could impair immunity. Alcohol can increase susceptibility to some infectious diseases, such as Pneumonia and TB.22 A study23 demonstrated that during the economic recession (2008–2011) in the EU, the detection rates declined by a mean of 5.2%. A recently published systematic review5 showed that an economic crisis indeed led to increased incidence, prevalence or mortality of TB.
Since the onset of the recession, several EU countries have introduced user fees or budget cuts to infectious disease programs, including charges for prescription drugs, shifted approximately 50% of the costs of diagnostic testing to patients and reduced spending on disease control and surveillance. Even in the absence of an economic crisis, infectious diseases disproportionately affect vulnerable groups. A study comparing wealth distribution and TB rates across EU member states demonstrated a strong correlation between income equality and lower TB rates.24 The association between economic deprivation and TB is well established and widespread. Socio-economic inequalities have extended in Eastern Europe in particular.25
The global TB case-fatality rates are reported to be between 7% and 35% and risk factors for death may include non-infective comorbidities, human immunodeficiency virus (HIV) infection, multi-drug resistant tuberculosis MDR-TB, and malnutrition.26 In addition, old age, alcohol consumption, intravenous drug, and unemployment are other risk factors.27,28 The higher TB mortality in Eastern Europe and Baltic countries have been associated with lower education level,25,29 higher prevalence of HIV and MDR-TB, and differences in relation of health care of HIV subjects such as deficiencies in drug susceptibility testing and initial TB treatment.30 In addition, the prevalence of smoking habit is higher in the Eastern Europe and Baltic countries than the Western countries, but only for men and not for women. This may explain some gender differences in TB morbidity and mortality in these countries.31,32
Since WHO defined TB deaths as the number of TB patients dying during treatment, irrespective of cause,33 most studies have used all-cause mortality as a surrogate marker of mortality attributable to TB. Nevertheless, knowing the actual underlying cause of death, especially whether it was TB-related or not, is valuable in monitoring TB control and may help in identifying effective interventions. Research evidence shows that, at least in England, use of the underlying cause alone, for TB, captures only about half of all deaths with TB as a certified cause of death.34 However, the quality of the European death certificate has been studied.35 The TB death certificate quality has been also validated.36,37 Based on that, we supposed that in general, TB as cause of death is well included in the official statistics.
Data on TB as the underlying cause of death for EU countries were retrieved from Eurostat (updated: October 2010). ICD-10 codes A15-19 and B90 were captured. For other countries data were obtained from the European mortality database (MDB) or alternatively from Centralized Information System for Infectious Diseases (CISID) (updated: August 2010), if MDB did not contain the necessary information. These data are coded and reported via national vital registration authorities, or National TB Program Managers. In any event, we suppose, that use of underlying cause alone for TB probably does not fundamentally undermine our findings.
During the late 1990s and early 2000s, nearly all EU countries switched from using the 9th to using the 10th revision of ICD. Converting between the “old” and “new” versions of ICD is complicated by significant differences between the versions. Whilst the quality of the mortality data collection in European countries is generally high, coding of death certificates has some problems. Then comparisons between countries, and over time, may not be counting the same causes of death as different practitioners may assign the same cause of death to different codes. Impact of switching between ICD9 and ICD10 existed in just three countries of the twenty-nine countries. Additionally, some of the apparent changes in trends may be due to artifact, but that is unlikely to affect the general conclusion that for both countries and sexes, TB mortality rates are continuing to decline in EU.
Our results are consistent with trends previously described in several countries, including the United States (US), China and Mexico.38–40 In the US, overall, the number of TB deaths reported annually has decreased by 67% since 1992. In China, from 2004 to 2010, the mortality rates due to all TB and pulmonary TB decreased by 36.02% and 37.70%, respectively. In Mexico, the ASMR per 100,000 inhabitants who died from pulmonary TB decreased from 4.1 to 2 between 2000 and 2009. About 75% of total TB deaths occurred in the African and South-East Asia Regions in 2012 (both including and excluding TB deaths among HIV-positive people). India and South Africa accounted for about 30% of global TB deaths. Studying the trends in TB as a cause of death in Africa is quite complex since Africa has a high incidence, prevalence and mortality of HIV. The TB HIV co-infection therefore is high and the worldwide spread of HIV infection has undermined human defenses against Mycobacterium tuberculosis.
Reducing inequalities in health between socio-economic groups within a country is one of the greatest challenges for public health, even in the highly developed welfare states of Europe. Several European countries—such as England, Finland, and Lithuania—have adopted national targets for the reduction of socio-economic inequalities in mortality. In a context of declining mortality, where baseline levels of mortality are higher in lower socio-economic groups than in higher socio-economic groups, the only way to reduce inequalities in mortality is to achieve stronger reductions in lower socio-economic groups than in higher socio-economic groups.25 Given the likely influence of an economic crisis on the functioning of healthcare systems and on factors that affect the epidemiology of TB, it is expected that the current economic crisis will have an effect on the TB situation in EU countries. This will be especially true in countries that were already experiencing problems with TB control before.41
Demographic changes in essence slow the progress of TB control, a factor that should be built into considerations for funding and program strategies. The established links between alcohol, diabetes, tobacco smoking and TB also mean that trends in these risk factors can modulate trends in TB.42 New strategies, better diagnostic tests, new drug regimes, and more broadly protective vaccines are all urgently needed.
The 2013 Report on Tuberculosis Research Funding Trends 2005–2012 shows that funding for Tuberculosis research and development dropped by $30.4 million in 2012 compared with 2011. A study showed, that each European country needs its own tailored strategy for tackling health inequalities and no one country had the smallest inequalities in all determinants of health inequalities.43 TB mortality is influenced by other diseases, specially HIV, a specific and deep study must be done to explore a joint mortality rates of both diseases TB and HIV. On another hand, modeling studies have shown that under specific circumstances MDR-TB could reverse important gains made in combating tuberculosis.44 Future revisions of the burden of disease should examine more carefully the evidence on the levels and trends in MDR-TB.
ConclusionThe trends in TB mortality in EU overall (not by country) decreased during the period of study in both genders, men having a higher TB mortality rates than women in all countries of study. Notable differences of ASMR among countries remain. Our findings were consistent with the downward trend in many other countries globally.
Conflicts of interestThe authors declare no conflict of interest.