


To assess agreement between fasting plasma glucose (FPG) and hemoglobin A1c (HbA1c) levels for diagnosis of dysglycemia (diabetes and risk of diabetes), overall and depending on clinical characteristics.
MethodsThe study enrolled 1020 adult subjects without drug-treated diabetes who underwent a laboratory test at a Spanish health care center. The criteria for dysglycemia of the American Diabetes Association were used. A logistic regression analysis was used to predict de novo diagnosis of dysglycemia based on sex, age, body mass index, anemia, and iron levels.
ResultsOverall prevalence of dysglycemia was 28.04%, and was identified by FPG only in 13.63% of subjects, by both FPG and HbA1c in 7.65%, and by HbA1c only in 6.76% (de novo diagnoses). Independent predictors of de novo diagnoses based on HbA1c were female sex (odds ratio [OR]: 2.119, 95% confidence interval [CI]: 1.133–4.020; p<0.020), age (OR for 42–56 years: 2.541, 95% CI: 0.634–17.140; OR for ≥57 years: 5.656, 95% CI: 1.516–36.980; overall p<0.007), and serum ferritin levels (borderline significance).
ConclusionsIn this study population, agreement between FPG and HbA1c for diagnosis of dysglycemia was poor, with FPG being the test that identified more subjects. De novo diagnoses based on HbA1c were more common in females and increased with age.
Evaluar la concordancia entre el diagnóstico de disglucemia (diabetes y riesgo de diabetes) realizado por glucemia basal (GB) y hemoglobina A1c (HbA1c), globalmente y según características clínicas.
MétodosEl estudio incluyó a 1.020 sujetos adultos con diabetes no tratada con fármacos que realizaron una prueba de laboratorio en un centro de salud español. Los criterios de disglucemia fueron los de la American Diabetes Association. Se utilizó un análisis de regresión logística para predecir un nuevo diagnóstico de disglucemia a partir del sexo, edad, índice de masa corporal, presencia de anemia y estatus férrico.
ResultadosLa prevalencia global de disglucemia fue del 28,04%, identificada únicamente por GB en el 13,63% de los sujetos, por GB y HbA1c en el 7,65% y solo por HbA1c en el 6,76% (nuevos diagnósticos). Los predictores independientes de nuevo diagnóstico según HbA1c fueron el sexo femenino (odds ratio [OR]: 2,119; intervalo de confianza [IC] 95%: 1,133-4,020; p<0,020), la edad (OR para 42-56 años: 2,541; IC 95%: 0,634-17,140; OR para ≥57 años: 5,656, IC 95%: 1,516-36,980; p<0,007 en general) y la ferritina sérica (significación límite).
ConclusionesEn esta población la concordancia entre GB y HbA1c para el diagnóstico de disglucemia es pobre; la GB es la prueba que identifica más sujetos. Los nuevos diagnósticos por HbA1c se realizan con mayor frecuencia en mujeres y aumentan con la edad.
In 2009 the International Expert Committee recommended the use of hemoglobin A1c (HbA1c) for the diagnosis of diabetes mellitus (DM) and prediabetes.1 Before that, HbA1c was already the gold standard for chronic glycemic control of patients with DM.2,3 In 2010, the American Diabetes Association (ADA) endorsed the recommendations of the Expert Committee for diagnosis of DM (HbA1c≥6.5% (48mmol/mol) as the preferred method, with fasting plasma glucose (FPG) ≥7.0mmol/l and 2h plasma glucose (2hPG)≥11.1mmol/l also considered valid).4 As to risk of DM, the ADA HbA1c criterion (≥5.7% (39mmol/mol)) was lower than that of the Expert Committee (≥6.0% (42mmol/mol)), while FPG (≥5.6mmol/l) and 2h PG (≥7.8mmol/l) cut-offs were the same for both ADA and Expert Committee criteria. World Health Organization (WHO) approved HbA1c for the diagnosis of DM in 2011 but did not include it for the diagnosis of earlier stages of dysglycemia.5 The use of HbA1c offers advantages over FPG (no fasting or preparation are required, provides an estimate of chronic glycemic exposure, and has reduced biological variability and lower preanalytical instability).1 HbA1c also presents several disadvantages vs. FPG (higher cost, limited relationship with glucose concentration in certain individuals, and, in some countries, absence of standardized measurement and limited availability).6 Furthermore, HbA1c may be influenced by anemia and hemoglobinopathies. Several studies have reported poor agreement between diagnoses after HbA1c and glucose.7–13 The figure is usually higher with FPG8–11 although higher figures with HbA1c have also been reported7,12,13 specially in backgrounds with a high prevalence of iron deficiency.13 Agreement is influenced by sex and ethnicity with differences being more pronounced in women and non-White subjects.7
With this background, the aim of the present study was to evaluate the agreement between FPG and HbA1c for the diagnosis of dysglycemia, both overall and according to different clinical characteristics. The departing hypothesis was that hematological parameters (anemia and/or iron status) would influence agreement.
MethodsDesignA convenience population was addressed: ambulatory subjects performing a fasting lab test in a Spanish Health Care Center (hospital workers performing a lab test requested by the Department of Occupational Health or subjects where their primary care physician had ordered a blood test). Inclusion criteria were: men and non-pregnant women aged over 18 and without drug-treated DM. There were no exclusion criteria.
EthicsAll procedures were performed in accordance with guidelines established by the Declaration of Helsinki. The relevant Ethics Committees approved the protocol and waived the obtaining of informed consent (the protocol used blood that remained unneeded after performing the requested tests).
Patients and laboratory methodsInformation on age, sex, body mass index (BMI) and drug treatment was obtained from the clinical records.
Blood glucose was measured with a glucose oxidase method and preanalytical anaerobic glycolysis was prevented either with the use of sodium fluoride or through plasma separation shortly after extraction.
HbA1c was measured in a central laboratory with Homogeneous Immunoassays. The HbA1c determination is based on the turbidimetric inhibition immunoassay for hemolyzed whole blood (Tina-quant Hemoglobin A1c Gen.3, Cobas 6000; Roche Diagnostics, Switzerland). This procedure has been standardized according to the International Federation of Clinical Chemistry reference method.
Serum ferritin was measured in a central lab using the Roche electrochemiluminescence immunoassay (Cobas 8000; Roche Diagnostics, Switzerland).
CriteriaThe criteria for the diagnosis of DM and risk of DM were those of the ADA4; DM: FPG ≥7.0mmol/l, HbA1c≥6.5% (48mmol/mol); risk of DM: FPG≥5.6mmol/l, and HbA1c≥5.7% (39mmol/mol). DM and risk of DM were combined into a single category (dysglycemia).
Anemia was defined according to WHO criteria as a hemoglobin concentration <130g/l in men and <120g/l in (non-pregnant) women.14 Similarly, iron status and iron deficiency were defined according to WHO criteria, that establishes normal serum ferritin in adult subjects as 15–200μg/dl.15
Statistical analysisAssuming a prevalence of dysglycemia of 10%,16 a statistical power of 80%, and a type I error of 5%, the sample size to perform a concordance analysis with the test of McNemar's was estimated in 500 subjects. As the null hypothesis of the McNemar's test was rejected in most cases implying that k was not a good estimator of concordance, a decision was taken to increase the sample size and address new diagnoses of dysglycemia.
Categorical variables were expressed as absolute and relative frequencies, and continuous variables, being non-normally distributed, as median (Percentile 25 [P25], Percentile 75[P75]).
First, contingency tables on subject dysglycemia status according to FPG and HbA1c were drawn to assess agreement. True-positive (TP), true-negative (TN), false-positive (FP), and false-negative (FN) cases were determined using FPG as the reference (historical) method. Sensitivity (TP/TP+FN), specificity (TN/TN+FP) and overall concordance rate (TP+TN/TP+FN+TN+FP)were calculated. Agreement was evaluated after kappa coefficient (k): poor (k<0.20), fair (0.21–0.40), moderate (0.41–0.60), good (0.61–0.80), or strong (0.81–1.00).17 McNemar's test was used to determine whether k was a good concordance estimator. Venn diagrams were drawn to graphically display agreement between positive diagnoses performed after FPG and HbA1c by using Venn Diagram Plotter, version 1.5.5228. Receiver operating characteristic (ROC) curve analyses were also performed.
Agreement between diagnoses performed after FPG and HbA1c was analyzed in the entire sample and according to different clinical characteristics (sex, age, BMI), anemia and iron status). Prevalence of dysglycemia and prevalence of new diagnoses performed with HbA1c were compared using a Pearson's Chi-square test or Fisher's exact test.
A stepwise logistic regression was used to identify independent predictors of new diagnoses. We considered sex, age, BMI, hemoglobin and ferritin as potentially predictive variables. Models were constructed using age, BMI, hemoglobin and ferritin as either quantitative or qualitative variables and also including quadratic terms. Age was transformed into a qualitative variable using tertiles and BMI, hemoglobin and ferritin using WHO clinical categories. Male sex, age≤41 years, BMI≤25kg/m2, non-anemic status and iron deficiency were considered the reference categories. The best model was identified using an algorithm.
All statistical procedures were performed with R software, version 2.15.0 and significance was set at a p value of <0.05.
ResultsThe recruitment period was from 1st May 2011 until 31st Aug 2012. A total of 1020 subjects were included in the study and 56.1% were females. Population characteristics were as follows: age 50 (33.3, 59.0) years, BMI 24.8 (22.6, 27.4)kg/m2, hemoglobin 141.0 (132.0, 152.0)g/l and ferritin 89.9 (42.1, 172.6)μg/l. Glycemia was 5.05 (4.66, 5.44)mmol/l and HbA1c 5.3 (5.1, 5.5) %, 34 (32, 37)mmol/mol. According to WHO criteria, 6.4% of patients were anemic, 6.8% had iron deficiency, and 22.9% iron overload.
The overall prevalence of dysglycemia was 28.04% (13.63% only after FPG, 7.65% after both FPG and HbA1c, 6.76% only after HbA1c). The corresponding figures for DM were 1.3% (0.7% only after FPG, 0.1% after both FPG and HbA1c, 0.5% only after HbA1c).
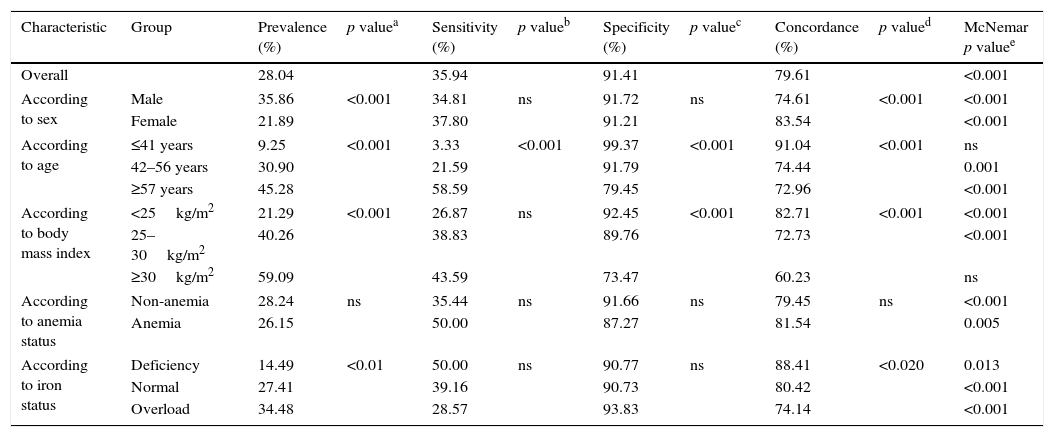
Prevalence of dysglycemia and measures of performance of HbA1c against FPG (historical gold standard) are displayed in Table 1. Performance measures for the entire population were: sensitivity 35.94%, specificity 91.41%, concordance 79.61%, and k coefficient 0.31.
Prevalence of dysglycemia after fasting plasma glucose and/or hemoglobin A1c. Performance of hemoglobin A1c as a diagnostic test vs fasting plasma glucose.
| Characteristic | Group | Prevalence (%) | p valuea | Sensitivity (%) | p valueb | Specificity (%) | p valuec | Concordance (%) | p valued | McNemar p valuee |
|---|---|---|---|---|---|---|---|---|---|---|
| Overall | 28.04 | 35.94 | 91.41 | 79.61 | <0.001 | |||||
| According to sex | Male | 35.86 | <0.001 | 34.81 | ns | 91.72 | ns | 74.61 | <0.001 | <0.001 |
| Female | 21.89 | 37.80 | 91.21 | 83.54 | <0.001 | |||||
| According to age | ≤41 years | 9.25 | <0.001 | 3.33 | <0.001 | 99.37 | <0.001 | 91.04 | <0.001 | ns |
| 42–56 years | 30.90 | 21.59 | 91.79 | 74.44 | 0.001 | |||||
| ≥57 years | 45.28 | 58.59 | 79.45 | 72.96 | <0.001 | |||||
| According to body mass index | <25kg/m2 | 21.29 | <0.001 | 26.87 | ns | 92.45 | <0.001 | 82.71 | <0.001 | <0.001 |
| 25–30kg/m2 | 40.26 | 38.83 | 89.76 | 72.73 | <0.001 | |||||
| ≥30kg/m2 | 59.09 | 43.59 | 73.47 | 60.23 | ns | |||||
| According to anemia status | Non-anemia | 28.24 | ns | 35.44 | ns | 91.66 | ns | 79.45 | ns | <0.001 |
| Anemia | 26.15 | 50.00 | 87.27 | 81.54 | 0.005 | |||||
| According to iron status | Deficiency | 14.49 | <0.01 | 50.00 | ns | 90.77 | ns | 88.41 | <0.020 | 0.013 |
| Normal | 27.41 | 39.16 | 90.73 | 80.42 | <0.001 | |||||
| Overload | 34.48 | 28.57 | 93.83 | 74.14 | <0.001 | |||||
Prevalence of dysglycemia varied with sex, age, BMI and iron status but not with anemia. Performance measures of HbA1c as a diagnostic test of dysglycemia also varied according to clinical characteristics. Sensitivity increased with age while specificity decreased with age and BMI. Overall concordance decreased with increasing age and BMI. The null hypothesis for the McNemar's test was rejected in all but two groups (age ≤41 years and BMI ≥30kg/m2) and k was a valid measurement of concordance only in these two groups and in them concordance was poor (k 0.05 and 0.18 respectively). The area under the ROC curve did not differ across categories.
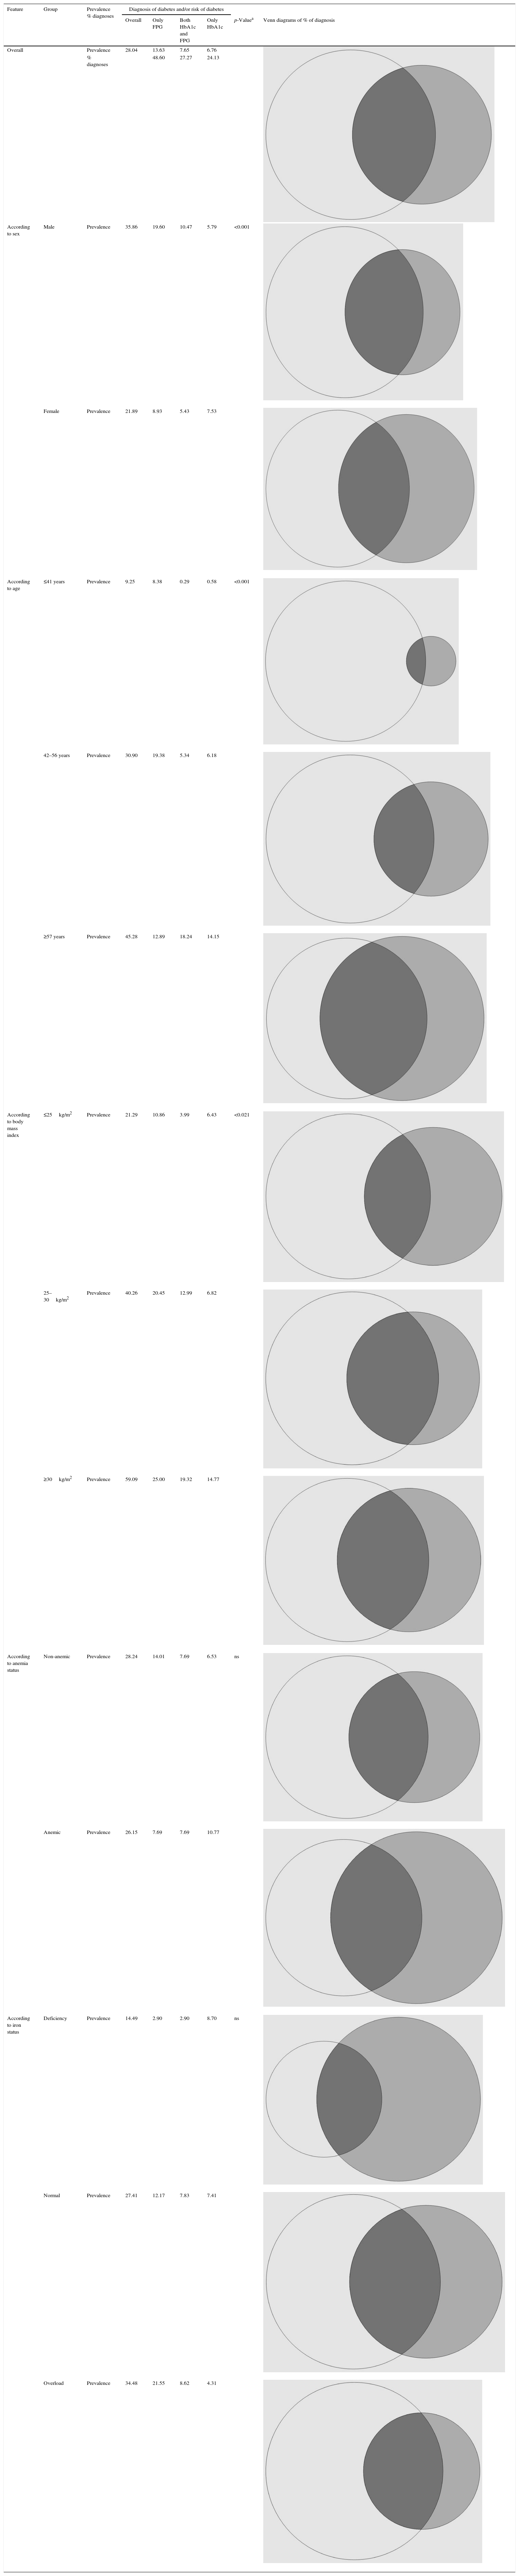
HbA1c identified 6.76% of the study population with dysglycemia, not identified after FPG (Table 2). Overall, diagnosis of dysglycemia was performed after FPG-only in 48.60%, after FPG and HbA1c in 27.27% and after HbA1c-only in 24.13%. The prevalence of new diagnoses of dysglycemia performed after HbA1c varied with clinical characteristics: were higher in women and increased with age and BMI but did not differ according to anemia or ferritin status.
Dysglycemia diagnosed after fasting plasma glucose and hemoglobin A1c according to different clinical characteristics.
| Feature | Group | Prevalence % diagnoses | Diagnosis of diabetes and/or risk of diabetes | |||||
|---|---|---|---|---|---|---|---|---|
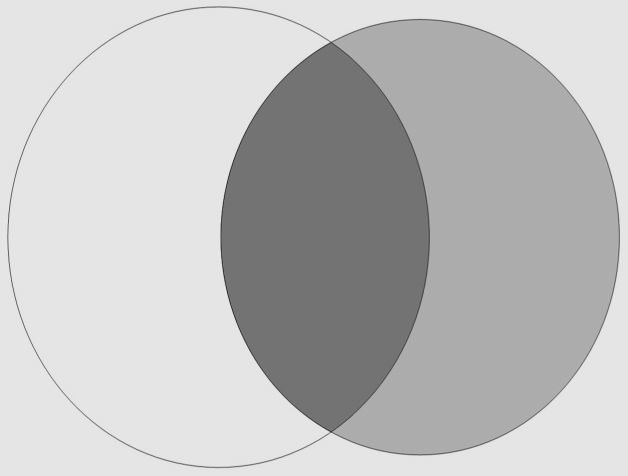
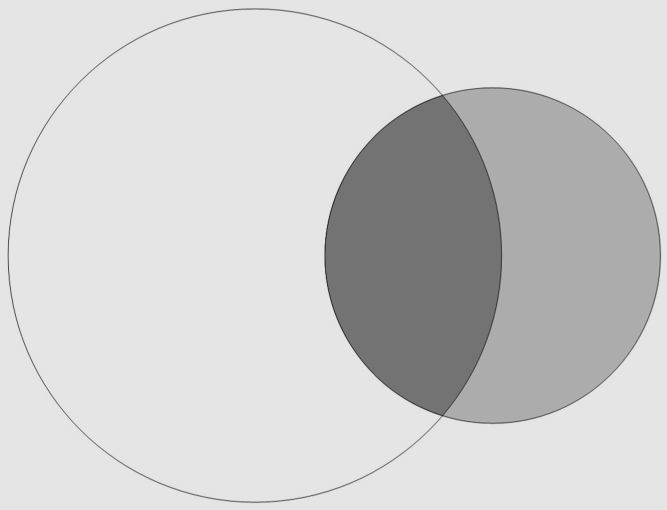
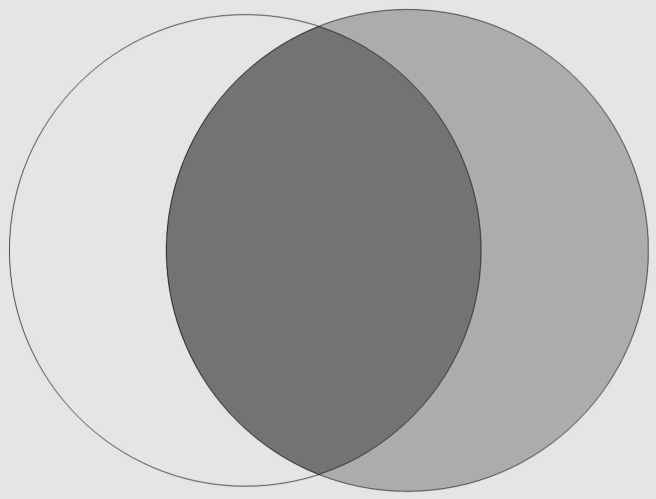
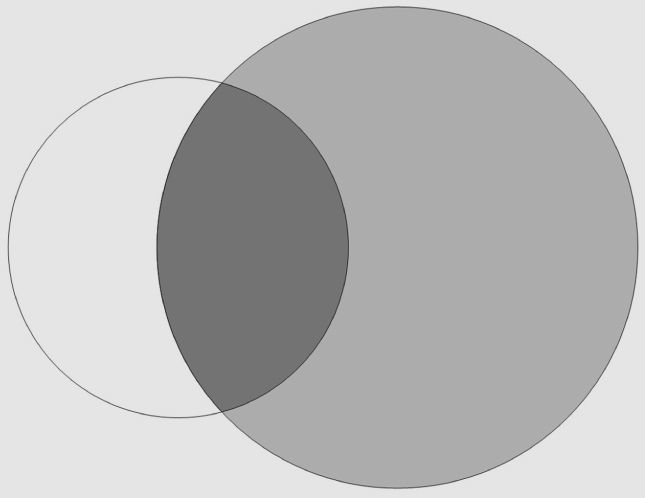
| Overall | Only FPG | Both HbA1c and FPG | Only HbA1c | p-Valuea | Venn diagrams of % of diagnosis | |||
| Overall | Prevalence | 28.04 | 13.63 | 7.65 | 6.76 | |||
| % diagnoses | 48.60 | 27.27 | 24.13 | |||||
| According to sex | Male | Prevalence | 35.86 | 19.60 | 10.47 | 5.79 | <0.001 | |
| Female | Prevalence | 21.89 | 8.93 | 5.43 | 7.53 | |||
| According to age | ≤41 years | Prevalence | 9.25 | 8.38 | 0.29 | 0.58 | <0.001 | |
| 42–56 years | Prevalence | 30.90 | 19.38 | 5.34 | 6.18 | |||
| ≥57 years | Prevalence | 45.28 | 12.89 | 18.24 | 14.15 | |||
| According to body mass index | ≤25kg/m2 | Prevalence | 21.29 | 10.86 | 3.99 | 6.43 | <0.021 | |
| 25–30kg/m2 | Prevalence | 40.26 | 20.45 | 12.99 | 6.82 | |||
| ≥30kg/m2 | Prevalence | 59.09 | 25.00 | 19.32 | 14.77 | |||
| According to anemia status | Non-anemic | Prevalence | 28.24 | 14.01 | 7.69 | 6.53 | ns | |
| Anemic | Prevalence | 26.15 | 7.69 | 7.69 | 10.77 | |||
| According to iron status | Deficiency | Prevalence | 14.49 | 2.90 | 2.90 | 8.70 | ns | |
| Normal | Prevalence | 27.41 | 12.17 | 7.83 | 7.41 | |||
| Overload | Prevalence | 34.48 | 21.55 | 8.62 | 4.31 | |||


Overall significance across categories for prevalence of new diagnoses of dysglycemia performed after HbA1c. In each Venn diagram, the percentage of diagnoses from only FPG, HbA1c and FPG, and only HbA1c are represented by white, black, and gray circles, respectively.
FPG, fasting plasma glucose; HbA1c, hemoglobin A1c.
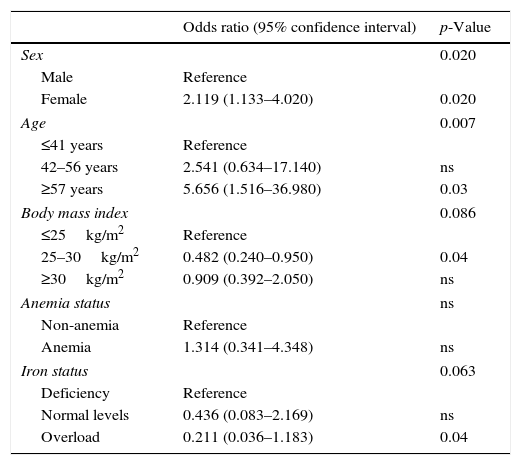
The multivariate logistic model to predict new diagnoses after HbA1c is displayed in Table 3. Significant independent factors were sex, age and ferritin status (borderline significance). The OR for new diagnoses of dysglycemia after HbA1c in women (vs. men) was 2.119 (95% CI, 1.133–4.020, p<0.020). As to age, the OR for new diagnoses in subjects aged 42–56 years (vs. ≤41 years) was 2.541 (95% CI, 0.634–17.140; ns), and in subjects aged ≥57 years was 5.656 (95% CI, 1.516–36.980; p<0.03). As to iron status and using iron deficiency as the reference category, the OR in subjects with a normal iron status was 0.436 (95% CI, 0.083–2.169; ns) and in those with iron overload was 0.211 (95% CI, 0.036–1.183; p<0.04).
Logistic regression model for the prediction of new diagnosis of diabetes mellitus and/or risk of diabetes mellitus after hemoglobin A1c.
| Odds ratio (95% confidence interval) | p-Value | |
|---|---|---|
| Sex | 0.020 | |
| Male | Reference | |
| Female | 2.119 (1.133–4.020) | 0.020 |
| Age | 0.007 | |
| ≤41 years | Reference | |
| 42–56 years | 2.541 (0.634–17.140) | ns |
| ≥57 years | 5.656 (1.516–36.980) | 0.03 |
| Body mass index | 0.086 | |
| ≤25kg/m2 | Reference | |
| 25–30kg/m2 | 0.482 (0.240–0.950) | 0.04 |
| ≥30kg/m2 | 0.909 (0.392–2.050) | ns |
| Anemia status | ns | |
| Non-anemia | Reference | |
| Anemia | 1.314 (0.341–4.348) | ns |
| Iron status | 0.063 | |
| Deficiency | Reference | |
| Normal levels | 0.436 (0.083–2.169) | ns |
| Overload | 0.211 (0.036–1.183) | 0.04 |
After the International Expert Committee Report in 20091 and its endorsement by other societies, many reports have addressed advantages and disadvantages of the two methods of dysglycemia diagnosis18 and the (imperfect) agreement between them.7–13,19–22 The fact that prediabetes diagnosed either after FPG or after HbA1c equally progress to DM, confirms the importance of both diagnostic methods.20–22 The Expert Committee Recommendations warned on the spurious HbA1c results in subjects with hemoglobin traits or in situations affecting blood cell turnover1 and not surprisingly reports have ensued indicating a suboptimal performance in situations of anemia,19 iron deficiency13 or after blood loss.10,11
We aimed to analyze agreement between dysglycemia diagnosis after FPG and HbA1c both overall and according different clinical characteristics in a population of ambulatory subjects without drug-treated diabetes mellitus. Our hypothesis was that agreement would be influenced by anemia and iron status. The main result of this study is that agreement between diagnoses performed after FPG and HbA1c is not good and that this agreement differs according to subject characteristics.
The strengths of this study are the size and broad characteristics of the study population and that it addresses the impact of several clinical characteristics in the performance of HbA1c as a diagnostic test of dysglycemia. Measurement of HbA1c with an immunological method without (relevant) interferences by HbA1c variants23 would be another one. As weaknesses of the study we acknowledge that the study is not population-based and that an oral glucose tolerance test was not performed. The study design did not exclude patients with known diabetes managed with lifestyle modifications and this can be considered a third weakness, potentially increasing the rate of diagnoses both after FPG and HbA1c.
Considering FPG as the (historical) reference method for DM diagnosis, HbA1c as a diagnostic method of dysglycemia had an overall sensitivity of 35.94% and this argues against using HbA1c as the only diagnostic method. Our results are also in accordance with the literature, where with some exceptions12,13 diagnoses performed after FPG generally outnumber those performed after HbA1c.7,20,21 The lower variability and preanalytical instability of HbA1c are theoretical advantages of this analyte that are not appreciated in this study; they could potentially materialize in a second test to confirm DM diagnosis, where the performance of glucose-derived measures is poor.24
Considering that both FPG and HbA1c provide valid diagnoses, 24.13% of them (6.76% of the subjects of the population) are performed only by HbA1c-only. The ROC curve analysis indicates an optimal cut-off for dysglycemia diagnosis of 5.6% that is slightly lower than the ADA criterion. The 0.72 area under the ROC curve qualifies HbA1c performance for the diagnosis of dysglycemia against FPG as fair. Overall, these results support the use of both methods in combination for the diagnosis of dysglycemia.
Agreement between FPG and HbA1c is influenced by clinical characteristics: sensitivity changes with age, specificity with age and BMI and overall concordance with sex, age, BMI and iron status. Focusing in new diagnoses of dysglycemia after HbA1c, the best multivariate model has identified them to be more frequent in women, with increasing age, and (with borderline significance) in subjects with iron deficiency.
Other studies have addressed factors influencing agreement. One of these factors, not investigated in this study is ethnicity. HbA1c is typically higher in non-Caucasians subjects25 and dysglycemia is more frequently identified by HbA1c (vs. FPG) in this group.7
Sex has also been reported to influence agreement between FPG and HbA1c for the diagnosis of dysglycemia, the prevalence of new diagnoses with HbA1c being higher in women.7 Our results add that this higher rate of new diagnoses with HbA1c in women is independent of anemia or iron status. HbA1c would outperform FPG in capturing dysglycemia in women because, physiologically women have lower FPG and higher 2h PG after load, the last one attributed to lower height.26–28 Provocatively, in 1999, ADA criteria based only on FPG were blamed of being biased against women.28
Our observation that new diagnoses of dysglycemia after HbA1c increase with age is in line with most7,22,28,29 published reports addressing this factor. It is attributable to a disproportionate increase of post-challenge plasma glucose with age.30 Other potential explanations such as differences in glycation can also contribute.
Our results do not show an independent effect of BMI in the multivariate prediction of new diagnoses after HbA1c, but nevertheless we found significant differences in specificity and overall concordance across categories of BMI. Increasing BMI has been reported to be an independent positive predictor of HbA1c in non-diabetic adults,31 a predictor of discordant diagnoses between FPG and HbA1c29 and associated with FPG-only prediabetes21 with individual reports of consistent HbA1c accuracy for DM diagnosis across BMI groups.22 The results of the bivariate analysis herein presented would be in line with the report of Heianza et al.21
Anemia, former blood loss and iron status are classical factors affecting HbA1c.1,10,11,13,19 However, although we found an association of iron status with overall concordance, the negative association of iron status with HbA1c-only diagnoses was of borderline significance in the multivariate analysis. Differences between studies reporting an effect of hematologic factors can be due to statistical power: i.e. in the study of Hardikar et al. reporting an effect of iron-deficiency anemia13 the prevalence of anemia and iron deficiency was higher than 30% whereas the prevalence of anemia in the study of Selvin22 and that of anemia and iron deficiency in the current study are lower than 10%.
In conclusion, in a convenience population of ambulatory subjects without drug-treated DM the agreement between FPG and HbA1c as diagnostic methods of dysglycemia is poor. FPG is the test that identifies more dysglycemic subjects but 24.13% of diagnoses are performed only by HbA1c. This represents a new diagnosis of dysglycemia in 6.76% of the study subjects, not identified by FPG. These new diagnoses are more frequent in women, with increasing age, and (with borderline significance) in iron deficiency.
Due to low sensitivity, it does not seem appropriate to substitute FPG with HbA1c for the diagnosis of dysglycemia. The addition of HbA1c to FPG will have a different impact in the rate of new diagnoses according to the characteristics of the study population.
Ethical disclosuresProtection of human and animal subjectsThe authors declare that the procedures were performed in accordance with guidelines of relevant Ethics Committees, World Medical association and Declaration of Helsinki.
Confidentiality of dataThe authors declare that no patient data are shown in this paper.
Right to privacy and informed consentThe relevant Ethics Committees waived the obtaining of informed consent. The authors declare that no patient data are shown in this paper.
Authors’ contributionsRC designed, analyzed and wrote the study. MLM, BU, AR, RM, CP, MDB and EC performed the study and contributed to the discussion. RC had full access to all data in the study and takes responsibility for the integrity of data and the accuracy of the data analysis.
FundingRoche Diagnostics supported this work with an unrestricted grant.
Conflicts of interestRC declares that she has received conference/consultant honorarium from Roche Diagnostics; for the remaining authors none were declared.