


Disease-related malnutrition (DRM) is highly prevalent. Various European resolutions urge to screen and treat DRM. No policy in this regard has yet been developed in Extremadura (Spain).
ObjectivesTo assess the prevalence of DRM (defined as NRS 2002≥3) using an analytical method (FILNUT), and to compare it with the official rate.
ResultsFILNUT scores≥3 showed values of sensitivity (S) and positive predictive value (PPV) of 82.3% and 72.3% respectively. No statistically significant differences were found between men and women using this tool. FILNUT showed a significantly higher sensitivity for detecting malnutrition in medical – as compared to surgical – diseases when low scores were used. The estimated prevalence of DRM was 21.4%. Prevalence of DRM is much greater than officially reported.
ConclusionsFILNUT scores≥3 show high sensitivity and PPV for detecting DRM, and is a good alternative as a nutritional screening tool to detect malnutrition at our center.
La desnutrición relacionada con la enfermedad (DRE) es una entidad con alta prevalencia. Diversas resoluciones a nivel europeo instan a detectar y tratar la DRE. Aún no se ha desarrollado ninguna política al respecto en Extremadura (España).
ObjetivosDeterminar la prevalencia de la DRE (definida como NRS 2002≥3) utilizando un método analítico (FILNUT). Comparar dichos resultados con la tasa oficial de pacientes con DRE.
ResultadosUna puntuación en FILNUT≥3 mostró unos valores de sensibilidad y valor predictivo positivo del 82,3 y 72,3%, respectivamente. No se encontraron diferencias estadísticamente significativas al comparar la utilización de esta herramienta por sexos. FILNUT mostró una sensibilidad significativamente mayor para detectar malnutrición en enfermedades médicas cuando se utilizaron valores bajos de la herramienta. La prevalencia estimada de DRE ascendió al 21,4%. La prevalencia de DRE estimada es muy superior a la reportada de forma oficial.
ConclusionesUn valor de FILNUT≥3 puntos presenta alta sensibilidad y VPP para detectar DRE, siendo una buena alternativa para utilizar en nuestro centro como herramienta de cribado nutricional.
Disease Related Malnutrition (DRM) is highly prevalent in European Hospitals1,2 and frequently, not properly diagnosed and treated.3–5 It is also known that DRM increases morbidity and mortality6–7 and its detection and treatment has demonstrated to be cost-effective1 for public health systems. For that reason, DRM is one of the key points of several European Resolutions, as RESAP resolution 2003,8 in which public health systems were advised to screen and treat DRM. Its intentions were confirmed in the “Praghe Declaration” six years later,9 and finally DRM detection and treatment was recognized as one of the main objectives for the “Together for Health: a Strategy 2008–2013”.10 Several scientific international societies11–12 have support these statements too. Unfortunately, regional policy in Extremadura (Spain) has not implemented those recommendations for at least, the last twelve years.13 Up to now, there is not any universal screening method in Extremadura hospitals, neither nutritional support units in several of them. In order to improve DRM detection, knowing that there are only 3 nurses and half-time physician specialized in Clinical Nutrition for the attendance of more than 400 beds in our center (Hospital Complex of Cáceres (HCC)), and given the impossibility of weighting all the patients, we decide to test an analytic method (FILNUT14,15) versus NRS-2002.16 It was performed not only for estimating the prevalence of DRM using NRS 2002, but also for optimizing the staff of the center destined to the attendance of this pathology.
Material and methodsType of studyA prevalence study in real clinical practice conditions was performed. DRM was defined as NRS-2002 punctuation higher than 3. This estimation was made using the informatic tool FILNUT.
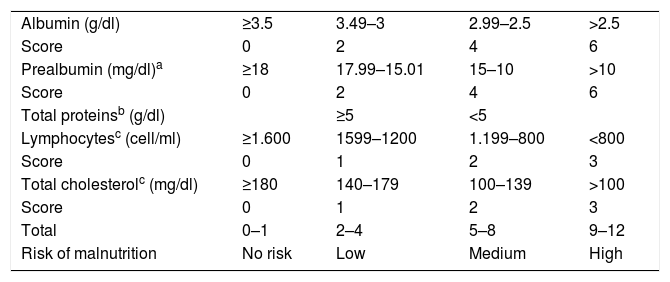
FILNUT (Analytic Nutritional Filter)14,15 is a method of screening of nutritional state based in analytic parameters (cholesterol, albumin, total proteins, prealbumin and lymphocytes) and developed in a Spanish hospital (Virgen de la Victoria, Málaga). A different punctuation is given to each analytic parameter (except for the protein ones, in which only one of them scores). The addition of them confers a risk of malnutrition. Compared to Malnutrition Universal Screening Tool15 performed at admission, FILNUT shows values of Sensitivity, Positive Predictive Value and Specificity of 92.3, 94.1 and 91.2 respectively. Its Kappa value is 0.831. The interpretation of FILNUT is showed in Table 1.
FILNUT (14–15).
| Albumin (g/dl) | ≥3.5 | 3.49–3 | 2.99–2.5 | >2.5 |
| Score | 0 | 2 | 4 | 6 |
| Prealbumin (mg/dl)a | ≥18 | 17.99–15.01 | 15–10 | >10 |
| Score | 0 | 2 | 4 | 6 |
| Total proteinsb (g/dl) | ≥5 | <5 | ||
| Lymphocytesc (cell/ml) | ≥1.600 | 1599–1200 | 1.199–800 | <800 |
| Score | 0 | 1 | 2 | 3 |
| Total cholesterolc (mg/dl) | ≥180 | 140–179 | 100–139 | >100 |
| Score | 0 | 1 | 2 | 3 |
| Total | 0–1 | 2–4 | 5–8 | 9–12 |
| Risk of malnutrition | No risk | Low | Medium | High |
Nutritional Risk Screening-2002 (NRS-2002)16 is the screening tool recommended for the European Society of Parenteral and Enteral Nutrition in the hospitalized patient.11 This tool was developed based on the results of several randomized controlled trials showing the specific population where nutritional support is beneficial and, therefore, recommended. NRS-2002 classifies patients into four categories (score=0–3) according to their nutritional status (based on body mass index, percentage of recent weight loss and recent change in food intake) and disease severity, which was classified as normal (score=0), mild (score=1), moderate (score=2), and severe (score=3). For patients older than 70 years one point was added to this score. A patient that had a total score of 3 or more was considered nutritionally-at-risk. Patients with score lower than 3 were not considered nutritionally-at-risk. This tool has proved to have high predictive validity, low inter-observer variation (k=0.67) and high practicability.11
Sample size determinationIn a first step, Sensibility (S) and Predictive Positive Value (PPV) of each score obtained in FILNUT were calculated for positive NRS 2002. Our group considered as acceptable values of S rounding 80% and PPV of 75% approximately. Considering values of confidence and precision of 95% and 5%, estimated sample size for S was 242 patients with positive NRS 2002, and 282 patients with any score of FILNUT to establish the PPV.
In a second step, an estimation of percentage of patients with a positive NRS 2002 was performed. For that, FILNUT punctuation with S and PPV values rounding 80% and 75% respectively was elected. Assuming a prevalence of DRM of 23% (PREDyCES study),17,18 99% confidence and 3% precision, estimated sample size was 1306 different scores of FILNUT.
Recruitment of patientsIn order to calculate S and PPV, a nutritional state assessment (NSA) using NRS 2002 and FILNUT was performed one in every three admitted patients on Monday and Thursday to Hospital Complex of Cáceres following data provided by Admission Service. All the patients were older than 18 and signed the informed consent form. The following services did not take part in the study: Pediatrics, Obstetrics, Psychiatrics, Ophthalmology, Geriatrics and Intensive Care. NSA started in September 2013 and ended as soon as estimated sample size was achieved (September 2014).
All the analysis performed during the first 48h of admission between January and June of 2014 were reviewed to estimate the prevalence of patients with NRS-2002 higher than 3 points. Those with the analytic parameters needed to score in FILNUT were selected. If more than one belonged to the same patient in the same hospitalization episode, only the one with the highest punctuation was selected. Matching of data was made crossing the information from Biochemistry laboratory (Omega 3000 database, Roche Diagnostics SL) and Admission Service (JARA Asistencial, LinGobex-salud v1.0) using an Extract Transform Load System (Talend Open Studio).
Collection of dataPatients were weighed and heighted wearing light clothes using a scale with a measuring rod Seca 769 (Seca gmbh & co. Hammer Steindamm. Hamburg, Germany). In immobilized patients, weight was reported from the clinical file or if weight was unavailable, this was obtained from the patient, from relatives or estimated by the interviewers. If the patient was bedridden, height was measured with the patient stretched lying in bed.19 Weight and height were used to calculate body mass index (BMI) (weight (kg))/(height (m2)).
Albumin, total proteins and total cholesterol were determined by an ADVIA 2400 Chemistry System (Siemens Healthcare Diagnostics Inc. UK.); sensibilities of the methods were 1g/dl, 2g/dl and 10md/dl respectively for each determination. Variation coefficient inter and intraassay were 1.3 and 2% for albumin, 1.3 and 2% for total proteins and 0.7 and 0.5% for total cholesterol. Cell Blood Counting was determined by a Coulter S+ Counter (Coulter, Hialeah, FL USA). Prealbumin was determined using a nefelometer Berhing II (Behring Diagnostics, Marburg, Germany).
Analysis of dataA crosstabulation with all possible FILNUT values to obtain S and PPV of FILNUT for positive NRS-2002 was performed using SPSS v20 (SPSS Inc., Illinois, United States). Afterwards, FILNUT value with S and PPV rounding 80 and 75% was selected. A subsequent analysis by sexes and pathology was also performed.
All the results of FILNUT calculated in order to establish the prevalence of DRM were transferred to SPPS v 20 using Talend Open Studio. A randomized sample of at least 1306 was selected. Frequency of patients with FILNUT value with the closest S and PPV was calculated. This percentage was multiplied the PPV, obtaining the estimated fraction of patients with positive NRS2002. The result will be compared with the official one (given by the coding unit of the center) for 2013. χ2 test was used to compare both rates.
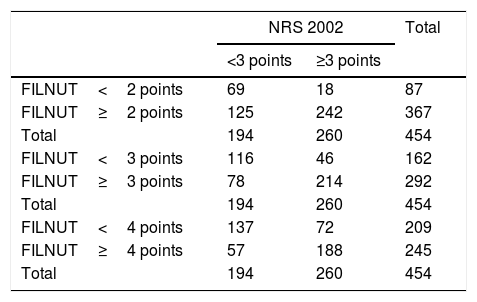
Results454 independent NSA were obtained (296 in male and 158 in women). Crosstabulations for estimating S and PPV for FILNUT values of 2, 3 and 4 points are shown in Table 2.
Crosstabulation calculated with FILNUT value of 2, 3 and 4 points. NRS 2002: Nutritional Risk Screening 2002. FILNUT: Filtro Nutricional.
| NRS 2002 | Total | ||
|---|---|---|---|
| <3 points | ≥3 points | ||
| FILNUT<2 points | 69 | 18 | 87 |
| FILNUT≥2 points | 125 | 242 | 367 |
| Total | 194 | 260 | 454 |
| FILNUT<3 points | 116 | 46 | 162 |
| FILNUT≥3 points | 78 | 214 | 292 |
| Total | 194 | 260 | 454 |
| FILNUT<4 points | 137 | 72 | 209 |
| FILNUT≥4 points | 57 | 188 | 245 |
| Total | 194 | 260 | 454 |
Sensitivity values for FILNUT values of 2, 3 and 4 points were respectively: 93.1% (CI95 90.6–95.6), 82.3% (CI95 79.8–84.8) and 72.3% (IC95 69.8–74.8). PPV values were 65.9% (CI95 62.4–68.4), 73.3% (CI95 70.8–75.8) and 76.7% (CI95 74.2–79.2).
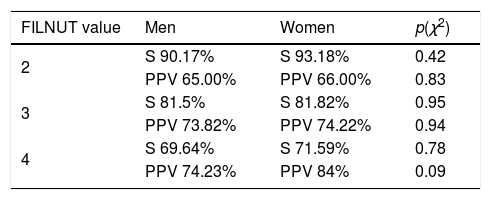
173 (58.25%) men and 88 (55.35%) women were malnourished following our criteria. No differences were founded in the distribution of malnutrition between both groups (p=0.88). S and PPV for FILNUT values of 2.3 and 4 points did not showed statistically significant differences for men and women respectively. Values are shown in Table 3.
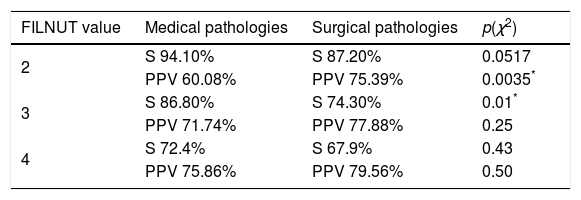
Patients were also divided in surgical (147) and medical pathology (307). Malnutrition was found in 109 of surgical (74.15%) and 152 (49.51%) of medical patients, being more prevalent in the first group (p<0.001). FILNUT values of 2 and 3 presented highest S for medical than surgical patients (94.10% vs 87.20%) for FILNUT 2 points (p 0.051) and 86.80% vs 74.30 for FILNUT 3 points (p=0.01). On the other hand, PPV was higher in surgical patients with FILNUT value of 2 points (75.39% vs 60.08%; p=0.0035). No statistically significant differences were found for higher values of FILNUT between both groups. Results are shown in Table 4.
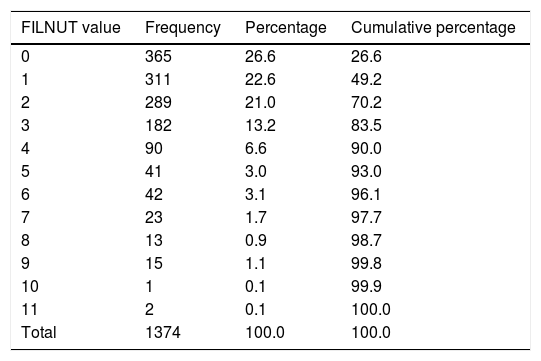
In addition, 22,590 analytics were performed between January and June 2014. 8990 were eligible for FILNUT calculation. After selection of those belonging to different patients and performed in the first 48h of admission, 2735 analytics remained. Finally, a randomized sample of 1374 was studied. Results are shown in Table 5. Applying values of PPV obtained by FILNUT's scores of 3 points, the prevalence of patients with a positive NRS-2002 at admission was 21.8% (IC95 19.3–24.3). Official rate of DRM given by the hospital was 0.65%. Differences were statistically significant (p<0.001).
FILNUT values in the sample of study. FILNUT: Filtro Nutricional.
| FILNUT value | Frequency | Percentage | Cumulative percentage |
|---|---|---|---|
| 0 | 365 | 26.6 | 26.6 |
| 1 | 311 | 22.6 | 49.2 |
| 2 | 289 | 21.0 | 70.2 |
| 3 | 182 | 13.2 | 83.5 |
| 4 | 90 | 6.6 | 90.0 |
| 5 | 41 | 3.0 | 93.0 |
| 6 | 42 | 3.1 | 96.1 |
| 7 | 23 | 1.7 | 97.7 |
| 8 | 13 | 0.9 | 98.7 |
| 9 | 15 | 1.1 | 99.8 |
| 10 | 1 | 0.1 | 99.9 |
| 11 | 2 | 0.1 | 100.0 |
| Total | 1374 | 100.0 | 100.0 |
Although FILNUT is calculated using biochemical parameters which values can be modified by nonnutritional factors; it shows high values of S and PPV respect a reference method, strengthening its validity as a method of screening of malnutrition. In addition, it does not show differences between sexes, an even that low scores of FILNUT are more sensitive for detect malnutrition in medical patients, its S for surgical patients is not low at all.
Prevalence of DRM at admission (21.84%) as defined in this study using the values of PPV described in Material and Methods is concordant with the value described in the only multicentric study developed in Spain (PREDyCES study).17,18 In this study, prevalence of DRM was estimated in 23% of patients and DRM was defined also as NRS2002 higher than 3 points. The obtained value (21.84%) is clearly higher than the official one (0.67% for 2013) defined as presence of diagnosis of malnutrition in the discharge report. This fact supports that DRM is not properly recognized in our center. At this point, it is important to highlight the importance of codifying malnutrition. During a nutritional support process professionals take care of patients and expenses economical resources. If this information is not registered, it cannot be known by the economic managers and its economical impact remains hided. Proper codifying of malnutrition can change a Diagnostic Related Group in another with higher complexity, which has a direct impact in economical expenses showed as higher case-mix index, which should mean a higher delivery of economical resources for the treatment of malnutrition. Examples of that are described in different studies of our group in the same center.20–22
Selection of values of S (80%) and PPV (75%) intended to optimize the staff resources for detection and treatment of DRM, mainly by reduction of false positives. Although our group does not share the nutritional policy of our local government, as we consider that the importance of DRM is not taken into account, it is important to provide the institutions tools for a better management of DRM in our center. The utilization of the named analytic method of nutritional state assessment with the given values of sensibility and positive predictive value allows the detection of patients at risk of malnutrition, optimizing the limited staff resources available. It also shows the high prevalence of DRM in the center making it a question of awareness, mostly when compared with the official one. With this data, it is necessary to implement a strategy for treat and monitoring malnutrition in our center.
Conflict of interestThe authors declare no conflict of interest.