

The aim of this paper is to estimate the potential effects of EU-15 public policies on economic convergence. In particular, an empirical proposal is presented to compare, in terms of convergence speed, the results reached in the EU with the policies implemented with those obtained under alternative policies during the 1980–2010 period. On the basis of this approach, two types of scenarios were derived, depending on whether the changes in the policy instruments are considered in all the EU-15 countries or in each of them separately. Results show that it would have been possible to obtain better results for the EU convergence with higher rates of infrastructure and education investment, which provide support for the coordination of these policies between the member countries.
El objetivo de este trabajo es estimar los efectos potenciales de las políticas públicas sobre la convergencia económica. En particular, presentamos una propuesta empírica para comparar, en términos de velocidad de convergencia, los resultados obtenidos en la UE con las políticas implementadas con los resultados que se podrían haber alcanzado con políticas públicas alternativas durante el periodo 1980-2010. Sobre la base de este esquema, derivamos dos tipos de escenario dependiendo si los cambios en los instrumentos de política pública se producen en todos los países europeos o sólo en alguno de ellos de forma separada. Los resultados muestran que hubiera sido posible obtener mejores resultados en términos de convergencia económica en la UE si se hubieran aumentado los ratios de inversión en infraestructura y educación, lo cual respalda la coordinación de estas políticas en los países miembros.
Literature on economic growth has devoted considerable effort to analyze the speed of convergence towards the stationary state. An extensive and influential number of research papers demonstrate the existence of conditional convergence; that is, the tendency of the most backward economies to systematically grow at a faster rate than more developed economies, once the conditioning factors of this process are controlled for (Mankiw et al., 1992; Barro and Sala-I-Martín, 1995). This is determined by its own structural characteristics, among which technology, public policies and population growth rate are included. One of the reasons for the importance of this analysis is its capacity to evaluate the role played by these conditioning factors – primarily public policy instruments – with the objective of establishing whether part of the observed convergence (if any) can be attributed to these instruments.
In the context of the European Union, development and cohesion policies have received greater attention since the beginning of the 1980s and, according to the European Commission, they have positively contributed to income convergence in the EU. However, structural policies in Europe have often been questioned arguing that they mainly serve redistributional purposes, but they have little effect on fostering economic growth and convergence at the EU level. Thus, despite the large body of empirical literature, the debate concerning the capacity of the European policies to influence convergence remains open. Why have public policies so far had such a limited impact on economic convergence? Could it have been possible to accelerate the process of European convergence implementing alternative public policies? There are multiple factors that might explain why, despite the increase of funds available since the eighties, there is little or no evidence of greater economic convergence across countries in the EU. Among the possible explanations, some highlight that, despite the increase in the volume of development funds, the funds available are still too scarce to have any significant impact on growth rates (Rodriguez-Pose and Fratesi, 2004; Varga and Veld, 2011; Reggi and Scicchitano, 2014). This paper seeks to make a contribution to this debate offering a useful proposal to value how the convergence process might have resulted under alternative public policies which differ in the rate of public investment. Specifically, in this study we pay attention to the effect on the speed of convergence of an increase in the rate of investment in infrastructure and in human capital endowments since development and cohesion policies in the EU support investments in both areas.
Building on a standard neoclassical growth framework, the study uses a programming routine with Matlab for estimating convergence applying fixed effects models to develop a proposal in which the convergence regressions are repeated with different public policies. This paper differs from much of the mainstream convergence literature focused on the comparison of results obtained using different estimation techniques, groups of countries or periods. The primary focus here will be on the comparison of the speed of convergence observed with a wide range of simulated results, which will make it possible to establish if a more favourable outcome would have been possible. The programming routine is applied in this study to a panel dataset of the EU-15 member states during the 1980–2010 period. Two types of scenarios are derived: the first scenario makes it possible to estimate the speed of convergence in the EU-15 arising from increases in the rate of investment in all the countries at the same time; and a second scenario where we estimate the speed of convergence in the EU-15 resulting from increases in the rate of investment in each one at different times. In this way, an attempt will be made to measure not only the capacity of alternative public policies to influence the European convergence, but also the role they may play in each country towards achieving convergence in the EU-15.
This paper is organized as follows. Section 2 outlines the derivation of the growth model employed and describes the estimation technique and the empirical framework. Section 3 presents the data and results. The last section provides the main conclusions of this study and future lines of research.
2Methodology2.1Derivation of the growth modelWe rely in our analysis on the most common measure of convergence in the literature, i.e., the regression of GDP growth over a long period of time against initial GDP levels and a set of explanatory variables in a cross section of countries (Barro and Sala-I-Martín, 1995). Our specification follows the approach of Mankiw et al. (1992), who derived the convergence equation when public capital and human capital were included. The point of departure is a Cobb-Douglas production function with constant returns performance. The production function is:
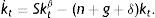
where Yt represents aggregate production; Kt, physical capital; Lt, employment and A, the level of exogenous technology and labour effectiveness. So, AtLt can be interpreted as effective units of labour. It should be pointed out that the production function shows decreasing scale performance in the cumulative factors, 0<β<1, allowing us to analyze the behaviour of this economy in the steady state, as well as to empirically solve the corresponding convergence equation. At and Lt grow exogenously at rates g and n, respectively. On the other hand, it is assumed that a constant share of income S is saved and invested and that this rate of investment is given exogenously. The increase of the stock of capital can be defined as:where a dot above the variable denotes differentiation with regard to time and δ is the rate of depreciation.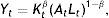
Defining yt as income per effective labour unit, yt=(Yt/AtLt), and kt as capital per effective labour units, kt=Kt/AtLt, we can obtain the movement equations for the production factor:
In the steady state (indicated by *), the capital per effective labour unit kt* is constant. Thus, for k˙t=0,
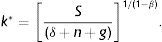
Eq. (4) allows us to analyze the factors affecting the steady state solution and the different stationary states in the economies under study. Capital per effective labour unit in the steady state depends positively on the rate of capital investment, while the rate of depreciation, and the growth rates of population and technological progress, have a negative influence.
Income per effective labour unit is, by (1), yt=(kt)β. Taking logarithms, differentiating, and substituting yit=Yit/Lit using (3),
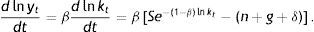
Log-linearizing around the steady state,
where the approximation around the steady state is carried out as follows. From the function f(lnkt)=Se−(1−β)lnkt−(n+g+δ), the first order Taylor expansion around lnk* is given by f(lnkt)≅f(lnk∗)+f′(lnk∗)(lnkt−lnk∗), where f(lnk∗)=0 and f′(lnk∗)=−(1−β)(n+g+δ).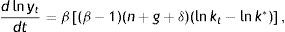
Denoting the speed of convergence towards the steady state by λ=(1−β)(n+g+δ) makes it possible to reformulate Eq. (6) as follows:
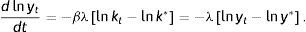
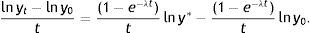
The differential Eq. (7) implies:
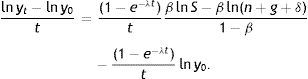
where lny0 is the logarithm of the income per effective labour unit at the beginning of the period. Subtracting lny0 from both sides of the equality and dividing by t gives the average rate of income growth:
Using yt=(kt)β and (4) to replace the logarithm of income per effective labour unit in steady state gives:
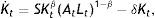
Production function (1) can be easily generalized. Mankiw et al. (1992) add human capital to physical capital in their augmented Solow model, while Bajo-Rubio (2000) considers m private inputs and 2 public inputs (public inputs, however, enter in the production function in a special way). Let (1) be generalized to a production function where investment (S) is disaggregated into investment in private physical capital (Sk), human capital (Sh), and public capital (Sg):

Adapting the results in Bajo-Rubio (2000), Eq. (12), to our setup leads to the following convergence equation, that generalizes the results in (10):

Since income per capita (Yt/Lt)=ytAt, Eq. (12) can be rewritten in terms of the growth of income per capita, instead of income per effective labour units:

In the empirical approach to the convergence equation we take t=1, instead of considering a single period as in the derivation of the growth model, to take into account all the years and use panel data techniques. Furthermore, it is assumed that the initial level A0 reflects not only technology but also endowments of resources, the climate, institutions, etc., which can differ among countries, leading us to consider lnAt=a+η+ut, where a is a constant common to all countries, η is a country fixed effect, and ut is an i.i.d. residual term. So the term η allows us to considering the unobservable heterogeneities and the differences in technology.
2.2Estimation of the growth modelThe objective of this paper is to ask about what the economic policy instruments could have achieved in terms of speed of convergence. Based on the convergence equation derived in the previous section, our proposal consists of introducing changes in the public policy under study to obtain a wide range of alternative public policies to be used for the estimation of the model on the basis of a programming routine with MATLAB.1 Because each estimation can be considered as a simulated situation, we develop in this analysis a path of simulated results to compare with the results observed in the period 1980–2010.
To estimate the convergence equation, the fixed effects model provides the basis, where it is assumed that each explanatory variable has a single coefficient; that is, it has the same effect on the dependent variable, while each individual variable has a different constant which represents the individual effect. Formally, the model to be estimated is the following:
where yit=Yit/Lit is the annual GDP per effective labour unit of country i=1, …, N in year t=1, …, T; xi,t is a vector of k×1 explanatory variables; ηi is the individual effect; and ui,t is a disturbance term. In this case, the concept of conditioned convergence is analyzed by introducing heterogeneity in the model by means of the introduction of fixed effects and the effect of other variables, xi,t, that represents the specific steady state of each country, assuming that the fixed effects ηi are correlated with them. When the beta-convergence parameter (b) is negative, the poorest economies grow faster than the richer, so there is convergence in income per capita.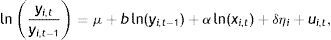
The within-estimator is calculated in deviations with respect to the mean using Ordinary Least Squares (OLS), making it possible to consistently estimate the parameters of the model associated with beta-convergence and with the explanatory variables, since its consistency will not depend on the specification of fixed effects ηi which have been eliminated with the transformation.2 This estimation also provides a framework to contrast beta-convergence without violating proposition 6 in Bernard and Durlauf (1996), although it is affected by measurement error and by nonstationarity.3
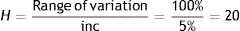
The main interest of our proposal is to offer a programming routine that facilitates the generation of the alternative values for the exogenous variables of interest (in this study the m variables of public policy) and the subsequent estimation of the convergence equation. Estimation of Eq. (14) will be repeated H times, depending on the range of variation selected for the rate of public investment. The public investment rates used are expressed as a percentage of GDP, which facilitates the generation of different policies by varying the weight of public investment in GDP. These variations (Δj) can be established with absolute flexibility and they will depend, first, on the step increase (inc) introduced in each estimation. In our study, we have considered applying a step increase of 5% that augments the same value in each new estimation, until it rises a maximum of 100% in the last one. That is, we will have obtained H estimates of beta-convergence:
Once the range of variations has been decided, a second aspect to be considered is how it will be introduced to ensure that we are not incorporating only a change of origin in the variable of interest. With this aim, we decided to introduce the step increase (inc) gradually in each estimation. To this end, we have divided it by the number of years studied, obtaining the cumulative increase (cinc) that we will apply every year, until the proposed step increase is reached in the last one. In our case, the cinc that applies is:
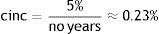
We start from a minimum of 0% for year 1, augmenting 0.23% every year up to the corresponding increase of 5% in year t (in our analysis t is 22). These variations generated with Matlab are placed in columns (H columns) to obtain the alternative policies used in the estimations. Every column shows the evolution of the variations through the period, which will be used to generate next column of variations by incorporating the increase selected.
The generation of the variations has been approached in two ways:
Scenario a: Generating variations in all the countries:
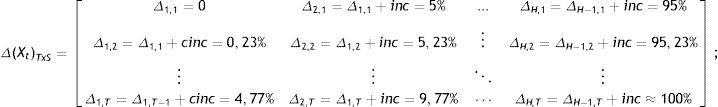
Or vectorially:

Scenario b: Generating variations in each country separately:
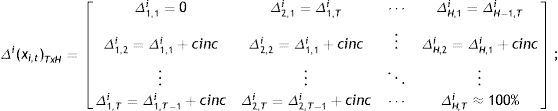
Or vectorially as:

Estimations of the model parameters (14) and the vectors of (17) and (19) with the variations will be used to evaluate public policies using the speed of convergence as criterion for this analysis. The results are presented in graphical form, where the graphs plot on the x-axis the variations of the vectors (18) or (20) and on the y-axis the corresponding estimates for the EU-15 convergence parameter or for the parameter associated with the public policy variable and their corresponding t-statistics. In this analysis we obtain a path of simulated values for the speed of convergence that is compared with the observed result for the EU-15 convergence process over the period 1980–2010.
In this study, the effect of introducing the increase in the exogenous variable of interest in all of the countries can be evaluated with the following model:
where Δj,t is a column vector, corresponding to column j which incorporates the cumulative increases for t=1, …, T for the variable of interest xi,tm of each country and assuming the rest of k–m variables remain constant. In this way, j=1, …, H estimations of the model (21) are carried out, resulting in different values of the parameter of beta-convergence.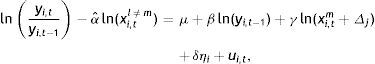
The effect of the changes on the exogenous variable of interest for a specific country can be evaluated estimating the model:
where: Δj,ti is a column vector, corresponding to column j which incorporates the cumulative increases for t=1, …, T for the variable of interest xi,tm of country i and maintaining ceteris paribus the rest of k–m variables. In this way, j=1, …, H estimations of model (22) will be carried out for the i=1, …, N countries, resulting in different results of the beta-convergence.3Data and results
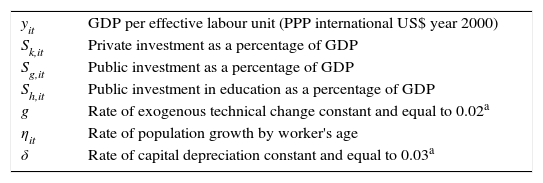
The estimation of the convergence equation was carried out using a panel data for the EU-15 member states during the period 1980–2010. Table 1 presents the variables used in the estimation of the convergence equation. Data concerning the series of employment, population, gross domestic product and gross investment was taken from World Bank Data Indicators (http:data.worldbank.org/indicator). They have been expressed in PPP international US$ in the year 2000 using information from Eurostat: http://epp.eurostat.ec.europa.eu/portal/page/portal/statistics/themes. Data on public education expenditure is taken from OECD Education at a Glance and expressed in the same terms as the rest of variables.
Information variables employed.
| yit | GDP per effective labour unit (PPP international US$ year 2000) |
| Sk,it | Private investment as a percentage of GDP |
| Sg,it | Public investment as a percentage of GDP |
| Sh,it | Public investment in education as a percentage of GDP |
| g | Rate of exogenous technical change constant and equal to 0.02a |
| ηit | Rate of population growth by worker's age |
| δ | Rate of capital depreciation constant and equal to 0.03a |
As is standard in the growth literature, we take g+δ to be equal to 0.05 for all countries and years (see, e.g. Mankiw et al., 1992).
In this section we seek to compare the result obtained in terms of convergence speed in the EU-15 with the policies implemented during 1980–2010 with results that could have being obtained increasing the rate of investment in infrastructure and education of that period. We have proceeded in two steps: first, we run the panel data regression to obtain the results of the convergence equation (Table 2).
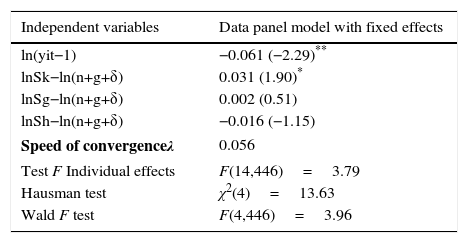
Estimation of convergence equation. Dependent variable: ln(yit/yit−1).
| Independent variables | Data panel model with fixed effects |
|---|---|
| ln(yit−1) | −0.061 (−2.29)** |
| lnSk−ln(n+g+δ) | 0.031 (1.90)* |
| lnSg−ln(n+g+δ) | 0.002 (0.51) |
| lnSh−ln(n+g+δ) | −0.016 (−1.15) |
| Speed of convergenceλ | 0.056 |
| Test F Individual effects | F(14,446)=3.79 |
| Hausman test | χ2(4)=13.63 |
| Wald F test | F(4,446)=3.96 |
The t-ratios shown in parentheses ().
Second, the structural parameters from the previous regression are used to estimate the convergence equation with the generated public policies, obtaining a path of values for the speed of convergence, for the parameter associated with the public policy variable and their corresponding t-statistics. Thus, this analysis will make it possible to establish if it would have been possible to obtain more favourable outcomes in terms of speed of convergence than the results observed for this period. Moreover, the t-statistics also allow us to determine what changes in the implemented policies (if any) generate significant impacts on the convergence process.
The convergence equation, according to expression (14), is estimated by applying the model of fixed effects proposed above. In Table 2 we present the results from the regression. The results show that in the sample the relationship between the initial GDP per worker and growth of per worker GDP is negative and highly significant. This represents convergence across the EU member states in the sample during the period 1980–2010.
The estimations carried out also make it possible to obtain some results as to the influence of the public policies developed in the European economies during this period: public provision of infrastructure and education. For the period analyzed, an insignificant influence of public investment and education on the growth rate of the European countries is derived from the estimation carried out. These results are consistent with the findings of many researchers (Bartkowskaa and Riedl, 2012; Alvarez and Barbero, 2016). But the overall valuation of the studies is mixed. A general view on the impact of public investment on growth has been well recognized since the seminal work of Aschauer (1989, 1990) who focuses on infrastructure investment. Recent surveys summarizing the current state of the literature on infrastructure and growth can be found in Romp and De Haan (2007) or Irmen and Kuehnel (2009) which show that the relationship between infrastructure and convergence still remain an unresolved puzzle. On the other hand, education investment are of interest in the work of Blankenau (2005) and Blankenau et al. (2007) who find a positive relationship between public education expenditure and growth for developed countries. Benhabib and Spiegel (1994) provide an overview on the impact of human capital on growth. Krueger and Lindahl (2001) or Vandenbussche et al. (2006) present a more skeptical view on the impact of education policy for industrialized countries. In this paper, we support the more skeptical view on both public policies and claimed that expenditure in infrastructure and education in the EU-15 does not suffice to counter the imbalances generated by market forces and economic integration and that is what explains the results obtained. The Wald test statistics show that the explanatory variables introduced in the analysis are conjointly significant. Table 2 also includes an F-test which confirms joint significance of individual effects for each country.
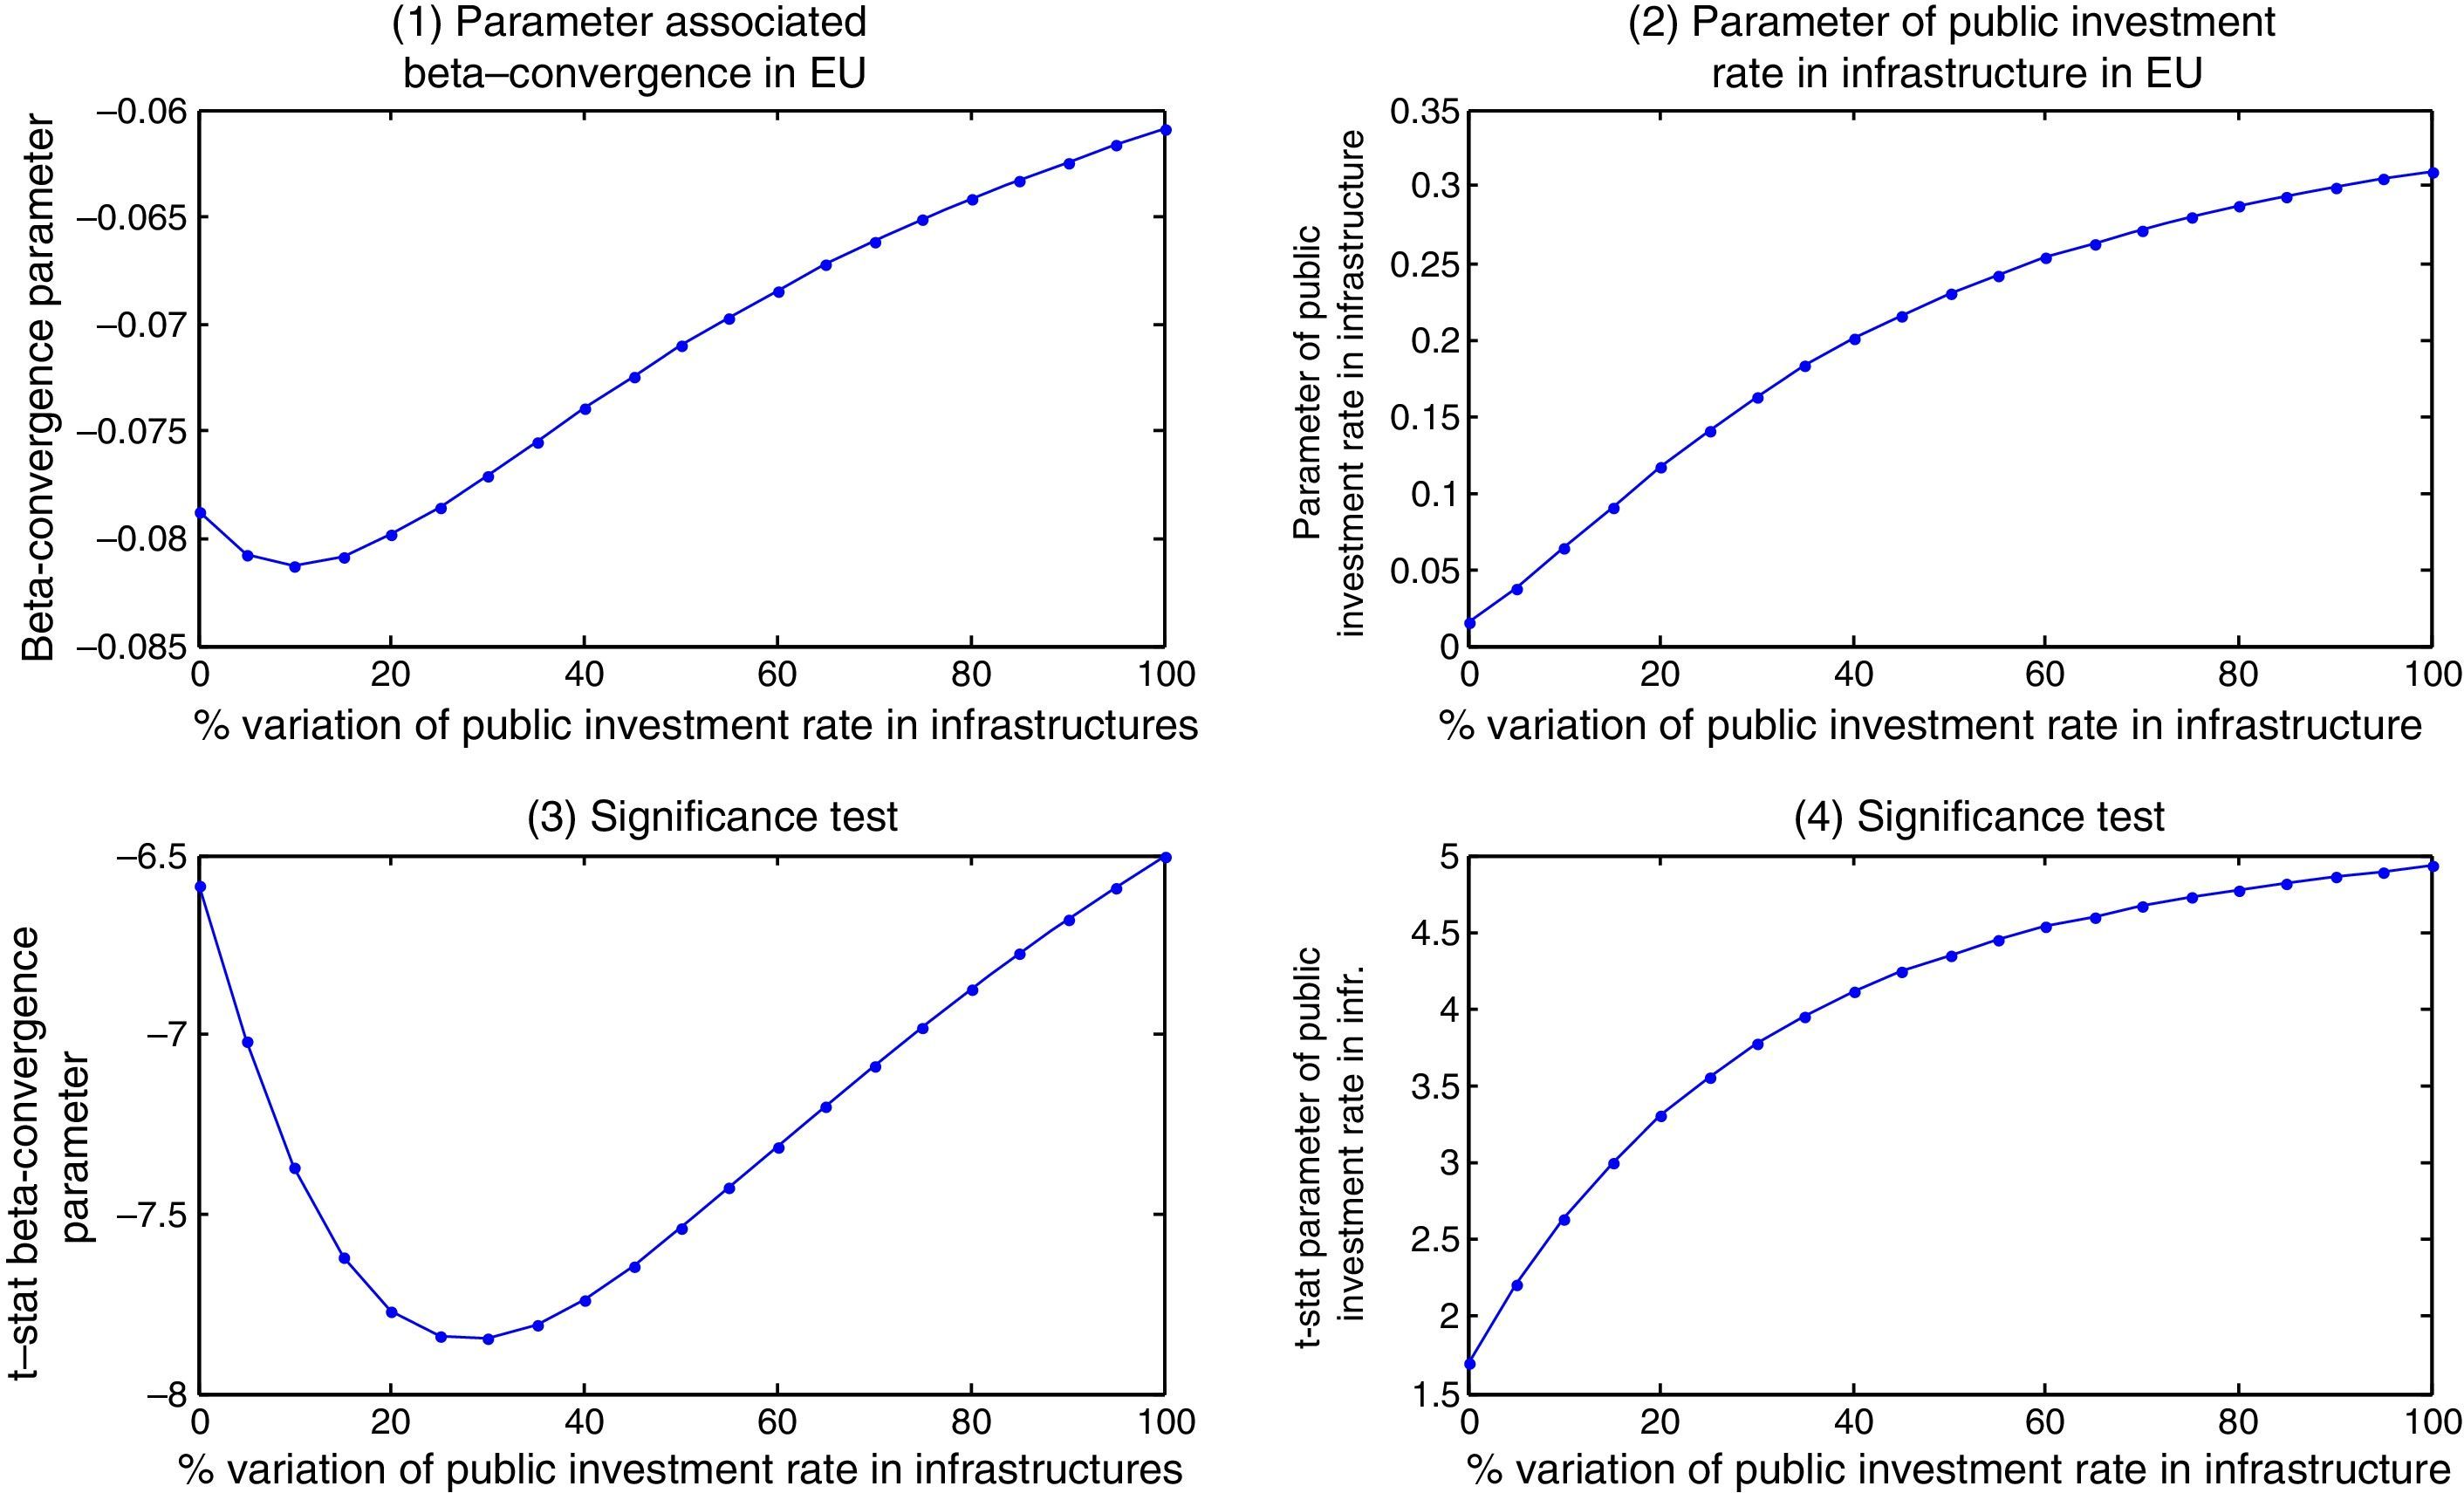
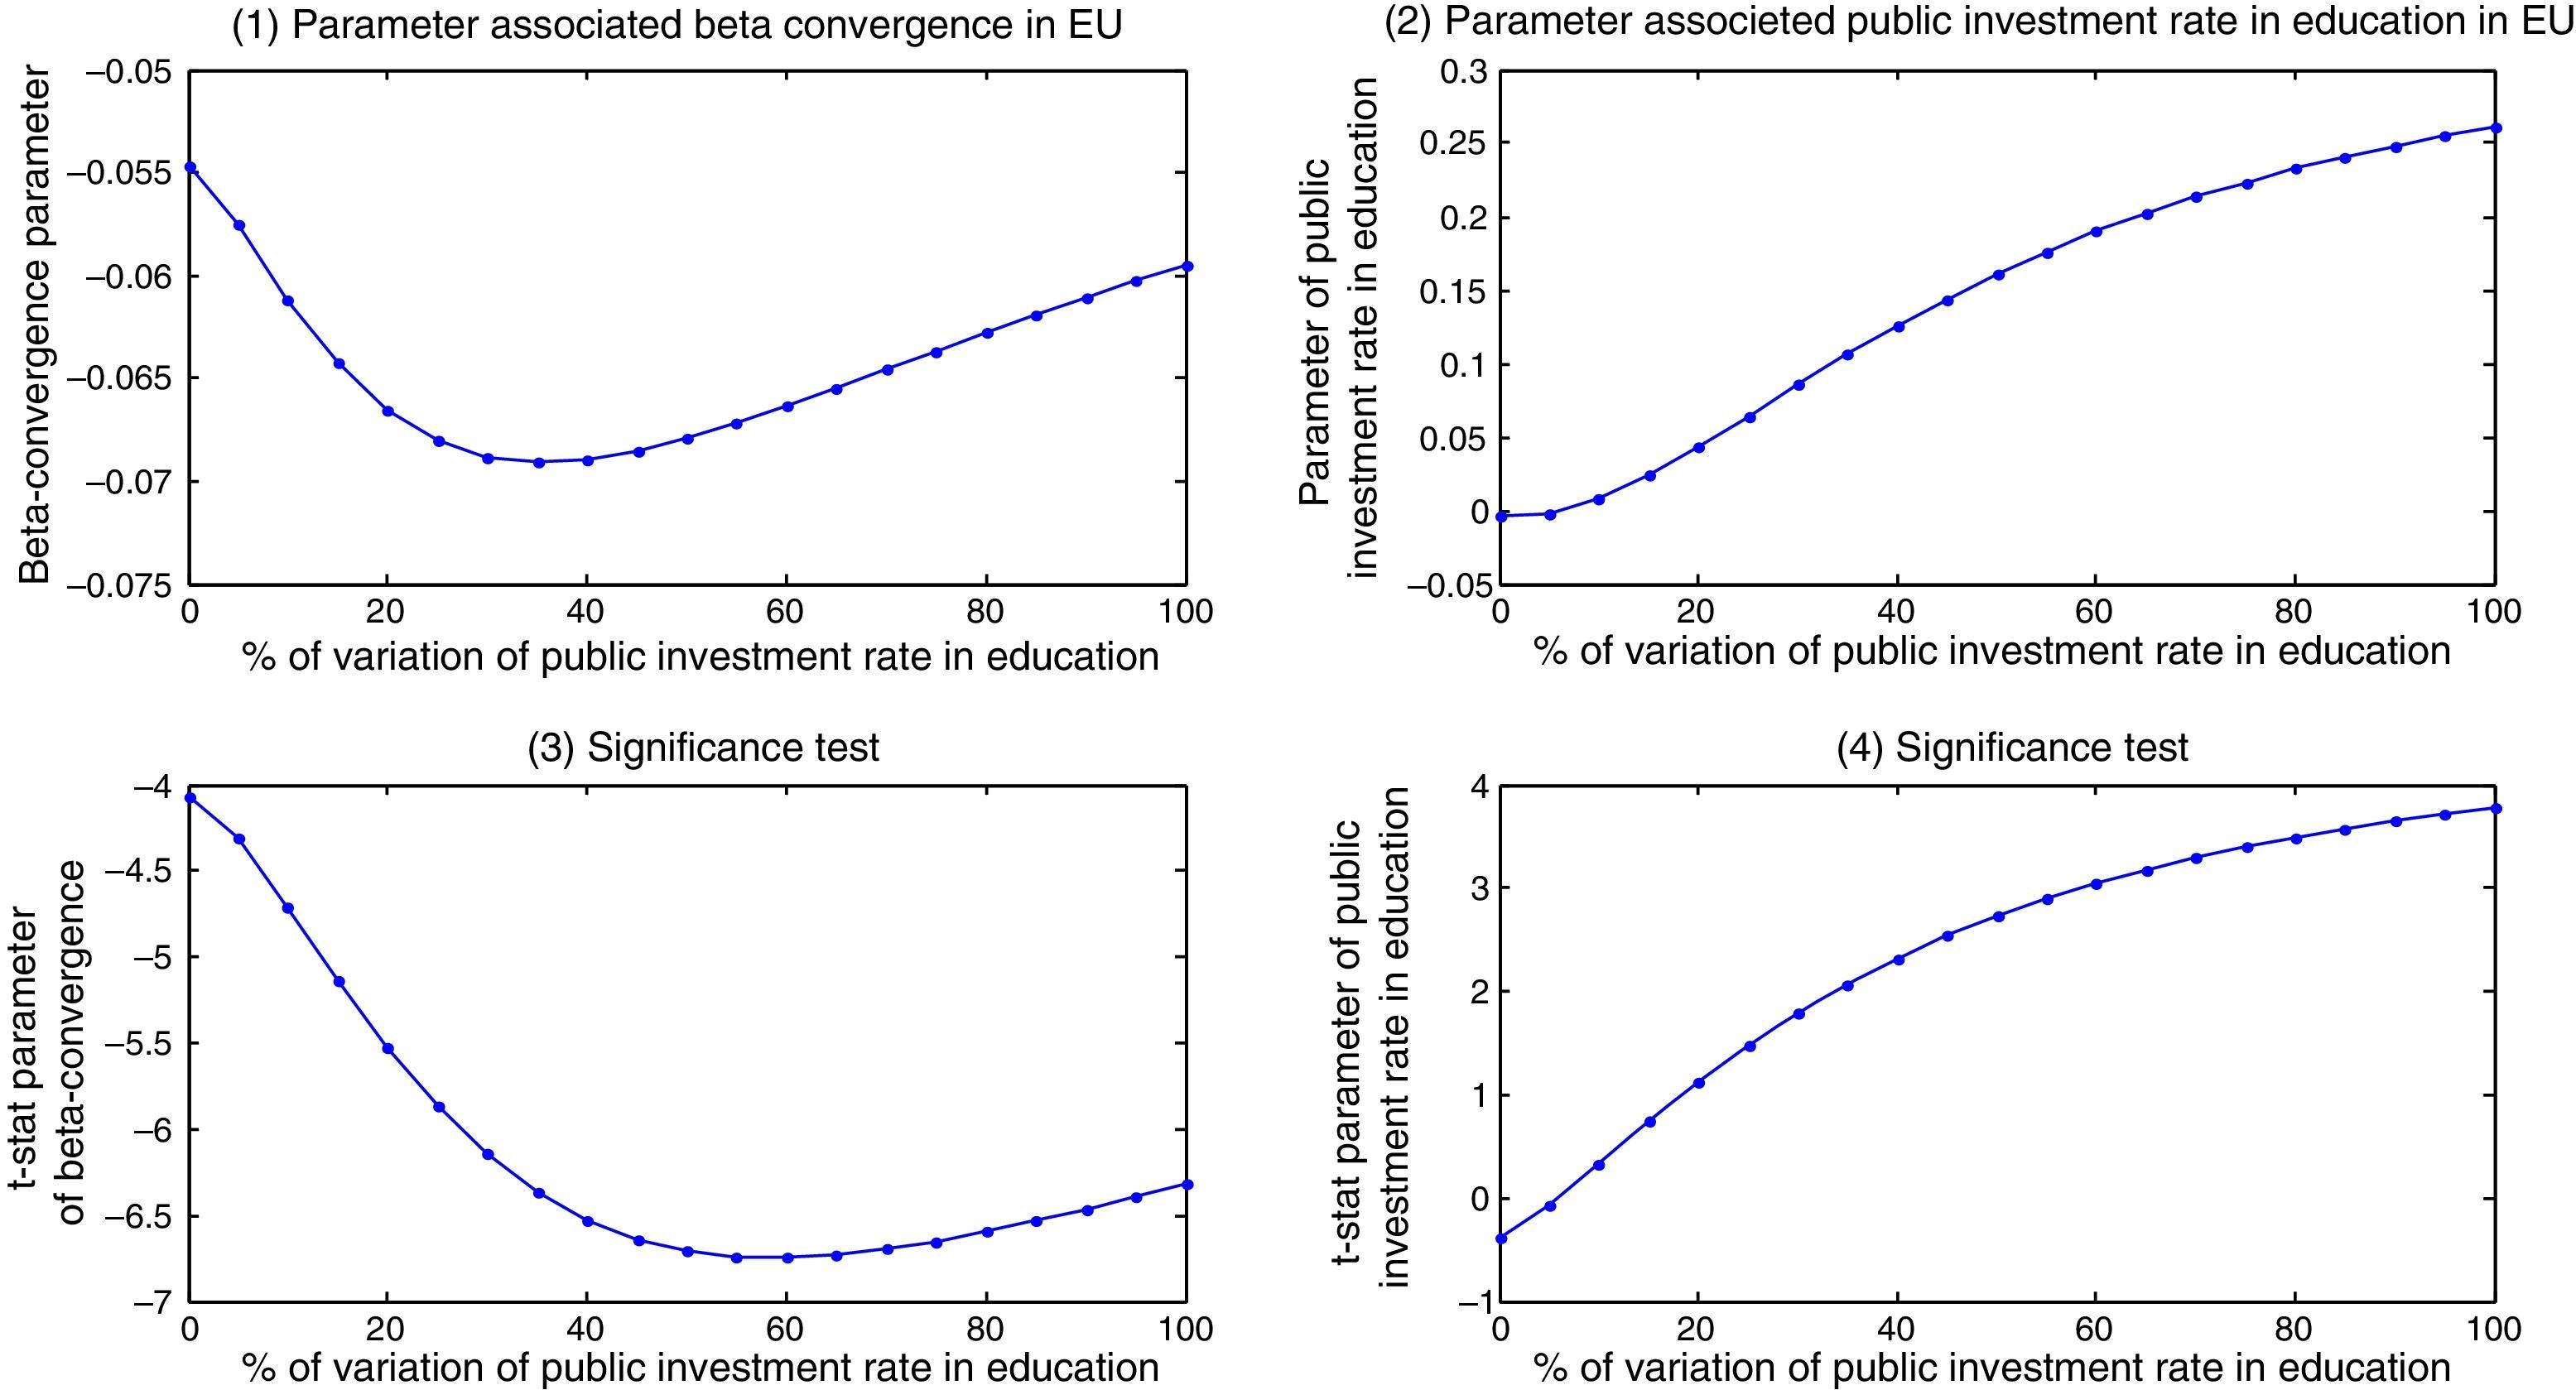
Using the fixed-effects coefficients in the estimation of the convergence equation, we introduce increases in the two economic policy instruments: infrastructure (Fig. 1) and education investments (Fig. 2) and derive two types of scenarios for them to examine how the EU speed of convergence responds to increases in the rate of investment of all the countries (scenario a) or in each of them separately (scenario b). The results obtained are presented in graphical form and the scenarios show the response of the beta convergence parameter (1) and of the economic policy instrument parameter (2) and their t-statistics (3) and (4), while the other factors remain constant and are therefore not presented.
. Scenario b. Response of beta convergence to simulated changes in infrastructure investment in member states (and t-statistics).")
. Scenario b. Response of beta convergence to simulated changes in infrastructure investment in member states (and t-statistics).")
. Scenario b. Response of beta convergence to simulated changes in infrastructure investment in member states (and t-statistics).")
. Scenario b: Response of beta convergence parameter to simulated changes in the rate of public investment in education in member states (and t-statistics).")
. Scenario b: Response of beta convergence parameter to simulated changes in the rate of public investment in education in member states (and t-statistics).")
. Scenario b: Response of beta convergence parameter to simulated changes in the rate of public investment in education in member states (and t-statistics).")
Scenario a. Response of beta-convergence to simulated changes in the rate of public investment in education in the EU-15 (and t-statistics). Scenario b: Response of beta convergence parameter to simulated changes in the rate of public investment in education in member states (and t-statistics).
In Fig. 1 (scenario a) we present first the path of the simulated parameters obtained when we increase the rate of investment in infrastructure in all the EU countries and its t-statistics (graphs 1 and 3). The results show an improvement in the speed of convergence which confirms that it was possible to achieve better results for the EU convergence during this period with higher rates of infrastructure investment (results for the speed of convergence are significant and superior to the results obtained with the original rates of investment). Another result of interest is the existence of a limit to the capacity of public investment to encourage convergence, changing the track record of the beta convergence if public investment continues to grow. The speed of convergence improves while the rate of investment rises from 0 to 20%, but higher increases of the investment rate cannot overcome this result and the resultant speed of convergence could have been achieved also with lower investment rates. This is a reasonable finding, since all the analyses we have assumed that all other factors remain constant. Therefore, to continue increasing the speed of convergence it should be necessary to introduce changes in the other factors. In the next two graphs (graphs 2 and 4), it is also shown that the generated public policies maintain a positive and significant influence on the parameter of the EU convergence. These are important findings since they endorse public policies devoted to increasing public infrastructure in the European member states, but they also show that we must take into account other factors that can condition their capacity to influence growth (this is the case of private capital) and, therefore, greater increases in public investment could not achieve the expected results. Furthermore, it is found that a greater joint investment effort would have had a positive effect on the speed of convergence in the EU-15, reinforcing the importance of the coordination of these developments and cohesion policies between the member states.
Fig. 1 (scenario b) displays the second scenario which focuses on the path of the EU-15 speed of convergence in response to increases in the public investment rate of infrastructure in the European economies separately (we obtain then 15 graphs for each parameter). In this case, we find scarcely any response of the speed of convergence to the increases in the rate of investment in infrastructure of the member states (its values range in this case from 0.06 to 0.067). We only observe a slight decline in the speed of convergence at the beginning of the series in some countries and, from that result, the increases in the rate of investment of infrastructure will not have response in the rate of convergence. This result suggests that there is no deficit of infrastructure in the European countries, a result which is in accordance with other works on these economies (Kamps, 2005). Investment in infrastructure has been one of the main priorities in the development and cohesion policies in the EU in recent decades, which has made it possible to increase the level of these endowments in all the countries. As a result there is no country that has capacity to influence separately the rate of convergence in the EU-15. In the case of the parameter of public investment in infrastructure and its t-statistics (graphs 2 and 4), results confirm again the positive and significant impact of this variable on the EU convergence.
In the analysis of the potential impacts of increases in the rate of investment in education in all the EU countries (Fig. 2, scenario a), the simulated values obtained for the speed of convergence and its t-statistics show that there was capacity to favour convergence in this period. The rise in the convergence rate is smaller than in the case of the rate in infrastructure (the speed of convergence reaches the maximum value of 0.07) which indicates that despite a general improvement in education performance in the EU, progress in convergence is slow. We also find a limit to the capacity of public expenditure on education to encourage convergence, although the change in the track record is less pronounced than in the rate of infrastructure, maintaining a higher level of speed of convergence. In this case again, results support the idea that while responsibility for education in Europe lies with the member states, the EU has an important role in contributing to the development of education by encouraging cooperation and policy coordination between the countries. Another important result is that increases in the rate of expenditure in education allow us to obtain evidence of the positive and significant impact of this policy instrument on convergence, which supports the importance of increasing the funds dedicated to education so that they have significant impact on growth rates (graphs 2 and 4).
Fig. 2 (scenario b) shows the evolution of the EU speed of convergence when the rate of investment in education rises in each of the member states separately. The results demonstrate again that increases in this rate in each one of the countries studied separately have less capacity to influence positively the convergence in the EU. The response of the parameter is scarce (values range between 0.0601 and 0.064). In the case of Netherlands and Luxembourg, results show that if these countries increase their rate of expenditure in education, the speed of convergence in the EU decreases. These are countries characterized by maintaining the highest investment rates in education in the EU, so that increases in rates would limit the ability to increase the speed of convergence. Anyway the change in the parameter of convergence in these cases is so reduced that it is not possible to draw relevant conclusions from these results. In the analysis of the effect of the rate of investment in education on convergence (graphs 2 and 4), we find a general positive impact reinforcing the idea that higher investment rates can obtain positive impact of this variable.
The results obtained confirm the main prediction in the paper by Barro and Sala-I-Martín (1995) and in line with Ott and Soretz (2011) and Monfort et al. (2013), which is that the quantitative impact of capital mobility is likely to be small. If there are some types of capital, such as human or public capital that cannot be financed by borrowing on world markets, then the rate of convergence of open economies is slightly higher than closed economies. In this case, the impact on individual convergence is lower because its provision depends on national governments, which encourages the desirability of coordinating these European policies.
4ConclusionsOur analysis is focused on the impact on the EU-15 convergence of increases in the rate of investment in infrastructure and education in the EU during the period 1980–2010. The convergence rate shown by the estimations carried out suggests that member states are far from stationary, meaning that public policy in European countries can therefore substantially affect biased situations. In fact, the results obtained in this study suggest that higher rates of investment in these policies in the EU-15 countries would have been necessary to obtain a more favourable outcome in terms of speed of convergence in the period under study.
From a policy analysis point of view, these results provide support for policies that dedicate efforts to improve infrastructure and human capital in the European economies as they have still capacity to contribute positively to the process of convergence in the EU-15. Another policy implication that can be drawn from this analysis of the European countries is the importance of the coordination of these developments and cohesion policies between the member states. Likewise, the decision about the quantities of infrastructure and education to be allocated in each member state should be made in function of an evaluation of the effect of the market failure and therefore it should lead to a more efficient allocation of resources.
In the estimation of the model we used the routine programming in Matlab available in http://www.spatial-econometrics.com/. The programming in Matlab for the simulations in this work are available on request. In our analysis we are implicitly assuming that it is possible to change one variable without affecting the others to facilitate the interpretation of the results.
Financial support by the Institute for Fiscal Studies is gratefully acknowledged.
See Baltagi (2008: 15) for more details.
See Wooldridge (2002: chapters 10 and 12). In this case, an Error Correction Model is necessary (Barossi et al., 2005).