

The purpose and research objective of this study is probing effects of foreign direct investments in Southeast Europe economies. For this purpose six countries have been chosen and a sample has been drawn for: Albania, Bosnia and Herzegovina, Croatia, Macedonia, Serbia and Slovenia.
In order to conduct this analysis we use Enterprise Surveys available by the World Bank which are done using firm-level data of a representative sample of economy's private sectors. The conception of this analysis is examining the effects of how foreign direct investments contribute to the development of domestic firms and the overall economy. In general, foreign direct investment is defined as dominant or controlling ownership of a company in one country, by an entity based in another country. As of the beginning of the transition process, foreign direct investments remain priority, as essential pillar, that moves forward the society toward developed market economy.
The data used in this article are analyzed with an econometric model, which as employed in this study examines the interrelationships between output and set of variables that influence FDI patterns. Further, we are interested in the way foreign direct investments shape the economy.
El propósito y el objetivo de la investigación del presente estudio son la indagación de los efectos de las inversiones extranjeras directas en las economías del sudeste europeo. A tal fin, se han elegido 6 países, recogiéndose una muestra para Albania, Bosnia-Herzegovina, Croacia, Macedonia, Serbia y Eslovenia.
A fin de realizar este análisis, utilizamos encuestas empresariales procedentes del Banco Mundial, preparadas a partir de la información empresarial de una muestra representativa de sectores económicos privados. La concepción del análisis consiste en examinar los efectos del modo de contribución de las inversiones extranjeras directas en la economía total. Por lo general, la inversión extranjera directa se define como la titularidad dominante o controladora de una empresa de un país por parte de una entidad basada en otro país. Desde el inicio del proceso de transición las inversiones extranjeras directas constituyen una prioridad, como pilar esencial que empuja a la sociedad hacia una economía de mercado desarrollada.
La información utilizada en este artículo se analiza con la ayuda de un modelo econométrico que, según se emplea en el estudio, examina las interrelaciones entre el output y el conjunto de variables que influyen en los patrones de la inversión extranjera directa. Además, nos interesa el modo en que las inversiones extranjeras directas moldean la economía.
The study is to be focused on probing effects of foreign direct investments in Southeast Europe economies. Hence, six countries have been taken as sample for this research: Albania, Bosnia and Herzegovina, Croatia, Macedonia, Serbia and Slovenia.
The World Bank has conducted Enterprise Surveys on many countries using firm-level data of a representative sample of economy's private sectors. Using these data we try to examine more profoundly the effects of how foreign direct investments contribute to the development of domestic firms and the overall economy. Indeed, foreign direct investments are usually defined as dominant or controlling ownership of a company in one country, by an entity based in another country.
Using data of Southeast Europe, will be scrutinized the interrelationships between output and set of variables that influence the FDI patterns. Further, we are interested in the way foreign direct investments shape the economy.
The basic hypothesis related to output to test is that it depends on set of country's characteristics: foreign ownership, number of permanent full-time workers; capacity utilization; annual employment growth; annual labor productivity growth; proportion of total sales that are exported directly and proportion of total sales that are exported indirectly. Further, we focus on the possibility that output is driven by foreign ownership.
The academic significance of the topic is in determining the factors that influence foreign direct investments, as well as, the way FDI spillovers contribute toward overall development of Southeast Europe transition economies.
1.1Theoretical and literature frameworkThere are many studies that confirm the benefits of foreign direct investment on host country's economy and usually they have been proven to be significant. Transfer of technology to domestic companies, knowledge transfer, increased labor force productivity and decreased unemployment, increased exports due to rectified competitive characteristics of companies can be counted as most noteworthy changes in domestic economy due to increased foreign direct investment presence. The financial aspects on domestic balance of payments that fallow foreign direct investment include financing external current account deficits as a result of decreased capital spending and increased exports, non-debt-creating upshots, as well as, increased income on behalf of overall capital and product transactions and increased economic activity.
However, foreign direct investments have been received with mixed blessing. The presence of highly competitive international players on weak domestic markets often leads to market abuse fallowed by reluctant political pressures. Further, large investors more often than not coax concessions from host country governments on top of transfer pricing used to maximize tax obligations, hence encouraging volatile balance of payment flows. There are other potential negative outcomes frequently defined as horizontal effects (Blomström and Sjöholm, 1999; Keller and Yeaple, 2009; Acemoglu et al., 2010; Monastiriotis and Alegria, 2011).
Indeed, it can be said, that literature overall recognizes a broad consensus that the benefits of FDI effects tend to considerably outweigh its costs for host countries and companies. There are good overall surveys on the impact of FDI (Borensztein et al., 1998; Lim, 2001), diffusion of innovation and productivity effects (Javorcik, 2004; Smarzynska Javorcik, 2004; Javorcik and Spatareanu, 2011) and theoretical summary of policy implications of sizeable capital flows (Lane et al., 2002). Transition economies have evident capital need because of overall enterprise restructuring and potential benefits of fresh capital mainly due to inflow of FDI is critically important. As such economies have highly educated labor force; another important dimension is transfer of specific knowledge, know-how, and technology that FDI bring to domestic economy and influence local firms’ competitiveness. Non-debt-creating agenda is highly imposed in restricted capital conditions and FDI are used as life-support of fresh capital inflow (Frankel and Rose, 1996; Apostolov, 2013; Jaklič et al., 2014).
Effects can be caused in number of ways. Host country can improve its domestic base by using processes purchased from large international companies (licenses, franchises, etc.) or local companies can obtain such knowledge by reverse-engineering. Additionally, present FDI employ local stuff on management and labor positions, which gain experience and process knowledge that later can be transferred to domestic companies and start-ups. And, finally, the change of competitive structure pushes domestic companies to adapt and employ all necessary business systems in order to stay in the game (Glass and Saggi, 2002).
1.1.1Policy environmentEconomic and enterprise restructuring in Central Europe attributed significantly toward transition theory and practice, and especially to the fact that of large amounts of foreign direct investment at early stage impact gravely toward positive economic and political change. Thus, as the pattern developed it has been much desired and encouraged for implementation in Southeast Europe. So, significant inflows of foreign direct investment were attracted due to policy changes and forceful marketing tactics of every country in Southeast Europe, and as the competition between them increases it is likely to catalyze higher value-added inflows.
The policy environment in Southeast Europe has improved over the years, while all counties have successfully tackled inflation, developed noteworthy private sector through deregulation and privatization. Other important changes fallowed with improved business environment and slimmed-down public administration. Increased competitive characteristics meant reduced overall tax rate and as a trade-off instigated foreign direct investments to balance current account deficits. Indeed, such policies set foreign direct investments on pedestal, and all other policies must be in sync with the aim of attracting most fresh capital in form of FDI (Damijan et al., 2013; Jaklič et al., 2014; Damijan et al., 2015).
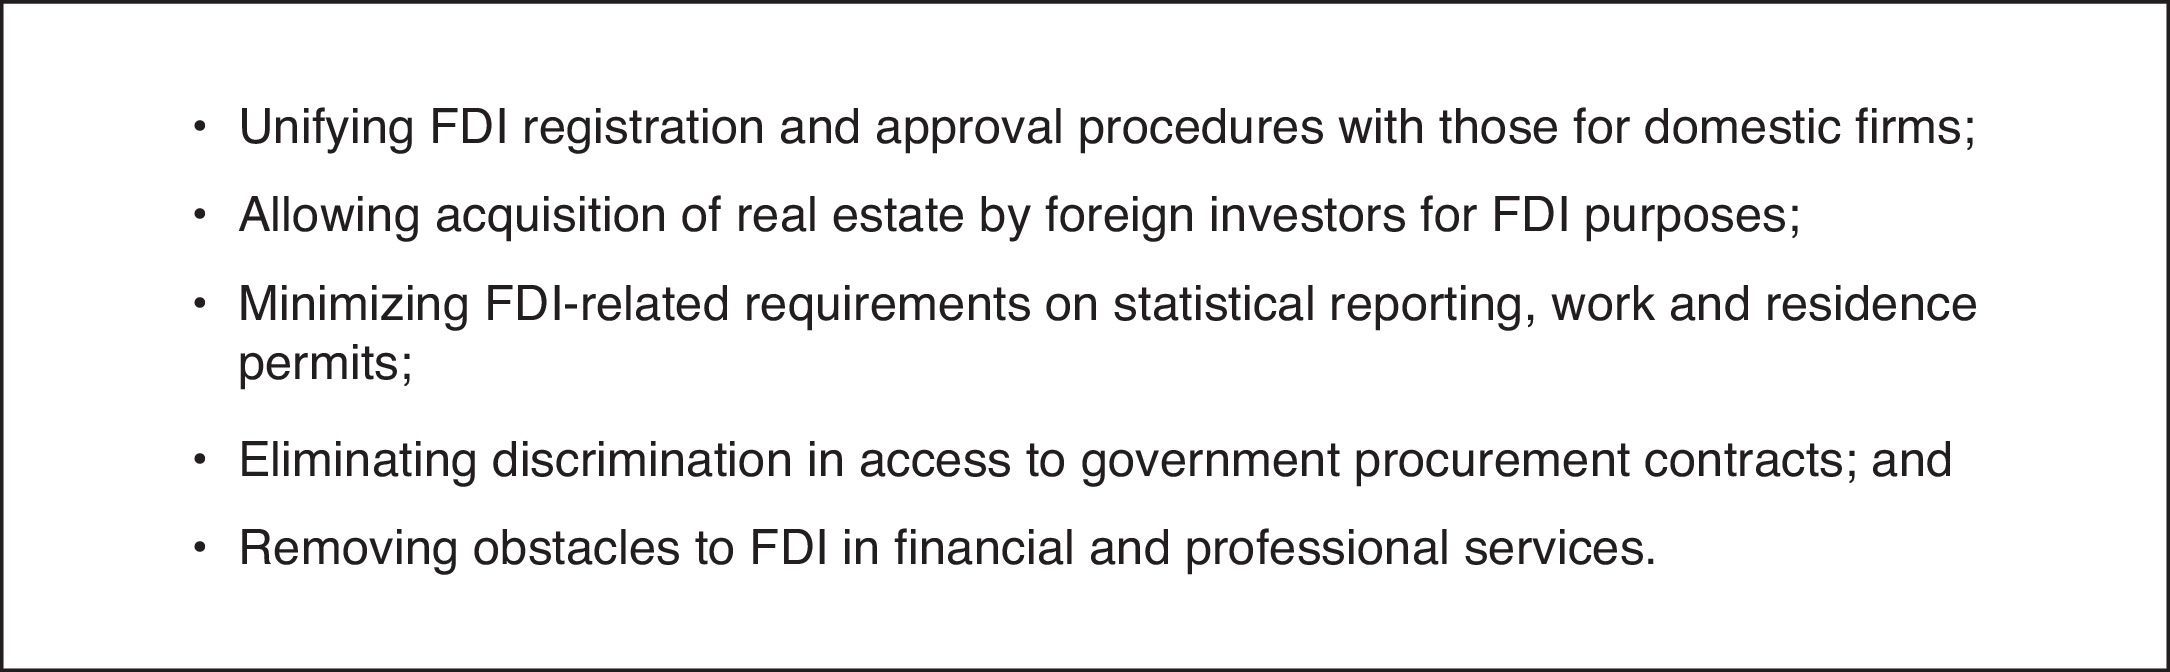
On the other hand, there are numerous weaknesses in number of areas. Feeble spots lay in corruption, law enforcement, property rights protection i.e. generally in governance. In economic terms major flows surfaced during the euro-area recession as most important trading partner of Southeast European countries are those of the European Union. So, these economies suffered imported chain reaction on their already weak bases. Nonetheless, Southeast European countries have accepted, more or less, a general approach to shaping the investment environment (Fig. 1) (Liebscher, 2005). Such policies gave beneficial effects in determining FDI flows.
1.1.2Timeline of effects of foreign investment on domestic firms
It has been found that the effects of foreign direct investment are dynamic (Merlevede et al., 2014). In fact, host economy benefits from presence of majority foreign owned companies and it depends on the time of presence of the foreign entrant onto domestic market, hence the longer-the better. The literature gives general guidelines on negative (horizontal) effects, but it is usually explained on short term bases and undercut competitive characteristics of domestic companies. When only the impact of entry is analyzed, the results show that there are only modest outcomes. However, most that benefit from immediate foreign entry are local suppliers, thus within first few years of entry local suppliers have considerable growth because of enhanced business relations with the majority foreign owned companies. As time goes by the effects become lighter. Nonetheless, post-entry effects last longer and it is due increased competitive characteristic of domestic cooperants and newly formed start-ups (Xu and Sheng, 2012).
Overall impression is that there is strong positive effect from foreign direct investment and if it is to be harnessed, it needs time. Effects on local suppliers are defined by the time of entry, and are immediate and positive. In the next few years the effect fades and it is attributed to horizontal spillovers. The time after that or longer presence of foreign direct investments is followed by increased strength of domestic companies that adopt to changing market conditions (Fig. 2).
.")
Timeline of effects of foreign investment on domestic firms (Merlevede et al., 2014).
When it comes to establishing efficiency effects from foreign direct investment, the literature gives two general outcomes: (1) inter-industry effects and (2) intra-industry effects.
(1) Inter-industry effects
The inter-industry effects are usually negative effects from foreign direct investment that disturb the market and force domestic companies out of business due to their dominant position. Hence, productivity effects on domestic companies are noted as negative (study on Venezuela) (Aitken and Harrison, 1999) (study on India) (Kathuria, 2000). Foreign internationals operating on local markets have tendency to keep technology leaks using patents and higher wages to critical employees. FDIs normally function in well established surroundings where encircle themselves only with trusted suppliers, thus preventing domestic potential players from entering into their business (Kokko, 1994).
Horizontal effects are crucial when it comes to building dominant position and precluding competition on domestic sector markets and draining the domestic market of quality labor. This increases costs for local companies making them likely to exit market (Aitken and Harrison, 1999).
Negative results can be caused also on vertical levels when market is distorted and foreign direct investment externalities that influence supply chains of domestic companies, tightening productivity gains and profit levels, which is translated in loss of competitive advantage to domestic enterprises (Beugelsdijk et al., 2008).
(2) Intra-industry effects
Intra-industry or vertical effects are upstream and downstream productivity gains for domestic companies. The case of positive effects consists of increased business standards applied by suppliers in the beginning phase and increased competitive characteristics of domestic companies overall. It is estimated that these effects can be quite substantial (Smarzynska Javorcik, 2004; Barrios et al., 2011) (study on UK) (Haskel et al., 2007) (study on US) (Keller and Yeaple, 2009).
Important effects can be noticed in production design practices, as well as, know-how transfer which eventually impacts managerial practices and overall corporate governance of local enterprises. The interaction with foreign managers and top practices increase the level of available knowledge to all local employees. Due time it makes local managers more apt to work and transfer such techniques further downstream, strengthening the supply chain of the present foreign investment and supplier domestic companies. Such local companies are later capable to undertake more competitive approach to the same or other markets increasing productivity which allows them access to foreign markets (Girma et al., 2008; La Porta and Shleifer, 2014).
The most noticeable direct form can be found in cooperation with domestic suppliers. However, indirectly such effects are found in increased domestic productivity, economies of scale of domestic companies, availability of technological goods and imitation and employment (Blalock and Gertler, 2008). Foreign direct investments and presence of foreign capital are considered positive especially in nonexistence of spillovers. In particular, in the cases of economies in transition, foreign capital has crucial role in overall enterprise restructuring (Blanchard, 1998; Djankov and Murrell, 2002).
1.2Methodological approachesThe basic approach was pioneered by couple of studies using data on Australia, Canada (Caves, 1974; Globerman, 1979) and Mexico (Blomström, 1986). Their empirical methodology is mainly based on cross-sectional data, while industrial aggregation has been extended and refined in later studies; however the basic approach is still, by and large, similar. That is to say, the regression allows for an effect of foreign direct investment on productivity of domestic firms within the same industry. Most research papers use either the contemporaneous level of foreign penetration, or relatively short lags as their explanatory variables. Anyhow, these studies usually measure short run effects of foreign presence on domestic productivity. In general, most of the studies analyze effects in manufacturing industries in developing, developed and transition economies.
It can be said that some methodological approaches with use of cross sectional data may lead to biased results (Gorg and Strobl, 2001). Indeed, they stress that using panels of firm-level data is the most fitting way of analysis due to two main reasons: (1) panel data permits an investigation into productivity of domestic firms’ for a longer time frame, and (2) such studies using firm-level data can diagnose effects controlling for other factors.
As far as horizontal effects are concerned there is feeble positive evidence and only couple of studies utilizing panel data confirm that, none of which is for developing countries (for UK (Liu et al., 2000), for US (Keller and Yeaple, 2009), for Ireland (Görg and Strobl, 2003), for Italy (Castellani and Zanfei, 2007), and for some transition countries (Damijan et al., 2013)). On the other hand, there are number of studies that employ data and estimation techniques to prove positive aggregate effects. The presence of negative aggregate effects is also well documented by use firm-level panel data for industries in developed and developing countries (for Venezuela (Aitken and Harrison, 1999), for China (Abraham et al., 2010), for Bulgaria, Romania and Poland (Konings, 2001)). The remarkable part of the studies conducted on transition economies is that most of them find at least some evidence of negative results.
1.3Analytical framework1.3.1Sample selection and dataThe data used in this research is from Enterprise Surveys data sets specified by the World Bank Microdata Library. These surveys are firm-level representative samples that gather information from the private sector. Further, the data sets include wide variety of business environment topics including firm characteristics, gender participation, access to finance, annual sales, costs of inputs/labor, workforce composition, bribery, licensing, infrastructure, trade, crime, competition, capacity utilization, land and permits, taxation, informality, business–government relations, innovation and technology, and performance measures. The datasets can be individual and country specific, as well as, aggregated throughout the years in order to give relevant information to the public. Hence, the questions are addressed to business owners and top managers, normally 1200–1800 interviews in larger economies, 360 interviews in medium-sized economies, and 150 interviews in smaller economies. The surveys are derived through two instruments: the Manufacturing Questionnaire and the Services Questionnaire. As far as sampling and weights are concerned in the Enterprise Surveys there is stratified random sampling, that is, all members of the population have the same probability of being selected and no weighting of the observations is necessary. In a stratified random sample, all population units are grouped within homogeneous groups and simple random samples are selected within each group. The strata for Enterprise Surveys are firm size, business sector, and geographic region within a country. Sector breakdown is usually manufacturing, retail, and other services. Obtaining panel data across multiple years is characteristic in current Enterprise Surveys.1
For purpose of this research we use specifically separated data sets contained in the World Bank's Enterprise Surveys, which will help us to formulate answers to the possibilities of spillover effect. Hence, we utilize the number of permanent full-time workers; capacity utilization (%); annual employment growth (%); annual labor productivity growth (%); proportion of total sales that are exported directly (%) and proportion of total sales that are exported indirectly (%), in order to see if the proportion of private foreign ownership in a firm (%) is the effect.
The data sets for certain countries, such as, Albania and Bosnia and Herzegovina have been additionally prepped, as some Enterprise Surveys indicators are condensed. As for the rest of the countries i.e. Croatia, Macedonia, Serbia and Slovenia, the panel data available by the World Bank is well drawn. Additionally, due to regression analysis we can read the causes that are involved in the change of economy's ownership structure or the effect translated in private foreign ownership. The sample data is well drawn and can be used purposely.
1.3.2Model and econometricsIn this section, we estimate the impact of external sources of foreign direct investments, mainly through foreign ownership, on the growth of output in Southeast European Economies. Therefore, it is utilized standard growth accounting approach that is usually used in such analysis. A production function is used to calculate the output movements based on number of variables.
As analytical framework of this research we take economy where progress is dependent on ‘capital deepening’ which takes form of increased capital goods available (Romer, 1990; Barro and Sala-i-Martin, 1997). We use standard Cobb–Douglas production function:
where Y is output, L stands for human capital (labor); and C represents physical capital; the parameters a, b, and c (the latter two being the exponents) are estimated from empirical data. Consequently, the state of environment includes policy issues controlling the level of productivity in the economy. Physical capital is sum of different varieties of capital goods, and hence capital accumulation is of essence when it comes to rapid development.
Present literature mainly utilizes Cobb–Douglas production function in order to estimate effects on domestic enterprises, or more precisely domestic firm productivity (Aitken and Harrison, 1999; Blalock and Gertler, 2008). Fallowing this function we take the variables: (1) exogenous state of environment closely related to capital – proportion of private foreign ownership in a firm (%), capacity utilization (%); (2) labor – number of permanent full-time workers, annual employment growth (%); annual labor productivity growth (%); (3) direct and indirect effects of physical capital – proportion of total sales that are exported directly (%) and proportion of total sales that are exported indirectly (%). We hypothesize that increased influx of foreign direct investments are associated with higher output rates, because a higher quality of capital is required for increasing competitiveness and employment.
In order to work with the variables we take ordinary least squares (OLS) or linear least squares model to calculate approximately the unknown parameters, which is a linear regression model. Indeed, the OLS model has proven over time to give stable results and it is widely used. The dependent variable stands for output, or in this case it is tested to see if it is the effect. Further, the independent variables are inputs and they are investigated to clarify whether they are the cause.
The econometric model that is used in this study is a regression model where we have estimated the following equation (Freedman, 2005; Freedman et al., 2007):
Thus, applied to our research this model has the fallowing shape:where the dependent variable, Yi,t, output; the independent variables, are as follows:

- 1.
FDIi,t, proportion of private foreign ownership in a firm (%);
- 2.
FTWi,t, number of permanent full-time workers;
- 3.
CUi,t, capacity utilization (%);
- 4.
AEGi,t, annual employment growth (%);
- 5.
ALPGi,t, annual labor productivity growth (%);
- 6.
PTSExDi,t, proportion of total sales that are exported directly (%);
- 7.
PTSExIi,t, proportion of total sales that are exported indirectly (%);
N.B. capital is controlled for and the use of growth figures in a regression of levels through proxy variables, most notably private foreign ownership in a firm and capacity utilization.
Results and effectsThe results are presented in Tables 1–3 as well as Figs. 3–5. It is taken a combined approach to explain the effects, where we use contents of both tables and figures. The basic hypothesis questions whether output depends on set of chosen variables: foreign proportion of private foreign ownership, number of permanent full-time workers; capacity utilization; annual employment growth; annual labor productivity growth; proportion of total sales that are exported directly and proportion of total sales that are exported indirectly. In this research we are mostly interested in the effects of foreign direct investment and its relation to overall economy.
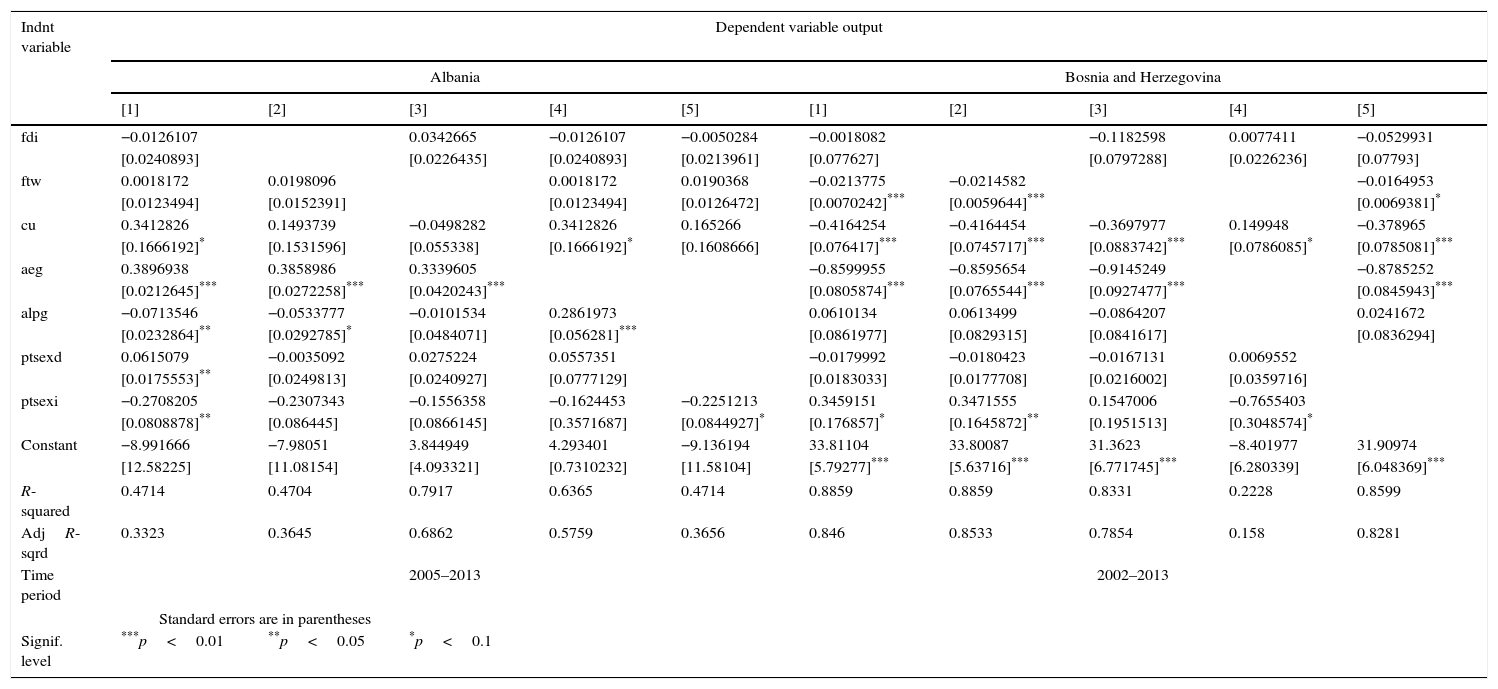
Tests on Albania and Bosnia and Herzegovina.
| Indnt variable | Dependent variable output | |||||||||
|---|---|---|---|---|---|---|---|---|---|---|
| Albania | Bosnia and Herzegovina | |||||||||
| [1] | [2] | [3] | [4] | [5] | [1] | [2] | [3] | [4] | [5] | |
| fdi | −0.0126107 | 0.0342665 | −0.0126107 | −0.0050284 | −0.0018082 | −0.1182598 | 0.0077411 | −0.0529931 | ||
| [0.0240893] | [0.0226435] | [0.0240893] | [0.0213961] | [0.077627] | [0.0797288] | [0.0226236] | [0.07793] | |||
| ftw | 0.0018172 | 0.0198096 | 0.0018172 | 0.0190368 | −0.0213775 | −0.0214582 | −0.0164953 | |||
| [0.0123494] | [0.0152391] | [0.0123494] | [0.0126472] | [0.0070242]*** | [0.0059644]*** | [0.0069381]* | ||||
| cu | 0.3412826 | 0.1493739 | −0.0498282 | 0.3412826 | 0.165266 | −0.4164254 | −0.4164454 | −0.3697977 | 0.149948 | −0.378965 |
| [0.1666192]* | [0.1531596] | [0.055338] | [0.1666192]* | [0.1608666] | [0.076417]*** | [0.0745717]*** | [0.0883742]*** | [0.0786085]* | [0.0785081]*** | |
| aeg | 0.3896938 | 0.3858986 | 0.3339605 | −0.8599955 | −0.8595654 | −0.9145249 | −0.8785252 | |||
| [0.0212645]*** | [0.0272258]*** | [0.0420243]*** | [0.0805874]*** | [0.0765544]*** | [0.0927477]*** | [0.0845943]*** | ||||
| alpg | −0.0713546 | −0.0533777 | −0.0101534 | 0.2861973 | 0.0610134 | 0.0613499 | −0.0864207 | 0.0241672 | ||
| [0.0232864]** | [0.0292785]* | [0.0484071] | [0.056281]*** | [0.0861977] | [0.0829315] | [0.0841617] | [0.0836294] | |||
| ptsexd | 0.0615079 | −0.0035092 | 0.0275224 | 0.0557351 | −0.0179992 | −0.0180423 | −0.0167131 | 0.0069552 | ||
| [0.0175553]** | [0.0249813] | [0.0240927] | [0.0777129] | [0.0183033] | [0.0177708] | [0.0216002] | [0.0359716] | |||
| ptsexi | −0.2708205 | −0.2307343 | −0.1556358 | −0.1624453 | −0.2251213 | 0.3459151 | 0.3471555 | 0.1547006 | −0.7655403 | |
| [0.0808878]** | [0.086445] | [0.0866145] | [0.3571687] | [0.0844927]* | [0.176857]* | [0.1645872]** | [0.1951513] | [0.3048574]* | ||
| Constant | −8.991666 | −7.98051 | 3.844949 | 4.293401 | −9.136194 | 33.81104 | 33.80087 | 31.3623 | −8.401977 | 31.90974 |
| [12.58225] | [11.08154] | [4.093321] | [0.7310232] | [11.58104] | [5.79277]*** | [5.63716]*** | [6.771745]*** | [6.280339] | [6.048369]*** | |
| R-squared | 0.4714 | 0.4704 | 0.7917 | 0.6365 | 0.4714 | 0.8859 | 0.8859 | 0.8331 | 0.2228 | 0.8599 |
| AdjR-sqrd | 0.3323 | 0.3645 | 0.6862 | 0.5759 | 0.3656 | 0.846 | 0.8533 | 0.7854 | 0.158 | 0.8281 |
| Time period | 2005–2013 | 2002–2013 | ||||||||
| Standard errors are in parentheses | ||||||||||
| Signif. level | ***p<0.01 | **p<0.05 | *p<0.1 | |||||||
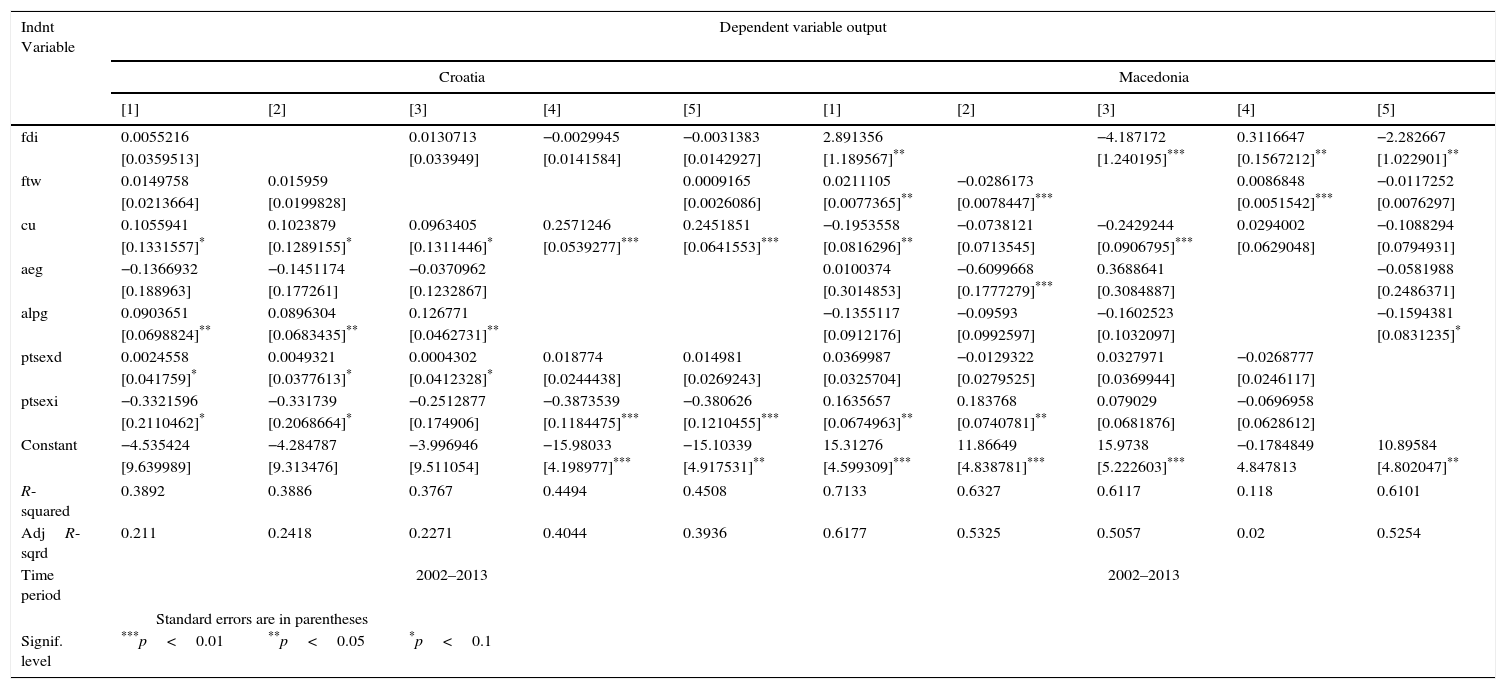
Tests on Croatia and Macedonia.
| Indnt Variable | Dependent variable output | |||||||||
|---|---|---|---|---|---|---|---|---|---|---|
| Croatia | Macedonia | |||||||||
| [1] | [2] | [3] | [4] | [5] | [1] | [2] | [3] | [4] | [5] | |
| fdi | 0.0055216 | 0.0130713 | −0.0029945 | −0.0031383 | 2.891356 | −4.187172 | 0.3116647 | −2.282667 | ||
| [0.0359513] | [0.033949] | [0.0141584] | [0.0142927] | [1.189567]** | [1.240195]*** | [0.1567212]** | [1.022901]** | |||
| ftw | 0.0149758 | 0.015959 | 0.0009165 | 0.0211105 | −0.0286173 | 0.0086848 | −0.0117252 | |||
| [0.0213664] | [0.0199828] | [0.0026086] | [0.0077365]** | [0.0078447]*** | [0.0051542]*** | [0.0076297] | ||||
| cu | 0.1055941 | 0.1023879 | 0.0963405 | 0.2571246 | 0.2451851 | −0.1953558 | −0.0738121 | −0.2429244 | 0.0294002 | −0.1088294 |
| [0.1331557]* | [0.1289155]* | [0.1311446]* | [0.0539277]*** | [0.0641553]*** | [0.0816296]** | [0.0713545] | [0.0906795]*** | [0.0629048] | [0.0794931] | |
| aeg | −0.1366932 | −0.1451174 | −0.0370962 | 0.0100374 | −0.6099668 | 0.3688641 | −0.0581988 | |||
| [0.188963] | [0.177261] | [0.1232867] | [0.3014853] | [0.1777279]*** | [0.3084887] | [0.2486371] | ||||
| alpg | 0.0903651 | 0.0896304 | 0.126771 | −0.1355117 | −0.09593 | −0.1602523 | −0.1594381 | |||
| [0.0698824]** | [0.0683435]** | [0.0462731]** | [0.0912176] | [0.0992597] | [0.1032097] | [0.0831235]* | ||||
| ptsexd | 0.0024558 | 0.0049321 | 0.0004302 | 0.018774 | 0.014981 | 0.0369987 | −0.0129322 | 0.0327971 | −0.0268777 | |
| [0.041759]* | [0.0377613]* | [0.0412328]* | [0.0244438] | [0.0269243] | [0.0325704] | [0.0279525] | [0.0369944] | [0.0246117] | ||
| ptsexi | −0.3321596 | −0.331739 | −0.2512877 | −0.3873539 | −0.380626 | 0.1635657 | 0.183768 | 0.079029 | −0.0696958 | |
| [0.2110462]* | [0.2068664]* | [0.174906] | [0.1184475]*** | [0.1210455]*** | [0.0674963]** | [0.0740781]** | [0.0681876] | [0.0628612] | ||
| Constant | −4.535424 | −4.284787 | −3.996946 | −15.98033 | −15.10339 | 15.31276 | 11.86649 | 15.9738 | −0.1784849 | 10.89584 |
| [9.639989] | [9.313476] | [9.511054] | [4.198977]*** | [4.917531]** | [4.599309]*** | [4.838781]*** | [5.222603]*** | 4.847813 | [4.802047]** | |
| R-squared | 0.3892 | 0.3886 | 0.3767 | 0.4494 | 0.4508 | 0.7133 | 0.6327 | 0.6117 | 0.118 | 0.6101 |
| AdjR-sqrd | 0.211 | 0.2418 | 0.2271 | 0.4044 | 0.3936 | 0.6177 | 0.5325 | 0.5057 | 0.02 | 0.5254 |
| Time period | 2002–2013 | 2002–2013 | ||||||||
| Standard errors are in parentheses | ||||||||||
| Signif. level | ***p<0.01 | **p<0.05 | *p<0.1 | |||||||
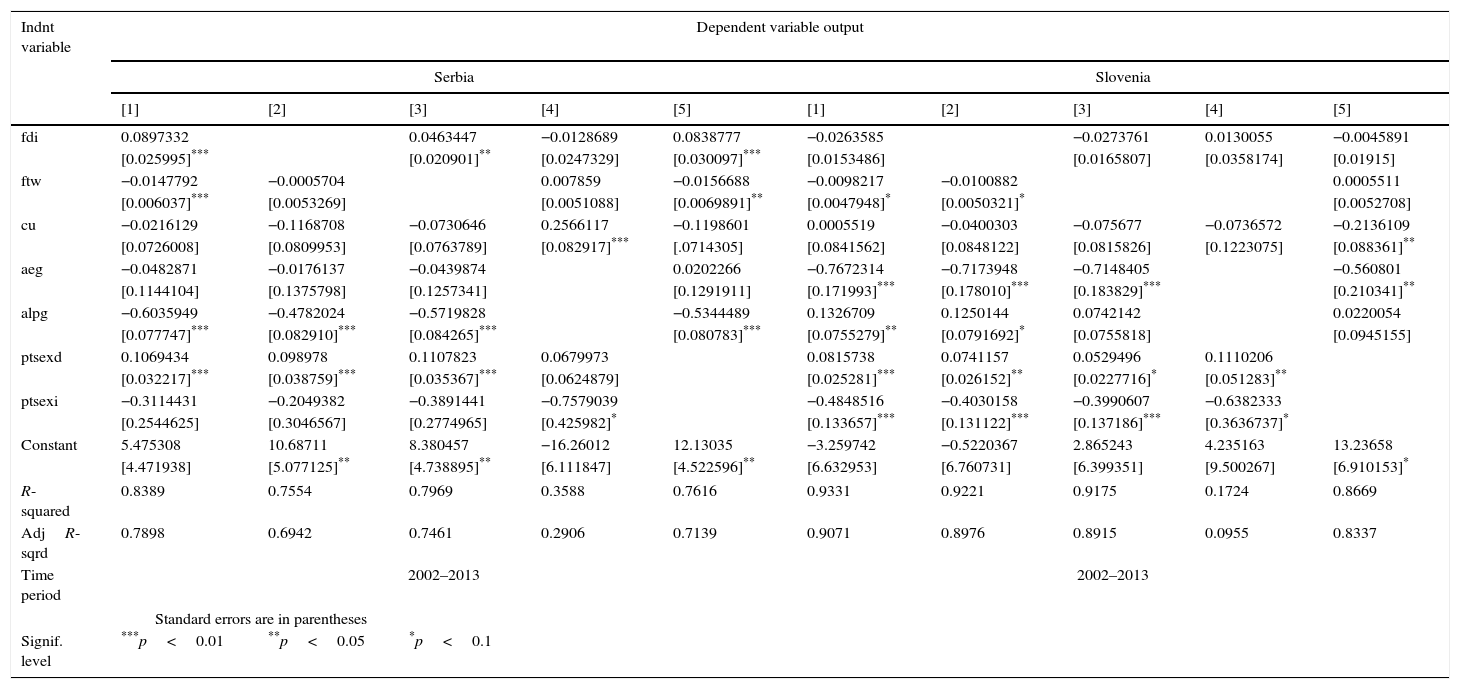
Tests on Serbia and Slovenia.
| Indnt variable | Dependent variable output | |||||||||
|---|---|---|---|---|---|---|---|---|---|---|
| Serbia | Slovenia | |||||||||
| [1] | [2] | [3] | [4] | [5] | [1] | [2] | [3] | [4] | [5] | |
| fdi | 0.0897332 | 0.0463447 | −0.0128689 | 0.0838777 | −0.0263585 | −0.0273761 | 0.0130055 | −0.0045891 | ||
| [0.025995]*** | [0.020901]** | [0.0247329] | [0.030097]*** | [0.0153486] | [0.0165807] | [0.0358174] | [0.01915] | |||
| ftw | −0.0147792 | −0.0005704 | 0.007859 | −0.0156688 | −0.0098217 | −0.0100882 | 0.0005511 | |||
| [0.006037]*** | [0.0053269] | [0.0051088] | [0.0069891]** | [0.0047948]* | [0.0050321]* | [0.0052708] | ||||
| cu | −0.0216129 | −0.1168708 | −0.0730646 | 0.2566117 | −0.1198601 | 0.0005519 | −0.0400303 | −0.075677 | −0.0736572 | −0.2136109 |
| [0.0726008] | [0.0809953] | [0.0763789] | [0.082917]*** | [.0714305] | [0.0841562] | [0.0848122] | [0.0815826] | [0.1223075] | [0.088361]** | |
| aeg | −0.0482871 | −0.0176137 | −0.0439874 | 0.0202266 | −0.7672314 | −0.7173948 | −0.7148405 | −0.560801 | ||
| [0.1144104] | [0.1375798] | [0.1257341] | [0.1291911] | [0.171993]*** | [0.178010]*** | [0.183829]*** | [0.210341]** | |||
| alpg | −0.6035949 | −0.4782024 | −0.5719828 | −0.5344489 | 0.1326709 | 0.1250144 | 0.0742142 | 0.0220054 | ||
| [0.077747]*** | [0.082910]*** | [0.084265]*** | [0.080783]*** | [0.0755279]** | [0.0791692]* | [0.0755818] | [0.0945155] | |||
| ptsexd | 0.1069434 | 0.098978 | 0.1107823 | 0.0679973 | 0.0815738 | 0.0741157 | 0.0529496 | 0.1110206 | ||
| [0.032217]*** | [0.038759]*** | [0.035367]*** | [0.0624879] | [0.025281]*** | [0.026152]** | [0.0227716]* | [0.051283]** | |||
| ptsexi | −0.3114431 | −0.2049382 | −0.3891441 | −0.7579039 | −0.4848516 | −0.4030158 | −0.3990607 | −0.6382333 | ||
| [0.2544625] | [0.3046567] | [0.2774965] | [0.425982]* | [0.133657]*** | [0.131122]*** | [0.137186]*** | [0.3636737]* | |||
| Constant | 5.475308 | 10.68711 | 8.380457 | −16.26012 | 12.13035 | −3.259742 | −0.5220367 | 2.865243 | 4.235163 | 13.23658 |
| [4.471938] | [5.077125]** | [4.738895]** | [6.111847] | [4.522596]** | [6.632953] | [6.760731] | [6.399351] | [9.500267] | [6.910153]* | |
| R-squared | 0.8389 | 0.7554 | 0.7969 | 0.3588 | 0.7616 | 0.9331 | 0.9221 | 0.9175 | 0.1724 | 0.8669 |
| AdjR-sqrd | 0.7898 | 0.6942 | 0.7461 | 0.2906 | 0.7139 | 0.9071 | 0.8976 | 0.8915 | 0.0955 | 0.8337 |
| Time period | 2002–2013 | 2002–2013 | ||||||||
| Standard errors are in parentheses | ||||||||||
| Signif. level | ***p<0.01 | **p<0.05 | *p<0.1 | |||||||


In the case of Albania the results (Table 1) show strong positive inclination (p<0.01) on annual employment growth. This is sign that the economy has been focused on assuming labor, and it is due to abundance of this particular factor of production (Lim, 2001; Llaci et al., 2002). Albania has improved policies that directly encourage foreign direct investment, in order to provide an encouraging environment, and generally three principal factors are at play in this case: profitability of individual projects; the ease of integration, and the overall environment facilitating influx of investment (Muço et al., 1999; Muço and Sanfey, 2002; Piracha and Vadean, 2010). Nonetheless, foreign direct investments have lag in enabling dynamic structural change into high value added production and trade. As far as sector diversification is concerned, foreign direct investment stock has high concentration on services and there is less presence in production (Aristidis and Ersanja, 2005; Mirela and Will, 2012). Also, significance can be noticed on annual labor productivity growth, even though the proclivity is negative and can be interpreted in terms of labor intensive allocation of capital and investments. The variable examining the proportion of total sales that are exported directly has positive upturn, however there is offset by on the proportion of total sales that are exported indirectly. This indicates that domestic companies are still not well included in production and exporting base, usually generated by foreign direct investments. In this regard, capacity utilization is seen to be positive and it indicates that there are new gains achieved by companies, but it must be said that this result has shown to be mixed and therefore speculative.
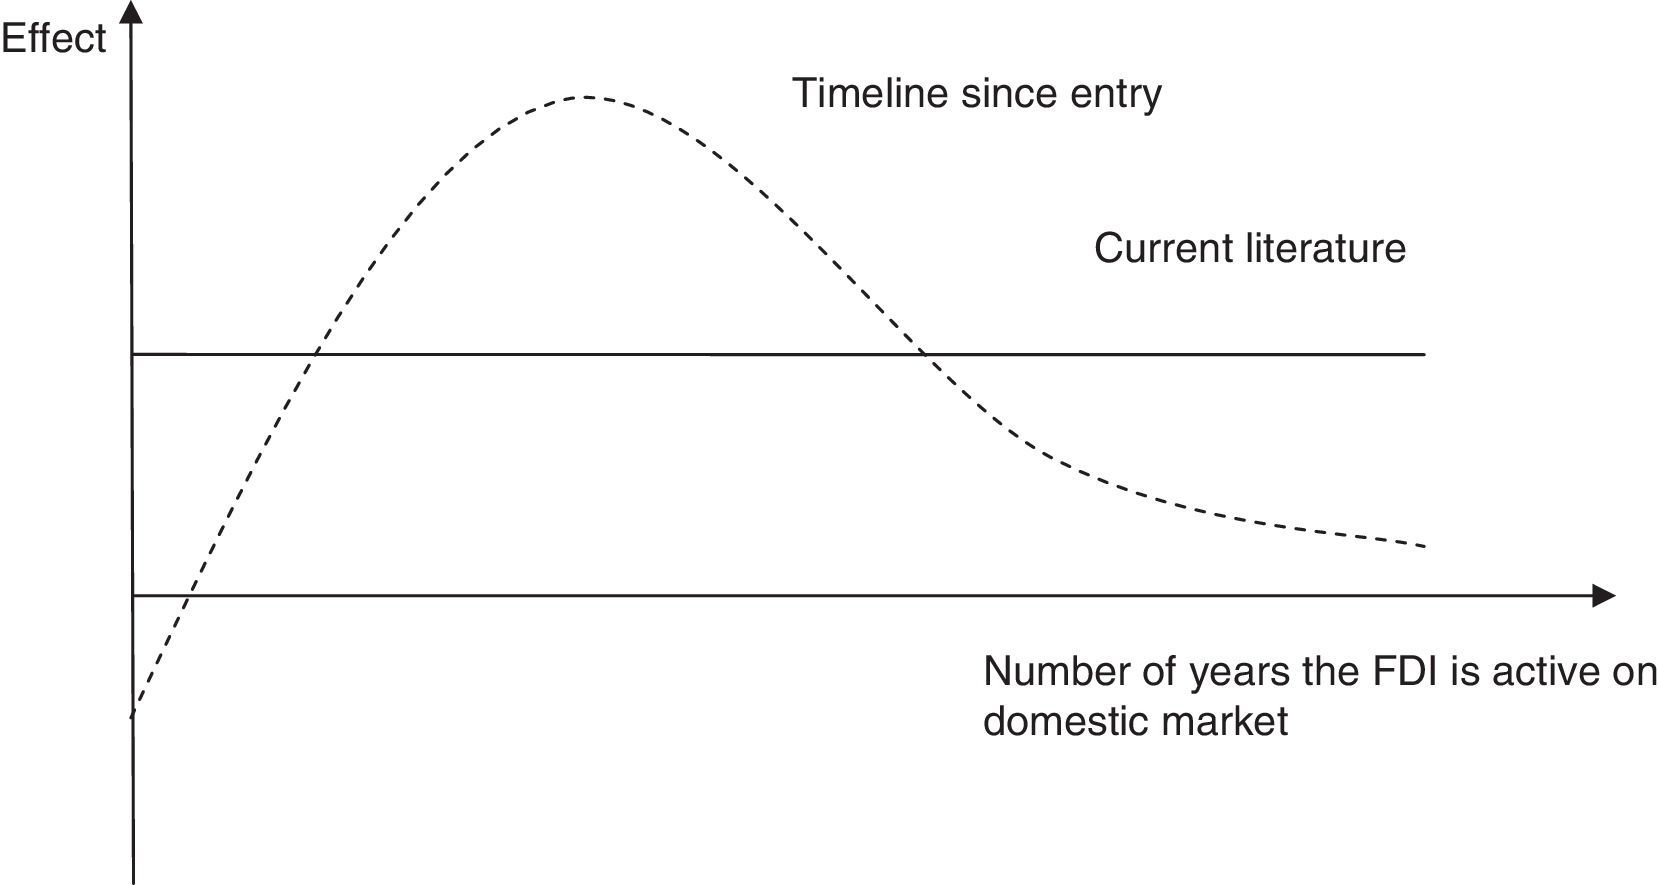
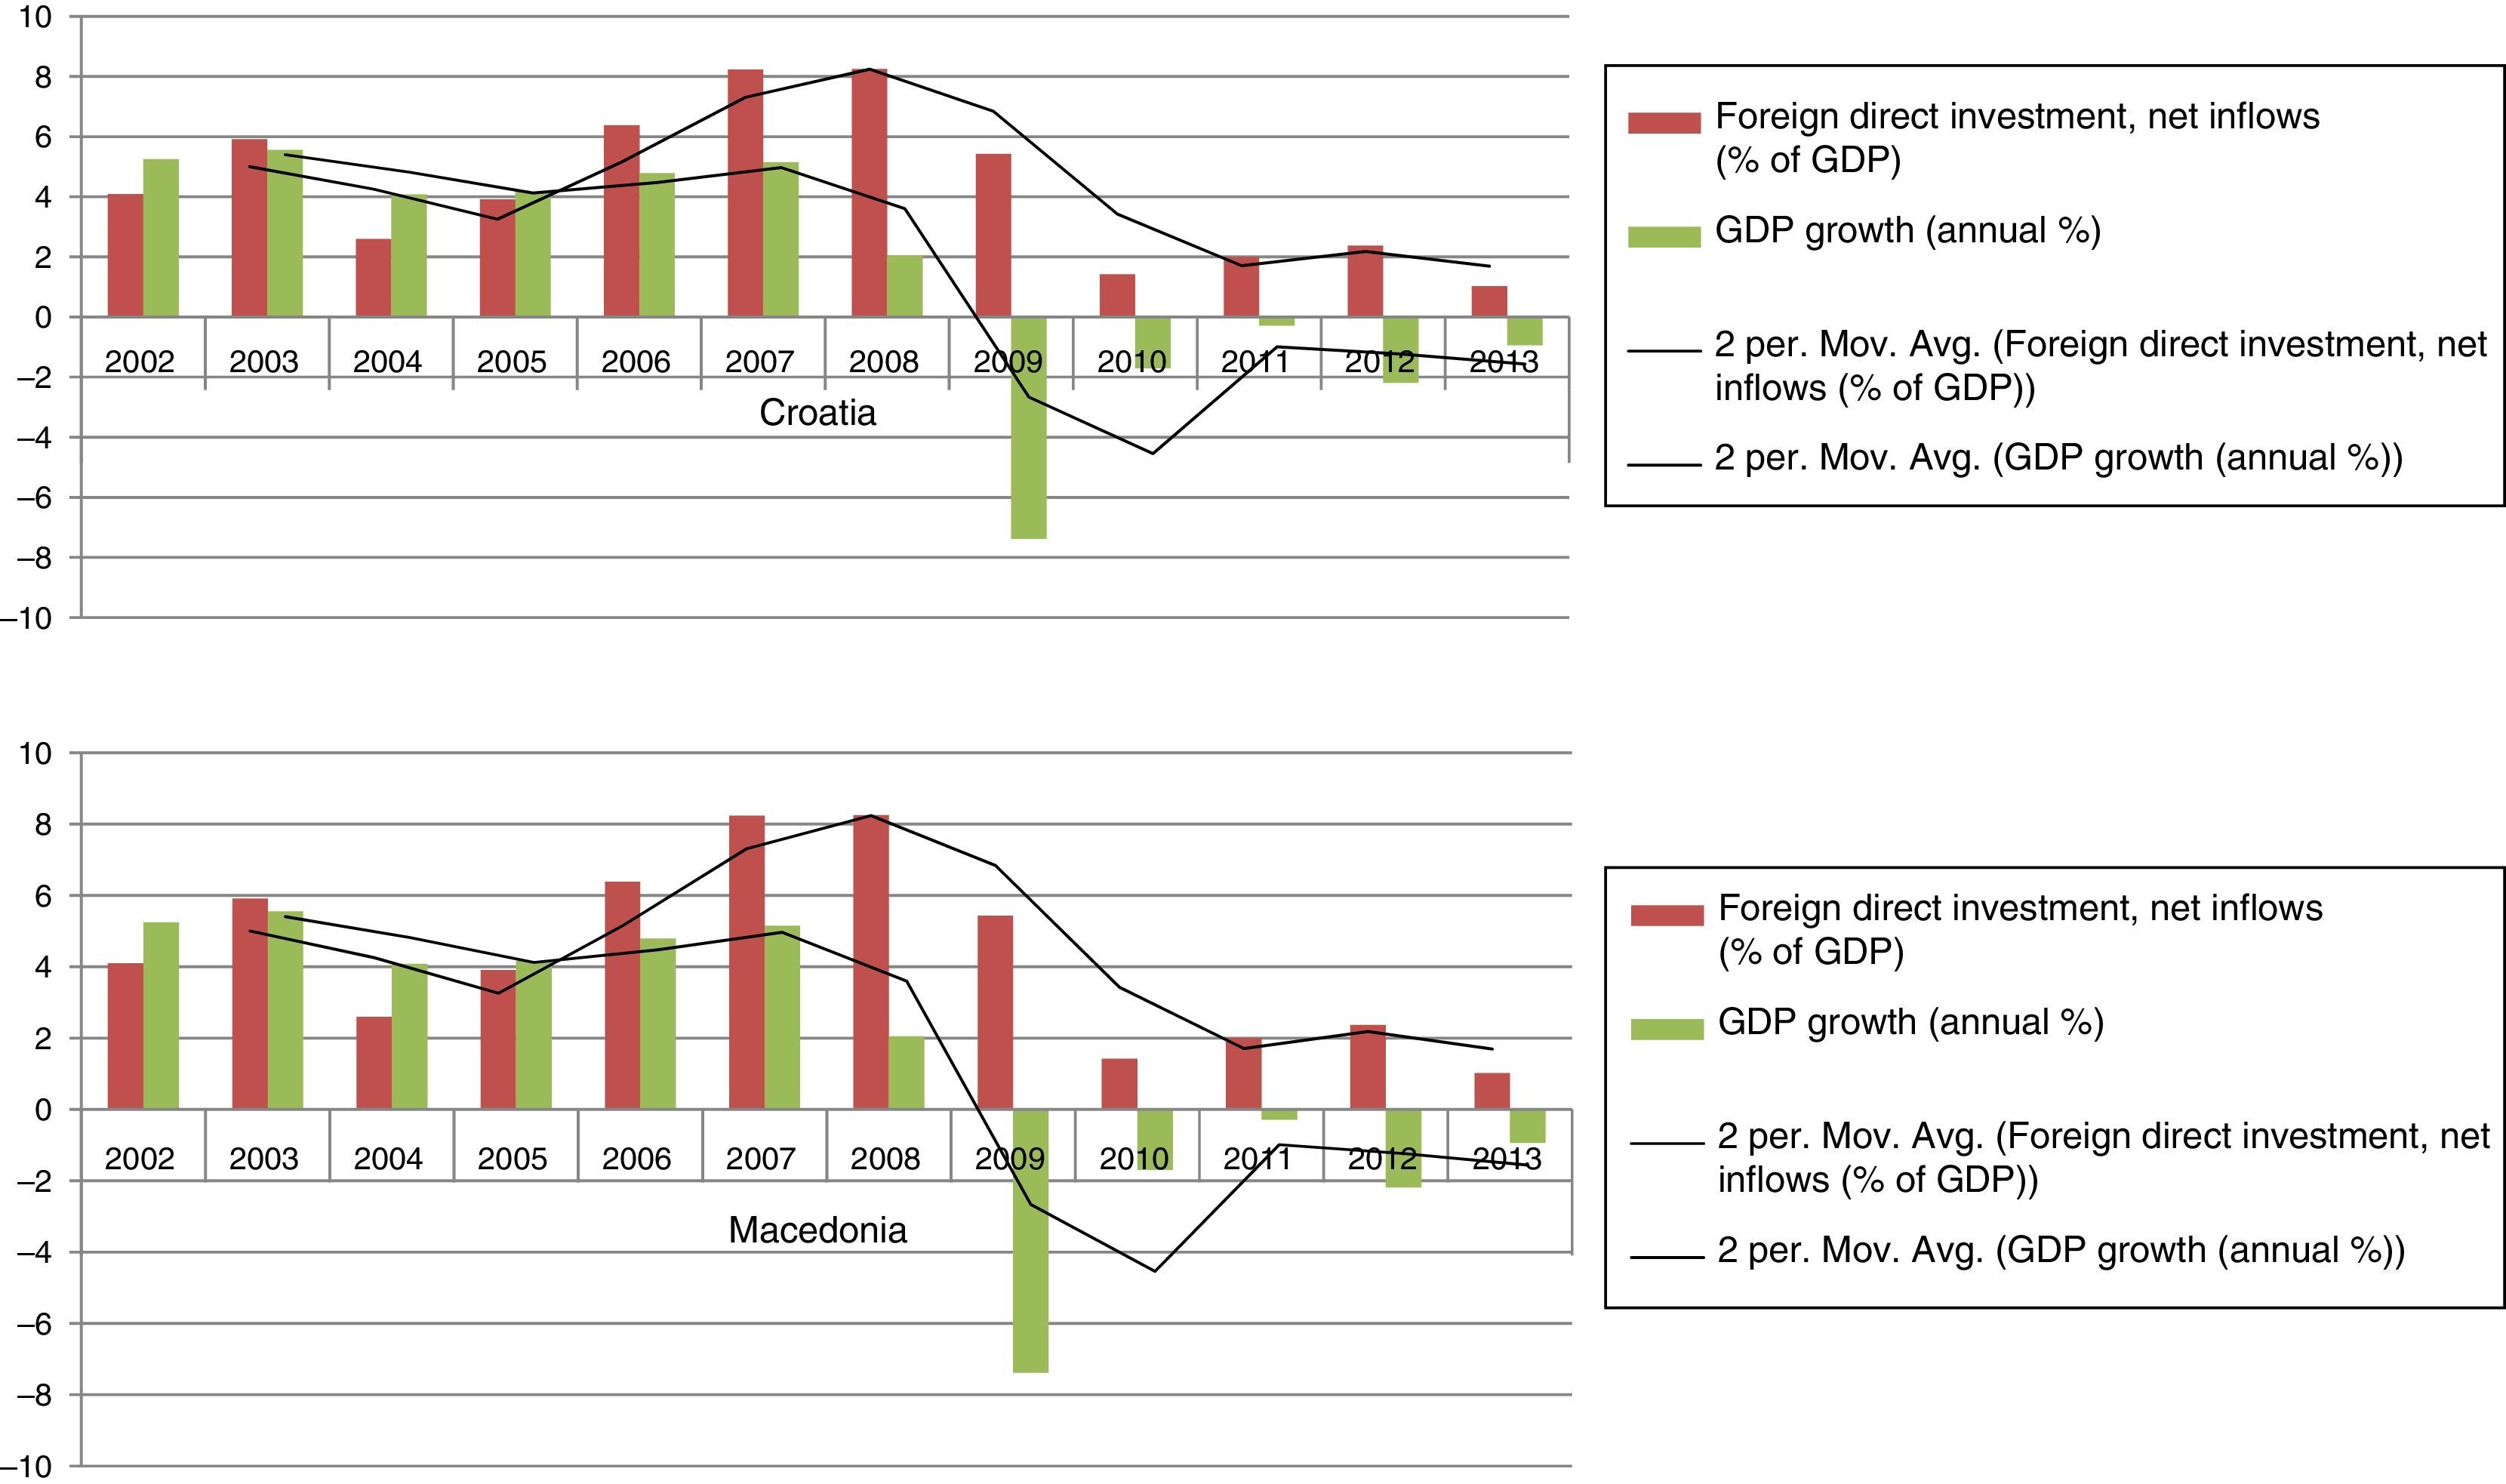
Fig. 3 confronts foreign direct investment and gross domestic product in a simple manner and for Albania it shows influx of FDI over time. The averages of FDI and GDP move closely in the first phases, nonetheless separate due time which is odd severance of these rather tied variables.
As far as Bosnia and Herzegovina is concerned (Table 1) there is statistical significance in the number of permanent full-time workers; capacity utilization and annual employment growth (p<0.01), inclined negatively. The decrease of labor i.e. the employment growth which is specifically recognized through permanent fill-time workers lag because of certain negative political movements that happened in the past few decades (Nastav and Bojnec, 2007; Javorcik and Spatareanu, 2011). Capacity utilization is indicator of capital use and it shows unused capacities, unfortunately. Though, it can also be seen as advantage since there is space for increase in future employment of unused capacities. On the other hand, the variable explaining the proportion of total sales that are exported indirectly is statistically significant and has positive inclination. This constant illustrates that there is strong positive overall effect.
When compared movements of gross domestic product and foreign direct investments (Fig. 3) we can notice that these two are closely related and interlinked.
Croatia has positive inclination on capacity utilization according to our analysis (Table 2), which can be interpreted as increased business activity. More solid results are found on annual labor productivity growth, where the statistical significance (p<0.05) indicates employment of capital-intensive sectors (Lane et al., 2002; Liebscher, 2005). In the tests conducted for this country we also find optimistic movements of proportion of total sales that are exported directly and proportion of total sales that are exported indirectly, however it can be said that there is just slight evidence that this is the case.
Fig. 4 gives general outlook of movements of gross domestic product and foreign direct investment for Croatia. It can be noticed that these two are in sync; nevertheless foreign direct investment is more resilient to crises and always positive, driving the economy out of problems.
There are some interesting results on Macedonia (Table 2). The tests indicate that foreign direct investments have been utilized more than any other country in this research. Foreign ownership is with mixed results depending on the model (p<0.05); however, the constant in most of the models is positive and fairly high. We find significance with mixed sign for number of permanent full-time workers and negative inclination for capacity utilization, which points to the fact that the economy has capacities for employment that have not been reached in full yet, and are inducing labor-intensive investments seen through reduced capacity utilization which eventually pressures domestic exports (La Porta and Shleifer, 2014). On the other hand, proportion of total sales that are exported directly are with positive tendency which might as well be result of foreign ownership influx (Apostolov, 2011). Indeed, this is consistent with research on foreign direct investment links to countries’ exports (Girma et al., 2008).
Fig. 4 shows that gross domestic product and foreign direct investments are closely tied. Without a doubt, it is evidence that the influence of foreign direct investments is significant and contributes greatly overtaking the main indicator of the domestic economy.
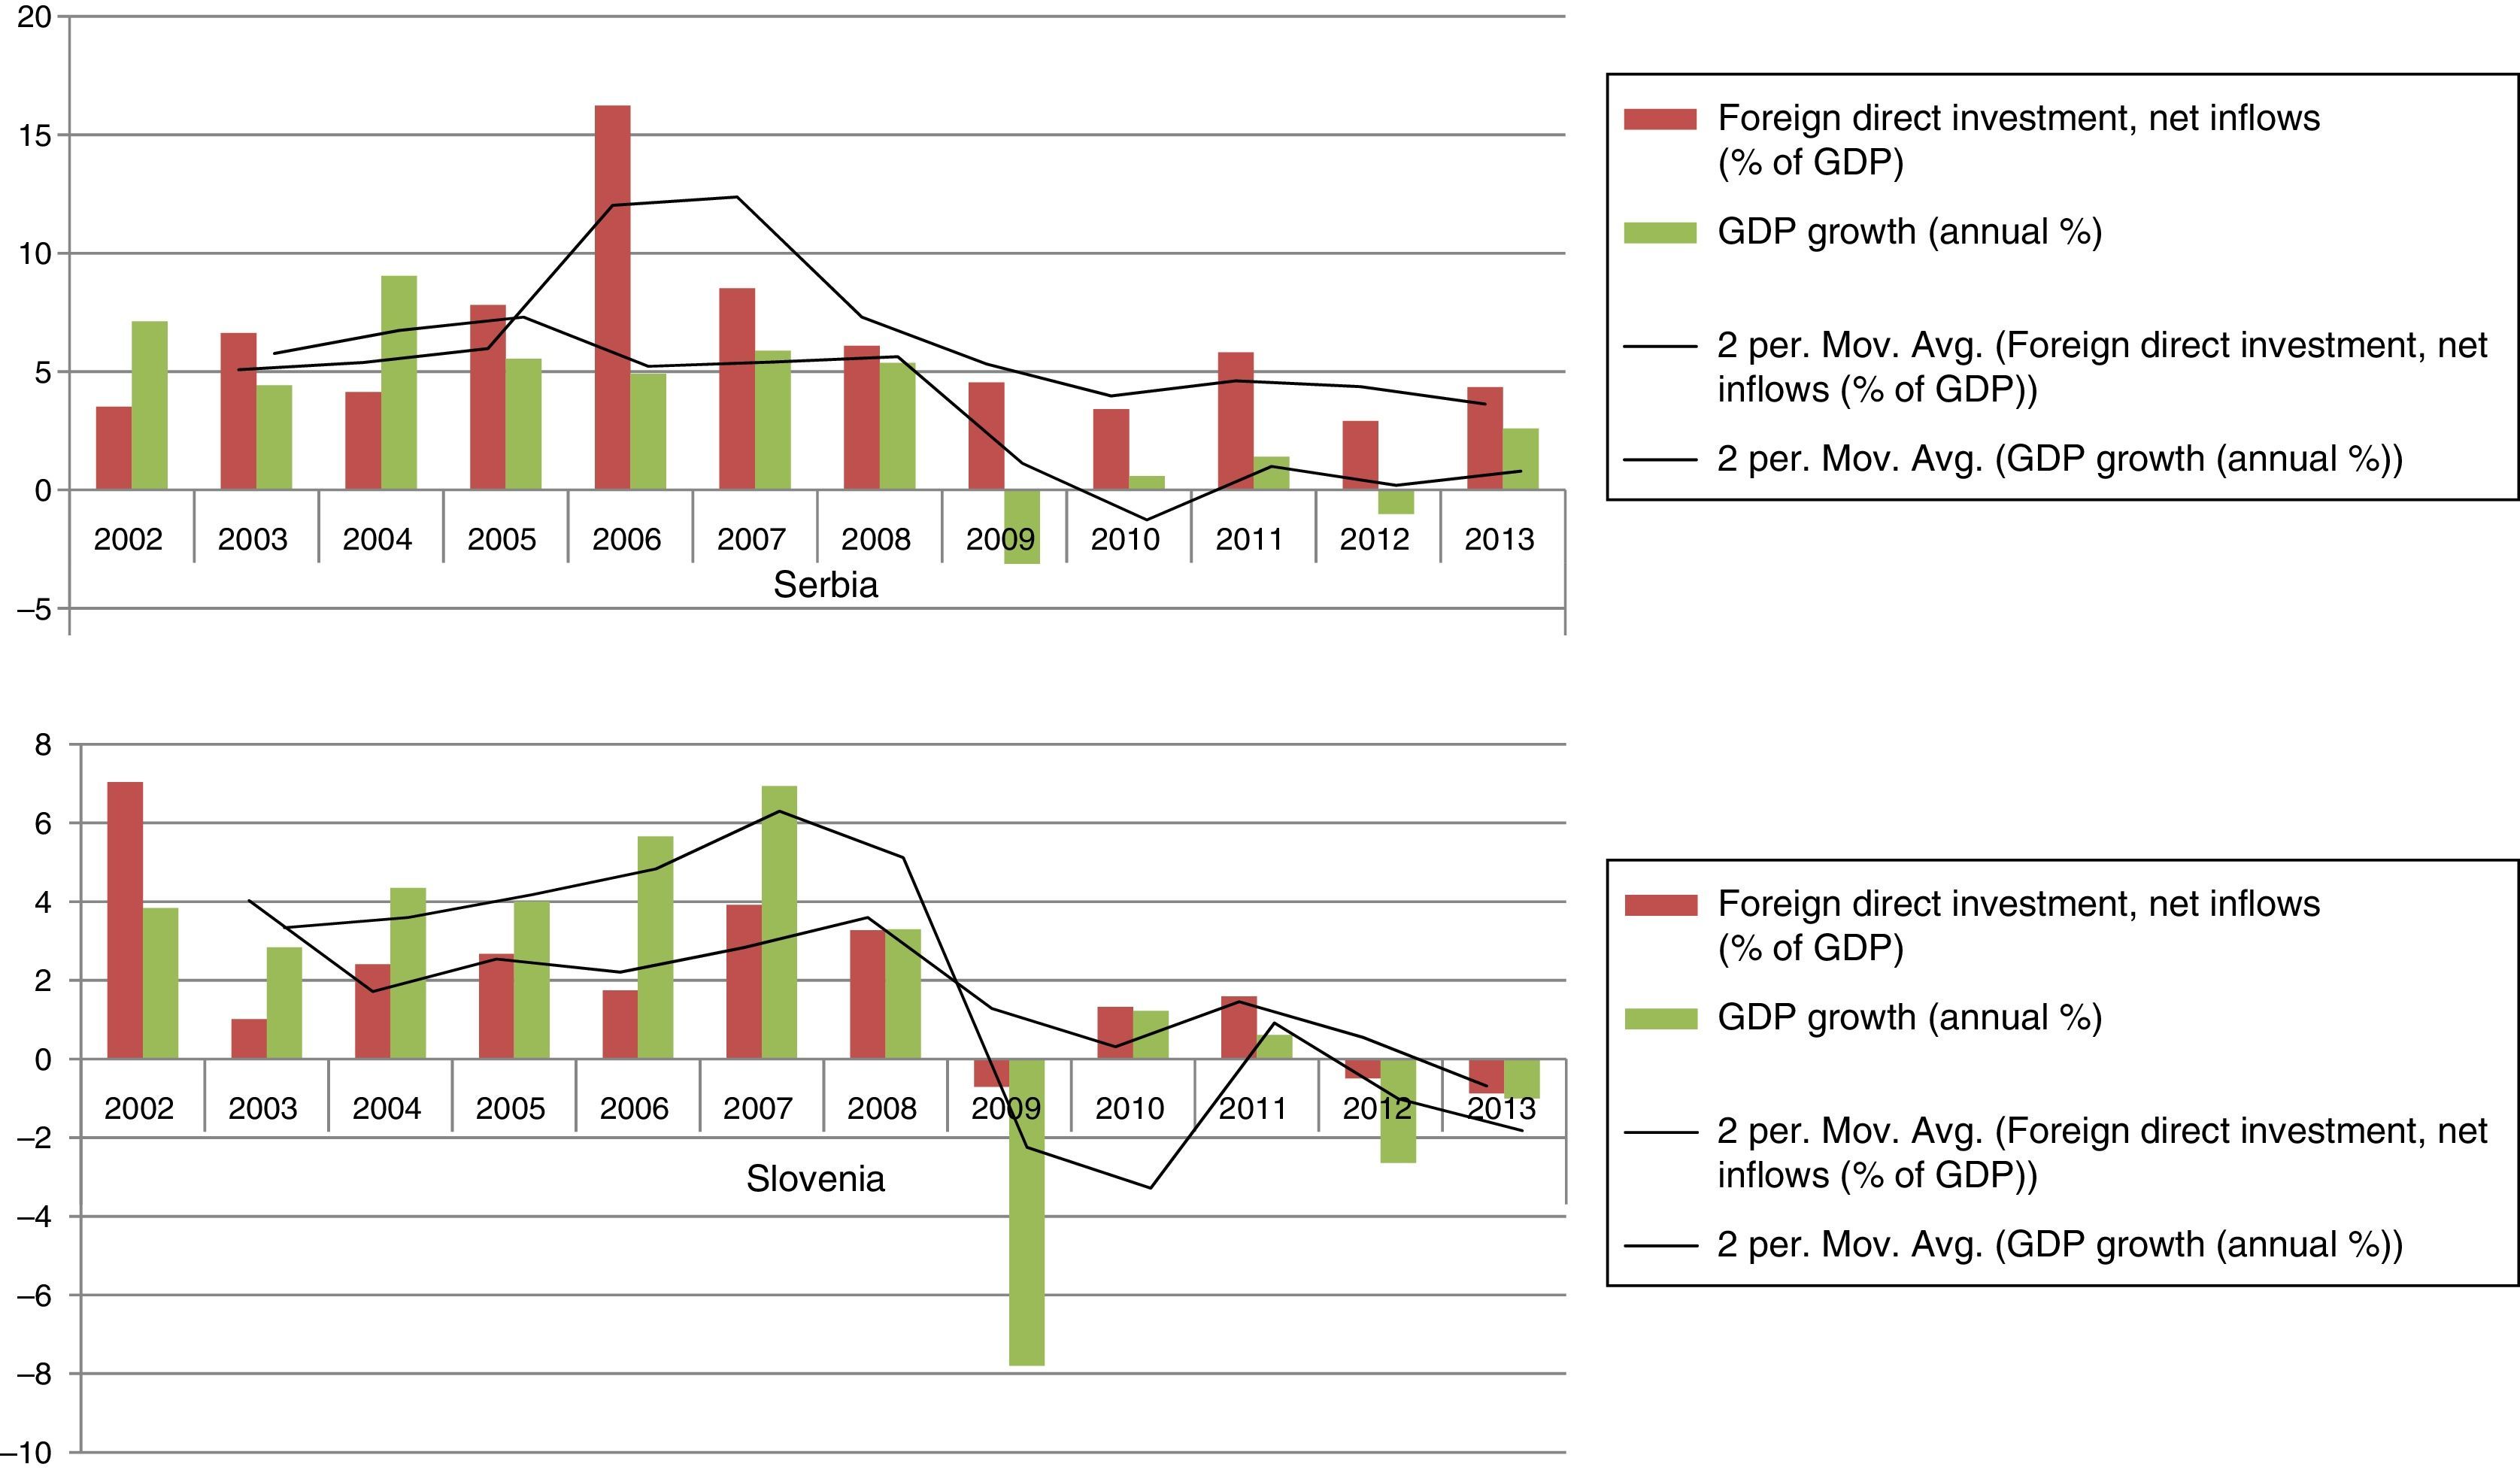
Serbia is also a good example of foreign direct investment influence on domestic output (Table 3). There is positive significance related to foreign ownership (p<0.01), which gives good grounds of the claim that foreign direct investment is major contribution to development of domestic economy. Further, it is found also that proportion of total sales that are exported directly is positive and usually in the literature is found that it is effect of increased influx of capital is mainly due to foreign direct investments (Djankov and Murrell, 2002). Nevertheless, pessimistic outcomes were found for number of permanent full-time workers and annual labor productivity growth, falling in line with labor market developments in all other analyzed countries.
The relationship between that gross domestic product and foreign direct investments (Fig. 5) is in line with developments regionally. This means that these two are related and as output falls foreign ownership is less inclined to invest in the country and, vice versa, foreign direct investments are general driver of domestic business opportunities. Also, the level of investment is quite high as there are unused economies of scale and possibilities for privatization of natural monopolies under way in this economy.
When analyzed Slovenia (Table 3) it is evident that this economy has fairly better quality of labor expressed through positive and increased annual labor productivity growth. Contrary, we see that there is fall of number of permanent full-time workers and negative annual employment growth which is mainly because of European debt crisis which hit Slovenia harshly and distorted the factor markets (Smith, 1776). When investigated the exports it is shown that there is positive incline of proportion of total sales that are exported directly and it is owned mainly on capital-intensive sectors and foreign ownership, as the negative slope of proportion of total sales that are exported indirectly denotes less inclusion of domestic business in the output equation.
Movements of gross domestic product and foreign direct investments (Fig. 5) are tied. The interesting thing about this case is that gross domestic product growth is found to be higher than the incursion of foreign ownership and it is good indicator of endogenous path to growth. In the case of Slovenia can be said that it is far clearer that gross domestic product pulls foreign direct investment either way.
2ConclusionsIn the working hypothesis we test the dependence of output to capital and labor thorough set of variables. Further, we center on effects of foreign direct investments in Southeast Europe economies. The results explained for each of the countries’ economy give outlook to the way foreign ownership might influence business environment and economy's output. Through assessment of the results of the research with focus on what can be classified as a new contribution to economic science; and in relation to already established literature it is evident that economies, and especially transition economies, in the first wave of noteworthy influx of foreign direct investments can increase overall output. Indeed, foreign ownership has predisposed movements in domestic economies with constant increase of the capital base. Some countries show better results (Macedonia, Serbia and Croatia), others more moderate ones (Albania and Bosnia and Herzegovina), and there are ones that are more driven by domestic movements rather than foreign (Slovenia). On the other hand, productivity growth has shown to be latent in almost all analyzed countries, which might be a consequence to low level of technological advance and less endogenous development. The countries suffer of lag in labor force employment and it is understandable as such developments come in later phases of FDI presence. Finally, strong evidence on the impact on exports has been noticed; especially direct exports which lead coupled unswervingly to foreign direct investment entry. Overall, the tests conducted on the hypothesis give positive outcomes related to foreign ownership and thus foreign direct investments are tied to most of the selected movements in the domestic economy. There are positive ties of foreign direct investments with gross domestic product in all of the domestic economies. The indicated problem of productivity and especially of labor productivity is mostly related to previous levels and starting point at foreign ownerships’ entry, in turn a measure of economy's sophistication. Nonetheless, gross domestic product and foreign direct investments are closely tied and the influence of foreign direct investments over gross domestic product is noteworthy. Furthermore, it is apparent that foreign ownership advances throughout time because of imposed policies, as well as, overall progress of the economy's gross domestic product owing to increased influx of foreign direct investments.
3Limitations and future researchSome limitations and future research paths can be advised by this study. This research relays on broad indicators that helped measure effects of foreign direct investments for group of countries in Southeast Europe. Applying different variables explaining output in future analysis can help uncover important inferences.
In general, a limitation of this study is that it was restricted to Southeast European countries. Another important constraint is data availability especially data specifically intended to analyze the foreign direct investment, however major economic and business indicators are available on large and respected databases which are employed in this research paper.
In future projects researchers might wish to use the same (or modified) methodology as applied in this investigation, employ it to other countries and test whether domestic ownership and firm development is constraint or support for increased incursion of foreign direct investments, in both, developed and developing countries. Another possible path of research could be an analysis on the impact of foreign direct investments by type of investment and sector, which might lead to valuable policy implications singling out the industry or sector most fitting to attract foreign direct investment inflow.
Enterprise Surveys – World Bank Microdata Library, available at: [http://www.enterprisesurveys.org/].