

An experiment has been carried out in the laboratory to assess the difference in the bidding behaviour between current managers of an energy company and future managers or university students of Economics. The novelty of the experiment is that it has precisely mimicked a real capacity auction of LNG off-loading and that the professionals that have participated belong to the energy company that is responsible for the auctions. The experiments show that the laboratory setting is appropriate both for teaching and experimentation. The research results demonstrate that professionals bid higher than students and that women bid higher than men.
Se ha llevado a cabo un experimento en laboratorio para evaluar la diferencia entre el comportamiento de licitación entre los directivos actuales de una empresa energética y los futuros directivos o estudiantes universitarios de Economía. La novedad del ensayo es que ha imitado con precisión una subasta de capacidad de descarga de GNL y que los profesionales que participaron formaban parte de la empresa energética responsable de las adjudicaciones. Las pruebas revelaron que el entorno de laboratorio es apropiado tanto para la enseñanza como para la experimentación. Los resultados de la investigación demuestran que los profesionales ofertaron un precio más alto que los estudiantes y que las mujeres ofertaron un precio más alto que los hombres.
Since Chamberlin (1948), games and simulation resources not only have been a powerful ally to study the application of individual or collective decisions and actions regarding the theoretical model (Liu et al., 2011) but also have been widely used in firm's strategy and marketing plans (Gavetti et al., 2005; Gary, 2005; Otamendi and Doncel, 2012) as well as to foster managers education (Pfahl et al., 2004).
Besides, Information and Communication Technology has facilitated student's acquisition of the cognitive skills required for analysis (Lim and Barnes, 2005) and accelerated a more efficient learning process (Akinsola and Animasahun, 2007). That is a crucial reason of the extensive use of simulation activities in students teaching (Rutten et al., 2012).
This research describes the combination of both technologies through the application of an auction simulation tool to teach both managers and students and compares their experimental behaviour. There have been some attempts to compare students vs. non-students in internet auctions (for example, Depositario et al., 2009; Wilcox, 2000) but, up to our knowledge, no experiments have been run with both types of participants within specific markets. Moreover, there are no references to comparisons in which the experiment in which the professionals belong to the industrial market that serves as the basis for the simulation in the laboratory.
As a testbench, we use professionals of Enagás, the Spanish owner of the pipelines that transport the LNG (liquefied natural gas) into Spain, and economics and business students of the Universidad Rey Juan Carlos in Madrid.
At the outset of the research, Enagás was in the need to learn about the design and execution of auctions in general and capacity auctions in particular due to the upcoming future change in regulation imposed by the EU Commission. Traditionally the rights to offload the LNG tankers in the harbours were bought and traded over the counter (OTC) or not even traded at all. The EU directives on the liberalisation of the electricity and the gas markets require nowadays the development of markets in every stage of the supply chain of LNG. Besides the utilities markets currently available for the products or commodities, the trend is to develop capacity markets, that is, the rights to move the product along the supply chain. In this context, human capital becomes essential in order to understand the rules that would govern the capacity auctions of time slots for offloading LNG. The focus of this article is on the auctions of short-terms adjustment of capacities at the harbours in order to optimise the outflow of the LNG from tankers to reservoirs in order to guarantee service.
By setting a laboratory experiment to resemble capacity markets to offload LNG, we proceeded to design an interface for professionals to better understand how to auction within the new market conditions affected by the regulations imposed by the EU. The simulation had to cover both the teaching of auction theory as well as the training of the professionals in their upcoming duties of taking quick decisions in online auctions through an experiment.
With the laboratory experiment installed and running at the Enagás offices, and fostering the university-job market relationship, we applied the same learning setting at the Universidad Rey Juan Carlos and followed the same experimental process with Economics and Business Administration students.
After four sessions of experimentation, two with professionals and two with students, the objective was to test if the behaviour of both groups, professionals or current managers and students or future managers, during the auction experiments were similar or differ in terms of the status in their career. We also looked for differences in terms of gender and auction types. As a by-product, the aim was to demonstrate if this experimental technology tool is reliable and appropriate for educational purpose of both professional managers and students.
As a result, we have found that professionals bid higher than students and women bid higher than men. The differences among auctions types are not so straightforward, indicating that both groups should be further trained in theoretical concepts.
The article is organised as follows. Section 2 explains the basic theory that is necessary to understand the experiment and that was transmitted to the participants. Section 3 details the design of the experiment and Section 4 explains the results in terms of the different factors that have been addressed in the experiments: status (professionals vs. students), gender (women vs men) and auction type (First vs Vickrey). Section 5 is used to discuss the results and conclude.
2Background in experimental auctionsA specific field in auction theory studies the design and execution of games in which multiple players try to buy different goods. The players have to place a BID, and therefore are usually called bidders, according to the VALUE that the good is worth for them. The objective in an auction from a participant's point of view is to buy goods by placing appropriate BIDS but with the awarded price to pay being as low as possible, at least lower than one's own perceived VALUE. In other words, the profit obtained by a participant will be “awarded price–value”, and should be non-negative.
There are different auction mechanisms in terms of the selection of the winner of the auction and the price that is then paid for the good. In this article, and following LNG market possibilities, we resort only to the class of the so-called sealed-bid auctions in which each participant submits a bid within an allotted time. But we use two different awarding mechanisms: First Price (F) and Second Price or Vickrey (V).
Under both mechanisms, the winner is the participant that places the highest bid. However, the price to pay is different. Under F, the participant with the highest bid has to pay an awarded price that corresponds to one's own bid. The profit is then calculated as “awarded price–own bid”, profit that could be negative if the bid is higher than the value. The difference between real life and laboratory experiments is that the VALUE is calculated by the participant in real life auctions and is randomly assigned by a computer in experimental settings.
Under V, the awarded price to the participant with the highest bid is not one's own bid, but the second highest bid, somewhat lower. The chances to get a negative profit under V are lower than under F with the same bid, but are still feasible. The winner obtains in this case a “profit=value−second highest bid”. The profit for those that do not buy the good is 0 in any case (F or V).
So, what is the bid that should be placed as a function of the participant's value? What should the strategy to follow be in order to earn profits?
In this context, we will focus on understanding and defining the bidding strategies and functions that underlie players’ behaviour. This strategy is called the BIDDING FUNCTION which relates the bid placed to buy a certain good as a function of the perceived value of the good.
Auction theorists develop bidding functions for certain situations that are mathematically solvable with respect to the restrictions that are imposed on the game according to Nash equilibrium. Experimental economists calculate the bidding function by setting lab experiments and test the theory and analyse the difference in behaviour between the bids of the participants or players and what the theory predicts.
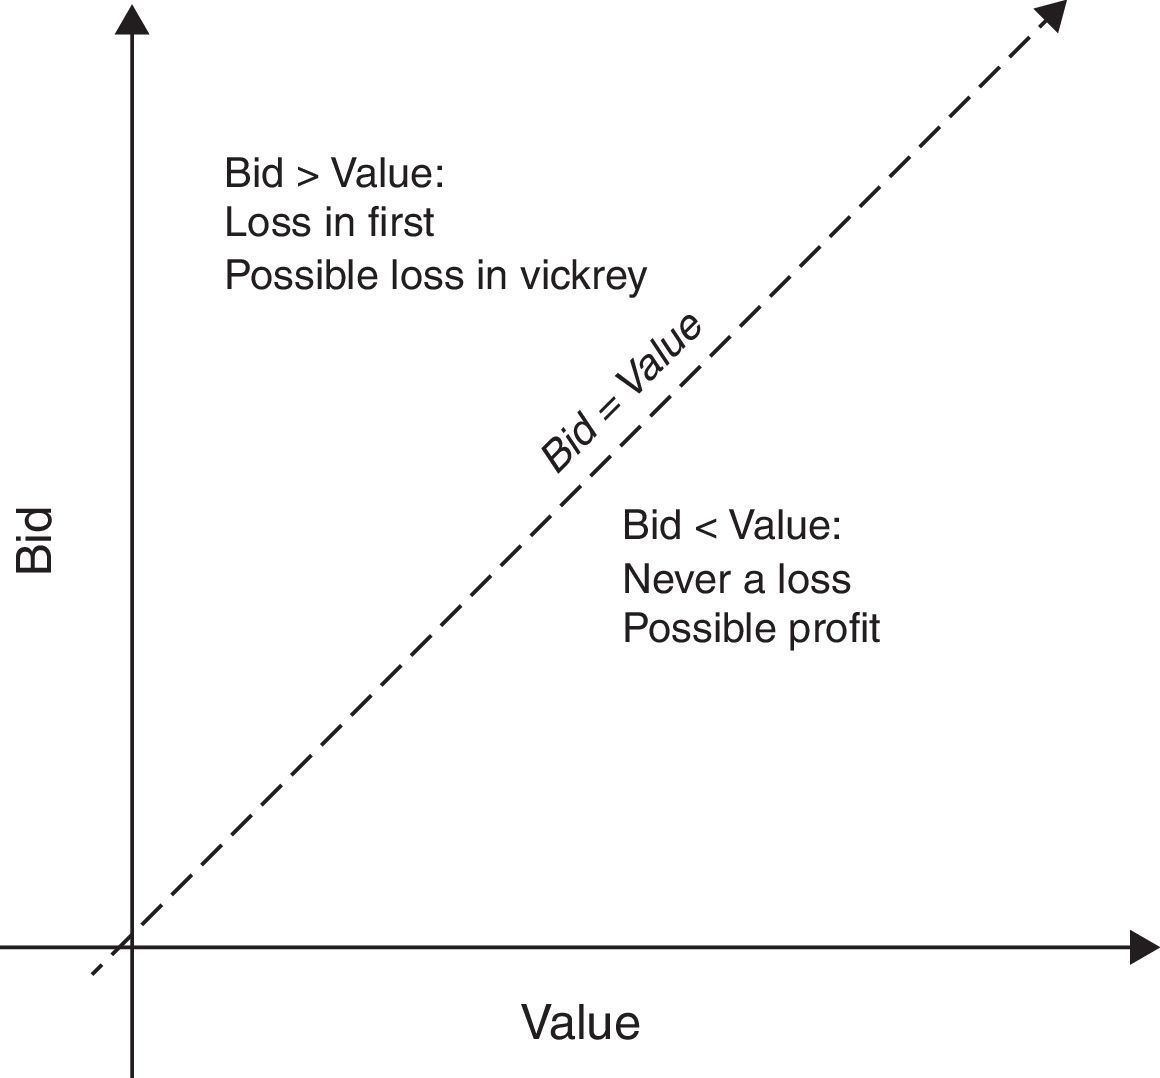
The bidding function is increasing and varies as a function of the game that is being played. The bidding function corresponding to bids that are exactly equal to the value is depicted in Fig. 1. This is a clear threshold in bidding since the individual results could be negative if the bid is higher than the value but always positive if the bid is lower than the value.

The bidding strategy differs among players and varies as a function of the type of good or the sector (LNG and capacity in this case), the number of players involved, the information they receive before and during the execution of the auction and the type of auction that is carried out. Many experiments have been set to test strategies under different auction formats (see Kagel and Levin, 2011, for their last complete survey) but none have been found that address the differences among students and professional in a very specific real market in which knowledge of the environment is crucial.
3Experimental designTo proceed with the laboratory experiment, an auction simulator has been particularised to study capacity auctions in general and in the energy market in particular. Out of the available options, we have selected econport due to its wide use and its functional interface (Hsinchun et al., 2003; Cox and Swarthout, 2005), as well as its enormous parameterisation potential that favours its particularisation to capacity auctions. Econport was designed by the Experimental Economics Centre of Georgia State University as a computer-assisted teaching and research tool in economics. It incorporates one module that allows for simulating auctions. In particular, it includes one routine that resembles one market in which one seller offers several goods to different bidders. It is also the easiest one to interact with by the professor whenever in the classroom, that is, it is the most teaching oriented simulator but it is also well suited for experimental research.
A first simulation environment was set in order to show Enagás’ employees how a capacity market could be designed and run. Several games were developed in order to teach market concepts like monopoly, collusion, perfect information, efficiency and entry barriers, according to different types of auctions. A first teaching course was carried out with professionals during April 2012 with success. However, there appeared the need to develop more-realistic case studies that further mimic the offloading of LNG. Also, a new fact arose: the necessity to avoid the winner's course, the adverse selection effect inherent in winning the auction (Capen et al., 1971). To avoid buyer's curse (Kagel and Levin, 1986), we decided afterwards to give a prize to the overall winner of the session, preferring this reward to money since professionals are involved (Kagel and Levin, 2011). A second session with professionals in May was very smooth and it was the one that has been used as a test-bench ever since, and shown in later sections of this article.
The experimental setting of the LNG capacity auction was then ready for trials with students and professionals. Each session of the experiment lasts about 3h, with the following programme:
- •
Theoretical explanation of the auction types.
- •
Access to the web simulator by the participants.
- •
Round 0: One experiment with 4 periods, so that the participants get acquainted with the simulator. The experiment is repeated for each of the auction types in order to know the characteristics and properties of both auction types. The values are sampled from a distribution of values (V dist) that follows a Uniform distribution that ranges between 0 and 20 experimental monetary units, U(0,20).
- •
Round 1: One experiment with 6 periods, repeated for each auction type. The values are sampled from a distribution of values (V dist) that follows a Uniform distribution that ranges between 5 and 15, U(5,15).
- •
Round 2: One experiment with 20 periods, repeated for each auction type. The values are sampled from a distribution of values (V dist) that follows a Uniform distribution that ranges between 0 and 20, U(0,20).
The overall winner is the participant with the highest profit after adding the profits of the Round 2 over the two auction types (F, V).
One initial session was held with 20 business professionals on June 26th, 2012, 9 males and 11 females. Two identical sessions were then carried out with students:
- •
On November 16th, 2012, with 24 undergraduates students in Economics, 17 male and 7 female.
- •
On November 30th, 2012, with 26 undergraduates students in Business Administration, 9 male and 17 female.
A second session with professionals took place on May 22nd, 2013, with 6 males and 7 females.
Our overall sample size of 83 participants is comparable to that of other experiments with asymmetric information: 52 (Brocas et al., 2015), 78 (Brocas et al., 2014) or 78 (Brocas et al., 2012). We feel therefore that our current analysis has sufficient power and it is sufficiently close to standard practices in experimental economics to be confident that the sample size is large enough for meaningful conclusions in the paradigm we are focusing on.
4Experimental resultsThree factors are studied under this experimental design:
- •
Status of the participants, either professionals (PRO) or students (STU).
- •
Gender of the participants, either women (WOM) or men (MEN).
- •
Type of auction, either First (FIR) or Vickrey (VIC).
The analysis is performed for each of the individual three factors using the results of Round 2, that of the prize for the winner. Some results are all shown for the four treatment groups, namely, WP (Women Professionals), MP (Men Professionals), WS (Women Students) and MS (Male Students), across auction types. In some cases, the analysis will be particularised for the three-way interaction of status–gender–type.
4.1ProfitsThe winner of any auction is the participant that submits the highest bid. Its profits are calculated as the difference between the random VALUE assigned to the participant minus the awarded PRICE, which will be winner's own bid (the highest bid) in the case of the FIRST price auctions, and the second highest bid in the case of VICKREY auctions.
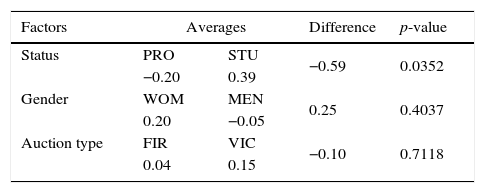
Table 1 includes the average profit that corresponds to the winning bids for each of the three factors that are being studied. It also includes a difference of means test to assess for significance. The highest difference is found between professionals and students, with students obtaining significantly more profit on average. Professionals show even negative average profits, indicating bidding above value. No differences are found across auction types or in gender, although men's average profit is negative.
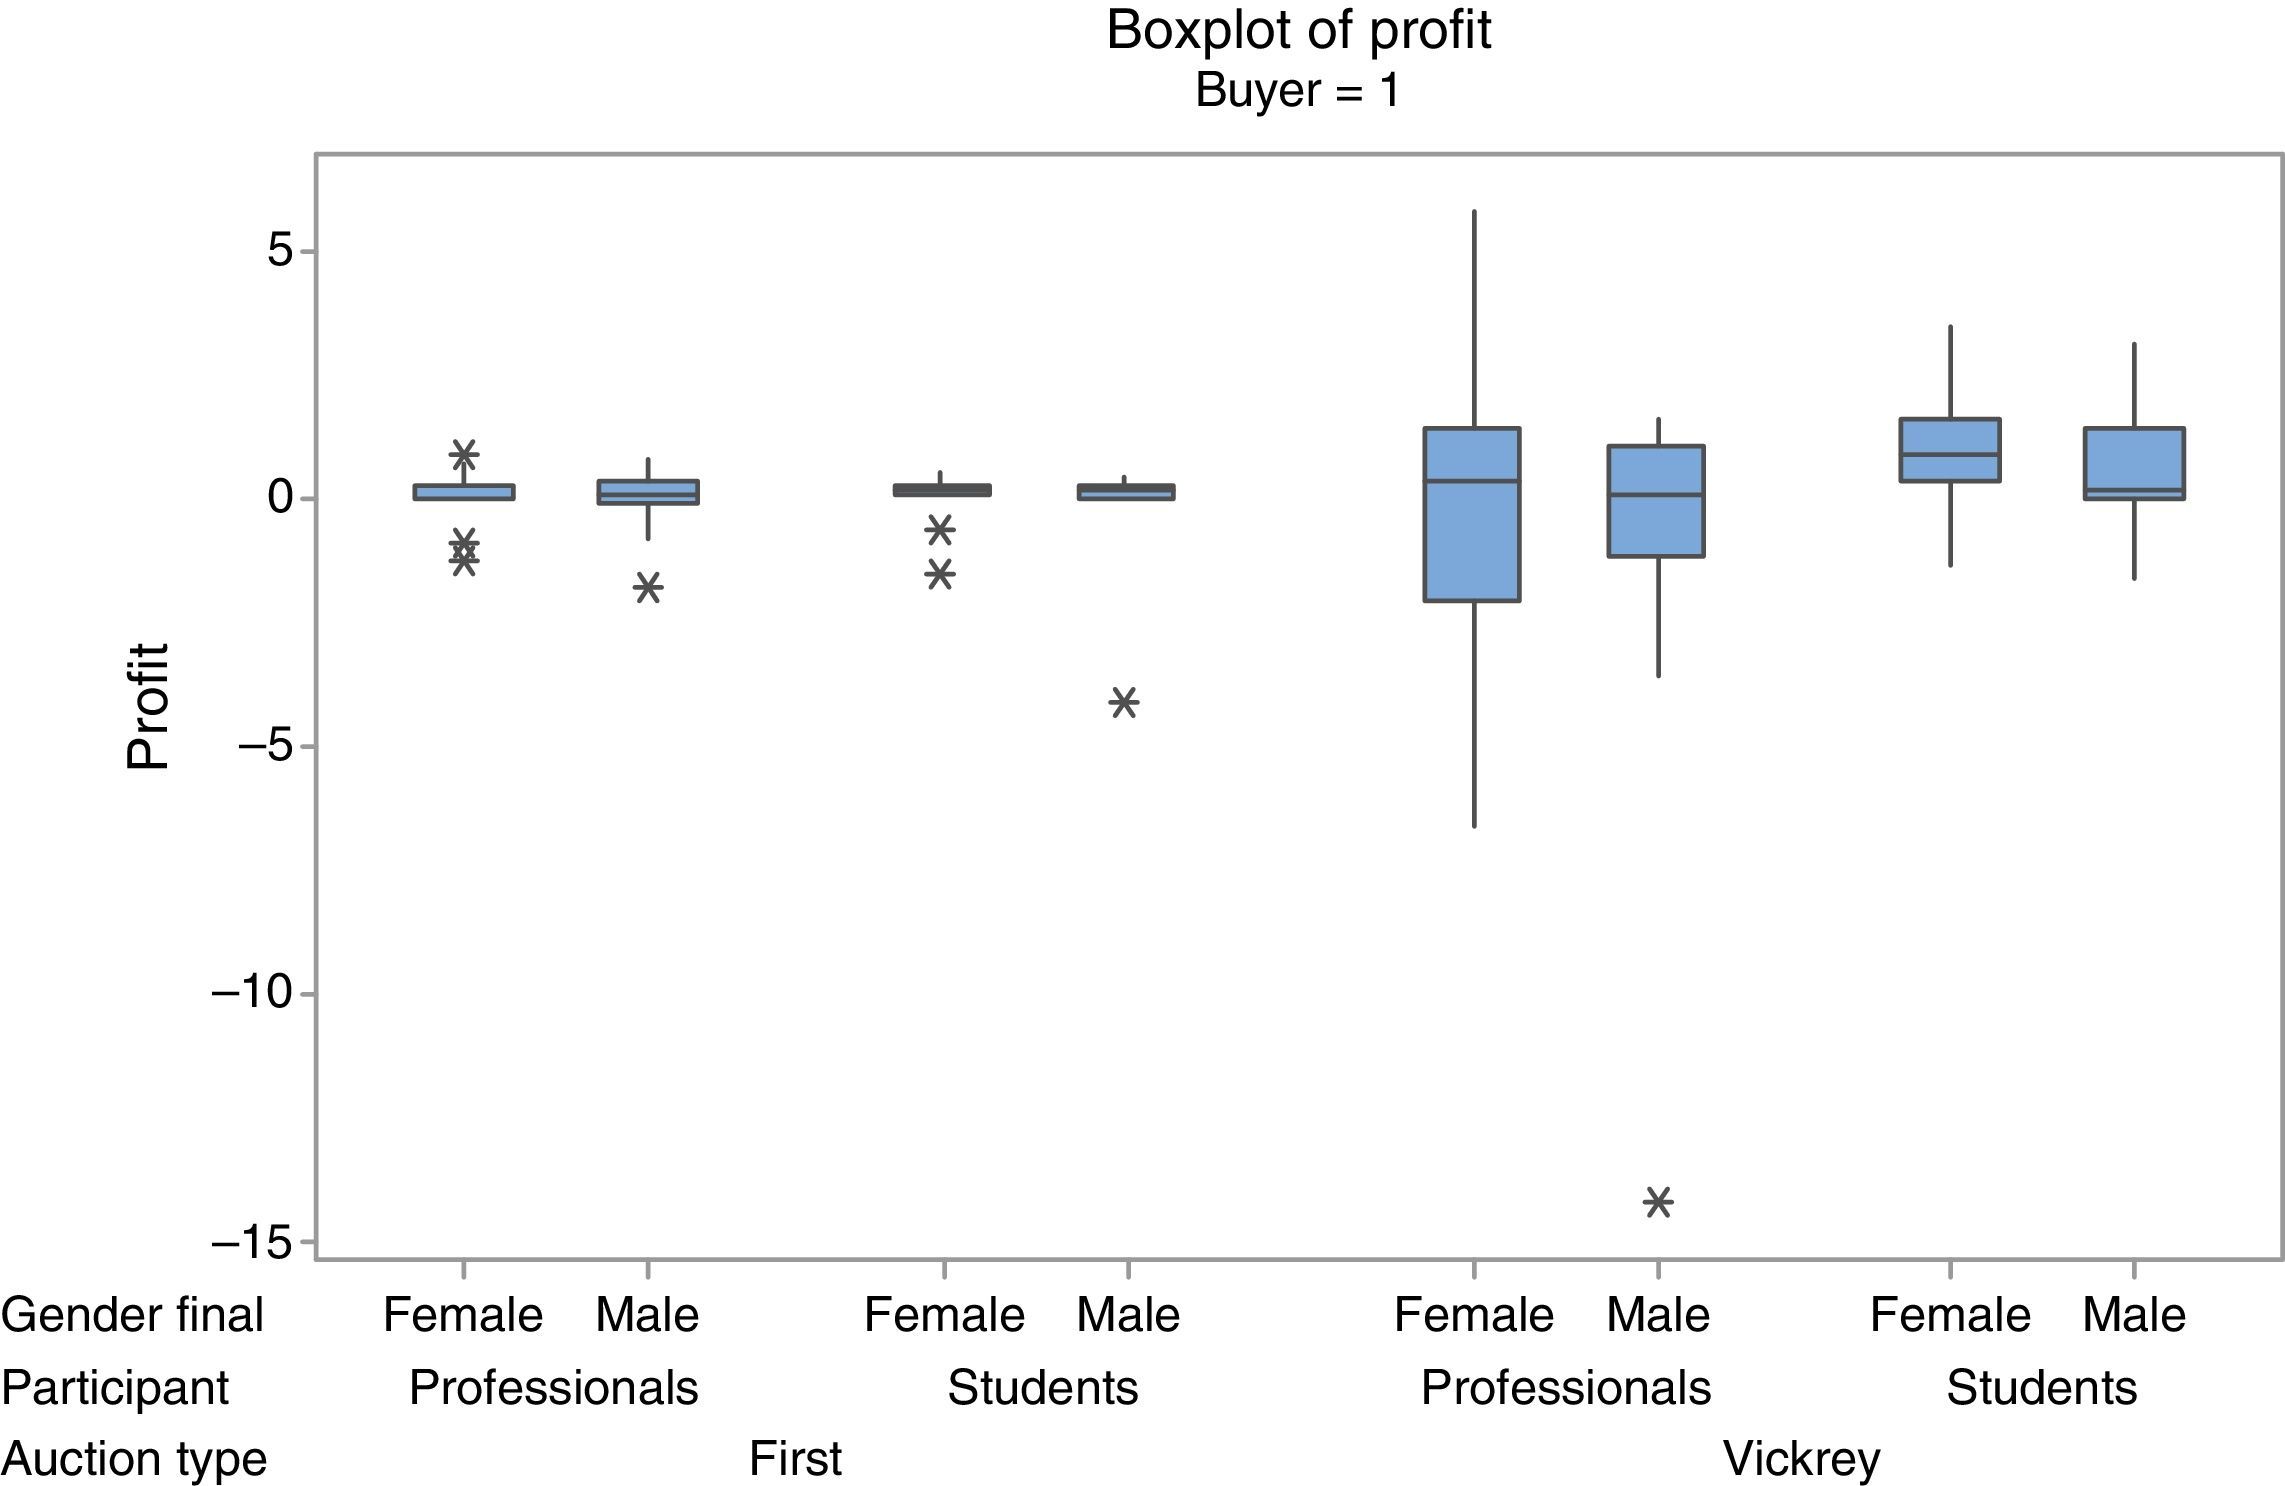
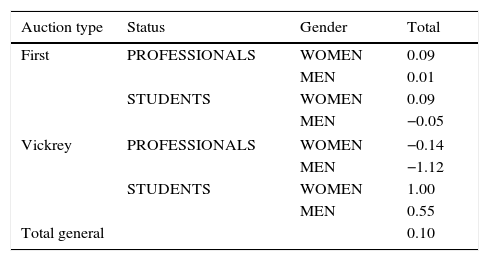
Table 2 depicts the results for each of the 4 groups of participants separated by auction type. Students clearly outperform professionals in VICKREY auctions but not in FIRST. WOMEN get higher profits across all combinations.
Interestingly enough, the variability of profits is much higher in VICKREY than in FIRST and in PROFESSIONALS over STUDENTS (Fig. 2).
4.2Efficiency
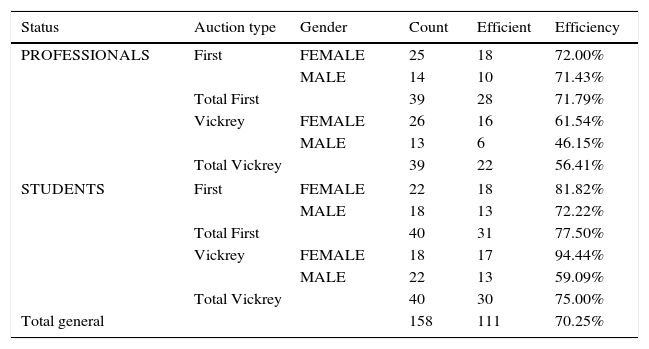
Auction goods should be awarded to the participant that values the good the most. As such, the efficiency is measured as the proportion of times that the good is awarded to the participant with the highest value. Table 3 includes the results, showing in column “Count” the count of goods that have been auctioned, in column “Efficient” the count of goods that have been awarded to the participant with the highest value, and therefore, in column “Efficiency”, the ratio of “Efficient” over “Count”.
Efficiency across combination of values of the factors.
| Status | Auction type | Gender | Count | Efficient | Efficiency |
|---|---|---|---|---|---|
| PROFESSIONALS | First | FEMALE | 25 | 18 | 72.00% |
| MALE | 14 | 10 | 71.43% | ||
| Total First | 39 | 28 | 71.79% | ||
| Vickrey | FEMALE | 26 | 16 | 61.54% | |
| MALE | 13 | 6 | 46.15% | ||
| Total Vickrey | 39 | 22 | 56.41% | ||
| STUDENTS | First | FEMALE | 22 | 18 | 81.82% |
| MALE | 18 | 13 | 72.22% | ||
| Total First | 40 | 31 | 77.50% | ||
| Vickrey | FEMALE | 18 | 17 | 94.44% | |
| MALE | 22 | 13 | 59.09% | ||
| Total Vickrey | 40 | 30 | 75.00% | ||
| Total general | 158 | 111 | 70.25% | ||
The overall efficiency is 70%, as 111 of the auctions were efficient whereas 47 goods were assigned to a participant with not-the-maximum drawn value. The efficiency is higher for STUDENTS for both types of auctions (77% and 75% for STUDENTS and 72% and 56% for PROFESSIONALS, for FIRST and VICKREY, respectively). In terms of gender, WOMEN participants defend their high valuations consistently more often than MEN do, for every combination of auction type and participant status.
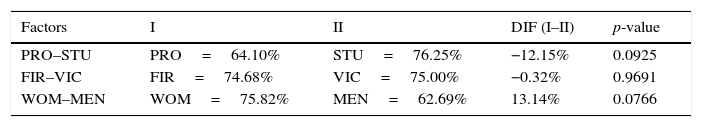
If the three factors (STATUS–TYPE–GENDER) are independently studied (Table 4, where I corresponds to left and II to the right value of each factor stated in the subtraction), there are significant differences found, with higher efficiencies of STUDENTS over PROFESSIONALS and also of WOMEN over MEN.
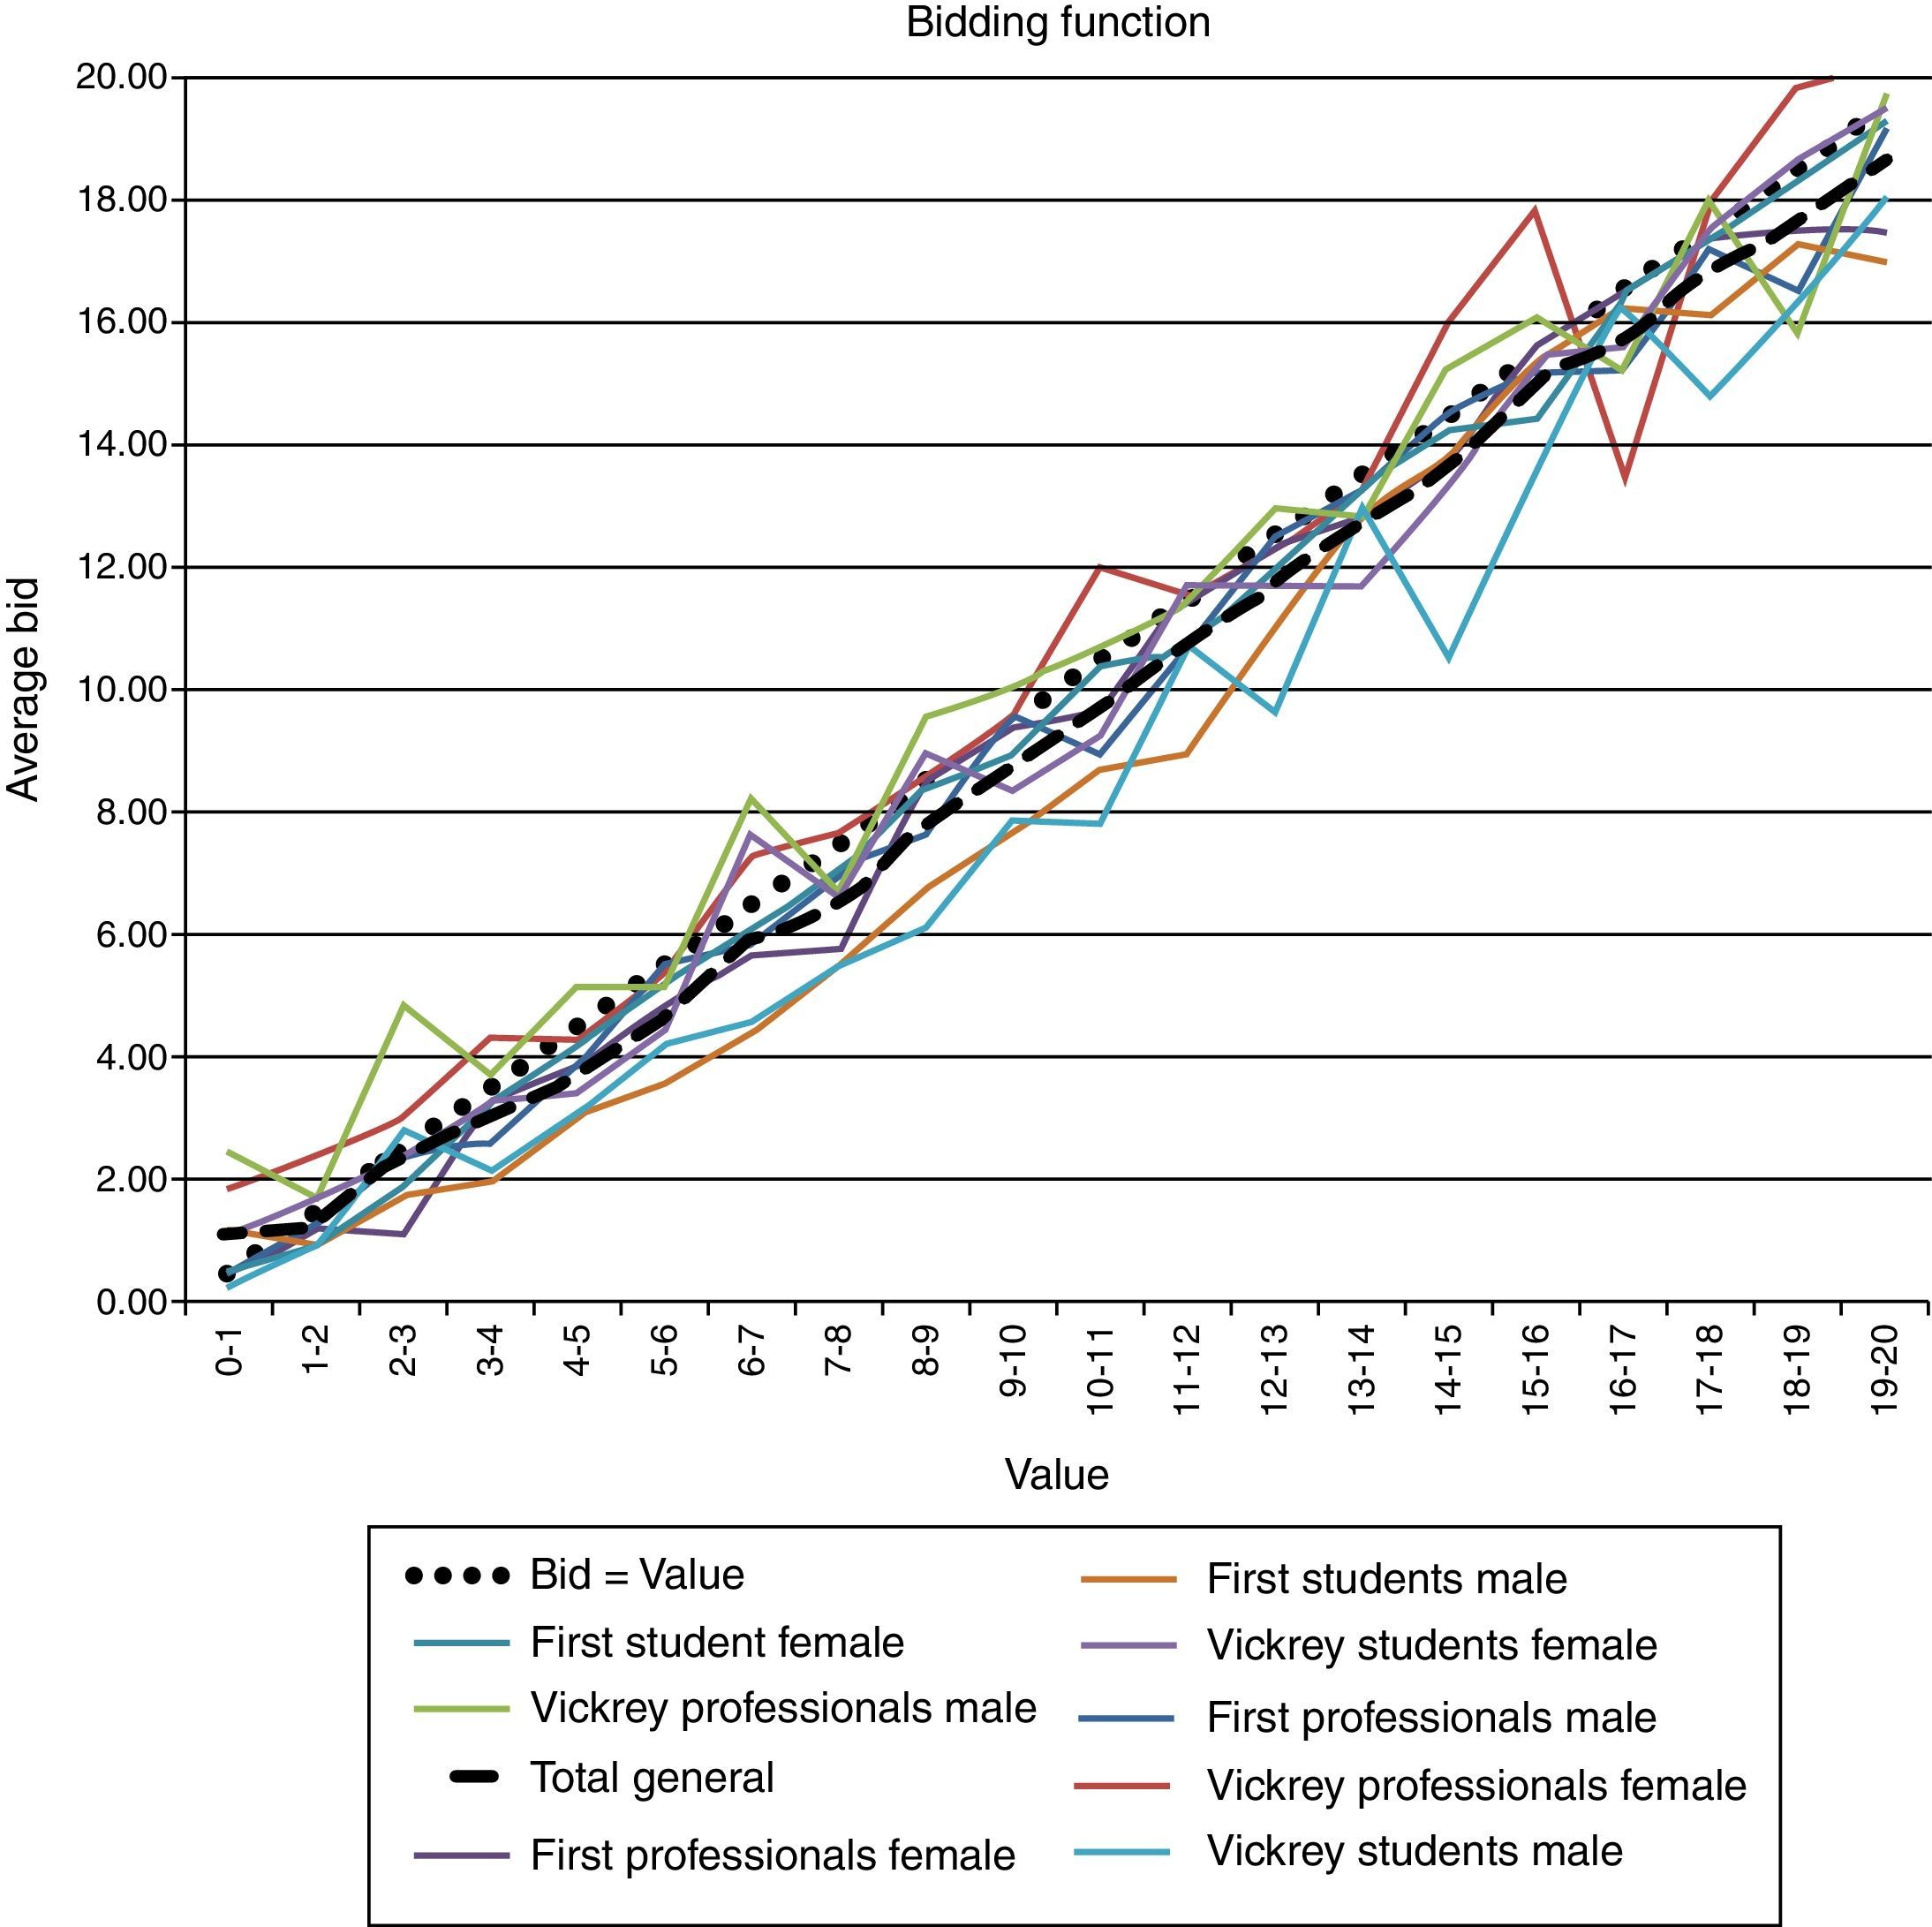
4.3Bidding functionsBoth the aggregate results of profits and efficiency have to be explained in terms of the participants’ bidding strategies, that is, the bidding behaviour as a function of the value. If bids are higher, the number of goods awarded is higher but the profit might be lower if the bid is too high. Bids above the value may even result in negative profits.
The experimental bidding functions are shown in Fig. 3. The graph includes the drawn VALUES in the x-axis, grouped in bins of 1. In other words, values have been truncated to the integer (0.7 is truncated to 0 and placed in bin 0–1, …). The average BID for the corresponding bin is represented in the y-axis. Eight bidding functions are shown, each one corresponding to a feasible combination of type–status–gender. The overall function is also shown with a dashed line. The function that corresponds to “bids equal to the value” is included with a dotted line for comparative purposes.

It is clear that the average experimental behaviour is close but under the “bid=value” threshold, with no clear cut differences in the distribution of the group behaviours.1 Even then, it looks like female students tend to adjust the bids to their values, obtaining the goods that they are supposed to at a price that is lower than the value, and therefore, obtaining a profit. Aggressive bidding above value, especially in VICKREY, may result in losses, especially for MEN and PROFESSIONALS.
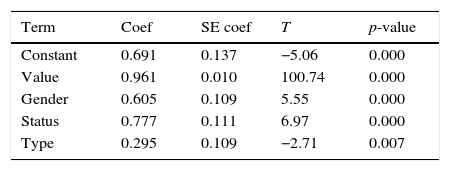
The experimental behaviour of the participants is further analysed via the aggregate or structural bidding functions, using OLS estimation. Eq. (1) and Table 5 include the regression results for the general behaviour. All the coefficients are significantly different than 0 (Table 5), with r2=75%.
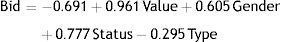
The bids are higher with the VALUE, for WOMEN (quantitatively coded as Gender=1) rather than MEN (Gender=0), for PROFESSIONALS (coded as Status=1) rather than STUDENTS (Status=0) and for VICKREY (coded as Type=0) rather than FIRST (Type=1).
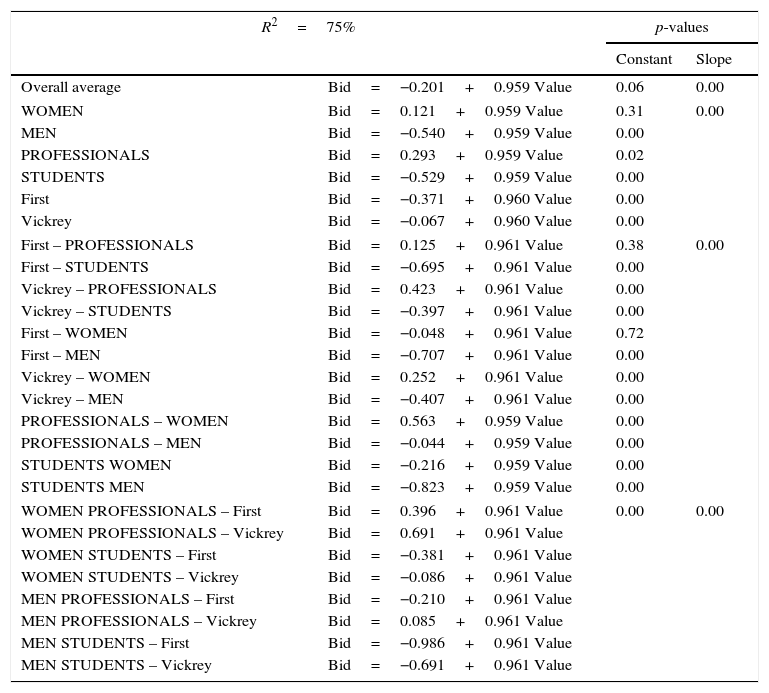
If all the categorical factors are considered as qualitative, the analysis might be pursued further so as to perceive difference in the behaviour of the different groups of participants. Table 6 includes all the calculated bidding functions as a function of value (BID=CONSTANT+SLOPE*VALUE), as well as the p-values corresponding to testing that the constant and the slope are equal to 0.
Categorical OLS regression.
| R2=75% | p-values | ||
|---|---|---|---|
| Constant | Slope | ||
| Overall average | Bid=−0.201+0.959 Value | 0.06 | 0.00 |
| WOMEN | Bid=0.121+0.959 Value | 0.31 | 0.00 |
| MEN | Bid=−0.540+0.959 Value | 0.00 | |
| PROFESSIONALS | Bid=0.293+0.959 Value | 0.02 | |
| STUDENTS | Bid=−0.529+0.959 Value | 0.00 | |
| First | Bid=−0.371+0.960 Value | 0.00 | |
| Vickrey | Bid=−0.067+0.960 Value | 0.00 | |
| First – PROFESSIONALS | Bid=0.125+0.961 Value | 0.38 | 0.00 |
| First – STUDENTS | Bid=−0.695+0.961 Value | 0.00 | |
| Vickrey – PROFESSIONALS | Bid=0.423+0.961 Value | 0.00 | |
| Vickrey – STUDENTS | Bid=−0.397+0.961 Value | 0.00 | |
| First – WOMEN | Bid=−0.048+0.961 Value | 0.72 | |
| First – MEN | Bid=−0.707+0.961 Value | 0.00 | |
| Vickrey – WOMEN | Bid=0.252+0.961 Value | 0.00 | |
| Vickrey – MEN | Bid=−0.407+0.961 Value | 0.00 | |
| PROFESSIONALS – WOMEN | Bid=0.563+0.959 Value | 0.00 | |
| PROFESSIONALS – MEN | Bid=−0.044+0.959 Value | 0.00 | |
| STUDENTS WOMEN | Bid=−0.216+0.959 Value | 0.00 | |
| STUDENTS MEN | Bid=−0.823+0.959 Value | 0.00 | |
| WOMEN PROFESSIONALS – First | Bid=0.396+0.961 Value | 0.00 | 0.00 |
| WOMEN PROFESSIONALS – Vickrey | Bid=0.691+0.961 Value | ||
| WOMEN STUDENTS – First | Bid=−0.381+0.961 Value | ||
| WOMEN STUDENTS – Vickrey | Bid=−0.086+0.961 Value | ||
| MEN PROFESSIONALS – First | Bid=−0.210+0.961 Value | ||
| MEN PROFESSIONALS – Vickrey | Bid=0.085+0.961 Value | ||
| MEN STUDENTS – First | Bid=−0.986+0.961 Value | ||
| MEN STUDENTS – Vickrey | Bid=−0.691+0.961 Value | ||
The BIDS are in all the cases somewhat lower than the VALUE (in fact, 0.96*VALUE), with the constant representing a small deviation that reflects the combination of status, gender and auction type.
Positive deviations, that is, higher bids, correspond to FEMALE (0.121) and PROFESSIONALS (0.293). FEMALE PROFESSIONALS bid higher (0.563) both for First (0.396) and for Vickrey (0.691). Also PROFESSIONALS show positive deviations under VICKREY (0.423).
Negative deviations, on the other hand, is a characteristic of MEN (−0.540), STUDENTS (−0.529), FIRST (−0.371) and VICKREY (−0.067). All the two-way and three-way interactions with STUDENTS are negative, with a maximum for MALE-STUDENTS-First (−0.986).
4.4Bidding profilesLet us further discuss the difference in bidding strategies within the three factors that have been analysed in this article. Each finding is based on the results depicted in the previous section and explained in terms of the available literature.
4.4.1Finding 1: Professionals bid higher than studentsFrom Fig. 2, both of them, professionals and students show a similar bidding pattern (Dyer et al., 1989; Depositario et al., 2009), mainly in the intermediate values of the distribution, whereas some disturbances are exhibited in both tails (high and low VALUES). At the bottom of the range, there seems to be an overbidding effect and the reverse occurs at the higher values of the interval of values.
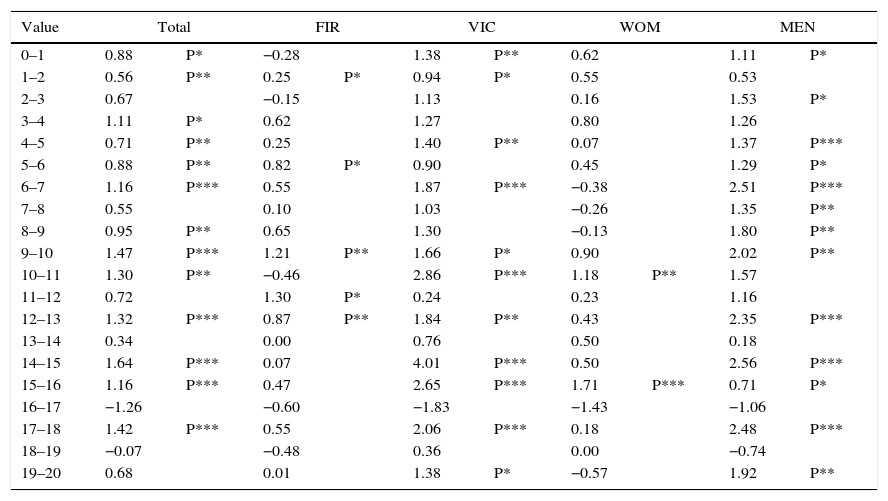
A more detailed statistical analysis is carried out in Table 7. For each bin of values, the table entries show the average difference in bids for the two STATUS categories (PROFESSIONAL–STUDENTS), as a TOTAL or just for a combination of one or two of the other categories. If the average difference value is statistically different than 0, the significance is indicated with asterisks (* for 0.10, ** for 0.05 and *** for 0.01) and a letter indicating the factor setting that is larger is included (P for PROFESSIONALS and S for STUDENTS). The bins of values are grouped in four groups of 5 to differentiate low values (0–5), low-intermediate values (5–10), high-intermediate values (10–15) and high values (15–20). Bidders with a VALUE in this last group should place the largest bid and be awarded with the good being auctioned. Values under 10 provide a very low probability of winning.
Difference in average bid: Professional vs Student (P–S). Significant at 0.10, *; at 0.05, **; at 0.01, ***.
| Value | Total | FIR | VIC | WOM | MEN | |||||
|---|---|---|---|---|---|---|---|---|---|---|
| 0–1 | 0.88 | P* | −0.28 | 1.38 | P** | 0.62 | 1.11 | P* | ||
| 1–2 | 0.56 | P** | 0.25 | P* | 0.94 | P* | 0.55 | 0.53 | ||
| 2–3 | 0.67 | −0.15 | 1.13 | 0.16 | 1.53 | P* | ||||
| 3–4 | 1.11 | P* | 0.62 | 1.27 | 0.80 | 1.26 | ||||
| 4–5 | 0.71 | P** | 0.25 | 1.40 | P** | 0.07 | 1.37 | P*** | ||
| 5–6 | 0.88 | P** | 0.82 | P* | 0.90 | 0.45 | 1.29 | P* | ||
| 6–7 | 1.16 | P*** | 0.55 | 1.87 | P*** | −0.38 | 2.51 | P*** | ||
| 7–8 | 0.55 | 0.10 | 1.03 | −0.26 | 1.35 | P** | ||||
| 8–9 | 0.95 | P** | 0.65 | 1.30 | −0.13 | 1.80 | P** | |||
| 9–10 | 1.47 | P*** | 1.21 | P** | 1.66 | P* | 0.90 | 2.02 | P** | |
| 10–11 | 1.30 | P** | −0.46 | 2.86 | P*** | 1.18 | P** | 1.57 | ||
| 11–12 | 0.72 | 1.30 | P* | 0.24 | 0.23 | 1.16 | ||||
| 12–13 | 1.32 | P*** | 0.87 | P** | 1.84 | P** | 0.43 | 2.35 | P*** | |
| 13–14 | 0.34 | 0.00 | 0.76 | 0.50 | 0.18 | |||||
| 14–15 | 1.64 | P*** | 0.07 | 4.01 | P*** | 0.50 | 2.56 | P*** | ||
| 15–16 | 1.16 | P*** | 0.47 | 2.65 | P*** | 1.71 | P*** | 0.71 | P* | |
| 16–17 | −1.26 | −0.60 | −1.83 | −1.43 | −1.06 | |||||
| 17–18 | 1.42 | P*** | 0.55 | 2.06 | P*** | 0.18 | 2.48 | P*** | ||
| 18–19 | −0.07 | −0.48 | 0.36 | 0.00 | −0.74 | |||||
| 19–20 | 0.68 | 0.01 | 1.38 | P* | −0.57 | 1.92 | P** | |||
| Value | FIR_WOM | FIR_MEN | VIC_WOM | VIC_MEN | ||||
|---|---|---|---|---|---|---|---|---|
| 0–1 | 0.21 | P* | −0.72 | 0.76 | 1.92 | P** | ||
| 1–2 | 0.18 | 0.32 | P* | 0.73 | 0.86 | |||
| 2–3 | −0.70 | S** | 0.65 | 0.66 | 2.00 | |||
| 3–4 | 0.06 | 0.65 | 1.09 | 1.57 | ||||
| 4–5 | −0.37 | 0.84 | 0.84 | 2.11 | P** | |||
| 5–6 | −0.40 | 1.96 | P*** | 0.92 | 0.88 | |||
| 6–7 | −0.40 | 1.47 | P** | −0.33 | 3.63 | P*** | ||
| 7–8 | −1.26 | S** | 1.56 | P** | 1.04 | 1.18 | ||
| 8–9 | 0.11 | 0.91 | −0.41 | 3.42 | P** | |||
| 9–10 | 0.43 | 1.94 | P** | 1.24 | 2.17 | |||
| 10–11 | −0.73 | 0.27 | 2.73 | P*** | 2.86 | P** | ||
| 11–12 | 0.77 | 1.65 | −0.16 | 0.68 | ||||
| 12–13 | 0.36 | 1.44 | P* | 0.52 | 3.34 | P*** | ||
| 13–14 | −0.44 | 0.38 | 1.54 | −0.17 | ||||
| 14–15 | −0.49 | 0.75 | 2.74 | P* | 4.76 | P*** | ||
| 15–16 | 1.18 | P** | −0.20 | S* | 2.46 | P** | 2.38 | P** |
| 16–17 | 0.09 | −1.01 | −2.13 | −1.08 | ||||
| 17–18 | 0.00 | 1.09 | 0.44 | 3.23 | P*** | |||
| 18–19 | −0.80 | −0.73 | 1.23 | P** | −0.44 | |||
| 19–20 | −1.85 | 2.18 | P* | 0.72 | 1.68 | |||
Only cells with a significantly larger bid for professionals (P) are found, except for a single S (larger students’ bid) for the combination of FIR_WOM and values between 7 and 8. The count of significant P's is larger in the column TOTAL, VICKREY and MEN, indicating that these PROFESSIONAL groups bid higher than their STUDENTS counterparts, even above value. The average difference is as high as 3.23 for values around 18 and bids of MEN participating in VICKREY auctions.
These results show that experience is not a guarantee of success in auction laboratory settings (Burns, 1985; Dyer et al., 1989; or Garrat et al., 2012). Professionals tend to overbid in simulation environments due to the use of a deductive reasoning with short-cuts and the employment of mental models in the context of the framework of the simulation (Johnson-Laird, 1999), without considering institutional factors which protect them from aggressive bids in reality. In addition, Vickrey auctions provokes a tendency to bidding in excess to the value because this fact improves the probability of winning but just the second high bid price must be paid (Kagel et al., 1987).
On the other side, students adjust a bit worse to the signals received from the auctions but they are not affected by overbidding. In that case, the promise to receive a reward by the person with bigger profit eludes buyer's curse which constitutes an advantage to replicate the real world where negative profits should be avoided. In fact, in some types of experimental first price auctions, average bidding is below the risk neutral Nash equilibrium (Neugebauer and Perote, 2008).
These results appear to be in consonance with Filiz and Ozbay (2007) which indicate the existence of two types of regret. “Loser's regret” if a loser bidder could have won with a higher bid which generates overbidding and the “winner's regret” if a winning bidder could have won with less money obtaining a greater profit. This last regret will generate underbidding.
Therefore, it seems that the results of the auction behaviour of the professionals are affected more by a psychological conduct than by a mistake in the simulation game.
4.4.2Finding 2: Average bids are similar across auction types regardless of the status; variability is higher in Vickrey auctionsTable 8 shows the average difference for FIRST (F) and VICKREY (V) auctions. There is not a clear-cut decision on which type produces higher bids. The F's and V's are scattered throughout the table. Bids for VICKREY are higher for lower values, but that is not the case for high values. It is striking to see higher bids under the FIRST mechanism for certain values over 15 for different combinations of type–status–gender.
Difference in average bid: First vs Vickrey (F–V). Significant at 0.10, *; at 0.05, **; at 0.01, ***.
| Value | Total | PRO | STU | WOM | MEN | |||||
|---|---|---|---|---|---|---|---|---|---|---|
| 0–1 | −0.70 | V* | −1.67 | V*** | −0.01 | −1.06 | V** | −0.35 | ||
| 1–2 | −0.47 | V* | −0.90 | V** | −0.21 | −0.92 | V** | −0.06 | ||
| 2–3 | −1.30 | V*** | −2.05 | V*** | −0.77 | V* | −1.09 | V*** | −1.62 | V** |
| 3–4 | −0.83 | V* | −1.14 | −0.48 | −0.43 | −0.70 | ||||
| 4–5 | −0.10 | −0.78 | V** | 0.37 | 0.19 | −0.44 | ||||
| 5–6 | −0.17 | −0.20 | −0.11 | 0.23 | −0.55 | |||||
| 6–7 | −1.13 | V** | −1.96 | V*** | −0.64 | −1.58 | V*** | −0.84 | ||
| 7–8 | −0.26 | −0.77 | 0.16 | −0.53 | −0.03 | |||||
| 8–9 | −0.33 | −0.71 | −0.06 | −0.33 | 0.02 | |||||
| 9–10 | −0.02 | −0.27 | 0.18 | 0.11 | −0.08 | |||||
| 10–11 | −0.18 | −2.17 | V*** | 1.15 | −0.29 | −0.03 | ||||
| 11–12 | −1.04 | V** | −0.41 | −1.48 | V** | −0.61 | −1.41 | V* | ||
| 12–13 | 0.39 | −0.15 | 0.82 | 0.20 | 0.61 | |||||
| 13–14 | 0.43 | −0.05 | 0.70 | 0.74 | 0.06 | |||||
| 14–15 | 1.20 | −1.45 | V** | 2.49 | F** | −0.19 | 2.12 | F** | ||
| 15–16 | −0.23 | −1.62 | V** | 0.56 | −1.66 | V** | 0.86 | |||
| 16–17 | 0.72 | 1.54 | 0.31 | 1.75 | F* | −0.28 | ||||
| 17–18 | 0.21 | −0.69 | V*** | 0.82 | −0.38 | V** | 0.43 | |||
| 18–19 | −0.16 | −0.68 | 0.16 | −1.18 | V** | 1.04 | ||||
| 19–20 | −0.96 | −1.77 | V** | −0.40 | −1.24 | V** | −0.83 | |||
| Value | PRO_WOM | PRO_MEN | STU_WOM | STU_MEN | ||||
|---|---|---|---|---|---|---|---|---|
| 0–1 | −1.38 | V*** | −1.90 | V** | −0.82 | 0.74 | F*** | |
| 1–2 | −1.19 | V* | −0.50 | −0.63 | V** | 0.05 | ||
| 2–3 | −1.88 | V** | −2.42 | V** | −0.52 | −1.07 | ||
| 3–4 | −1.04 | V** | −1.09 | V* | −0.01 | −0.17 | ||
| 4–5 | −0.44 | −1.33 | 0.78 | F** | −0.06 | |||
| 5–6 | −0.52 | 0.42 | 0.79 | −0.66 | ||||
| 6–7 | −1.61 | −2.36 | V*** | −1.54 | V*** | −0.19 | ||
| 7–8 | −1.88 | V** | 0.37 | 0.41 | −0.01 | |||
| 8–9 | −0.06 | −1.91 | V* | −0.59 | 0.61 | |||
| 9–10 | −0.24 | −0.46 | 0.57 | −0.23 | ||||
| 10–11 | −2.32 | V*** | −1.73 | 1.13 | F** | 0.86 | ||
| 11–12 | −0.09 | −0.80 | V*** | −1.02 | −1.76 | |||
| 12–13 | 0.12 | −0.54 | 0.28 | 1.36 | F** | |||
| 13–14 | −0.46 | 0.40 | 1.52 | −0.15 | ||||
| 14–15 | −2.22 | V* | −0.63 | V** | 1.00 | F* | 3.37 | F*** |
| 15–16 | −2.27 | −0.90 | −0.99 | 1.69 | F*** | |||
| 16–17 | 2.99 | F*** | −0.01 | 0.77 | F*** | −0.08 | ||
| 17–18 | −0.63 | −0.80 | −0.20 | 1.34 | ||||
| 18–19 | −2.34 | 0.76 | F*** | −0.30 | V* | 1.05 | ||
| 19–20 | −2.77 | V*** | −0.55 | −0.21 | −1.05 | V** | ||
Theory predicts that V should be higher than F throughout since the awarded price will be that of the second highest bid. It has been shown that under certain conditions (Maskin and Riley, 1984) first price auctions lead to higher final prices (lower bids) than Vickrey auctions in presence of risk aversion as risk averse bidders bid more aggressively to increase his/her probability of winning in Vickrey auctions. Also the presence of winner's curse (Wilson, 1969; Capen et al., 1971) imply the failure of the winner bidder to recognise the true signals and pay more than the prize is worth.
Systematic overbidding could also be considered as a failure in the game to represent reality, although it is usually the case that the participants present bounded rationality and do not comprehend completely the difference between the two types of auctions (Kagel and Levin, 2011).
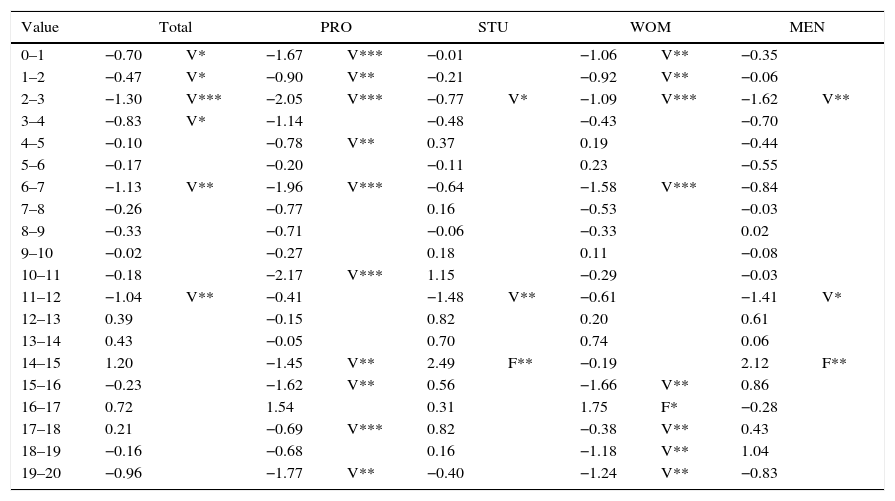
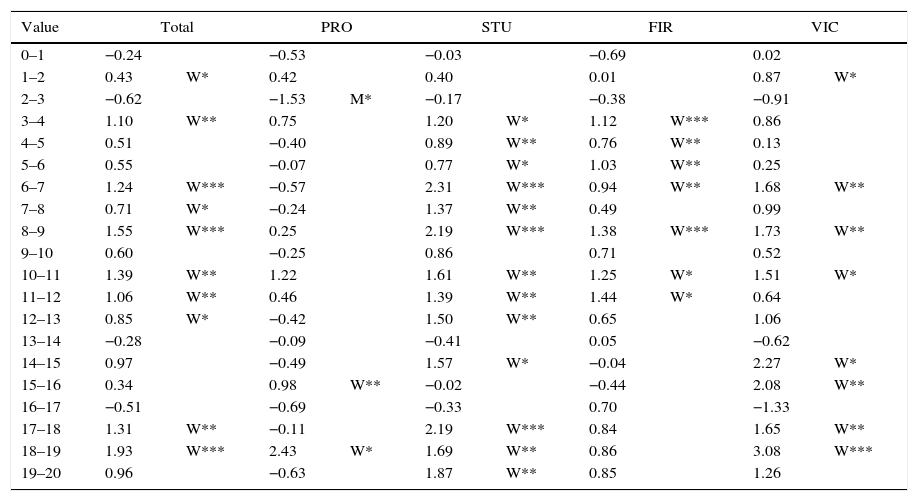
4.4.3Finding 3: Women bid higher than menAn interesting note is the divergence between males and females in auction bids as shown in Fig. 2. Table 9 substantiates these differences between WOMEN and MEN (W–M) by showing many cells with a W, and just a few with an M, and for low values.
Difference in average bid: Women vs Men (W–M). Significant at 0.10, *; at 0.05, **; at 0.01, ***.
| Value | Total | PRO | STU | FIR | VIC | |||||
|---|---|---|---|---|---|---|---|---|---|---|
| 0–1 | −0.24 | −0.53 | −0.03 | −0.69 | 0.02 | |||||
| 1–2 | 0.43 | W* | 0.42 | 0.40 | 0.01 | 0.87 | W* | |||
| 2–3 | −0.62 | −1.53 | M* | −0.17 | −0.38 | −0.91 | ||||
| 3–4 | 1.10 | W** | 0.75 | 1.20 | W* | 1.12 | W*** | 0.86 | ||
| 4–5 | 0.51 | −0.40 | 0.89 | W** | 0.76 | W** | 0.13 | |||
| 5–6 | 0.55 | −0.07 | 0.77 | W* | 1.03 | W** | 0.25 | |||
| 6–7 | 1.24 | W*** | −0.57 | 2.31 | W*** | 0.94 | W** | 1.68 | W** | |
| 7–8 | 0.71 | W* | −0.24 | 1.37 | W** | 0.49 | 0.99 | |||
| 8–9 | 1.55 | W*** | 0.25 | 2.19 | W*** | 1.38 | W*** | 1.73 | W** | |
| 9–10 | 0.60 | −0.25 | 0.86 | 0.71 | 0.52 | |||||
| 10–11 | 1.39 | W** | 1.22 | 1.61 | W** | 1.25 | W* | 1.51 | W* | |
| 11–12 | 1.06 | W** | 0.46 | 1.39 | W** | 1.44 | W* | 0.64 | ||
| 12–13 | 0.85 | W* | −0.42 | 1.50 | W** | 0.65 | 1.06 | |||
| 13–14 | −0.28 | −0.09 | −0.41 | 0.05 | −0.62 | |||||
| 14–15 | 0.97 | −0.49 | 1.57 | W* | −0.04 | 2.27 | W* | |||
| 15–16 | 0.34 | 0.98 | W** | −0.02 | −0.44 | 2.08 | W** | |||
| 16–17 | −0.51 | −0.69 | −0.33 | 0.70 | −1.33 | |||||
| 17–18 | 1.31 | W** | −0.11 | 2.19 | W*** | 0.84 | 1.65 | W** | ||
| 18–19 | 1.93 | W*** | 2.43 | W* | 1.69 | W** | 0.86 | 3.08 | W*** | |
| 19–20 | 0.96 | −0.63 | 1.87 | W** | 0.85 | 1.26 | ||||
| Value | FIR_PRO | FIR_STU | VIC_PRO | VIC_STU | ||||
|---|---|---|---|---|---|---|---|---|
| 0–1 | −0.06 | −0.99 | −0.58 | 0.58 | ||||
| 1–2 | −0.04 | 0.10 | 0.65 | 0.77 | ||||
| 2–3 | −1.26 | M*** | 0.09 | −1.80 | −0.46 | |||
| 3–4 | 0.68 | 1.26 | W*** | 0.63 | 1.10 | |||
| 4–5 | −0.03 | 1.18 | W*** | −0.92 | M* | 0.35 | ||
| 5–6 | −0.68 | 1.67 | W*** | 0.26 | 0.22 | |||
| 6–7 | −0.18 | 1.69 | W*** | −0.92 | 3.04 | W*** | ||
| 7–8 | −1.26 | M* | 1.56 | W*** | 1.00 | 1.14 | ||
| 8–9 | 0.86 | 1.65 | W*** | −0.99 | 2.84 | W*** | ||
| 9–10 | −0.20 | 1.31 | −0.42 | 0.51 | ||||
| 10–11 | 0.68 | 1.68 | 1.28 | 1.41 | ||||
| 11–12 | 0.83 | 1.71 | 0.12 | 0.96 | ||||
| 12–13 | −0.09 | 0.99 | −0.75 | 2.07 | W* | |||
| 13–14 | −0.44 | 0.39 | 0.42 | −1.28 | ||||
| 14–15 | −0.80 | 0.44 | 0.79 | 2.81 | W* | |||
| 15–16 | 0.46 | W*** | −0.93 | 1.83 | 1.75 | W* | ||
| 16–17 | 1.27 | 0.16 | −1.74 | −0.69 | ||||
| 17–18 | 0.14 | 1.23 | −0.02 | 2.77 | W** | |||
| 18–19 | 1.02 | 1.09 | 4.11 | W** | 2.44 | W** | ||
| 19–20 | −1.72 | 2.31 | W** | 0.50 | 1.46 | |||
MEN seem to underbid looking for a greater profit whereas WOMEN adjust their bids much more to their values. The differences are even more important for STUDENTS. For PROFESSIONALS, even if the bids are the same on average, the STUDENTS bids are higher for high values. The same happens for VICKREY auctions.
It is usually assumed that WOMEN tend to overbid with respect to MEN (Dechenaux et al., 2012) but it is not clear if that fact is due to their bigger risk aversion coefficient and lower competitiveness (Price and Sheremeta, 2012), their higher valuation for winning (Ong and Chen, 2013), or their speed to learning in new environments (Ham and Kagel, 2006). Also, biological effects have been indicated to explain this behaviour (Chen et al., 2013). In any case, what is for real is that WOMEN students bid closer to their value in all types of auctions (Table 9).
5ConclusionsThe starting point of this research is the learning process associated with the acquisition of a specific knowledge by current managerial employees of an energy company using laboratory experiments. The next step is the translation of this process at the University level to future managers in order to find out if this laboratory environment is appropriate for the transmission of theoretical and applied concepts. In addition, it is worthy to know if the acquired knowledge is also suitable to mimic those of real managers.
From an educational perspective, computer-assisted learning is based on classroom experiments in which the dynamics of the games are thoroughly explained and the interaction by the instructors is feasible. Auction simulators have been extensively used in teaching and research in computational and experimental economics (Kagel and Roth, 2011), showing that these simulators might be particularised ad hoc for the real situation. Auction games are played in the computer to facilitate the introduction of variability among the values that are randomly assigned to the players or to incorporate with ease and use different “realistic” examples within the same classroom session. For example, the professors might participate in the auction just to break the market and demonstrate how to create a monopolistic behaviour or how collusion works.
There has been an attempt therefore to identify further educational efforts to indicate to the students what knowledge the companies demand to their managers. The result has been very satisfying as for acceptance by both groups of the experimental setting as a teaching environment.
The aim in this research is to go one step further and compare the behaviour of the students and the professionals in an effort to contrast if the computer assisted tool is appropriate for teaching professionals-to-be (Pfahl et al., 2004), or there are important differences between professionals and students (Palacios-Huerta and Volij, 2008).
The results are consistent with the literature since it was expected that the PROFESSIONAL bid higher than the STUDENTS, WOMEN bid higher than MEN, and there are no clear-cut differences across auction types. Our main contribution is that the experimental setting has been prepared for a specific real case, that of LNG off-loading, and that the professionals that have participated are current managers in the specific sector. Students, on their hand, are managers-to-be studying Economics or Business Administration.
As for future research, it will be appropriate to perform additional experiments so as to obtain more samples, adding several more degrees of freedom to the design. For example, it looks reasonable to further explain the experiment to the participants, even providing the theoretical bidding functions prior to the sessions, so they have a clearer strategy.
Professionals have also asked for a variation on the experiment to better represent reality. It is our aim to develop with them an experiment in which bounded rationality might be separated from misperceptions.
It will also be very interesting to mix professionals in the same session to see if their bidding behaviour changes with the composition of the groups. Smaller groups will for sure dictate a different way of bidding between current and future managers.
Using the Mann–Whitney test for equal distributions, all the pairwise tests of experimental functions do not show any significant differences over the whole range of possible values. We will look for and find however differences in average bids over specific ranges of values in the upcoming paragraphs.