

This research aims to propose a model of associativity in the productive chain of the micro, small and medium-sized enterprises (MIPYMES) of citrus agroindustrial in the north of the state of Veracruz, Mexico; With the purpose of explaining the extent to which direct actors, support services, environment, relations and government policies determine the associativity in the production chain. The problem that originates this investigation is the lack of knowledge about the operation of the agro-industrial citrus MIPYMES in this area of the country. The result of this research is a model that represents the operation of these companies in associativity with the productive chain considering the elements that form it, proposing alternatives to generate a greater cooperation or coalition of the companies that interact to obtain mutual benefits.
Esta investigación tiene como objetivo proponer un modelo de asociatividad en cadena productiva de las micro, pequeñas y medianas empresas (MIPYMES) agroindustriales de cítricos en el norte del estado de Veracruz, México; con el propósito de explicar en qué medida los actores directos, los servicios de apoyo, el entorno, las relaciones y las políticas de gobierno determinan la asociatividad en la cadena productiva. La problemática que origina esta investigación es el desconocimiento del funcionamiento de las MIPYMES agroindustriales de cítricos en esta zona del país. El resultado de esta investigación es un modelo que representa el funcionamiento de estas empresas en asociatividad con la cadena productiva considerando los elementos que la forman, proponiendo alternativas para generar una mayor cooperación o coalición de las empresas que interactúan para obtener beneficios mutuos.
The purpose of this investigation is to propose an associative model for the production chain of the citrus agro-industrial SMEs located in the north of Veracruz, as there isn’t a model that represents the production chain in this context. The criteria under which said model was created were the following: first, an ex-ante model is created based on state of the art empirical evidence; subsequently, the ex post facto model in which the significant relations between the variables are established through Pearson correlations and r2 is determined; finally, the factor analysis is also established using the extraction method and the modeling of structural equations to determine the variables of the model. With the determination of the variables that will be in the model, and the information matrices utilized to gather qualitative information, the mapping of the associative model is carried out in the production chain of the citrus SMEs in Veracruz. This work is divided into the following sections: the first section sets out the context of the citrus agro-industrial SMEs located in the north of Veracruz; the second section develops the theoretical aspects on which the investigation on production chains and associative models is based; the third section develops the methodology; the fourth section presents the analysis and results obtained from the measurement instrument conducting a statistical analysis to obtain the variables of the model, the proposal of the associative model on the production chain of the citrus agro-industrial SMEs located in the north of Veracruz is elaborated, and the qualitative and quantitative results are detailed, based on the analyses carried out, which in turn allow achieving the main objective of this investigation; finally, the fifth section comprises the conclusions and recommendations.
Agro-industrial micro, small and median enterprises (SMES) in the State of VeracruzMexico is the fifth global producer of citruses (4.6% of the total), behind China (21%), Brazil (18%), the United States (11%), and India (6%) (Secretariat of Agriculture, Livestock, Rural Development, Fishery and Nutrition, 2014).
The citrus activity is of great importance for Veracruz, as it is the main producer of citruses in Mexico.
The State of Veracruz, located from the northeast to the southeast of the coast of Mexico, has 212 municipalities and is comprised by 10 regions: Huasteca Alta, Huasteca Baja, Totonaca, Nautla, Capital, Sotavento, Montañas, Papaloapan, de los Tuxtlas and Olmeca.
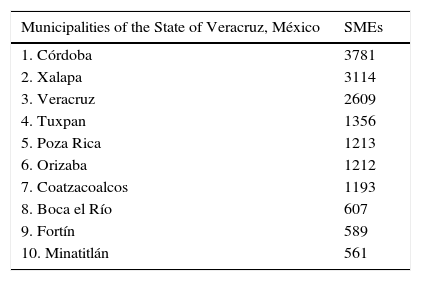
According to the Mexican Business Information System (SIEM for its acronym in Spanish) (2014), the most representative municipalities with regard to the registered SMEs (Table 1) are Córdoba, Xalapa, and the port of Veracruz with trade and port activities located in the center of the state, Tuxpan and Poza Rica located in the north of the state with trade and petroleum activities, and the municipalities of Orizaba, Coatzacoalcos, Boca del Río, Fortín and Minatitlán which have mainly industrial and trade activities, and also port activities.
Most of the representative municipalities in SMEs in Veracruz.
| Municipalities of the State of Veracruz, México | SMEs |
|---|---|
| 1. Córdoba | 3781 |
| 2. Xalapa | 3114 |
| 3. Veracruz | 2609 |
| 4. Tuxpan | 1356 |
| 5. Poza Rica | 1213 |
| 6. Orizaba | 1212 |
| 7. Coatzacoalcos | 1193 |
| 8. Boca el Río | 607 |
| 9. Fortín | 589 |
| 10. Minatitlán | 561 |
Source: Own elaboration based on the Mexican Business Information System 2014.
In the north of the state of Veracruz, economic, trade, industrial and service activities are carried out, particularly of the agricultural sector (agriculture, livestock, forestry and fishery); this part of the state is also strongly influenced by agro-industrial SMEs that made it possible for the region to produce a large variety of processed products, offering a value added to the products of the agricultural sector.
Agro-industry is a rather complex activity, in which agriculture and industry interact. Consequently, it calls for technological developments, capital requirements, and more sophisticated distribution and commercialization systems, which are necessary to reach the consumer, who accepts or rejects the products and defines the degree of processing (Romero, 2001).
The citrus agro-industry is comprised by companies dedicated to the cleaning, packaging and waxing of citruses, juice extraction, juice concentration, oil extraction, the extraction of pectin, and the dehydration of the peel. Said companies or establishments are not clearly identified in the available census information, which is due to them being sources of economic incomes and most of the of micro and small enterprises are fiscally registered as natural persons with entrepreneurial activities or are under the fiscal incorporation regime as having been created not long ago; most of these, depending on their economic situation, deregister (temporarily or definitely) before the Tax Administration Service (SAT for its acronym in Spanish), and as such, it is difficult to carry out a precise census.
Regarding the production of citruses, the state of Veracruz focuses mainly on: oranges, lemons, tangerines, grapefruits and mandarins, which together had a production of 3,560,580.47 tons in 2014. The orange producing municipalities are found mainly in the north of Veracruz. The municipality of Álamo Temapache is the main orange, mandarin, and tangerine producer, with a production of 2,353,699.60, 154,595.20 and 178,900.21 tons, respectively, and the city of Martínez de la Torre is the main grapefruit and lemon producer with a production of 250,353.40 and 623,062.06 tons, respectively (Agriculture and Fishery Information System, 2014).
The context in which this investigation was developed comprised the agro-industrial SMEs located in the north of Veracruz, specifically, of the municipalities of Álamo Temapache, Papantla, Gutiérrez Zamora and Poza Rica, located in the regions of Huasteca Baja and Totonaca. The reason for this is that these are the main citrus producing municipalities with the greatest number of registered agro-industries in the state.
Associativity in the production chainA key strategy for the development of the SMEs in the globalized world is to promote the associativity of the companies, promoting the creation of clusters and business networks in competitive production chains. The study of associativity and the production chains has been addressed by numerous studies, among which the following stand out:
López and Calderón (2006, p. 14) define associativity as “a strategy derived from a cooperation or coalition of enterprises working toward a common goal, in which each participant maintains legal and managerial independence.”
According to Dini (2003), the forms of associativity are:
- •
Production chains
- •
Networks
- •
Clusters
Production chains emerge as an alternative to collective efficiency, but their development requires: coherent macroeconomic policies, the identification of competitive advantages, and an environment that generates stability and confidence.
Below, the concept of productive chain is developed from the perspective of various authors and institutions.
The State Program for Science and Technology of the State of Jalisco (PECYTJ for its acronym in Spanish) (2007, p. 87), Mexico, defines the productive chain as “the process followed by a product or service through the production, transformation and exchange activities, until reaching the end consumer. Moreover, it includes the supply of inputs (financing, insurances, machinery, equipment, direct and indirect raw material, etc.) and relevant systems, as well as all of the services that significantly affect said activities: research and development and technical assistance, among others, to carry out competitive and sustainable activities that allow generating material wealth to increase the welfare level.”
Wisner (2003); Croxton, García-Dastugue, Lambert, and Rogers (2001, p. 24) conceptualize the production chain as “the integration of the key business processes that occur within the network comprised by the input suppliers, manufacturers, distributors and the independent retailers, whose objective is to optimize the flow of goods, services and information.”
According to the Economic Commission for Latin America and the Caribbean (ECLAC) (2003, p. 112) the concept of production chains “implies the sectoral and/or geographical concentration of enterprises that perform the same closely related activities (both backwards and forwards), with important and accumulative external economies and the possibility of carrying out an action in conjunction with the search for collective efficiency.”
From a legal point of view, the Official Journal of the Federation on the Law for the development of the competitiveness of the SME (2009, p. 19) defines production chains as “production systems that comprise groups of enterprises that provide value added to products and services through the stages of the economic process.”
Lazzarini, Chaddad, and Cook (2001, p. 142) conceptualize the production chain as “the sequential group of agents that participate in the successive transactions for the generation of a good or service, including the primary sector up to the end consumer and the services provided throughout the chain.”
Kaplinsky (2000, p. 76) defines the production chain as “an analysis tool that allows identifying the main critical and potential points of development, to then define and promote strategies focused on the agents involved.”
Based on the above, we can define the concept of the production chain as: A production system that comprises a group of agents and sequential business relations, relevant services, and other elements that intervene in the elaboration process of a product from the primary sector to the end consumer, and including the services provided throughout the chain, to then define strategies focused on the agents involved.
Production chain modelsThe production chain models in the state of the art reports are: global and sectoral.
Global production chain modelsAccording to Gereffi (1999), the global production models imply that the quasi-hierarchy in which the manufactures and buyers perform the main role, dominates the group of traditional manufacturing. In some cases, different production chains coexist, with enterprises that participate in both a local and a global production chain. There are two types of global production chains:
- 1)
Production chains aimed at the producer.
- 2)
Production chains aimed at the buyer.
Sectoral production chain models are comprised by the three economic sectors of the Mexican economy: the agricultural, the industrial and the services sectors. These sectors have intersectoral relations given that the agricultural sector sells raw materials to the industrial sector and in turn buys fertilizer, compost, and machinery from it. The services sector sells foodstuff to the agricultural sector, which in turn requests financial, commercial and transport services from it. The industrial sector sells furniture, office equipment, trucks, etc. to the services sector, which then provides professional, medical and financial services, etc., in turn.
The agro-industrial production chain models have intersectoral relations with the agricultural and industrial activities, and show the importance of technology in the outreach of the producer to the end consumer. This, from the sales point of view, is strongly supported by information technologies (State Program for Science and Technology of the State of Jalisco, 2007).
The studies on production chains have their origins in Europe during the 1970s. They allowed improving the competitiveness of various products such as milk, meat, and wine, promoting the definition of sectoral policies agreed to between the different agents of the chain (Van Der Heyden & Camacho, 2006).
Some countries have developed production integration projects through their governments and universities in order to create articulated development policies and elaborate regional integration researches.
In the United States, there are works on production chains elaborated by the Inter-American Development Bank of Washington D.C. (Guaipatín, 2004; Pietrobelli & Rabellotti, 2005). In these works, the factors that promote innovation are listed: education, access to credit, the existence of effective institutions, and trade openness.
Moreover, Duke University, Durham, North Carolina, USA (Gereffi, 1999), the Ohio State University, and the Nevada State University in Reno (Croxton et al., 2001) have carried out research on production chains in order to study the different dimensions of industrial advancement. This comprises a new form of analyzing the economic development in the age of export-oriented industrialization, where theoretical implications with historical and organizational bases are established for the development of the production chains approach.
In the Latin American countries where the production chains approach is relatively new and beginning in the year 2000, studies have been carried out on production chains in countries such as: Colombia, Peru, Bolivia, Costa Rica, Brazil, Argentina, Venezuela and Mexico. Through their governmental and postgraduate and research institutions, they have demonstrated that the production chain approach is pertinent in the current context of the evolution of the global economy, competitiveness, productivity, globalization, technological innovation and complex agricultural systems, and as such the approach allows a clear systematic view of the production activities.
Studies on production chains have been carried out in Mexico since 2002. This was done through governmental institutions such as the Secretariat of Economy, Secretariat of Agriculture, Livestock, Apiculture and Fishery, Secretariat of Small and Medium Enterprises, the Nacional Financiera, the National Institution for Forestry, Agriculture and Livestock Research, the State Program for Science and Technology of Jalisco, and the National Council for the Competitiveness of Micro, Small and Medium Enterprises. These have allowed the establishment of sectoral and regional plants, and competitiveness programs to increase the productivity and competitiveness of the SMEs through the integration in production chains.
Higher education and postgraduate institutions in Mexico have done studies on production chains, among which the Instituto Tecnológico de Estudios Superiores de Monterrey (2004), the Universidad de Aguascalientes (Carranza et al., 2007), and the Universidad Autónoma de Chapingo (Cuevas et al., 2007) have done research with the objective of promoting the mobilization of existing production resources in rural areas through a better connection of the small producers to the production chains. This is done in order to analyze the performance of the production chain and identify its critical and potential development factors. In academia there are only works of theoretical reflection such as that by Ochoa and Montoya (2010), who carry out a biological metaphor applied to the business associativity in agricultural production chains. It compiles various applications of the metaphor as methodology for the study of organizations and their problems, as well as their nature, characteristics and bases of both the microbial consortia and the agricultural production connections. This work concludes by presenting the advantages and limitations of this conceptual methodology for the case of the agricultural production chains without providing any empirical evidence. The relevance of this work is to offer concrete evidence of the most representative citrus agro-industrial SMEs in Veracruz, Mexico.
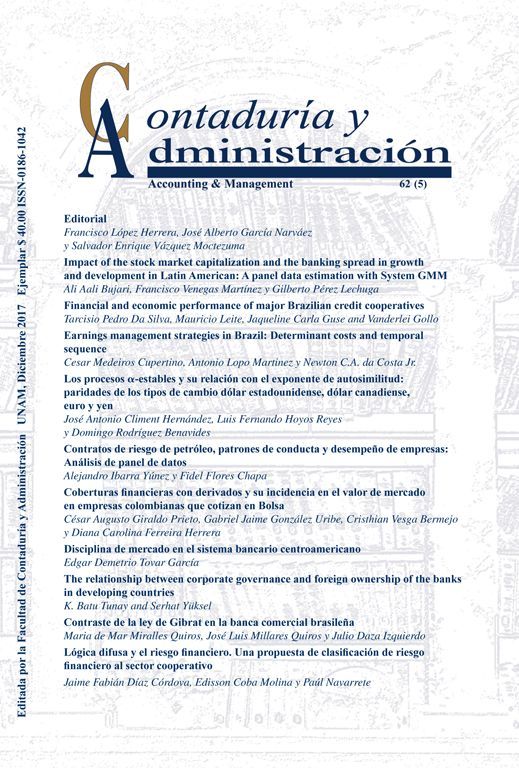
This research seeks to answer the following question: Which model explains the associativity of the production chain of the citrus agro-industrial SMEs located in the north of Veracruz?
Fig. 1 shows the ex-ante model built based on the empirical evidence in the state of the art reports. Each independent variable—direct agents, environment, support services, relations and governmental policies—have their theoretical base, as does the dependent variable: associativity. The operationalization of the variables was done considering the variable, the conceptual definition, the dimensions, and the indicators.
Research method
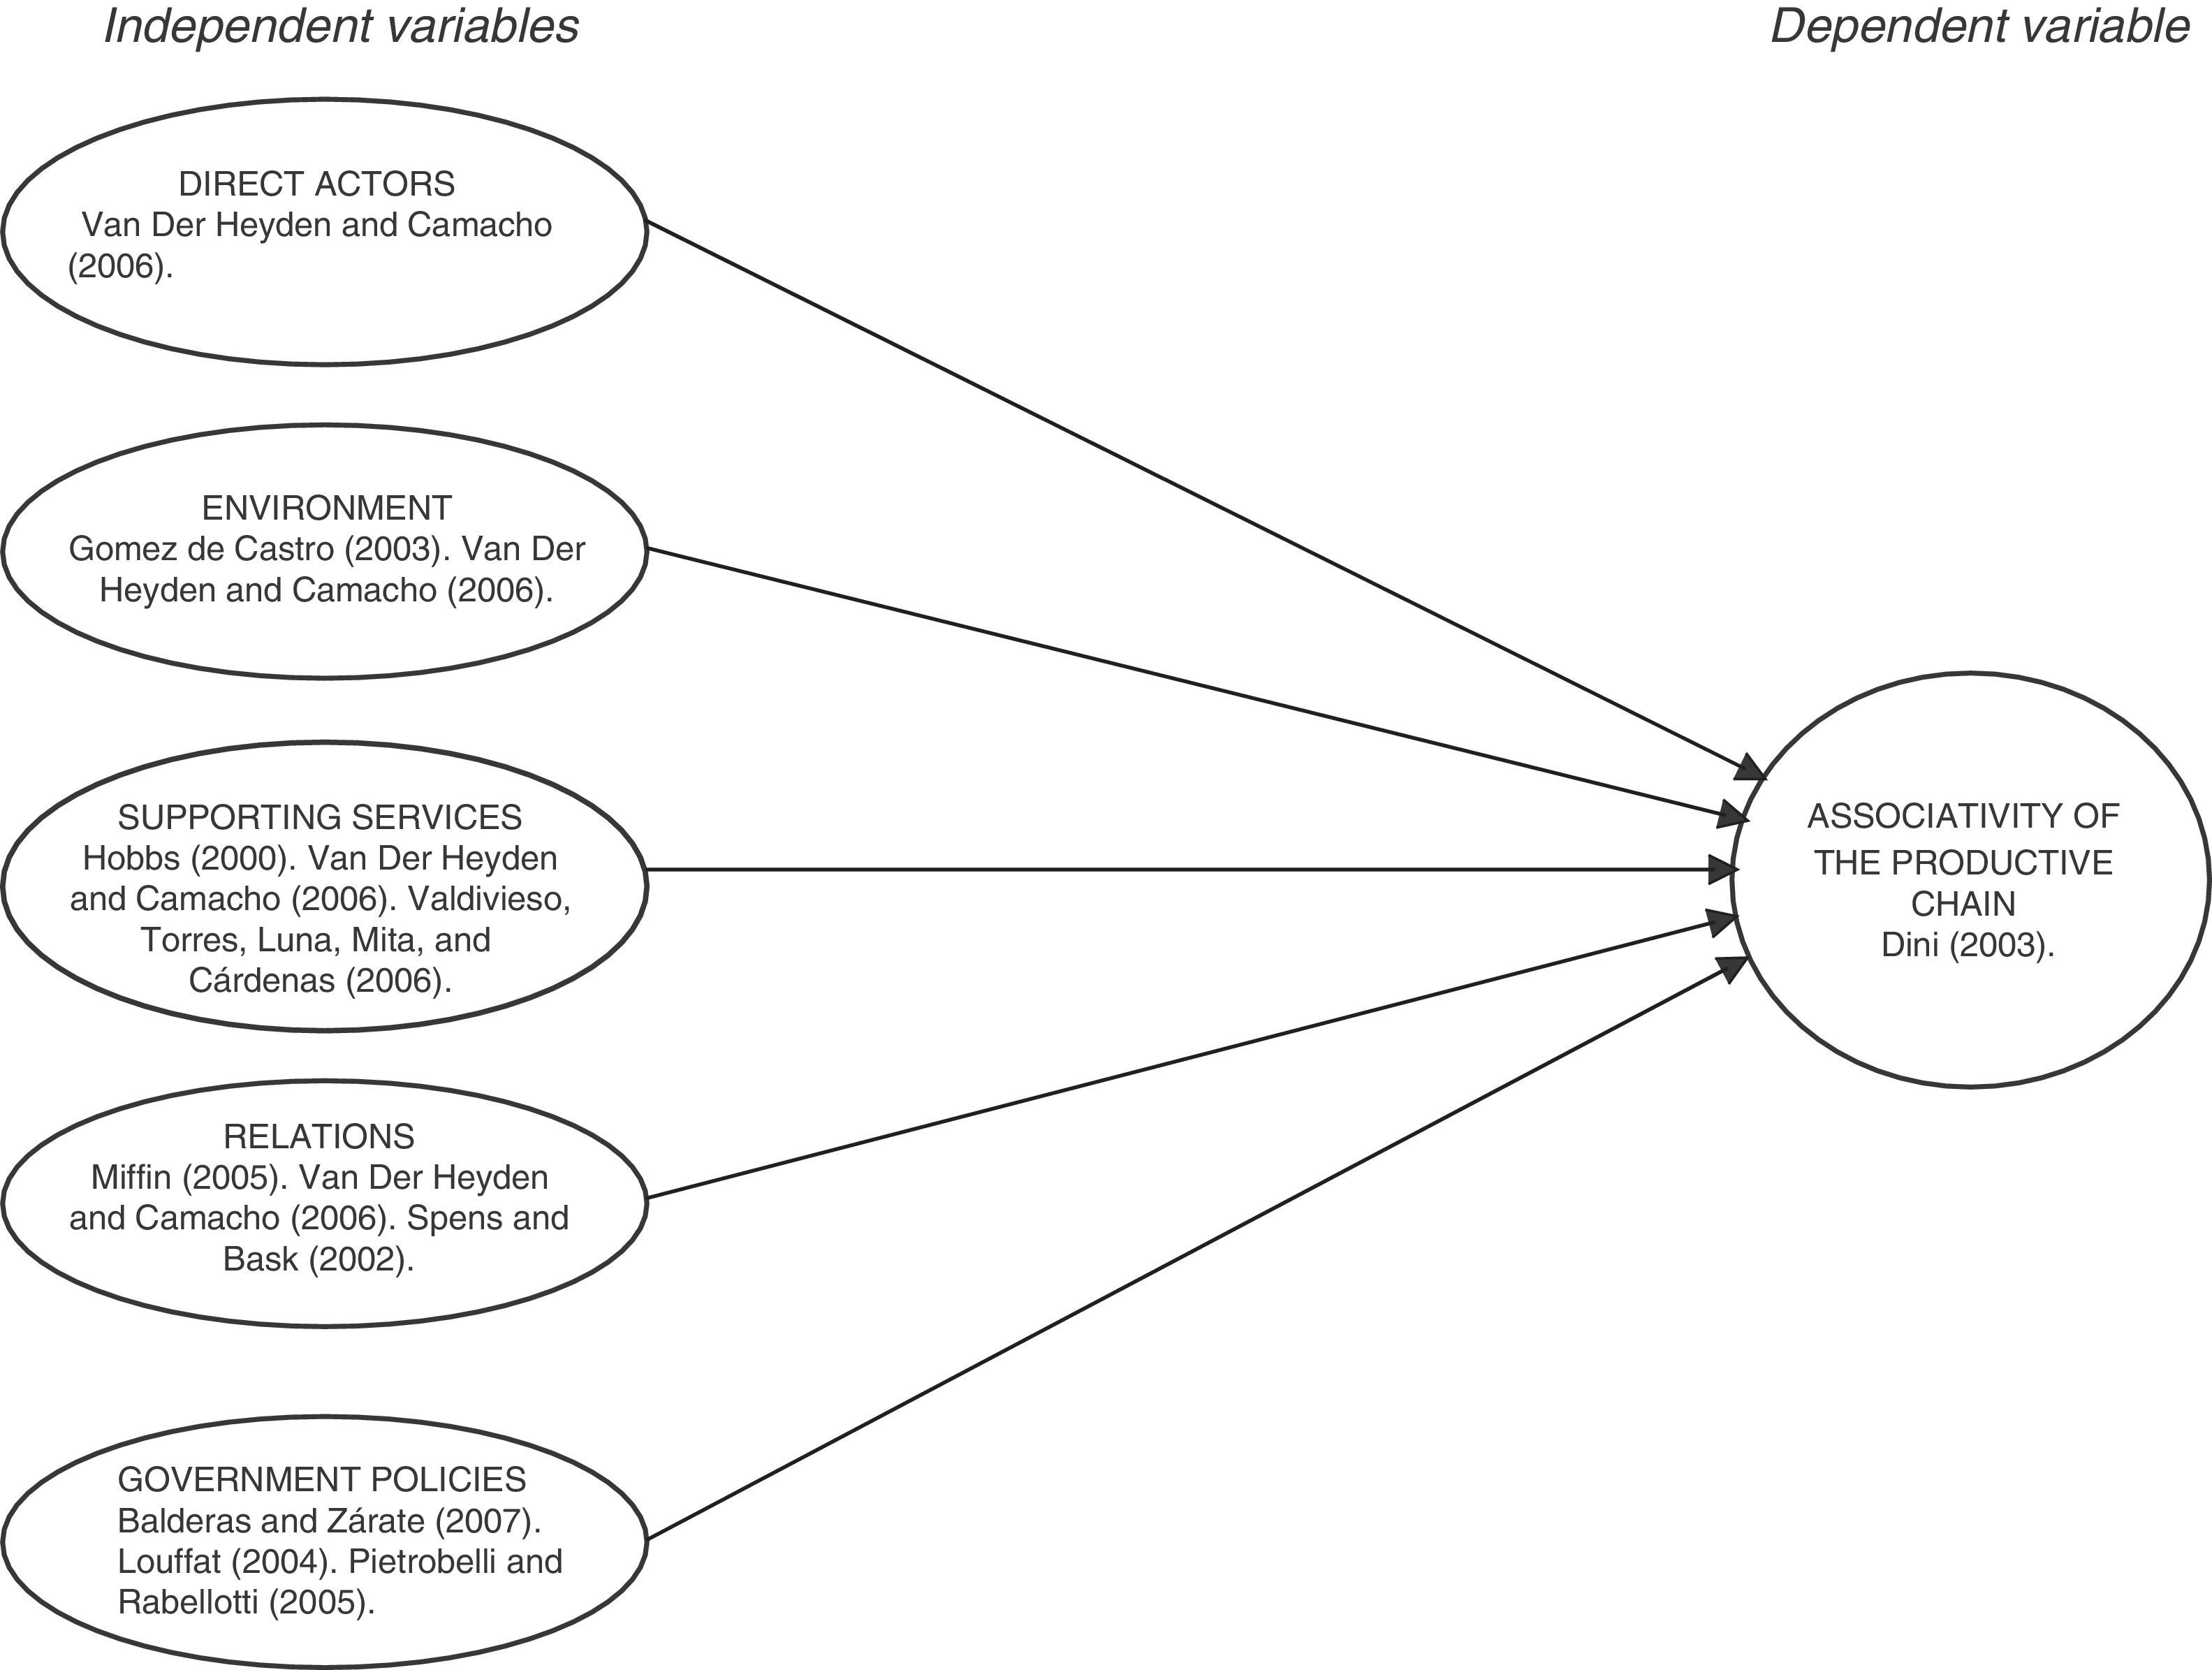
Fig. 2 shows the deductive hypothetical method, where the sequence of steps to carry out the research can be observed.

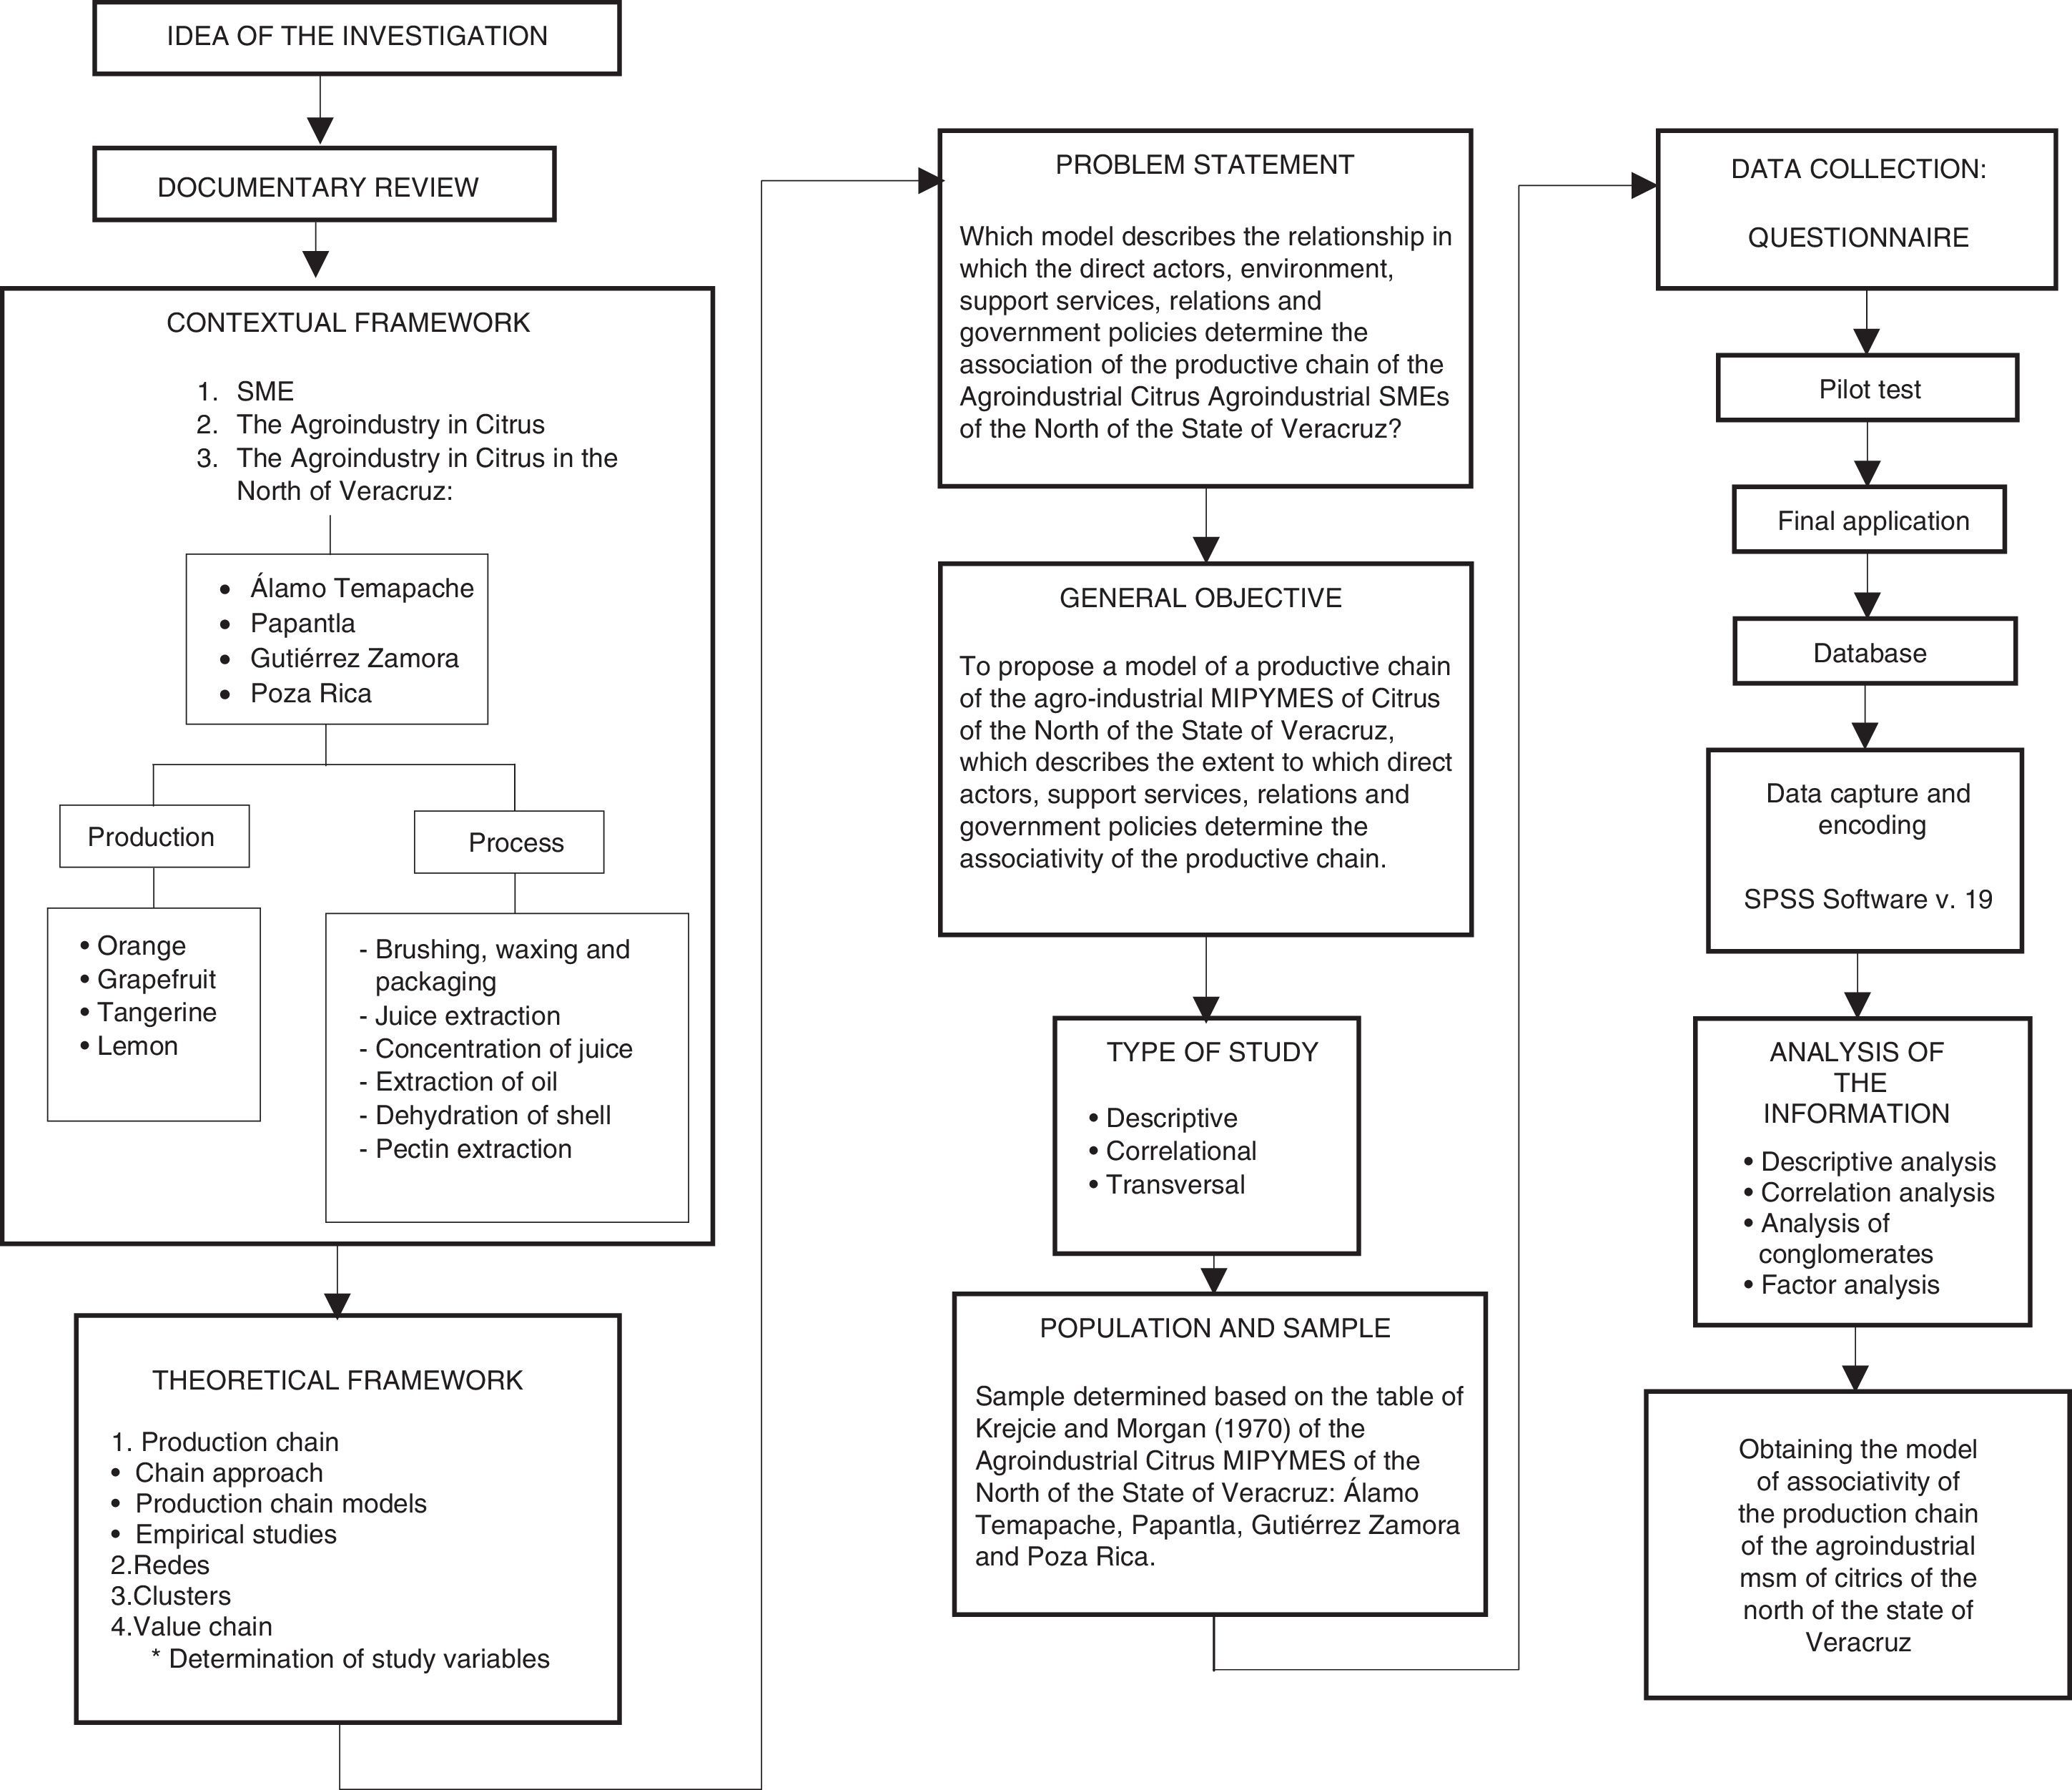
Fig. 3 shows the methodological congruency of the title, with the problem statement, general and specific objectives, as well as the research questions, general and work hypotheses; each of these elements are connected to each independent variable.

The research subjects to whom the measurement instrument was applied are the managers and owners of the citrus agro-industrial SMEs located in the north of Veracruz,1 being from the following cities: Álamo Temapache, Papantla, Gutierrez Zamora and Poza Rica; related to the agro-industries of: cleaning, waxing and packaging, juice extraction, juice concentration, oil extraction, orange peel dehydration, and pectin extraction. A probabilistic sampling was used as the population is known to be 53 SMEs.2
In this sense, the sample is determined based on the table by Krejcie and Morgan (1970), in which the size of the population and the quantity of errors determines the sample size selected at random. These authors establish a formula to estimate the sample size, based on which the table to determine a sample in relation to a population is built.
The formula is the following:
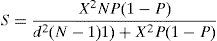
Locating the population on the table, we can observe that with a population of 55 (which is the datum that more closely approximates our population on the table) our sample would have 48 enterprises.
A measurement instrument was designed based on the following: diagram of variables, sagittal diagram of variables, methodological matrix of variables (conceptual definition, operational definition, dimension, indicators, and items), content validity matrix, and measurement level. The Likert Scale was utilized. The survey handled statements and judgments with a positive and negative direction, with 5 alternative answers.3
The pilot test was applied to 10 enterprises and the final survey to 38 enterprises. Regarding the reliability of the measurement instrument, the pilot test was done and a Cronbach Alpha=.869 was obtained, which indicates that our measurement instrument is reliable.
The SPSS version 19 statistical package was utilized for the statistical tests, followed by the Lisrel 8.8 program using the modeling of the structural equations to adjust to the final model.
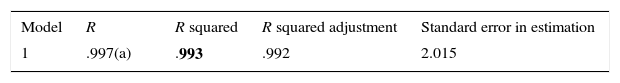
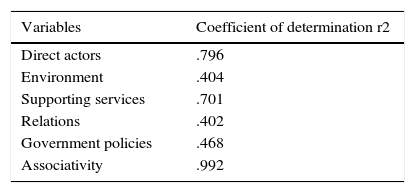
Result analysisTo test the hypothesis, the r2 determination coefficient was utilized as shown in Table 2. The associativity variable of the production chain obtained a value of 0.993, thus it has a high degree of significance; based on the obtained result, the associativity of the production chain is explained by the direct agents, the environment, support services, and government policies.
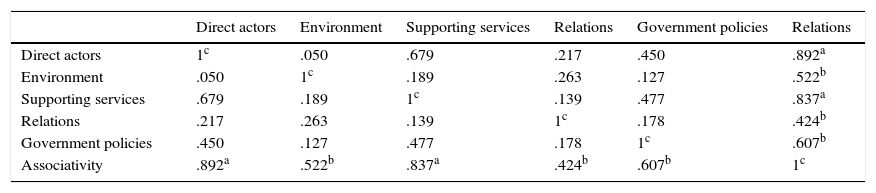
Concerning the results of the Pearson correlations and the r2 determination coefficient, they presented significant correlations (Tables 3 and 4); the values of the independent variables fluctuate between .424–.892 for the Pearson correlation and .402–.796 for the r2 correlation, which indicates that they have a substantial and pronounced moderate correlation of each of the independent variables with the associative dependent variable. Together, the independent variables explain the .993 (r2) to the associativity of the production chain (dependent variable). Table 3 summarizes the statistical evidence found.
Pearson correlation coefficient matrix (r).
| Direct actors | Environment | Supporting services | Relations | Government policies | Relations | |
|---|---|---|---|---|---|---|
| Direct actors | 1c | .050 | .679 | .217 | .450 | .892a |
| Environment | .050 | 1c | .189 | .263 | .127 | .522b |
| Supporting services | .679 | .189 | 1c | .139 | .477 | .837a |
| Relations | .217 | .263 | .139 | 1c | .178 | .424b |
| Government policies | .450 | .127 | .477 | .178 | 1c | .607b |
| Associativity | .892a | .522b | .837a | .424b | .607b | 1c |
The determination coefficient had high correlations on the direct agents, support services, and associativity as can be observed in Table 4.
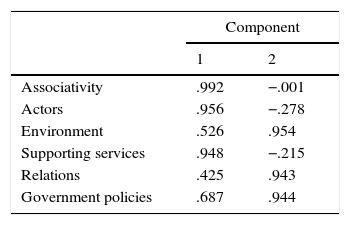
Concerning the factor analysis (Table 5), two factors were obtained. The first factor is comprised of 3 variables: associativity, direct agents, and support services, which could represent the significant interaction of these variables in the production chain. The second factor gathers the group of variables: environment, relations, and government policies, as such it could represent the elements that act as support in the production chain. Both factors are related to the production chain.
Once the factorial analysis had been applied, the following factorial loads were found by applying the extraction method: Principal component analysis.
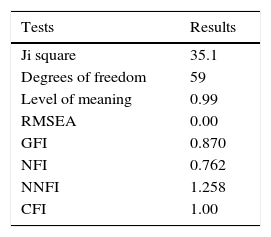
Finally, when applying the molding of structural equations, the following tests were utilized: chi-square, RMSEA (approximation of the average square root of the error), GFI (goodness-of-fit index), and CFI (comparative fit index). Jaccard and Wan (1996) recommend that three of the aforementioned tests are performed, whereas Kline (1998) proposes that at least four are carried out. Table 6 shows the results of these tests: the chi-square is significant because it is greater than .05; the result of the RMSEA is less than .08 and it is therefore satisfactory; the GFI indicates a value of .870, which supports the model, given that its value is close to .90; and the result of the CFI is close to 1, which indicates a good fit because values above .90 are considered acceptable. The results reported in Table 6 support the fit between the theoretical model and the empirical data.
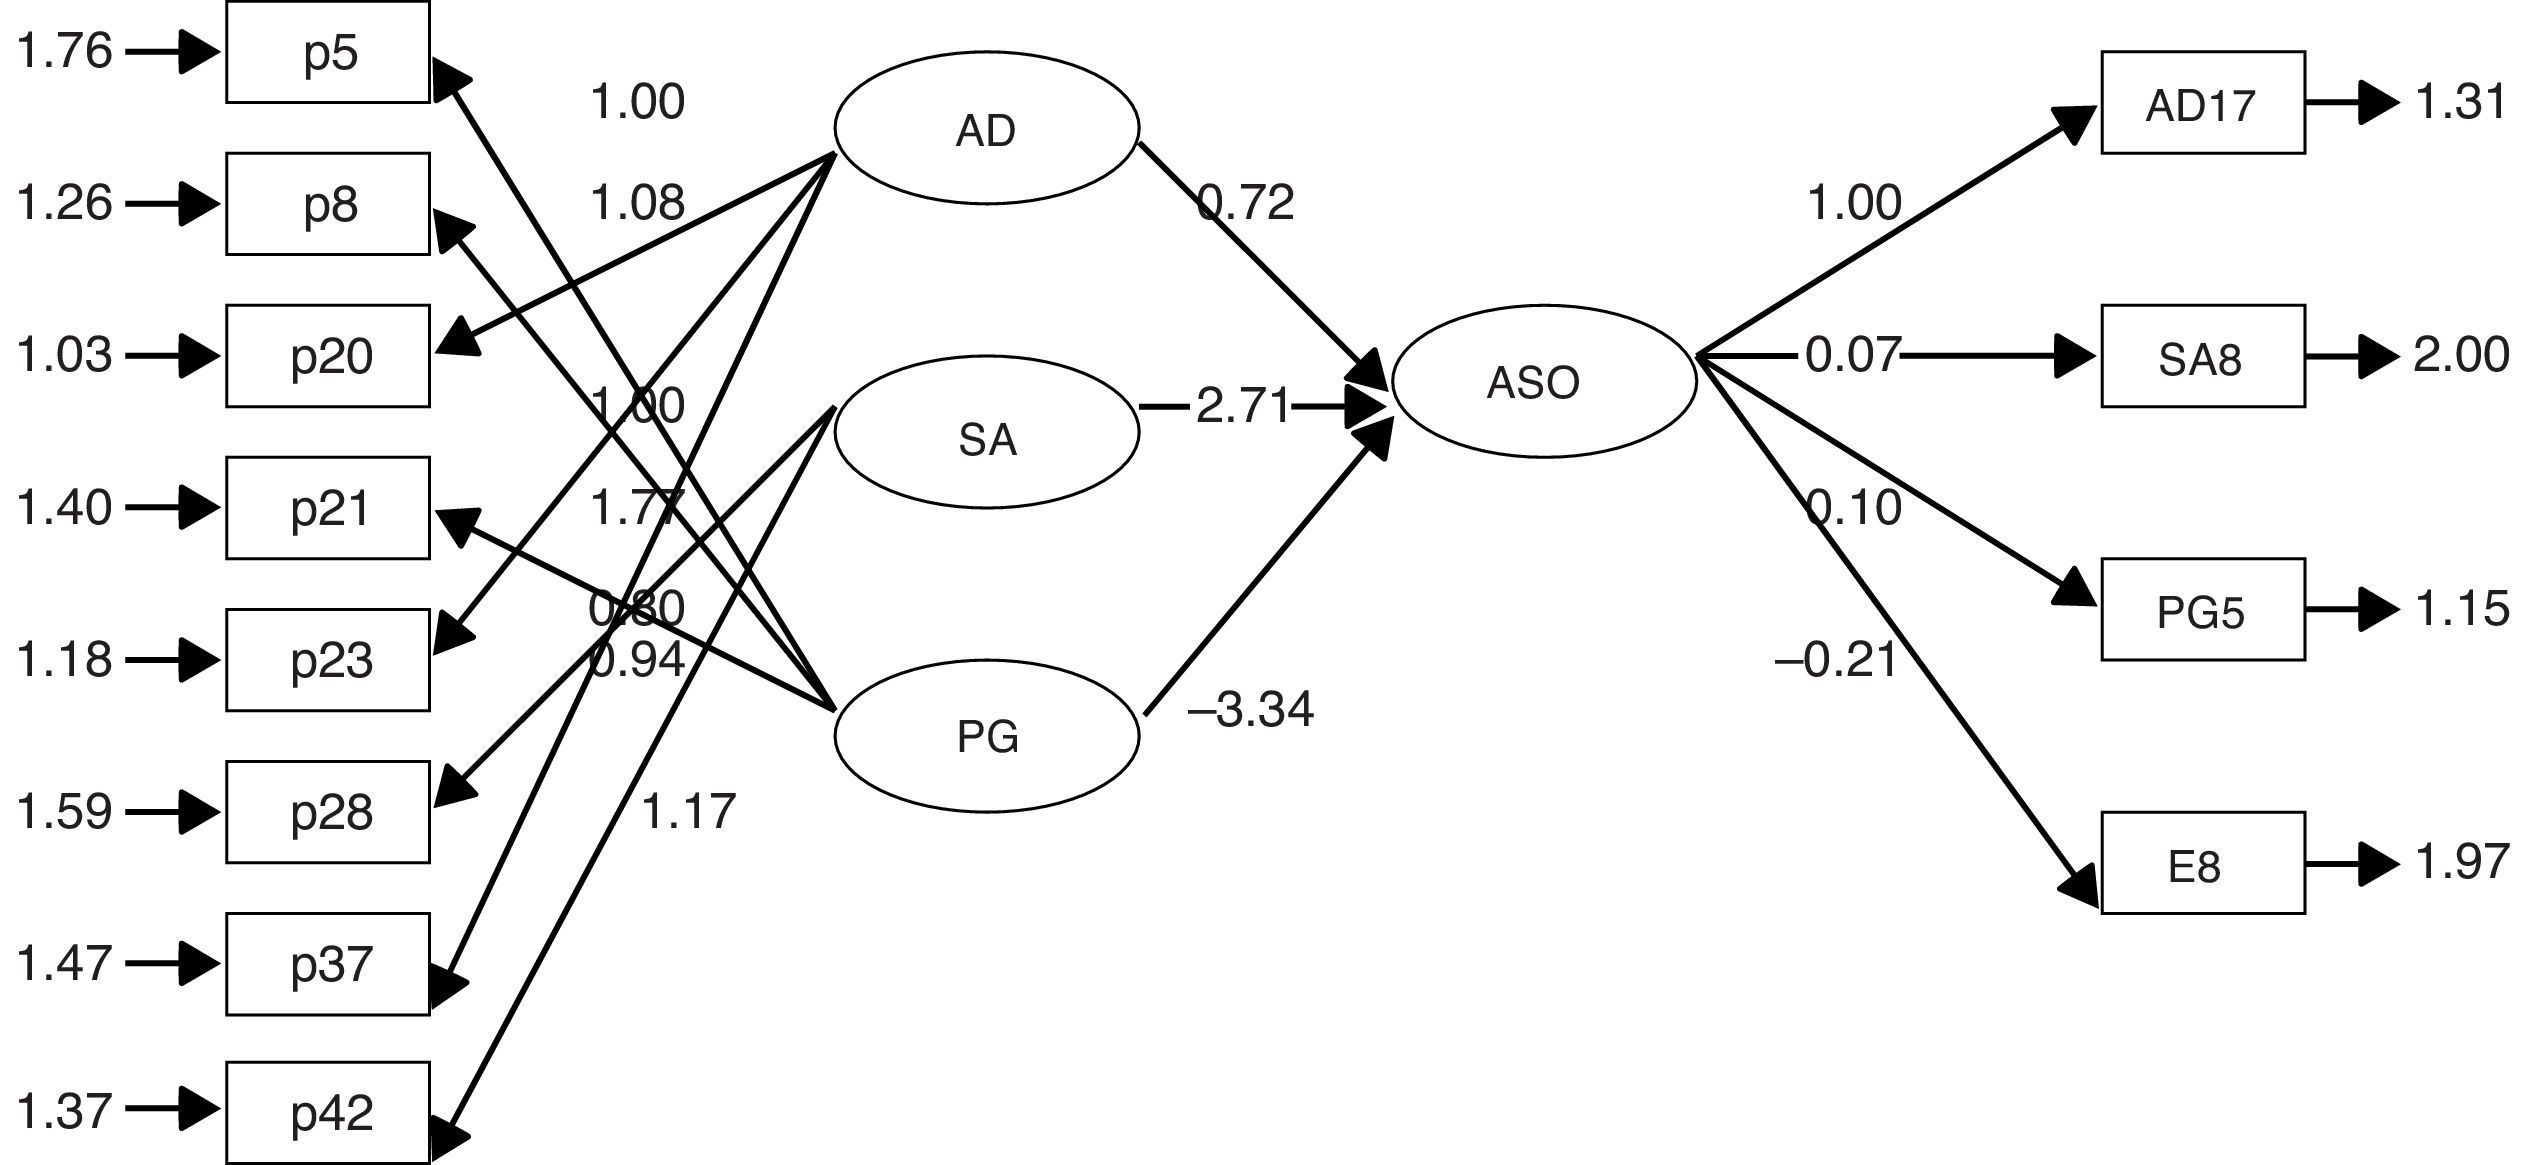
Fig. 4 shows the modeling of structural equations where the Associativity dependent variable of the production chain is explained by the Direct Agents, Support Services and Government Policies, who obtained an Alpha of .764, .834 and .608, respectively, as shown in ovals in Fig. 4.4 The Relations and Environment variables obtained an Alpha of .36 and .041, which do not contribute to the prediction of independent variable, this due to their low alpha reliability and the size of the sample.
. The rectangles represent the observed items or variables; the arrows that link the ovals and the rectangles are factorial loads; the arrows that link the ovals are beta coefficients; and the small arrows that are to the side of the rectangles are estimation errors.")
Modeling of structural equations.
Source: Elaboación own based on the field research.
Note: The ovals are the latent variables or constructs, where AD=Direct Agents, SA=Support Services, PG=Government Policies, and ASO=Associativity of the Production Chain (all for their acronyms in Spanish). The rectangles represent the observed items or variables; the arrows that link the ovals and the rectangles are factorial loads; the arrows that link the ovals are beta coefficients; and the small arrows that are to the side of the rectangles are estimation errors.
Based on the aforementioned and in accordance with the Environment variable, Gomes de Castro (2003) and Van Der Heyden and Camacho (2006) state that the environment must be included in a production chain due to the fact that the climatic, cultural, and economic processes influence the development of the production chain; according to the context used here, the production process is considered as such from the inputs, processing, final product of the citruses, and up to the national and international commercialization of the same. In this sense, the environment in the production chain is of great significance; we can say that this aspect explains its low reliability because in reality the buyer's markets are outside the context, as is the case for most of the providers that tend to be centralized both by the state and federal governments.
Regarding the Relations variable, Miffin (2005), Louffat (2004), and Pietrobelli and Rabellotti (2005) consider that the relations are sale-purchase, social, and organization connections that exist in the elements that comprise and participate in the production chain, where they form the participating networks in each link in the chain. Therefore, its low reliability is explained because although the intention to introduce clusters remains, the traditional mistrust and the mistrust of the producers toward the other productive agents do not generate the necessary synergies.
In this sense, based on the theoretical sustainment of the Environment and Relations variables, these are considered for this model.
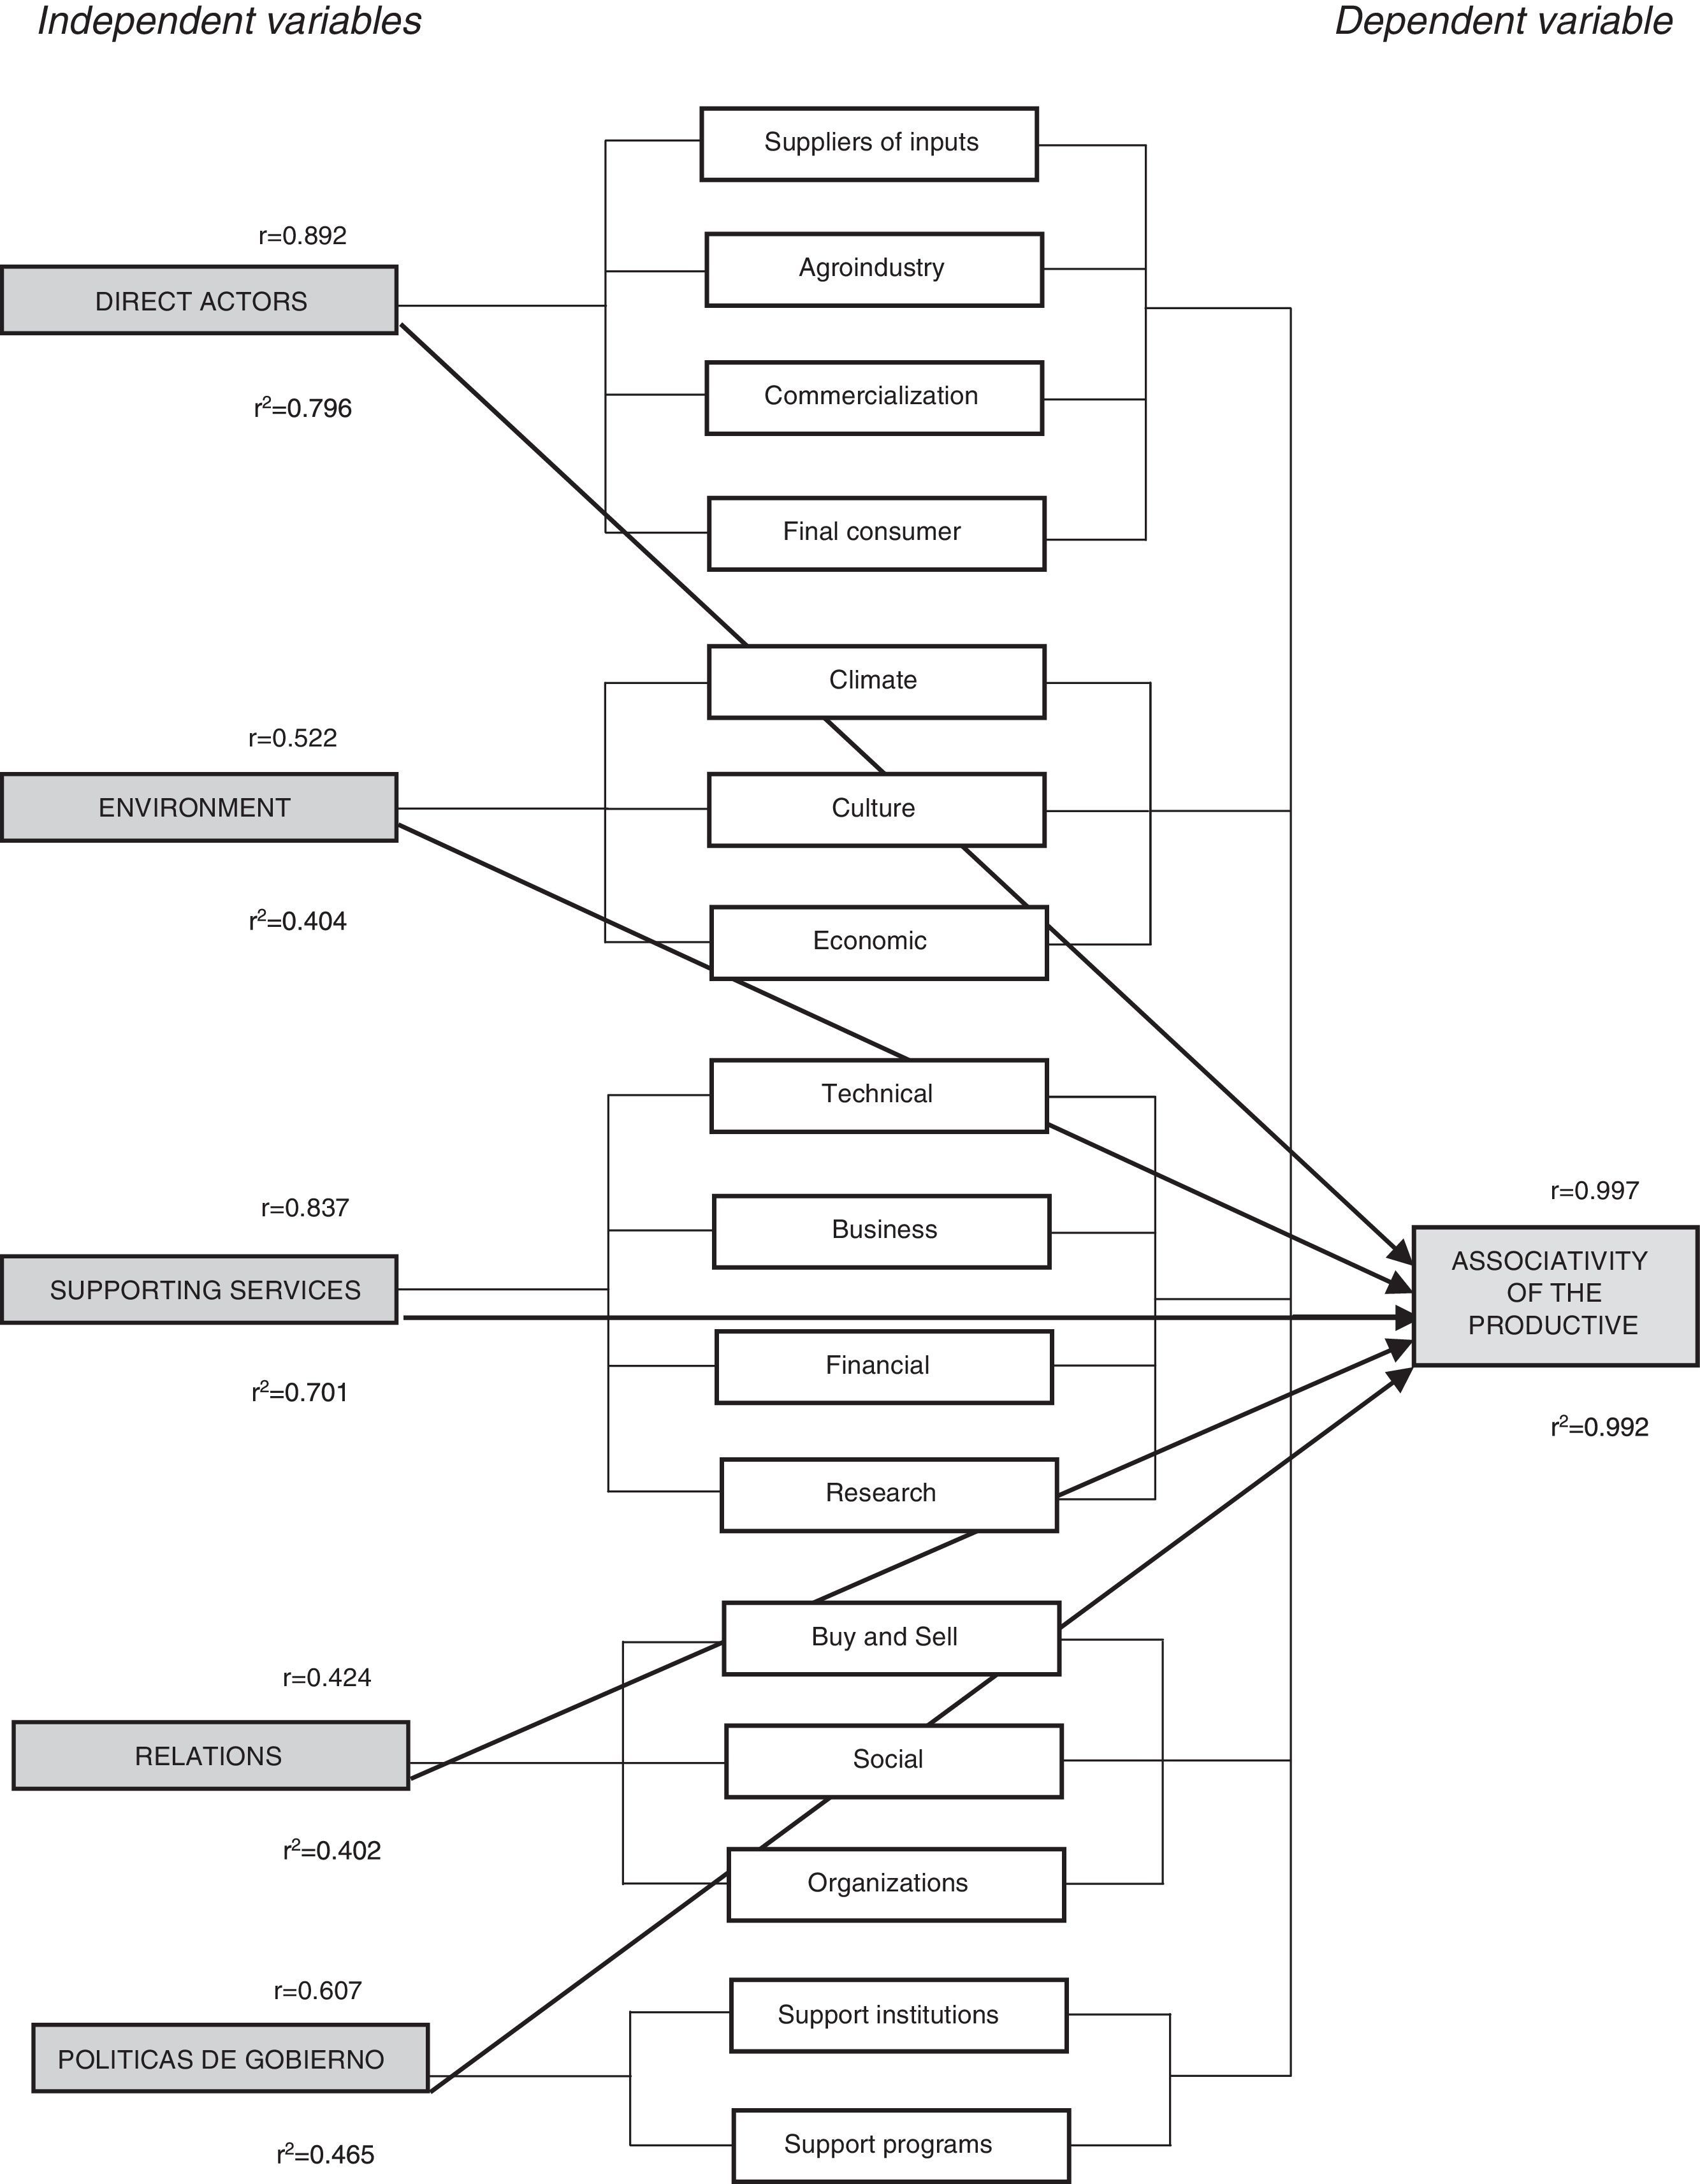
The ex post facto model (Fig. 5) is established taking the quantitative and qualitative information as a base. This shows that the relations between variables are significant, explaining the reality of the production chain of the citrus agro-industrial SMEs located in the north of Veracruz. Regarding the degree of significance provided by the Pearson and r2 correlations, the correlations range from the highest value of 0.992 (which means that there is an extremely significant correlation) for the Associativity dependent variable, to the lowest value of 0.402 (substantial moderate correlation) for the relations variable.

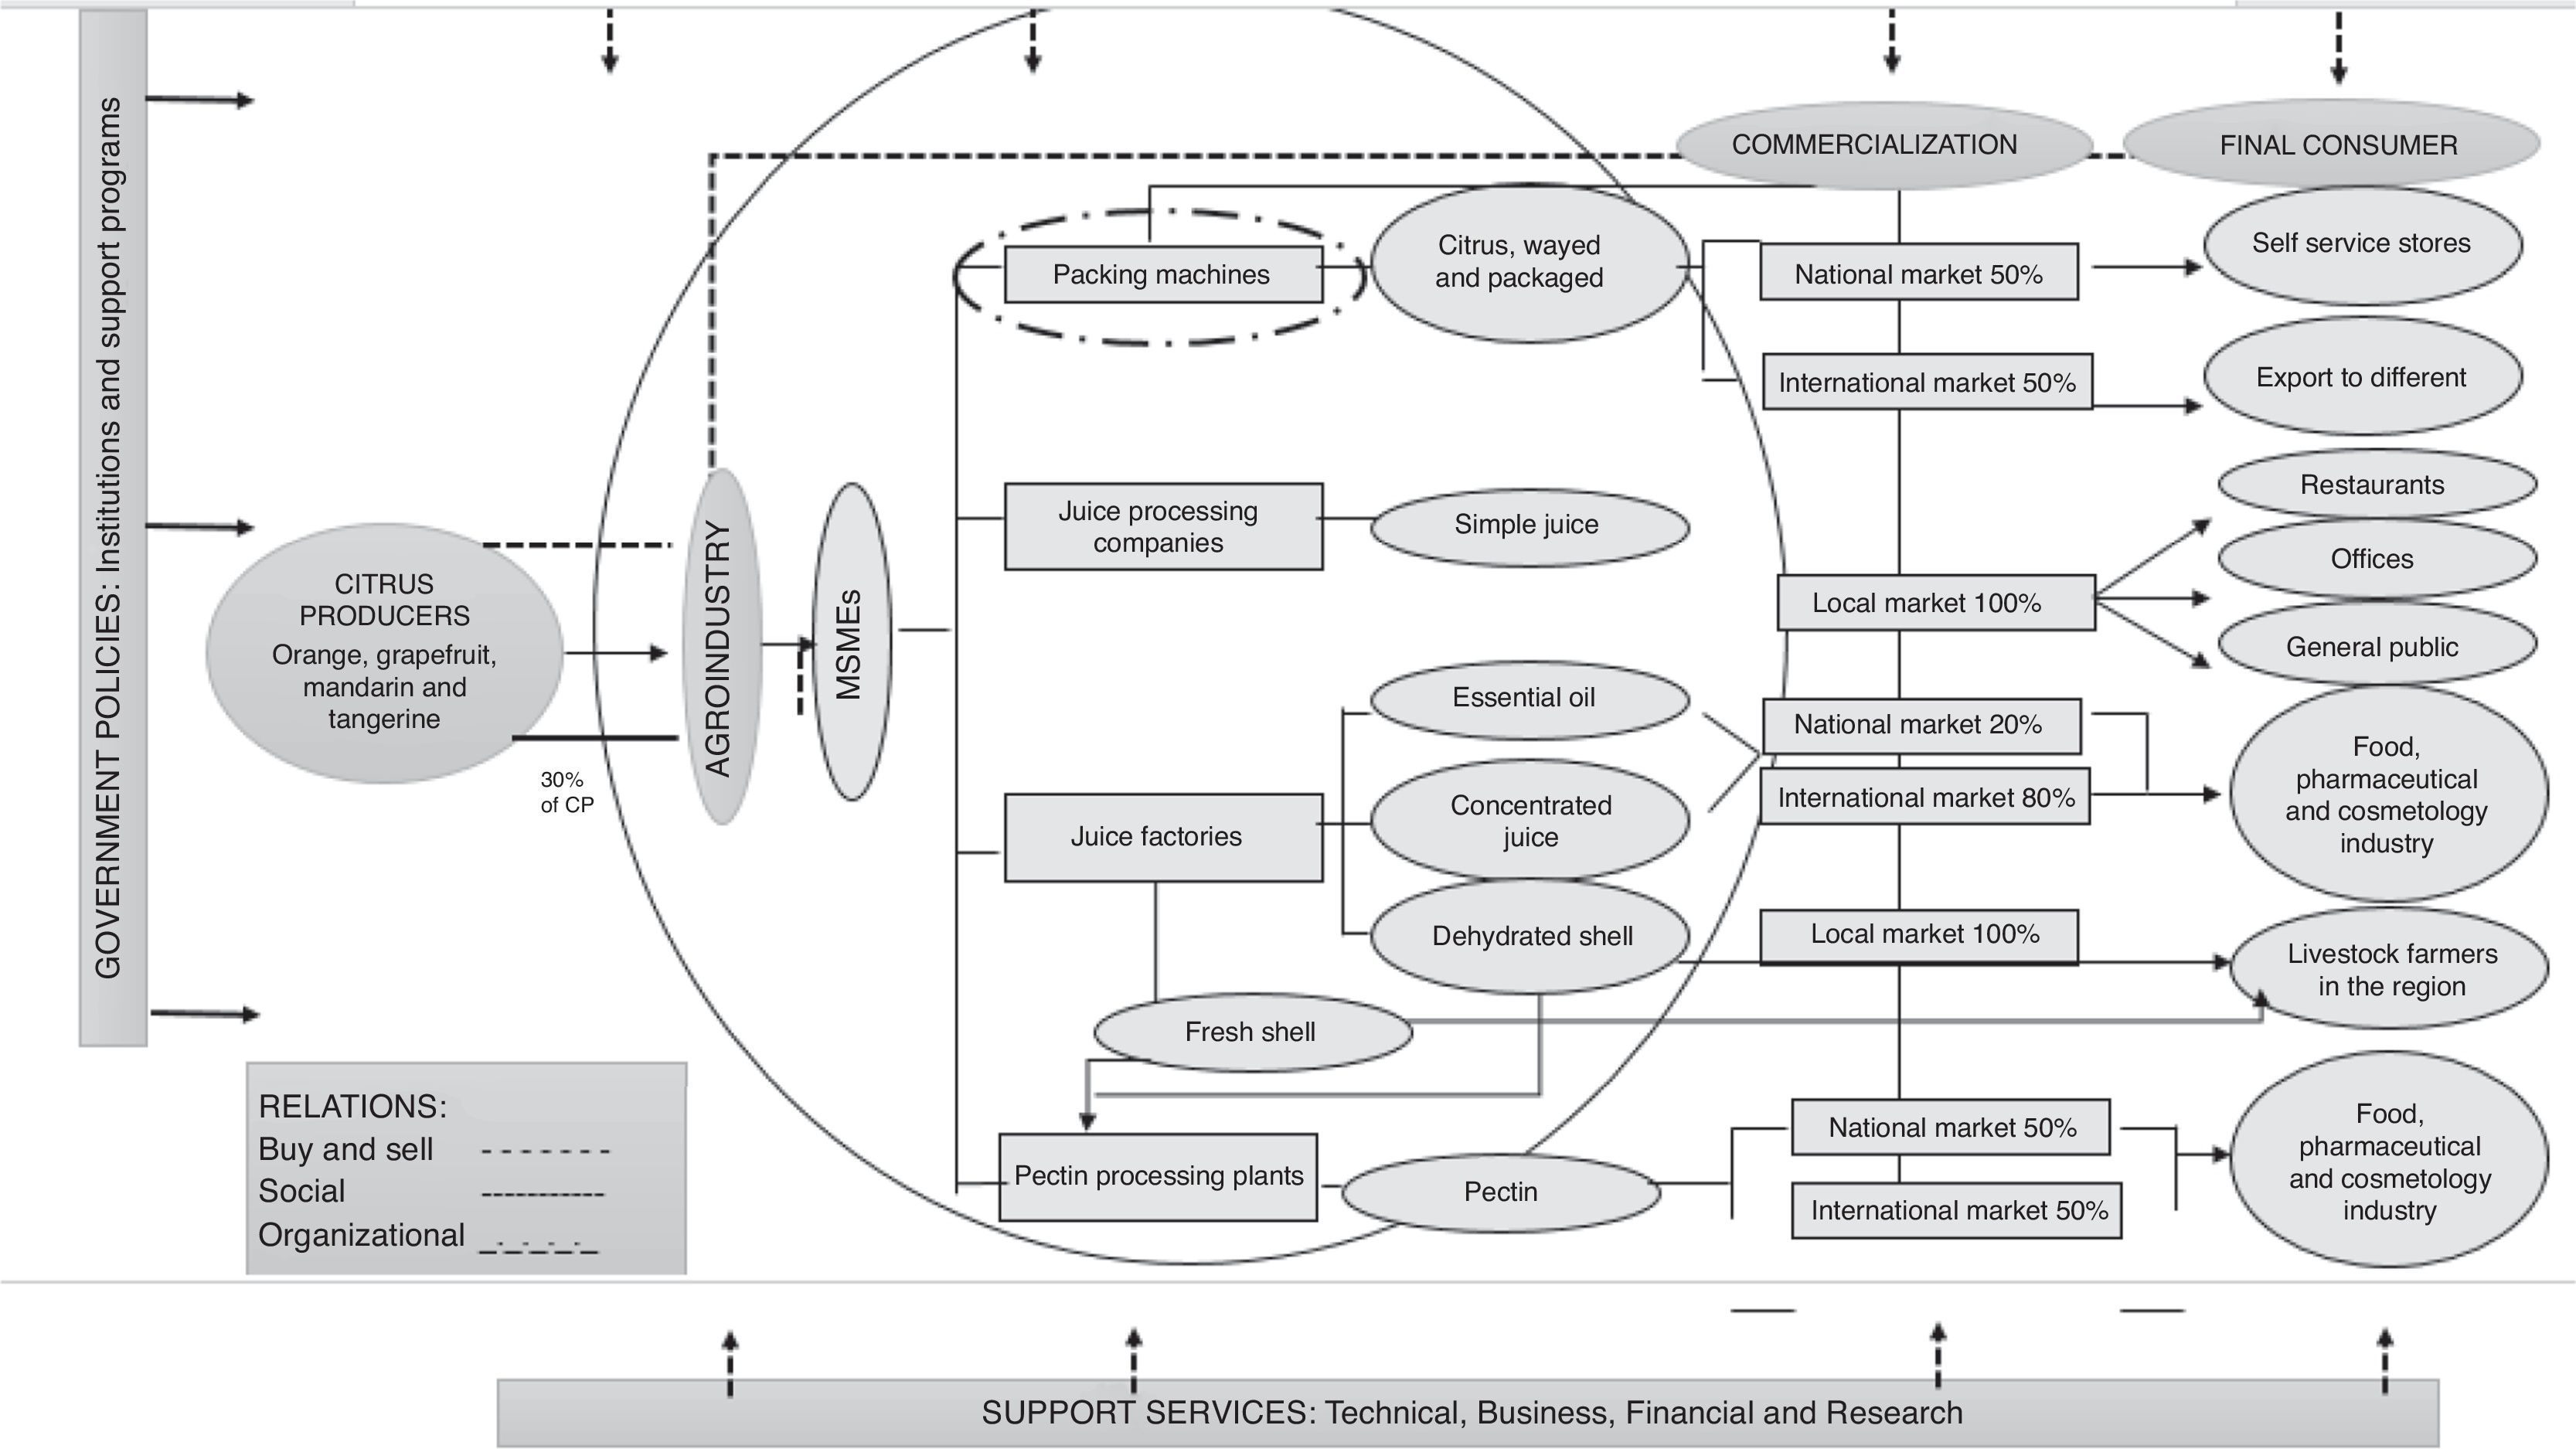
With the variables that will be in the model and based on information matrices of each variable,5 the mapping of the production chain is carried out by prioritizing the agent: processing for the citrus agro-industry.
The model proposed in this research is of the mathematical type (Fig. 6). Mathematical because the variables of the model are determined based on statistical tests and through the relations that exists between them. The second shows the actual state of the object at the time of inspection.

The usefulness of the model is to expose the functioning of the associativity in the production chain of the SMEs, and in proposing alternatives to generate greater cooperation or coalition between the enterprises that interact in order to obtain mutual benefits.
ConclusionsMexico is the fifth producer of citruses worldwide, and the state of Veracruz is the most important state in the country for their production. In Veracruz, the northern municipalities of Álamo Temapache, Papantla, Gutiérrez Zamora, and Poza Rica are the main producers and where most of the citrus processing plants are located; despite this, there are no empirical studies on the associativity of the citrus SMEs outside of the descriptive studies of official dependencies.
Previous studies indicate positive associations between the direct agents, environment, support services, relations between producers, and government policies as determinants of associativity. However, in the case of Mexico, both the Pearson correlations and the determination coefficient, the exploratory factorial analysis, and the modeling through structural equations found that in the case of the studied SMEs, only the work of the agents themselves, the support services, and the government policies have influence on associativity. The environment and relations indicated low associations.
The proposed production chain associativity model is a production system where the direct agents that comprise it are the producers of citruses, the agro-industry, the commercialization and the end consumers. The agent that has relevance in the model is the agro-industry, where the citrus agro-industrial SMEs fall into, these being cleaners, packers and waxers (commonly known as packing plants by people from the region), simple juice processing enterprises, juice plants and dehydration plants, and pectin processers. The packing plants receive the inputs from the citrus producers of the region and perform simple agro-industrial processes, that is, they only clean, wash, wax and package the citruses either in bulk (un-waxed) or in wooden boxes (waxed), 98% of which are microenterprises and 2% are small enterprises. Of these citruses, 50% are allocated to the national market, mainly to the central supply market of Mexico City and Guadalajara and to self-service stores such as Wal-Mart, Chedraui, Gigante, and Sams. The remaining 50% is export fruit mainly for the United States, Canada, and France.
Concerning the juice processing enterprises, their inputs come from the citrus producers located mainly in the same city. Their products include fresh juice (mandarin, grapefruit, tangerine, and orange). One-hundred percent of these enterprises are microenterprises comprised of 2–6 employees. Regarding the commercialization of their products, 100% is allocated to the local market, such as restaurants, offices, and the general public.
Concerning the citrus juice processors (commonly known as “juicers” by the inhabitants of the region), the inputs to be processed are bought from the citrus producers of the region, but due to them requiring large quantities (tons) daily for their processing, they must place the orders ahead of time; 100% of these “juicers” are medium enterprises. Their products include: frozen concentrated juice, essential oil, and dehydrated peel (orange, grapefruit, mandarin, tangerine and lemon). The processing or milling level fluctuates between 500 and 250 tons daily in high season and depends on the production capacity of each plant; not all processing plants process the three abovementioned products, some are dedicated only to processing citrus concentrated juice. Regarding concentrated juice and essential oil, 20% of their commercialization is allocated to the national market and 80% to the international market—mainly for the food, pharmaceutical and cosmetology industries—this being mainly to the United States, Holland, Germany, and Israel. Concerning the dehydrated peel, only one of these enterprises dehydrates it and sells it to the ranchers of the region as a balanced food for cattle; this is a 100% local market. In addition, this product is also sold to the peel dehydrating enterprises to extract pectin or is tossed in wastelands, rivers, and streams, contaminating the environment.
Regarding the peel dehydrating plants, 100% (2 enterprises) are small enterprises, and their inputs are obtained from juicer plants—this being the fresh peel or husk—and are dehydrated by these enterprises to obtain pectin. Fifty percent of the commercialization of their products is allocated to the national market and the remaining 50% is allocated to the international market for the food, pharmaceutical, and cosmetology industries.
Comprised in the regions of: Huasteca Baja and Totonaca, which are the areas where most of the citrus production and processing agro-industries are found.
Peer Review under the responsibility of Universidad Nacional Autónoma de México.
Consisting of 22 simple juice microenterprises, 24 micro and small citrus cleaning, waxing and packaging enterprises, and 7 small and medium concentrated juice, essential oil, dehydrated peel, and pectin processing enterprises.
The measuring scale has values of 5–1.
When a variable in the LISREL program is sub-divided into dimensions, the program proceeds to calculate a Cronbach Alpha global coefficient for each variable, as the case may be, instead of calculating one for each construct.