


The ultraviolet–visible, UV–vis, absorption edge behaviour of semiconductor oxides as TiO2 and ZnO promotes their use as inorganic UV filters for sunscreens. In cosmetics, the use of nanoparticles is favoured because of their higher yield and lower whiteness. However, the particle size effect in the UV absorption is unclear. For this reason, the performances of nano and microsized TiO2 and ZnO are evaluated in both the UV–vis spectroscopy and the Sun Protection Factor, SPF, value. In order to cover the UV range completely by using inorganic filters a new composite is attempted by dry nanodispersion methodology in which TiO2 nanoparticles are dispersed onto ZnO microparticles. The new composite shows superior UV absorbing properties and ca. 60% SPF value due to a synergism between components that resulted in extended UV coverage and reduction of the total amount of nanoparticles required in the sunscreens. In addition, nanoparticles are effectively anchored onto microparticles avoiding the presence of free nanoparticles.
El comportamiento del borde de absorción ultravioleta-visible de óxidos semiconductores como el TiO2 y el ZnO incentiva su uso como filtros inorgánicos para luz UV en cremas solares. En cosmética, el uso de nanopartículas está favorecido por el alto rendimiento que presentan y la baja blancura que aportan a la crema en comparación con las micropartículas. Aun así, el efecto del tamaño de partícula en la absorción de luz en el rango UV no está claro. Por esta razón, el comportamiento de nano y micropartículas de TiO2 y ZnO se evalúa mediante espectroscopia de luz UV-Visible y mediante el factor de protección solar en cremas. Con el fin de cubrir las necesidades de absorción de luz en todo el rango UV mediante el uso de filtros inorgánicos, se ha generado un nuevo composite mediante un proceso de nanodispersión en seco en el que nanopartículas de TiO2 se encuentran dispersas sobre micropartículas de ZnO. El nuevo composite presenta propiedades de absorción UV superiores al 60% en lo que al valor de protección solar se refiere. Este hecho es debido a la sinergia entre los componentes de forma que se cubre el rango UV de manera efectiva requiriendo una menor cantidad total de nanopartículas. Dichas nanopartículas se encuentran dispersas de manera efectiva sobre las micropartículas, evitando la presencia de nanopartículas libres.
Semiconductor ZnO and TiO2 are usually used in many sectors due to their functional properties. ZnO is a direct wide band gap semiconductor with a large exciton binding energy of 60 meV ([1]) commonly used as: optical devices, sensors, solar cells, thin film piezoelectric ([2]), bactericide and photocatalytic material ([3]), etc. In a similar way, TiO2 is widely used as a semiconductor photo-catalyst because of its long-term stability, non-toxicity and good photocatalytic activity ([4]). The photocatalytic function and their ability to absorb UV radiation cause them to be used as solar filters in sunscreens ([5], [6]). They are frequently employed in sunscreens as inorganic physical sun blockers for the UV radiation.
UV light represents ca. 10% of the sunlight. UVA consists of radiation in 320 nm < λ < 400 nm range whereas UVB consists of radiation in 290 nm < λ < 320 nm range ([7]). UVC (λ < 290 nm) is covered by the Ozone Layer of the atmosphere. Regarding the sunscreen applications, the European Union Normative (ISO 24443) ([8]) establishes that both UVA and UVB ranges must be adequately covered against the radiation. The inorganic solar filters (mostly TiO2 and ZnO pigments) block UVA radiation and most of the organic filters only protect from the UVB radiation. For this reason, sunscreens use to be formulated by a combination of organic and inorganic solar filters ([9]). In order to ensure a correct complete protection, the ISO normative requires a UVA protection factor ≥1/3 of the UVB protection factor. From this ratio, it should be considered also a higher ‘Critical wavelength’ as the wavelength for which the section under the integrated optical density curve between 290 nm and 370 nm is equal to 90% of the integrated section between 290 nm and 400 nm ([10]).
Sunscreens incorporating inorganic filters as TiO2 and ZnO minerals use to be white and opaque. In fact, mineral pigments are used because of their whiteness characteristics. However, to solve the cosmetic drawback of the opaque sunscreens, microsized TiO2 and ZnO have been increasingly replaced by TiO2 and ZnO nanoparticles ([11]). This fact allows increasing the performance of the inorganic filters in sunscreens. In this way, the yield of protection increases and the undesired opaqueness, which is provoked by microparticles, disappears. However, smaller particles as nanoparticles have higher specific surface and reactivity that could potentially have toxic health effects associated with human exposure. Skin exposure to nanoparticles-containing sunscreens could lead to their incorporation into the stratum cornea, ([12]) the outer layer of the skin. For this reason, studies about nanoparticles cream distribution ([13]) and penetration ([14]) on the skin are attempted. Nanoparticles can be moved anywhere on the body, going through cell membranes and damaging the genetic material ([15]). However, it is unlikely that the cutaneous application has these effects ([6]). An actual applied solution is the formation of composites in which nanoparticles bond by using Al(OH)3, xylanes, etc. ([16]).
Other drawback of ZnO and TiO2 nanoparticles is that they induce free radical formation under light exposure. This free-radical generation may cause cell damage (photo-genotoxicity). It is reported ([17]) that UV-induced reactive oxygen species have been implicated in photocarcinogenesis and skin ageing. These species used to be hydroxyl groups and superoxyde after the photocatalytic reactions ([18]). In order to avoid the formation of free-radicals, there is a tendency regarding the covering of nanosized TiO2 and ZnO by different materials as colloidal silica ([19], [20]).
In this scenario, the aim of this work is to study the behaviour of microparticles and nanoparticles of TiO2 and ZnO as UV absorbers materials for sunscreens. From this knowledge a new micro–nano composite by using a dry nanodispersion methodology is evaluated. Nanoparticles are dispersed and hosted onto microparticle surface, in order to improve the yield of the UV filter by synergetic effect between both particle sizes. In addition, the new micro–nano composite reduces notably the nanoparticles content and minimized their potential toxicity effects.
Experimental procedureTwo types of nanoparticles and microparticles of TiO2 and ZnO inorganic filters were studied. TiO2 microparticles (Thann et Mulhouse, France) and nanoparticles (TECNAN, Navarra, Spain) having an anatase structure were selected. Meanwhile TiO2 microparticles were obtained from the thermal treatment of metatitanic acid ([21]), the nanoparticles were obtained following a spray pyrolysis procedure ([22]). ZnO microparticles (Asturiana de Cinc, Spain) and nanoparticles (EVONIK, Germany) having an wurzite structure were selected because both were obtained following a French-based process ([23]).
The composite was prepared by using 15 wt.% of TiO2 nanoparticles and 85 wt.% of ZnO microparticles. A dry nano-dispersion methodology ([24]) was followed in order to obtain the new composite.
Particle size distribution of the powders was evaluated by DLS. In the case of nanoparticles a Zetasizer Nano NS equipment (Malvern S, UK) with a 633 nm laser was used after preparing the suspensions at pH = 3.5 applying Ultrasonic; and by laser diffraction instrument Mastersizer S for microparticles.
BET specific surface was measured with an ASAP 2020 (Accelerated Surface Area and Porosimetry System) equipment from Micromeritics.
UV–vis diffuse reflectance spectra of the samples were recorded using a Perkin Elmer Lambda 650 UV–Vis spectrophotometer. The Kubelka–Munk function was used to transform the results from diffuse reflectance to absorbance. The points were measured every 2 nm each second. The band gaps were calculated from Tauc plot, taken into account the absorbance converted by Kubelka–Munk function.
Raman spectra were obtained by using a micro-Raman system with a 532 nm excitation laser and an 50× objective. The incident laser power was 0.5 mW and the optical resolution diffraction of the Confocal microscope was limited to 200 nm laterally and 500 nm vertically. Collected spectra were analysed with the Witec Control Plus Software (Witec, Ulm, Germany).
To study the morphology and the corrected dispersion of the nanoparticles over the microparticles, the obtained UV filter composite was observed by using a Scanning Electronic Microscope TM1000 from Hitachi.
To study the performance of the developed UV filter, a sunscreen cream was prepared following the manufacturing method of The European Cosmetics Association, COLIPA. The sunscreen formula is showed in Table 1. The manufacturing process of the sunscreen consists of melting the ingredients of the fatty phase at 80 °C and adding it to the aqueous phase (previously heated at 80 °C) under stirring. The inorganic UV filter (10 wt.%) was added to the aqueous phase. The mix was cooled down to room temperature under stirring.
Table 1. Formulation of sunscreen from COLIPA.
| Ingredients | wt% | |
| Fatty phase | Lanolin | 4.5 |
| Cocoa butter | 2.0 | |
| Glyceryl stearate | 3.0 | |
| Stearic acid | 2.0 | |
| Aqueous phase | Water | 72.0 |
| Sorbitol | 5.0 | |
| Triethanolamine | 1.0 | |
| Benzyl alcohol | 0.5 | |
| UV filter | TiO2/ZnO | 10.0 |
The SPF of the sunscreen was measured by an in vitro test. Three PMMA plates of 50 mm × 50 mm were prepared for each product to be tested and nine measurements were performed on each plate. 2 mg/cm2 of sunscreen were spread with a coated finger. Transmission measurements between 290 and 400 nm were carried out using a spectrophotometer UV Transmittance Analyzer UV1000S, Labsphere, North Sutton, US. The SPF values were obtained according to the following formula (Eq. (1)) ([25], [26]):
Table 2 shows the specific surface area BET, the particle size obtained by light scattering and the UV absorption edge of the different materials under study. The particle size distribution of the samples is represented in Fig. 1. Equivalent particle sizes for both nanometric and micrometric particles were selected for both metallic oxides in order to compare the effectiveness of ZnO and TiO2. In this way, similar synthesis process for each oxide has been also selected in order to have comparable materials.
Table 2. Characterization of ZnO and TiO2 particles.
| Particle | Specific surface area BET (m2/g) | DLS particle size D(v,0.5) (μm) | UV absorption edge (nm) |
| Micrometric TiO2 | 6.2 | 1.60 | 391 |
| Nanometric TiO2 | 104.6 | 0.019 | 357 |
| Micrometric ZnO | 4.8 | 1.42 | 377 |
| Nanometric ZnO | 22.0 | 0.011 | 377 |
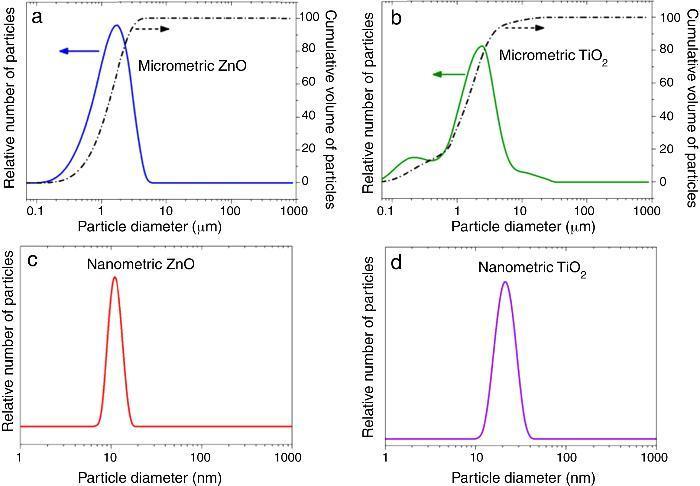
Fig. 1. Particle size distribution of (a) micrometric ZnO, (b) micrometric TiO2, (c) nanometric ZnO, and (d) nanometric TiO2.
The ratio between the specific surface area and the particle size indicates the agglomeration state of the power. The particle size of nanometric ZnO is smaller than the nanometric TiO2 one but the ratio between the specific surface area and the particle size for TiO2 is quite larger. This fact could is related to a higher agglomeration state of the nanosized TiO2. The intensive deagglomeration by ultrasonic followed to obtain a measurable suspension for the DLS technique produce a homogeneous distribution of the nanoparticles. However this deagglomeration is not commonly attained in sunscreens because of their high solid content and viscosity.
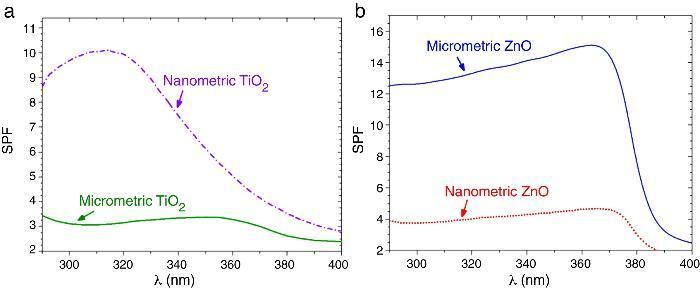
The UV–vis absorption curves of the samples from UV–vis spectroscopy are shown in Fig. 2. The curves for TiO2 UV filters are represented in Fig. 2a. The particle size influences the UV absorption edge ([27]). So, the absorption edge of nanometric TiO2 blue-shifts by 34 nm and the corresponding bandgap increases from 3.15 eV (micrometric TiO2) to 3.37 eV (nanometric TiO2), in a direct allowed transitions according to Tauc plot. In the same way, the absorption edge for nano and microsized ZnO are represented in Fig. 2b. The difference on the absorption edge with the particle size is not observed, contrary to what other authors suggest ([28]). This time, also a direct allowed transition was the best adjustment for Tauc plot. As the obtaining process is similar for both ZnO UV filters, it can be assumed that the particle size in this case possesses low impact in the crystalline structure and that defects are quite similar. This probably provokes no differences in the UV absorption edge and the band gap remains as ∼3.20 eV.
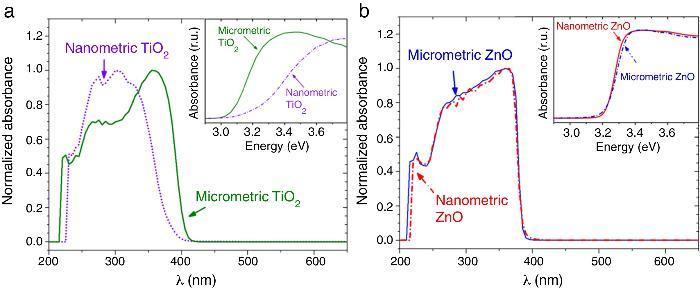
Fig. 2. UV–vis absorption spectra of the nanometric (dashed lines) and micrometric (solid lines) UV filters: (a) TiO2 and (b) ZnO. The insets represent their corresponding plots of transformed Kubelka–Munk function versus the energy of light.
SPF curves of the COLIPA sunscreens having TiO2 and ZnO UV filters can be seen in Fig. 3. Micrometric TiO2 UV filter has a maximum of absorption at λ ≈ 360 nm with a low yield. Nanometric TiO2 UV filter shows the maximum of SPF at λ ≈ 319 nm with high yield. Both nanometric and micrometric ZnO particles present a maximum of SPF curve at λ ≈ 368 nm, with clear yield differences. In this case, micrometric ZnO particles have higher SPF value than nanosized ZnO particles. The observed difference in the performance of the inorganic UV filters could be then correlated with their dispersion into the sunscreen. The values for λcrit vary depending on the sample (Table 3). ZnO samples present higher λcrit because they cover completely the UV range, and UVA/UVB ratio is higher because the maximum of the SPF curve is in the UVA range. Nevertheless UVA/UVB ratio for TiO2 UV filters decreases because the maximum of SPF occurs at lower λ and so, the λcrit decreases.

Fig. 3. SPF curves of COLIPA sunscreen incorporating inorganic UV filter: nanometric (dashed lines) and micrometric (solid lines) of (a) TiO2 and (b) ZnO particles.
Table 3. Characteristics data of the SPF curves for sunscreens micro–nano composite UV filters obtained by dry nanodispersion method and by a standard method.
| Standard method | Dry dispersion method | |||
| Value | STDV | Value | STDV | |
| SPF | 5.7 | 1.1 | 9.1 | 1.0 |
| Crit. wavelength | 385.0 | 0.3 | 383.3 | 1.3 |
| UVA/UVB ratio | 1.05 | 0.03 | 0.87 | 0.02 |
From the differences of SPF behaviour observed in Fig. 3 between inorganic filters, it is possible to increase the SPF yield by a combination of nanometric TiO2 and micrometric ZnO. Since the absorbance is cumulative, a correct dosage of the oxide would cover the UV range in an effective way. In order to obtain a composite UV filter the Saltikov ([29]) formula is used (Eq. (2)):


The objective for the composite is to cover completely the surface of ZnO microparticles in order to obtain an effective UV filter which presents the maximum SPF curve. In Saltikov formula, the volume of the material is used. By using density values, it is possible to know the weight necessary of each oxide accordingly with the following expression (Eq. (3)):
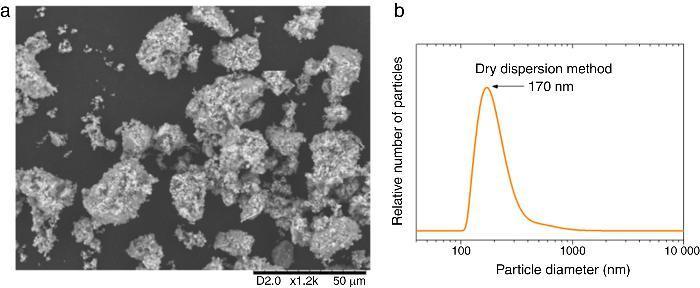
According to this formula, the new UV composite should be composed by ∼15 wt.% of TiO2 nanoparticles and ∼85 wt.% of ZnO microparticles. A dry dispersion method ([24]) was used for the preparation of the new composite that will be used as inorganic sunscreen filter. In Fig. 4, micrographs from SEM of the formulated UV composite filter are shown. Agglomerates up to ∼30 μm are observed and the composite ranged as micrometric particles. The DLS measurement of the new UV composite filter confirms the absence of free nanoparticles (Fig. 4b). A diluted suspension of the UV composite filter is prepared applying ultrasonic bath to favour the dispersion but no particles below 100 nm are observed and thus the composite could be classified as nano-free.

Fig. 4. (a) SEM micrograph of the new UV composite filter. (b) DLS particle size measurement of the new UV composite filter obtained by the dry dispersion method.
Micrometric ZnO particles, nanometric TiO2 particles and the new UV composite were studied by Raman spectroscopy (Fig. 5). Raman active zone-center optical phonons predicted by the group theory for ZnO are A1, 2E2 and E1 ([30]). The phonons of A1 and E1 symmetry are polar phonons and, hence, exhibit different frequencies for the transverse-optical TO and longitudinal-optical LO phonons. Non-polar phonon modes with symmetry E2 have two frequencies, E2(High) is associated with oxygen atoms and E2(Low) is associated with Zn sub-lattice ([31]). In nanostructures, these modes present Raman shift due to the local heating of the sample or to the special confinement. Anatase has six active Raman modes: A1g + 2B1g + 3Eg ([32]).
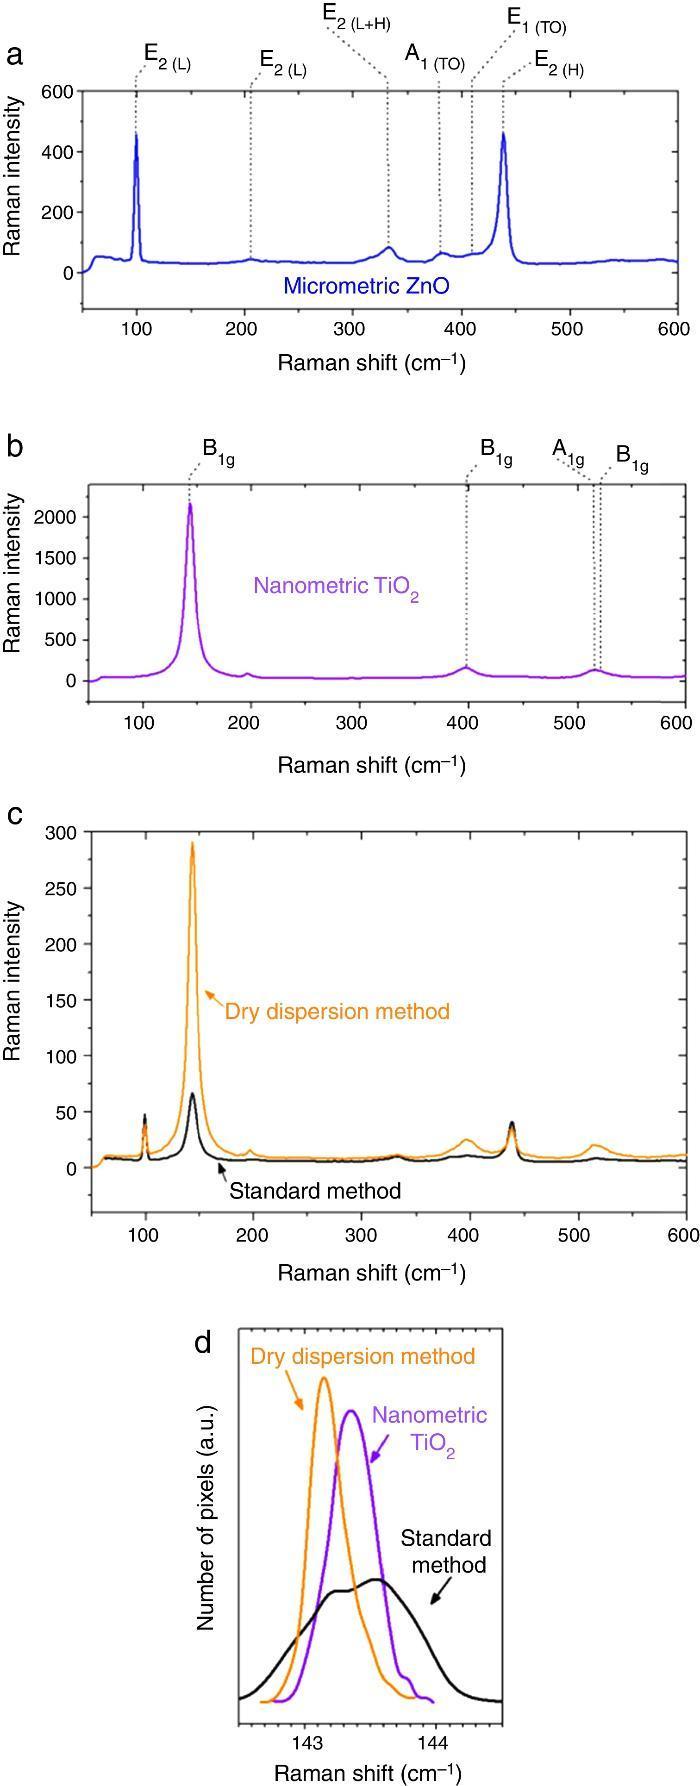
Fig. 5. Raman spectra of (a) micrometric ZnO, (b) anatase nanometric TiO2 raw material, and (c) composites by dry dispersion method and mixed oxides by the standard method compared with the anatase nanometric TiO2 raw material. (d) Statistic distribution of the Raman shift for B1g Raman mode for both dispersion methods in comparison with the raw material.
Differences were observed in the Raman spectra of oxides which were mixed by a standard method and by a dry nanodispersion method (Fig. 5c). When both spectrum are normalized to the E2(L) mode of ZnO (∼100 cm−1), it is observed that the intensity of the TiO2 Anatase Raman spectrum increases for the composite obtained by using the nanodispersion method. This is correlated with a preferential location of the nanoparticles onto the microparticles surface ([33]). Raman spectroscopy provides clues of the dispersion degree of nanoparticles onto microparticles. Moreover, Raman spectroscopy gives relevant information about the proximity effect derived from the nanodispersion.
In addition of the particle size the Raman shift is affected by the agglomeration state ([34]). Proximity effects of the nanoparticles with dissimilar material provoke Raman shifts in their spectrum ([35]). The statistic distribution of the Raman shift regarding the main Raman mode of TiO2 is compared in Fig. 5d. For sake of comparison the Raman spectra were collected by using same laser powders and an average of 5000 spectra that correspond to surface Raman images of 50 μm × 50 μm. The distribution was realized by the dates collected pixel by pixel. There is a red shift of the B1g of 0.2 cm−1 for the new UV composite filter obtained by the dry nanodispersion method. The signal corresponding to the standard dispersion method splits into two distribution bands that reveal unequivocally the heterogeneity and different agglomeration of nanoparticles. The red shift of the TiO2 in the new UV composite is related to higher quantum confinement effect that correlated with the nanoparticles anchoring onto host ZnO microparticles. Meanwhile most inorganic oxides exhibited Raman blue shift when quantum confinement is achieved, the TiO2 exhibited Raman red shift which is attributed to the high effective mass of its charge carriers ([36]). This fact shows that the effects of proximity between the two crystal sublattices produce a modification in the crystal structure and thereof the optical response is changed. To sum up, Raman spectroscopy confirms an effective dispersion of the nanoparticles and anchoring of nanoparticles with higher quantum confinement as a result of the dry nanodispersion by using micrometric ZnO as host particles. So, the dry dispersion method is more effective that the standard method because the SPF value is higher for the sunscreen which was formulated with the filter that was prepared by dry dispersion method. The reason is because TiO2 nanoparticles are correctly dispersed over the host ZnO microparticles. It is demonstrated by the synergism of the nano-and microparticles that is related to the Raman shift of the nanoparticles which depends on the agglomeration state.
Sunscreens with 10 wt.% of composite filter are formulated and the SPF is measured to confirm the effectiveness of the dry nanodispersion method versus the standard method (Fig. 6). The curve for the sunscreens with the composite UV filter obtained by the standard method exhibits two relative maximum points which correspond to the presence of nanometric TiO2 and micrometric ZnO filters. The UV absorption is thus and additive effect for the standard method revealing lack of interaction between them. An increase of the SPF yield is clearly observed by incorporation of the new UV composite into the sunscreens that highly the synergism between micrometric and nanoparticles filter as stated previously by the Raman spectroscopy.
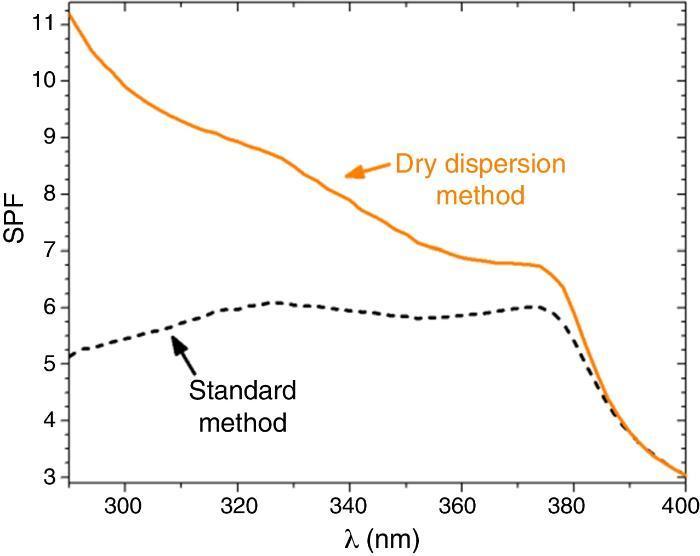
Fig. 6. SPF curves of sunscreens with micro–nano composite filters. Straight line represents the SPF curve of new micro–nano composite obtained by nanodispersion method and dash line by a standard method.
The SPF, λcrit and UVA/UVB ratio values of sunscreens with the two composite filters are compared in Table 3. The SPF value increases from 5.7 to 9.1 when the dry nanodispersion method is applied. The λcrit is nearly similar in both cases accordingly with the covering area of ZnO, and ZnO is barely affected by the dispersion method. In addition, UVA/UVB ratio values of the sunscreens satisfy with ISO normative. The UV absorption yield of the new UV composite is enhanced by the dry nanodispersion method as a result of the quantum confinement of nanoparticles. The dispersion method effectively anchored TiO2 nanoparticles onto ZnO microparticles, and allows effectiveness for UV blocking functionality. There is an increase of the SPF value of ca. 60% that empowers a higher efficiency of the new UV filter composite in sunscreens. In addition, the composite is a nano-free UV filter that it is easy to handle and it is a step forward towards safer UV filters to health and the environment.
ConclusionsIn this work the absorption edge from ultraviolet–visible spectra related TiO2 and ZnO particles has been compared taken into account their micro–nano dimensionality. Similar UV absorption edge and Solar Power Factor, SPF, values are observed for ZnO particles independently of their particle size. While in the case of TiO2 particles both the UV absorption edge and the SPF are greatly influenced by the particle size. High UV absorption yield is obtained for nanometric TiO2 nanoparticles.
A new composite combining 15 wt.% nanoparticles of TiO2 and 85 wt.% of ZnO microparticles by using a dry dispersion method improve in ca. 60% the SPF value when compared with a standard method. The higher UV absorption yield of the new composite is attained by the crystalline modification of the TiO2 nanoparticles that anchor onto ZnO microparticles as confirmed by the Raman spectroscopy. The Raman shift distribution of the main active Raman mode for TiO2 confirms the homogeneity of the new UV composite. Dynamic light scattering measurement of the new composite shows that it is a nano-free UV filter with easy to handle characteristics. The new UV composite filter is a step forward towards safer UV filters to health and the environment.
Acknowledgements
The authors express their thanks to the MINECO project MAT2013-48009-C4-1-P for their financial support. P. Leret is indebted to MINECO for a “Torres Quevedo” contract (ref: PTQ-12-05470) and C.M. Alvarez-Docio for a FPI grant, which are co-financed with FEDER funds.
Appendix A. Supplementary dataSupplementary data associated with this article can be found, in the online version, at doi:10.1016/j.bsecv.2016.01.004.
Appendix A. Supplementary dataThe following are the supplementary data to this article:
Received 30 November 2015
Accepted 19 January 2016
Corresponding author. jjreinosa@icv.csic.es
