


A full factorial design was used to evaluate the effect of various preparation conditions for making plaster molds for slip casting of sanitary ware. We investigated the relationships between the processing conditions, microstructure, and final properties of the plaster molds. The results showed that the rheological behavior, and hence, the time during which the plaster suspension is pourable for making the plaster molds (before an important increase in viscosity due to the precipitation of gypsum crystals) were dependent on the preparation conditions. Variations in the chemical composition, pore size distribution, and microstructure explained the statistically significant effect of preparation variables (including the mixing time, water temperature, and water quality). Preparation conditions that promoted high initial viscosity of the plaster suspension (accelerative effect of the setting time) developed less porous structure in the mold that principally increased the compressive strength (16%, deionized water instead of tap water) and the casting rate (9%, water at 25°C instead of 38°C). According to the results are proposed optimum conditions to make the molds while avoiding unnecessary energy use.
Mediante un diseño factorial completo se evaluaron diferentes condiciones de preparación de moldes de yeso para colado tradicional de muebles sanitarios. Se investigó la relación entre procesamiento, microestructura y propiedades del molde. Los resultados mostraron que el comportamiento reológico y por lo tanto el tiempo durante el cual la suspensión de yeso se puede verter para conformar los moldes (antes de un incremento importante de viscosidad debido a la formación de cristales de yeso) fueron dependientes de las condiciones de preparación. Variaciones en composición química, distribución de tamaño de poro y microestructura explicaron el efecto estadísticamente significativo de las variables de preparación (que incluyeron tiempo de agitación, temperatura del agua y calidad del agua). Variables de preparación que promovieron viscosidades iniciales altas de la suspensión de yeso (efecto acelerante de fraguado) desarrollaron moldes menos porosos, con lo cual principalmente se incrementaron la resistencia a la compresión (16% con agua desionizada en lugar de proceso) y la formación de espesor (9% con agua a 25°C en lugar de agua a 38°C). De acuerdo a los resultados, se proponen las mejores condiciones de preparación, tomando en cuenta además evitar el uso innecesario de energía.
Slip casting using plaster molds is a traditional method for producing ceramic sanitary ware. Although the technological efficiency of pressure casting processes using polymer molds has been demonstrated for producing ceramic sanitary ware, significant efforts to improve slip casting using plaster molds continue as it remains a popular method due to its low production cost [1]. Plaster molds are generally made from commercial plaster or calcium sulfate hemihydrate (CaSO41/2H2O) which is obtained by heating naturally occurring gypsum (calcium sulfate dihydrate; CaSO42H2O) at temperatures ranging from 150 to 200°C [2]. When the plaster is mixed with water to form the molds, calcium sulfate dihydrate is reformed and during setting, produces a rigid final product [3]. Most researchers agree that the hydration of plaster leading to the formation of calcium sulfate dihydrate occurs through a solution mechanism [4], thus the hemihydrate first dissolves and then the dihydrate crystals precipitate from the aqueous solution as it is less soluble than the hemihydrate (0.2wt.% dihydrate vs. 0.65wt.% hemihydrate can dissolve in water at 25°C [5,6]). Therefore, when hemihydrate is mixed with water, a part of it immediately dissolves, saturating the solution with Ca2+ and SO42− ions. This saturated solution becomes supersaturated with respect to calcium sulfate dihydrate, leading to nucleation and crystal growth [4].
Studies have shown that the physical properties of the plaster molds are influenced by their preparation conditions; Whiteside [7] and Lynch [8] both suggested that process variables affecting the performance of the molds, such as water quality, water temperature, mixing time, and the pouring and drying procedures should be standardized to produce more uniform plaster molds. In addition, Smith and Lange [9] evaluated different mixing methods (continuous and batch processes) and drying conditions (air and oven drying) to prepare plaster molds, and observed a dependence of the porosity (higher porosity with continuous mixing and air drying), microstructure, and physical properties on these factors.
An important property which measures the development of rigidness, due to the hydration of calcium sulfate hemihydrate, is the setting time. In the works of the last paragraph regarding the effect of preparation conditions was evaluated the setting time with the use of Vicat apparatus, which requires some rigidness to be performed, hence in those works was monitored the setting time when the precipitation of gypsum crystals had been begun. With the advance in technology, has been possible to monitor the setting time of the plaster suspension before the precipitation of gypsum crystals (in the ions dissolution stage) with the use of rheometric techniques [10–14], by studying the rheological behavior of the plaster suspension as a function of time. However, no relevant information was found regarding the effect of preparation conditions on the rheology of the plaster suspensions to make plaster molds.
The early stage of ions dissolution is important to the present study, due to properties of the initial plaster suspension are related to the quality of the final plaster mold and with the working time. Smith and Lange [9] mentioned the property of working time as the time during which the plaster suspension is pourable (including the fluid and plastic states) to make the plaster molds. To date, the working time was estimated with values in the range of one-half to two-thirds of the setting time (measured using the Vicat needle method) depending on the mixing parameters and plaster formulation to make the molds [9]. In this work, through viscosity curves as a function of time, measured with a rotational rheometer, is proposed a more accurate approximation of the working time, by identifying a time with an abrupt increase of viscosity, where the suspension lose its flow properties.
The analysis of literature revealed that the mixing time, water quality, water temperature, and drying method are the most important preparation variables for batch processing of plaster molds. However, to date, these variables have been studied using traditional experimental methods where each factor was varied systematically, and without considering the flow properties of the plaster suspension. According to this, the current methods to produce plaster molds for slip casting may be adequate to produce a satisfactory product, but they do not necessary represent the optimum with respect to the properties of the plaster suspension and mold. In the present work, the preparation variables have been investigated using a full factorial design considering literature values to define the ranges of interest. The use of factorial design allows researchers to obtain new information about the data set, as the interaction between variables can be clarified and the variables can be classified in order of their main effects. With the use of a rotational rheometer, in the present study was possible to determine the flow behavior of the plaster suspension, and correlate it with the microstructure and properties of plaster mold for slip casting; this information made possible to elucidate the better conditions to prepare the plaster molds.
Materials and methodsA commercial plaster (Ultramold Plus®, USG, Mexico) used in industry to produce sanitary ware was employed here. To produce the plaster suspension, water with two different qualities was used; tap water (hard water with a total dissolved solid of 1021.55mg/L measured according a national standard [15]) and commercial deionized water. The sanitary ware slip had a density of 1.82g/cm3 and viscosity of 0.52Pas and was processed at a temperature of 32°C. To measure the casting rate, this ceramic slip was poured into a plaster mold cavity with a diameter of 20cm and a depth of 1.5cm; after 60min, the excess slip was removed and discs with a diameter of 7.2cm were cut from the sample and weighed. This procedure was suggested by the quality control department of the industrial supplier of the ceramic slip. Considering the casting rate as the mass formed at a constant area (40.7cm2) and time (3600s), the results of casting rate are presented in units of g/scm2, using the exponential notation (10−4) to reduce the decimal fraction.
To prepare the plaster molds, 14L batches of a water/plaster mixture were made for each experiment with a concentration of 82 parts water per 100 parts of plaster. First, the plaster was added to the water (deionized or tap water depending on the experimental run), left to soak for 1min, and then mixed for either 2 or 5min at 316rpm. The plaster suspension was finally poured into acrylic matrix molds to form the plaster molds. At the same time, 2.5mL of the plaster suspension was sampled for rheological measurements.
The mechanical properties of the plaster molds were determined using cubic samples with sides of 5cm employing a Controls Digmax3 machine with 180tons of maximum capacity. To determine the rheological behavior of the plaster suspensions, viscosity curves were obtained using a controlled-stress rheometer (AR2000, TA Instruments, U.K.) with a cone-and-plate configuration and a constant shear rate of 100s−1. The pore volume distribution was determined using a mercury pycnometer (Autopor IV, Micromeretics, USA). Infrared spectrometry studies were carried out using an FT-IR spectrometer (Jasco 4000, USA). Micrographs of fracture surfaces (obtained after breaking the cubes used for the compressive strength tests) were obtained using a scanning electron microscope (SEM; Philips model XL 30 ESEM) with secondary electron detection.
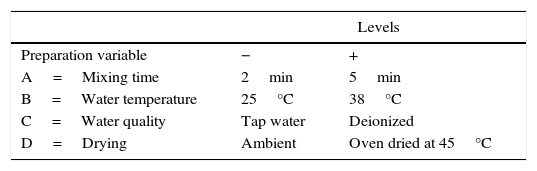
Experimental designIn order to evaluate the effect of the different preparation variables, a 24 full factorial design was used. Table 1 shows the preparation variables and the different values used.
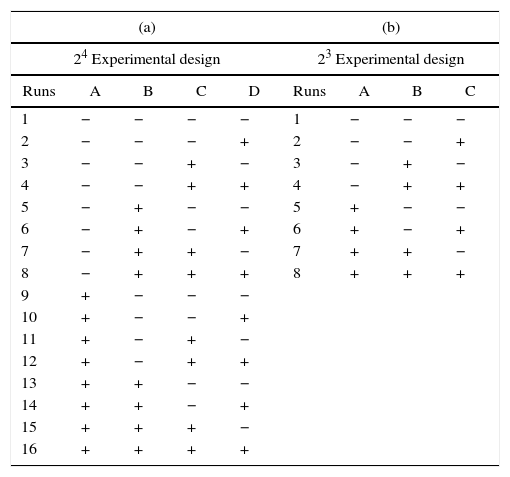
In the 24 factorial design used in the present study, the numeral 2 represents the number of values of each preparation variable, and the exponent 4 indicates the number of preparation variables. The 24 full factorial design required 16 experimental runs, as shown in Table 2a, where the positive and negative signs correspond to the upper and lower values of the variables, respectively. The pattern distribution of the signs followed the Standard or Yates’ denomination [16] and was designed to elucidate the effect of the studied variables and the interactions between them using mathematical manipulation of the experimental results. It is common to use statistical software to analyze such experimental data, and in this work, MINITAB 17® was employed. The order of performing the tests was chosen randomly to avoid possible systematic uncertainties.
Factorial designs utilized for the analysis of the information to the present study.
| (a) | (b) | |||||||
|---|---|---|---|---|---|---|---|---|
| 24 Experimental design | 23 Experimental design | |||||||
| Runs | A | B | C | D | Runs | A | B | C |
| 1 | − | − | − | − | 1 | − | − | − |
| 2 | − | − | − | + | 2 | − | − | + |
| 3 | − | − | + | − | 3 | − | + | − |
| 4 | − | − | + | + | 4 | − | + | + |
| 5 | − | + | − | − | 5 | + | − | − |
| 6 | − | + | − | + | 6 | + | − | + |
| 7 | − | + | + | − | 7 | + | + | − |
| 8 | − | + | + | + | 8 | + | + | + |
| 9 | + | − | − | − | ||||
| 10 | + | − | − | + | ||||
| 11 | + | − | + | − | ||||
| 12 | + | − | + | + | ||||
| 13 | + | + | − | − | ||||
| 14 | + | + | − | + | ||||
| 15 | + | + | + | − | ||||
| 16 | + | + | + | + | ||||
With respect to the properties of the plaster suspension, we considered that the drying conditions only have an effect when the mold is completely rigid, i.e. this variable cannot affect the rheology of the plaster suspension. Hence, by eliminating column D (drying conditions) in Table 2a, it can be seen that experimental run 1 is identical to run 2, and run 3 is identical to run 4, etc. Therefore, considering the properties of the plaster suspension and combining the identical runs as replicates, we obtained a 23 factorial design with only eight different runs (Table 2b); this was used to assess the effect of three preparation variables (mixing time, water temperature, and water quality) on the rheology of the plaster suspension.
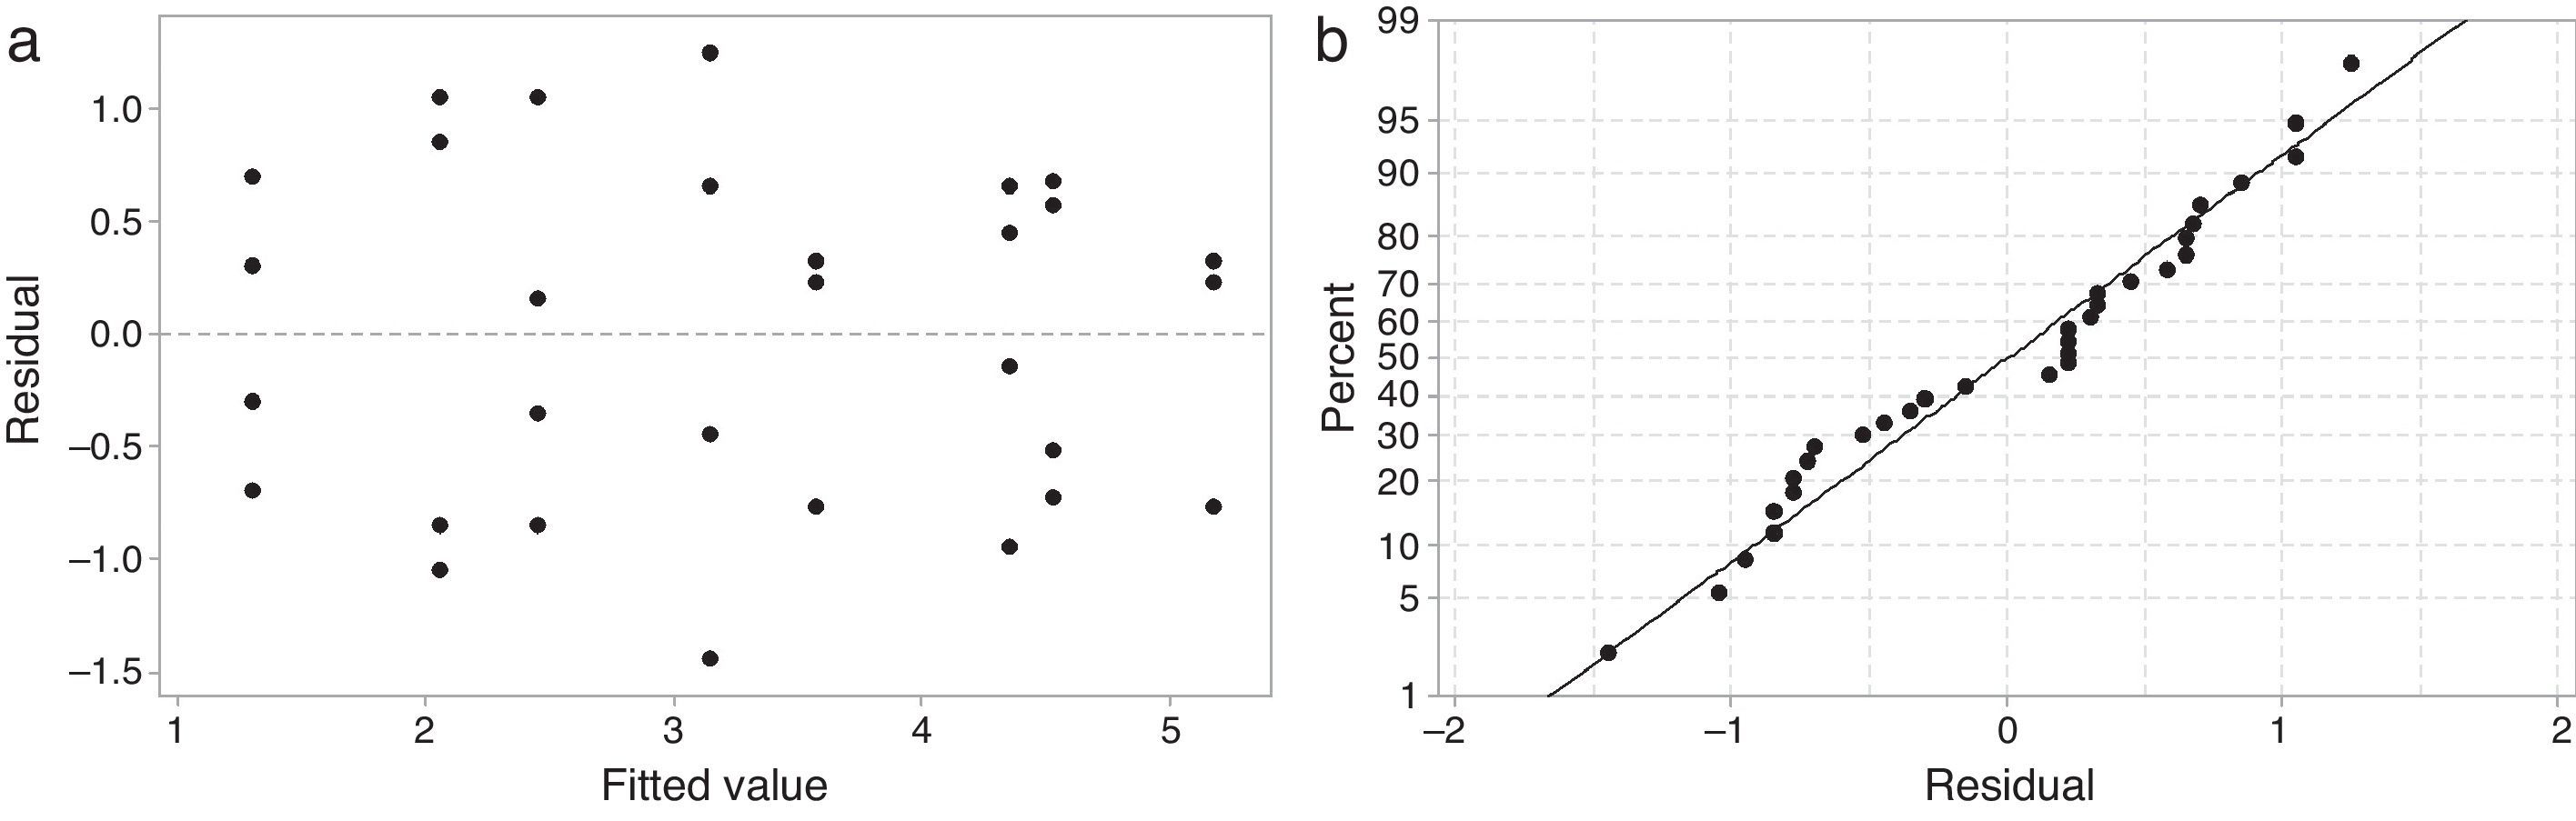
Results and discussionAnalysis of varianceTo validate the analysis of variance (ANOVA), plots showing the residual versus predicted values and the normal probability of the residuals must be examined [16]. Fig. 1 shows the analysis of the residuals of working time. The plot of the residual versus predicted response shown in Fig. 1a is random and does not have a structure (there is no obvious pattern indicating an unwanted influence on the experimental results). The plot of the normal probability of the residuals shown in Fig. 1b is a straight line, indicating that the residuals were distributed normally. Similar plots were obtained for all other analyzed output responses.
 distribution of residual versus predicted values and (b) normal probability plot of the residuals.")
Generally, ANOVA is presented as a table that is used to evaluate the contribution of different variables to the total variability in a system using the sum of squares (SS) of each source of variation (here, the preparation variables and their experimental errors). ANOVA tables also report the parameter median square (MS) which considers the degrees of freedom (DF) using MS=SS/DF to compare the variation of each factor with the variation of the experimental error in the F-value (i.e., the median square of each factor among the median square of the experimental error). Higher F-values indicate more significant effects, while values close to one mean that the effect is close to the experimental error and therefore negligible. Finally, the P-value reported in an ANOVA table is a parameter related to the F-value through a mathematic function, representing the probability that the observed data occur randomly in the absence of any real effect; a P-value of 0.05 means that there is only a 5% probability of observing the result without a real effect (i.e., the effect is statistically significant with a 95% level of confidence [16]). In the present work, the ANOVA tables show only the preparation variables with statistically significant effects (P<0.05).
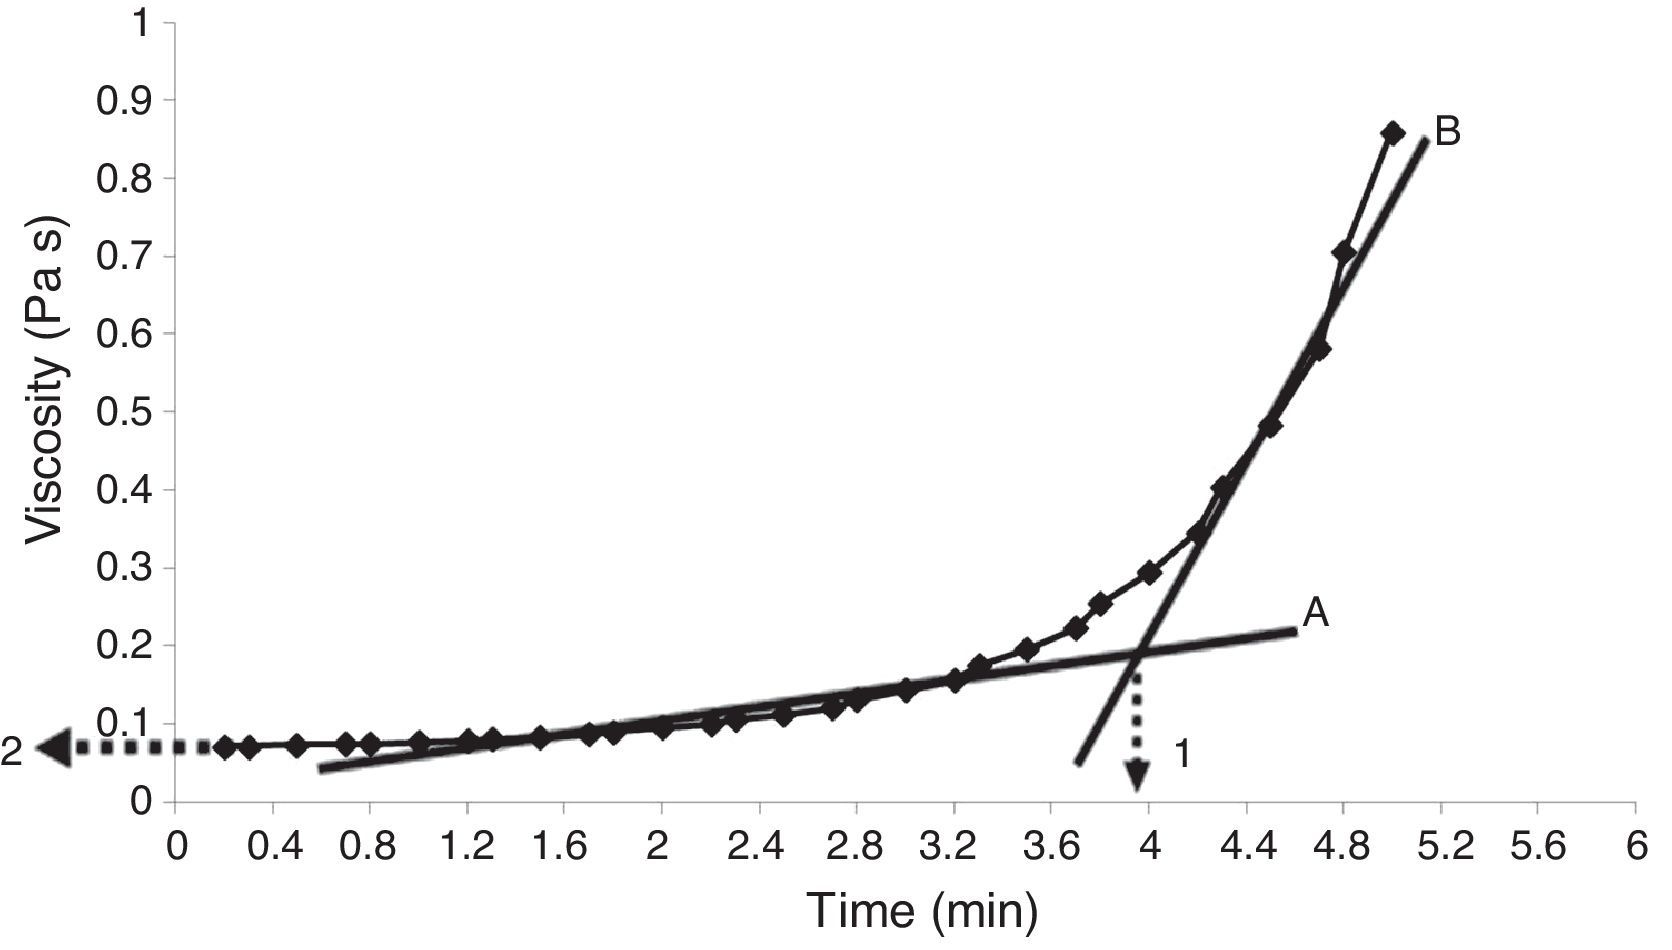
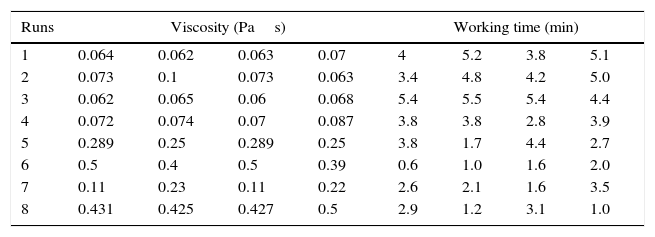
Properties of the plaster suspensionDuring the first stage of plaster mold production, the rheological properties of the plaster suspension need to be considered; excessively high viscosities in the first minutes of the setting process can generate defects in the molds from air bubbles trapped in the suspension and poor flow behavior that can inhibit correct filling of the matrix molds [2]. Hence, in the present study the viscosity of the plaster suspension was evaluated as a function of time for each experimental run; for example, Fig. 2 shows a characteristic viscosity vs. time curve (run 4 from Table 2b). The viscosity values reported in Table 3 for each experimental run were determined as the value extrapolated (arrow 1 in Fig. 2) from the steady viscosity range, which is indicated by line A and covers the region where the dissolution of Ca2+ and SO42− ions occurred (according to the solution mechanism). The increase in viscosity as a function of time, indicated by line B in Fig. 2, was due to the hydration reaction between calcium sulfate hemihydrate and water to produce gypsum crystals. The point on the x-axis where lines A and B intersect defined the working time (arrow 2 in Fig. 2) or the limit time during which the plaster suspension may pourable with lowest values of viscosity. Table 3 shows four data points for each run due to the combination of replicates as a result of the elimination of column D (drying method) from the original 24 experimental design (Table 2a), as explained in “Experimental design” section.
. Lines A and B indicate the regions of low and high viscosity, respectively. Arrow 1 indicates the working time, while arrow 2 shows the viscosity value used to compare the different samples.")
Viscosity curve as a function of time for a plaster suspension (run 4 from Table 2b). Lines A and B indicate the regions of low and high viscosity, respectively. Arrow 1 indicates the working time, while arrow 2 shows the viscosity value used to compare the different samples.
Results of the 23 experimental design for analyzing the viscosity and working time of the plaster suspension.
| Runs | Viscosity (Pas) | Working time (min) | ||||||
|---|---|---|---|---|---|---|---|---|
| 1 | 0.064 | 0.062 | 0.063 | 0.07 | 4 | 5.2 | 3.8 | 5.1 |
| 2 | 0.073 | 0.1 | 0.073 | 0.063 | 3.4 | 4.8 | 4.2 | 5.0 |
| 3 | 0.062 | 0.065 | 0.06 | 0.068 | 5.4 | 5.5 | 5.4 | 4.4 |
| 4 | 0.072 | 0.074 | 0.07 | 0.087 | 3.8 | 3.8 | 2.8 | 3.9 |
| 5 | 0.289 | 0.25 | 0.289 | 0.25 | 3.8 | 1.7 | 4.4 | 2.7 |
| 6 | 0.5 | 0.4 | 0.5 | 0.39 | 0.6 | 1.0 | 1.6 | 2.0 |
| 7 | 0.11 | 0.23 | 0.11 | 0.22 | 2.6 | 2.1 | 1.6 | 3.5 |
| 8 | 0.431 | 0.425 | 0.427 | 0.5 | 2.9 | 1.2 | 3.1 | 1.0 |
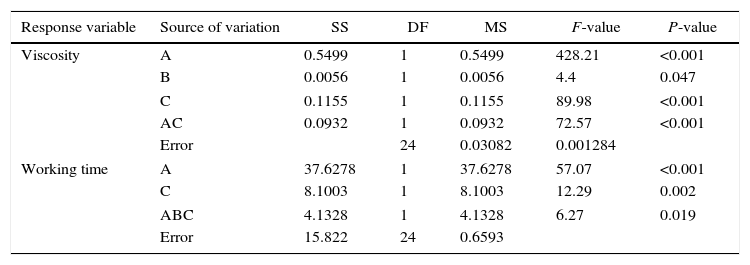
In order to evaluate how the mixing time, water temperature, and water quality affected the viscosity and working time, Table 4 shows the ANOVA results for the effect of the preparation variables on the rheology of the plaster suspension. The viscosity of the plaster suspension is affected by the mixing time, water quality, and a combined interaction between the mixing time and the water quality. In addition, the working time was affected by the mixing time, water quality, and a triple interaction between the mixing time, water temperature, and water quality.
ANOVA table of the plaster suspension properties.
| Response variable | Source of variation | SS | DF | MS | F-value | P-value |
|---|---|---|---|---|---|---|
| Viscosity | A | 0.5499 | 1 | 0.5499 | 428.21 | <0.001 |
| B | 0.0056 | 1 | 0.0056 | 4.4 | 0.047 | |
| C | 0.1155 | 1 | 0.1155 | 89.98 | <0.001 | |
| AC | 0.0932 | 1 | 0.0932 | 72.57 | <0.001 | |
| Error | 24 | 0.03082 | 0.001284 | |||
| Working time | A | 37.6278 | 1 | 37.6278 | 57.07 | <0.001 |
| C | 8.1003 | 1 | 8.1003 | 12.29 | 0.002 | |
| ABC | 4.1328 | 1 | 4.1328 | 6.27 | 0.019 | |
| Error | 15.822 | 24 | 0.6593 | |||
A=mixing time, B=water temperature, C=water quality, AC=interaction between mixing time and water quality, and ABC=interaction between mixing time, water temperature, and water quality.
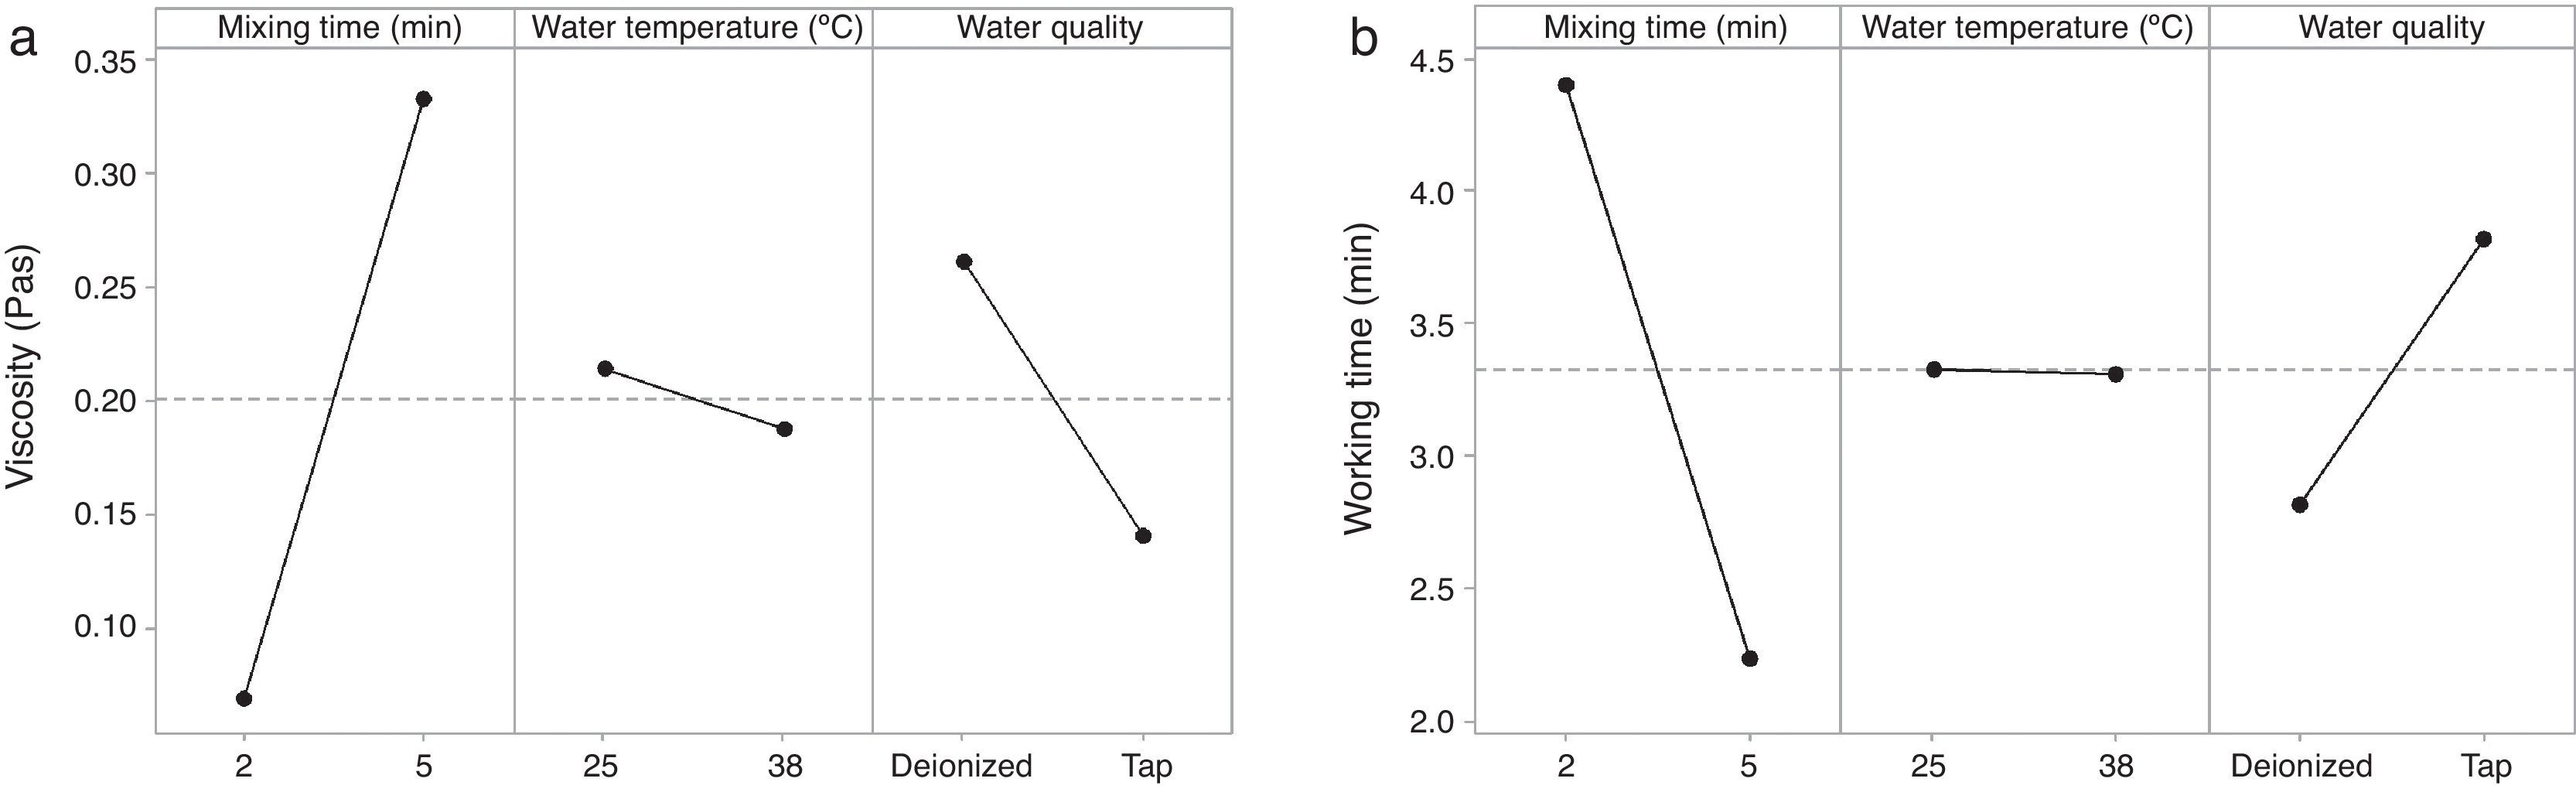
The rheological properties of the plaster suspension (viscosity and working time) as functions of the processing parameters are presented in Fig. 3. An increase from 2 to 5min in the mixing time increased the viscosity (Fig. 3a) and reduced the working time (Fig. 3b). Hence, the plaster suspension stopped flowing earlier with an increase in the mixing time. Two mechanisms have previously been reported to explain the accelerated setting of calcium sulfate [17]: (i) increasing nucleation through a seeding action and (ii) increasing the rate at which Ca2+ and SO42− ions are transported and incorporated into the lattice of the growing gypsum crystals. These two mechanisms have been used to explain the reduction of plaster setting time as a result of the use of additives [18] and can also explain the effect of the mixing time as gypsum crystals could have been broken to provide fresh nucleation points and accelerate the setting reaction. In addition, the increase in the mixing time could also have enhanced the transport of Ca2+ and SO42− ions to accelerate the setting reaction.
 Viscosity and (b) working time as functions of the processing parameters affecting the rheology of the plaster suspension.")
Regarding the water temperature, a change from 25°C to 38°C (maximum dissolution temperature of the plaster [7]) reduced the viscosity of the plaster suspension, this effect may be explained because of the reduction in the viscosity of water as a result of the increase in temperature. Considering the effect of the water quality on the rheology of the plaster suspension, the viscosity was reduced (Fig. 3a) and the working time was increased (Fig. 3b) with a change from deionized water to tap water; this effect may be due to the presence of impurities in the tap water that impede the setting reaction.
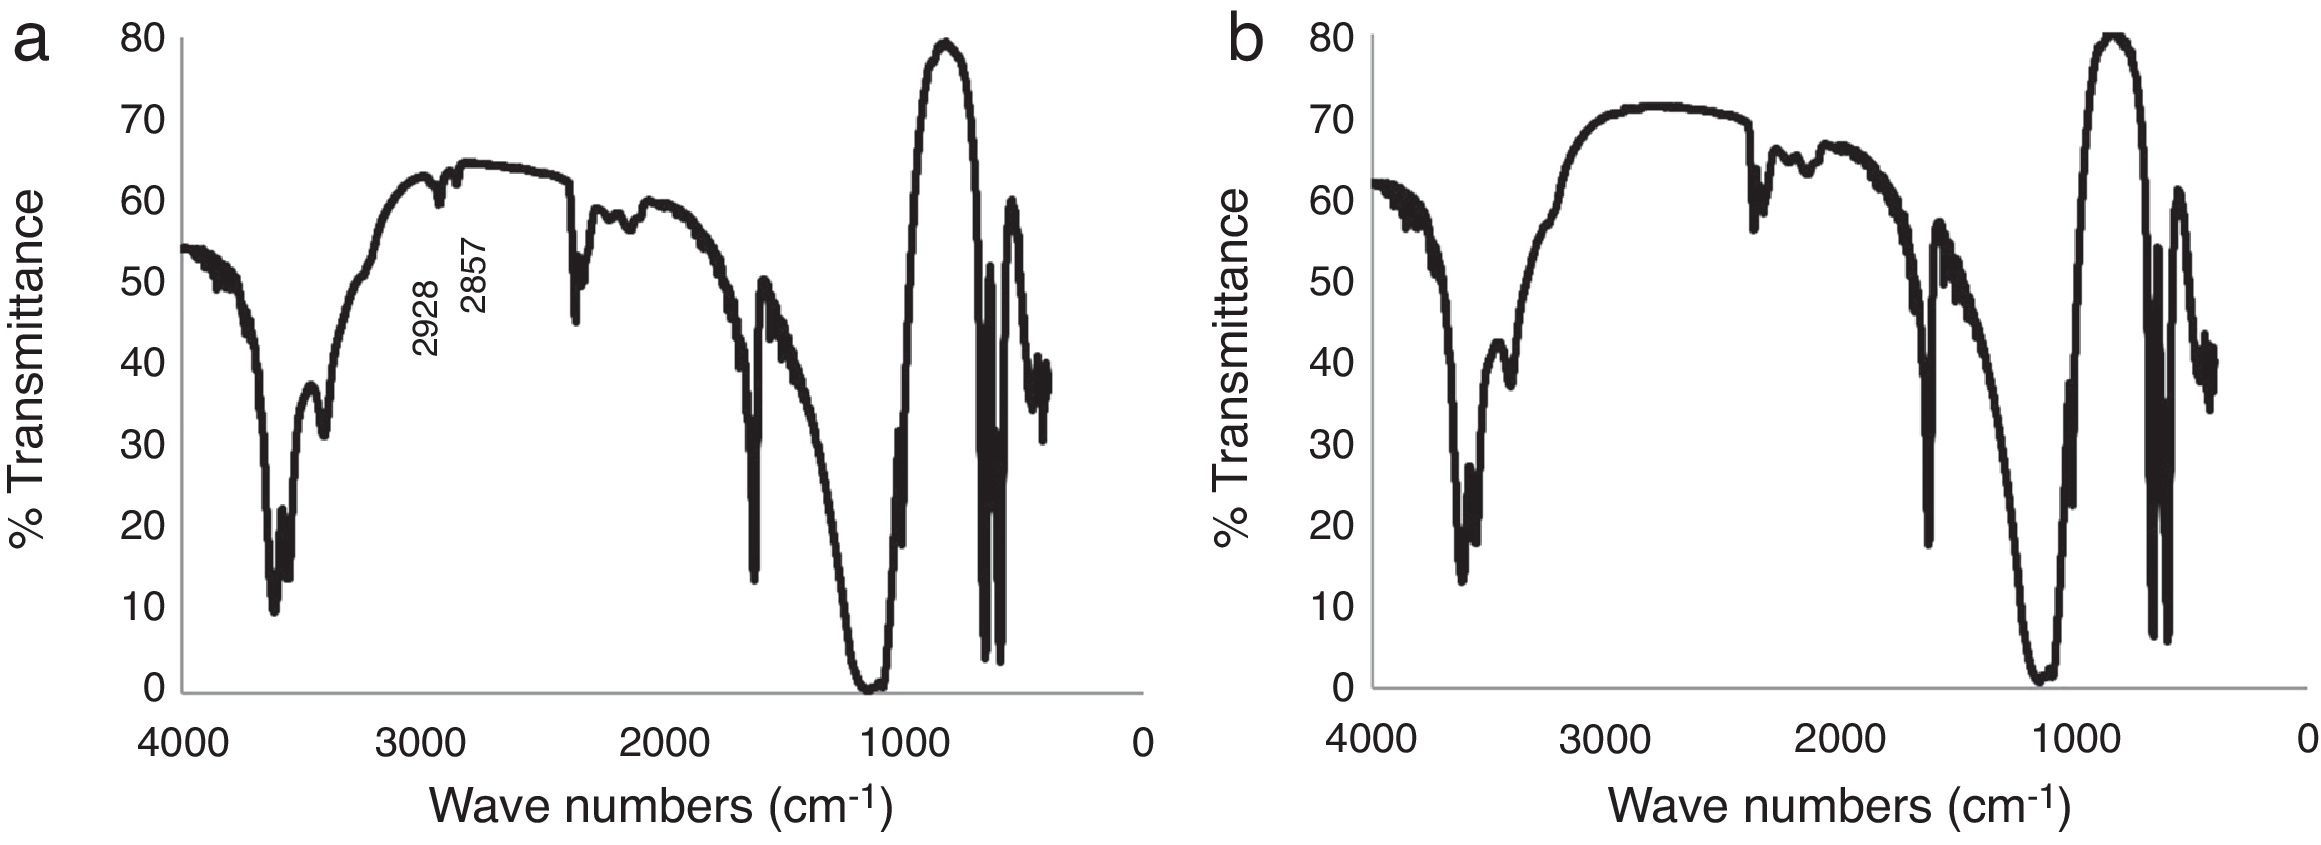
IR analysis of the plaster samples prepared using tap water and deionized water was undertaken, as shown in Fig. 4. The spectra were quite similar, showing the typical vibrational energy bands of calcium sulfate dihydrate. However, on close inspection, the spectrum of the mold obtained using tap water (Fig. 4a) has two additional peaks located at wave numbers of 2928cm−1 and 2857cm−1; peaks corresponding to the organic matter of amber and bitumen, respectively [19]. The effect of these specific organic species on the setting time of calcium sulfate are not well described in the literature; however, Wiss et al. [2] reported that, in general, organic matter may reduce the setting time, which may explain the results observed here.
 tap water and (b) deionized water.")
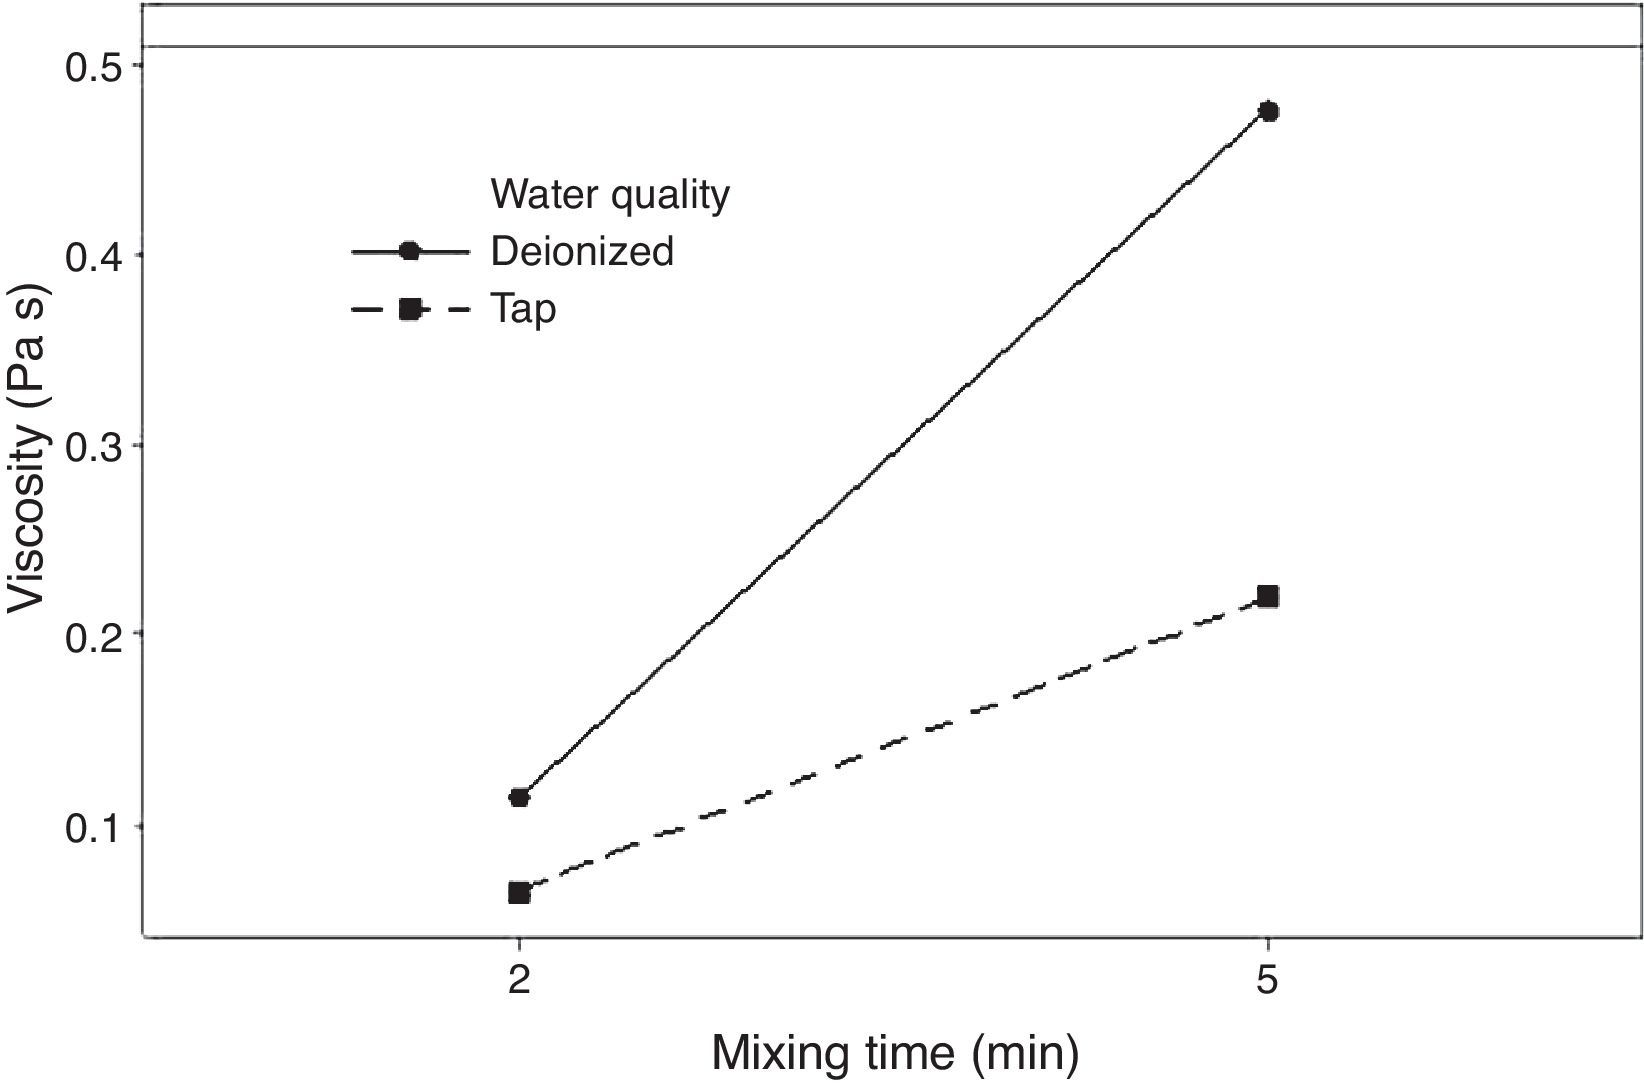
Fig. 5 shows the effect of the double interaction of the mixing time and water quality on the viscosity of the plaster suspension. It can be seen that the mixing time has more of an effect on the viscosity when deionized water is used (continuous line) than when tap water is used (broken line). Lower viscosities were obtained with tap water; this effect may originate from the retardant action of impurities in tap water. This double interaction will be discussed later in the section regarding optimization.
Plaster mold properties
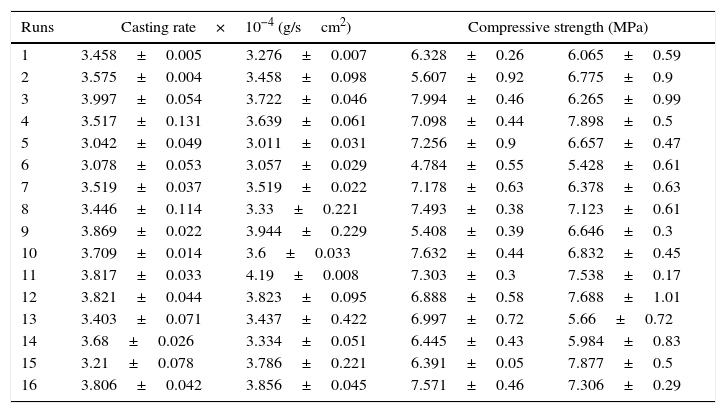
The main function of the plaster mold is to provide sufficient porosity to remove the water from the ceramic slip and allow the desired thickness of the green cast body to form; however, there is a trade-off between the porosity and strength of the mold. Considering this, the casting rate and the compressive strength of the plaster molds produced at the different conditions were evaluated and the results are shown in Table 5. This table shows two columns of results for each property; these are replicate experiments undertaken to estimate the experimental error. The standard deviation (± values in Table 5) was calculated from the mean of three (for casting rate) or five (for compressive strength) measurements according to the output response. The ANOVA results are shown in Table 6.
Results of the 24 experimental design for analyzing casting rate and compressive strength.
| Runs | Casting rate×10−4 (g/scm2) | Compressive strength (MPa) | ||
|---|---|---|---|---|
| 1 | 3.458±0.005 | 3.276±0.007 | 6.328±0.26 | 6.065±0.59 |
| 2 | 3.575±0.004 | 3.458±0.098 | 5.607±0.92 | 6.775±0.9 |
| 3 | 3.997±0.054 | 3.722±0.046 | 7.994±0.46 | 6.265±0.99 |
| 4 | 3.517±0.131 | 3.639±0.061 | 7.098±0.44 | 7.898±0.5 |
| 5 | 3.042±0.049 | 3.011±0.031 | 7.256±0.9 | 6.657±0.47 |
| 6 | 3.078±0.053 | 3.057±0.029 | 4.784±0.55 | 5.428±0.61 |
| 7 | 3.519±0.037 | 3.519±0.022 | 7.178±0.63 | 6.378±0.63 |
| 8 | 3.446±0.114 | 3.33±0.221 | 7.493±0.38 | 7.123±0.61 |
| 9 | 3.869±0.022 | 3.944±0.229 | 5.408±0.39 | 6.646±0.3 |
| 10 | 3.709±0.014 | 3.6±0.033 | 7.632±0.44 | 6.832±0.45 |
| 11 | 3.817±0.033 | 4.19±0.008 | 7.303±0.3 | 7.538±0.17 |
| 12 | 3.821±0.044 | 3.823±0.095 | 6.888±0.58 | 7.688±1.01 |
| 13 | 3.403±0.071 | 3.437±0.422 | 6.997±0.72 | 5.66±0.72 |
| 14 | 3.68±0.026 | 3.334±0.051 | 6.445±0.43 | 5.984±0.83 |
| 15 | 3.21±0.078 | 3.786±0.221 | 6.391±0.05 | 7.877±0.5 |
| 16 | 3.806±0.042 | 3.856±0.045 | 7.571±0.46 | 7.306±0.29 |
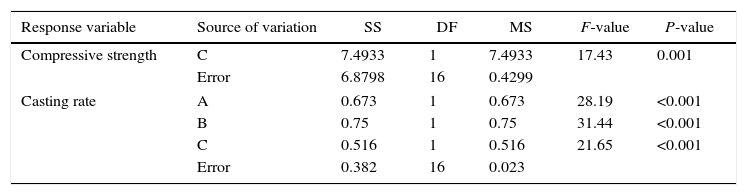
ANOVA table of the compressive strength and casting rate of the plaster molds.
| Response variable | Source of variation | SS | DF | MS | F-value | P-value |
|---|---|---|---|---|---|---|
| Compressive strength | C | 7.4933 | 1 | 7.4933 | 17.43 | 0.001 |
| Error | 6.8798 | 16 | 0.4299 | |||
| Casting rate | A | 0.673 | 1 | 0.673 | 28.19 | <0.001 |
| B | 0.75 | 1 | 0.75 | 31.44 | <0.001 | |
| C | 0.516 | 1 | 0.516 | 21.65 | <0.001 | |
| Error | 0.382 | 16 | 0.023 | |||
A=mixing time, B=water temperature, and C=water quality.
Four specimens produced under the preparation variables with statistically significant effect (using all high values of the preparation variable presented in Table 6 or a reference sample using all low values) were examined using SEM and mercury porosimetry in order to elucidate the influence of the preparation conditions on the microstructure and porosity of the plaster mold, respectively.
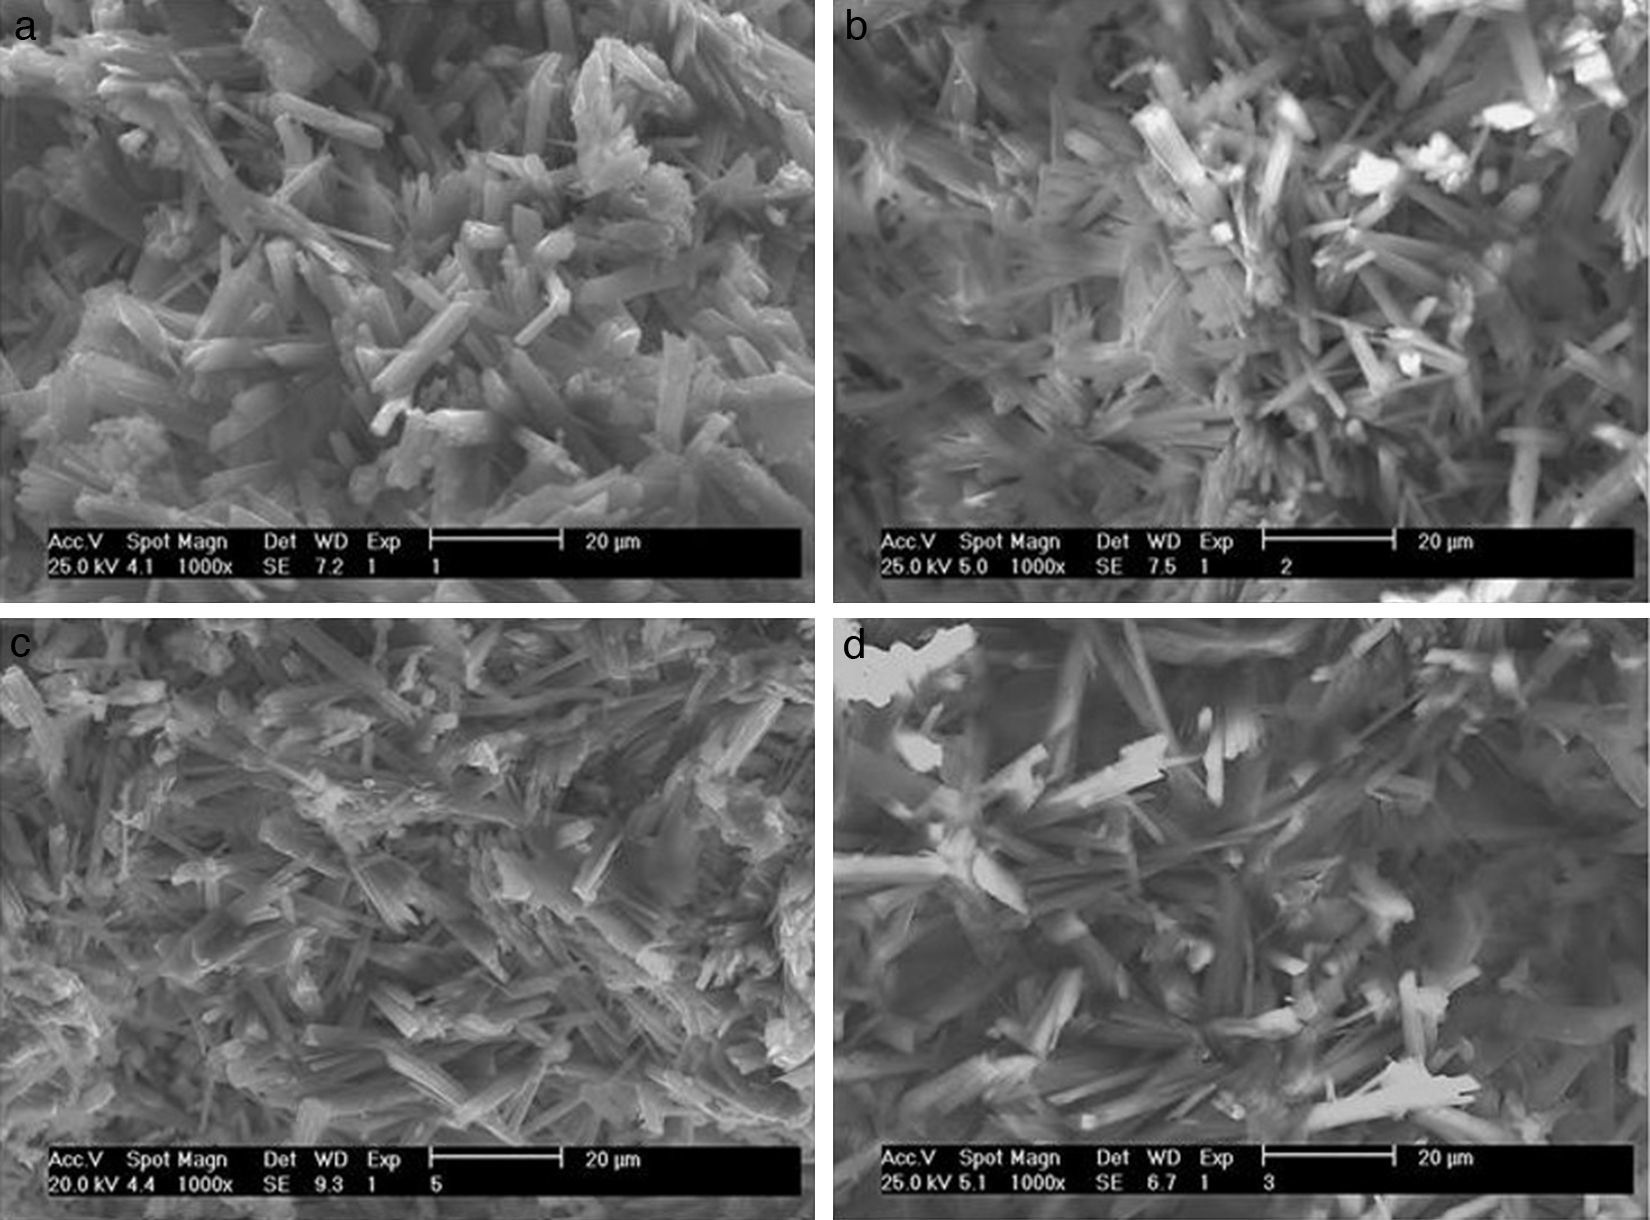
According to the SEM images presented in Fig. 6, the effects of the preparation variables may be explained by the different microstructures induced in the plaster mold. The reference sample (Fig. 6a; run 1 in Table 2a) showed thick gypsum crystals (about 5μm thickness) while samples made using high levels of both mixing time (Fig. 6b; run 9 in Table 2a) and water quality (Fig. 6c; run 3 in Table 2a) showed similar, but narrower, gypsum crystals (about 1.5μm thickness). A sample produced with high water temperature (Fig. 6d; run 5 in Table 2a) showed larger gypsum crystals (about 30μm long). The microstructures of the specimens presented in Fig. 6 were further analyzed using mercury porosimetry measurements of the median pore diameter and pore size distribution.
 reference sample (all variables at low level, run 1 Table 2a), (b) effect of mixing time (longest mixing time, run 9 Table 2a), (c) effect of water quality (highest water quality; deionized water, run 3 Table 2a), and (d) effect of water temperature (highest water temperature, run 5 Table 2a).")
SEM micrographs of plaster molds prepared under different conditions: (a) reference sample (all variables at low level, run 1 Table 2a), (b) effect of mixing time (longest mixing time, run 9 Table 2a), (c) effect of water quality (highest water quality; deionized water, run 3 Table 2a), and (d) effect of water temperature (highest water temperature, run 5 Table 2a).
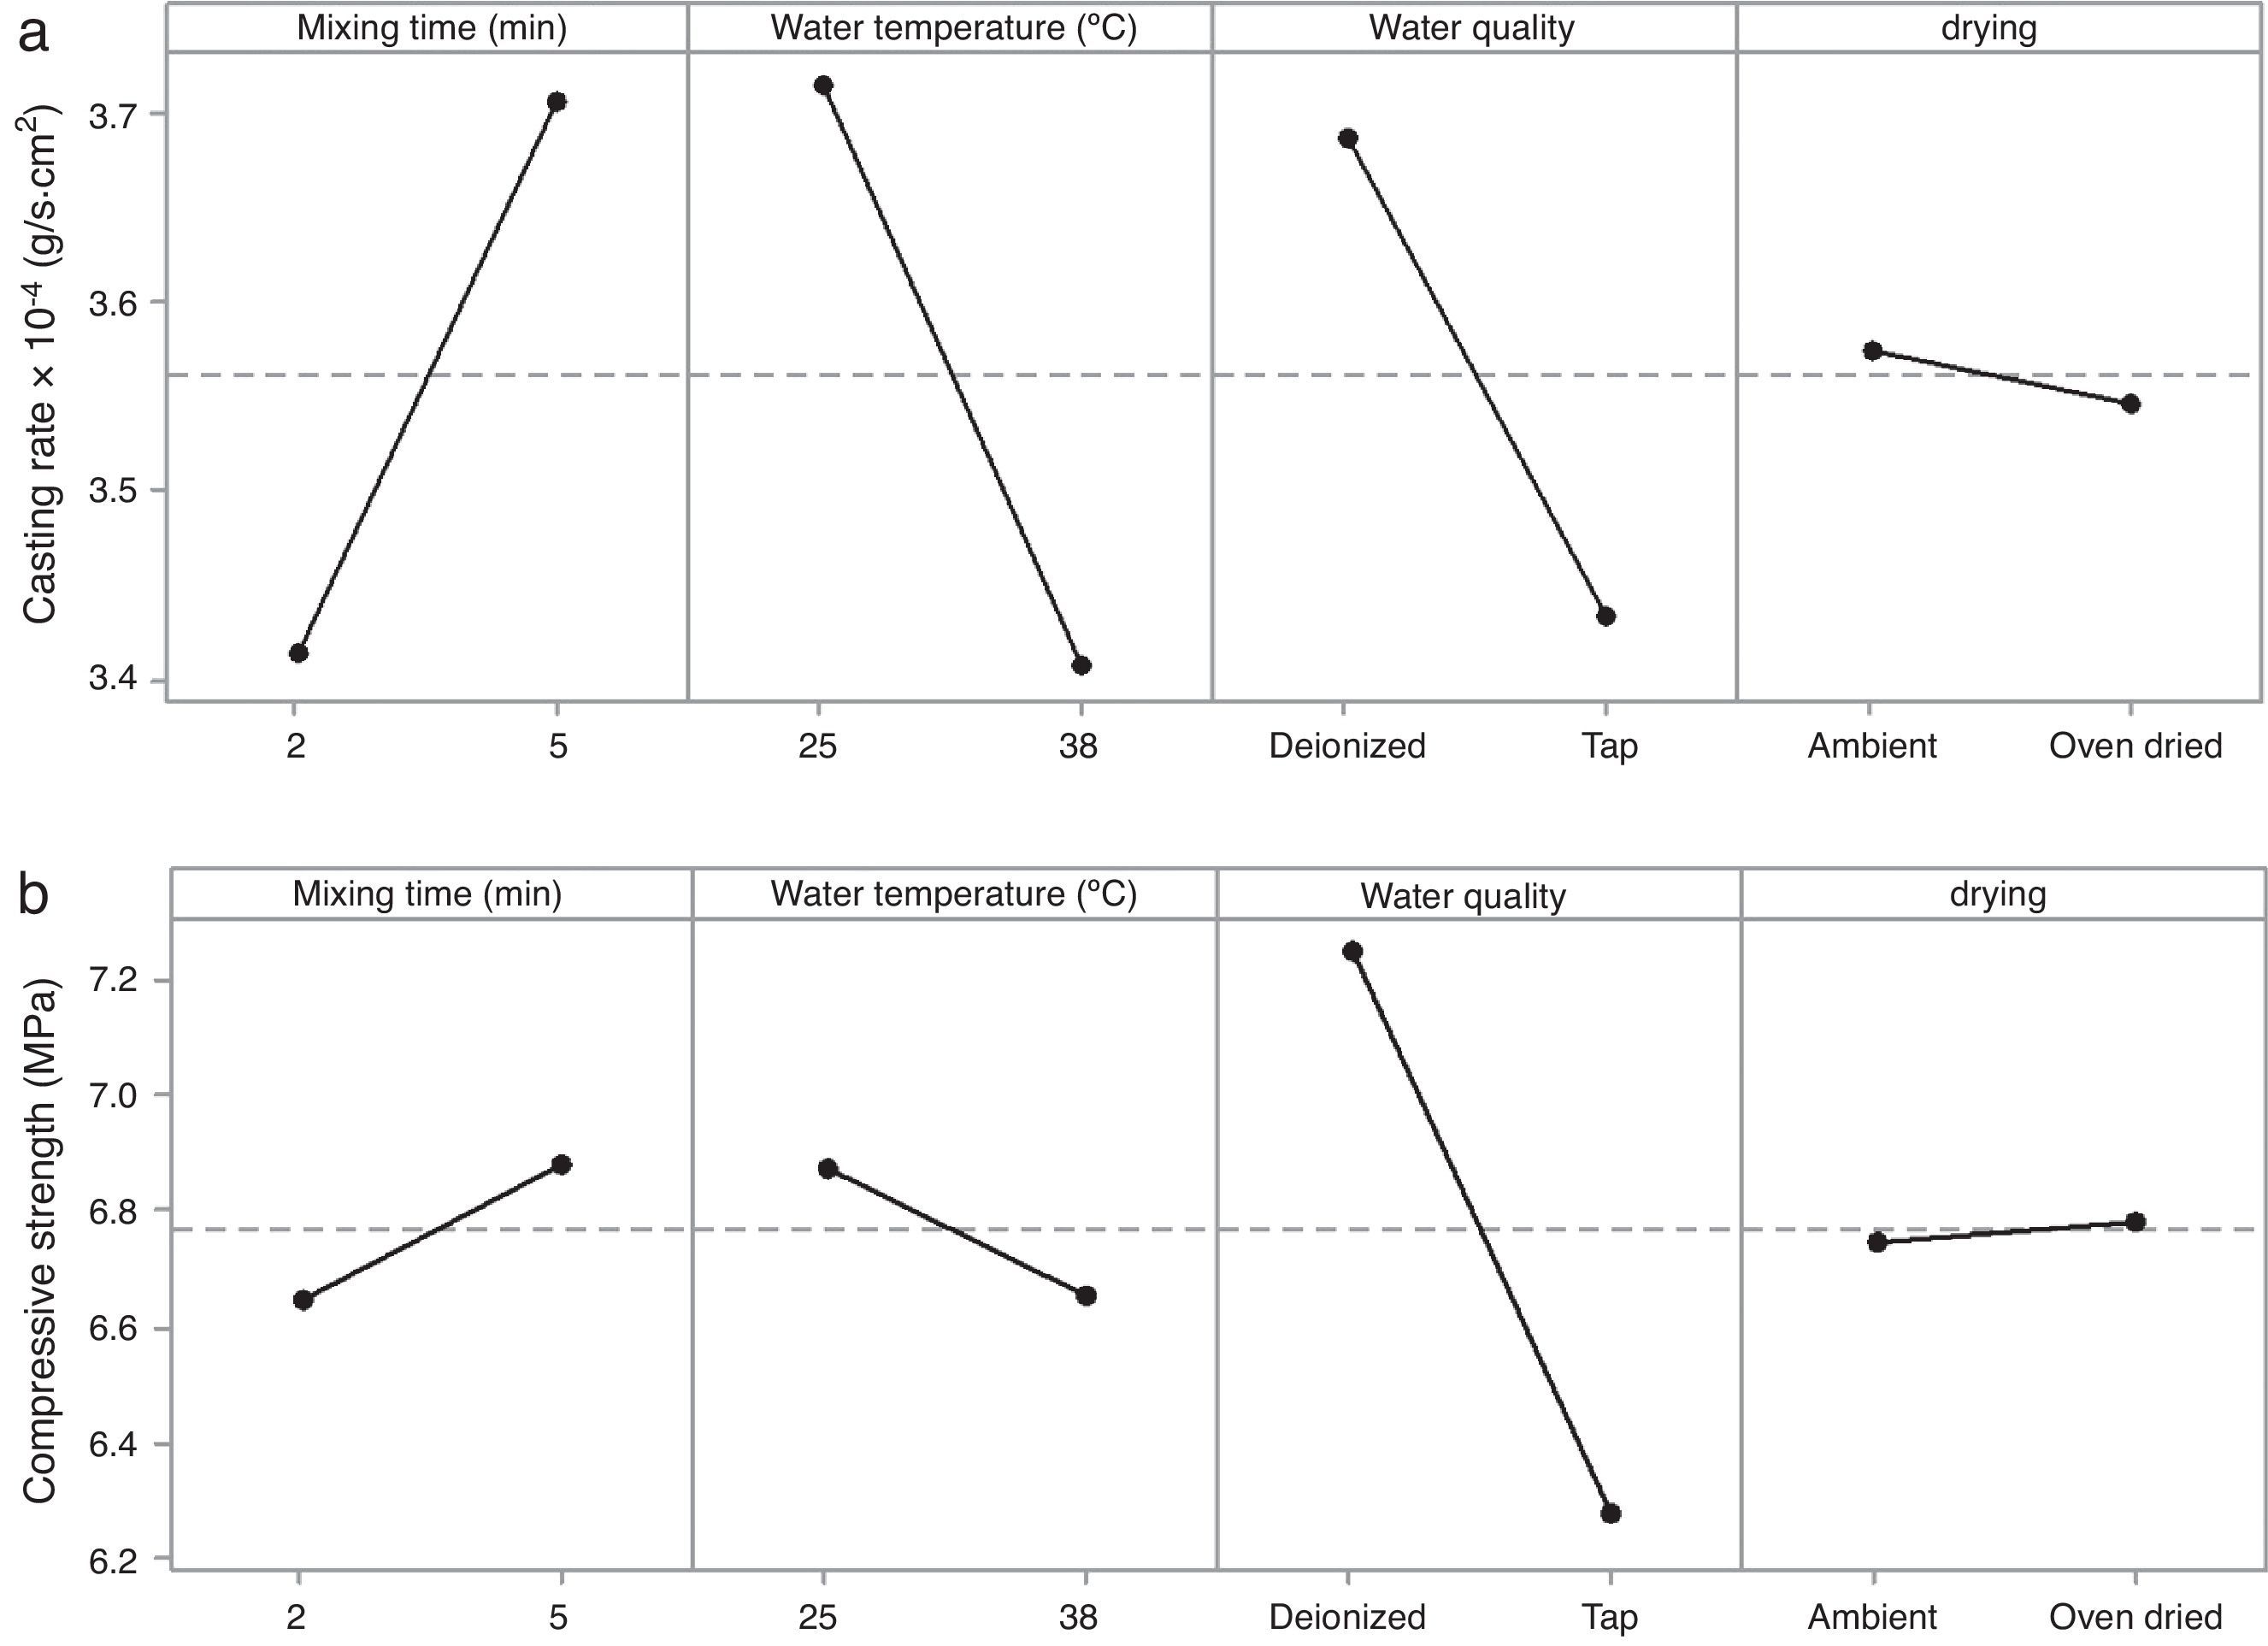
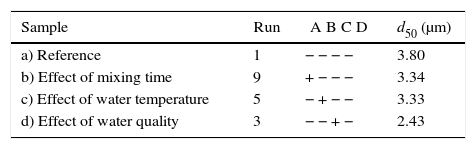
Table 7 shows the median pore diameter of the four samples presented in Fig. 6. Increasing the levels of both the mixing time (2–5min) and water quality (tap to deionized water) reduced the median pore diameter with respect to the reference sample (and also increased the casting rate, as shown in Fig. 7a). It has been reported [20] that a reduction in the pore size can increase the casting rate as the plaster mold may have less suction capacity. Therefore, the first layer of cast material formed may have a low packing density, resulting in a lower resistance to the flow of water into the plaster mold, increasing the absorbability of the mold and the casting rate. The highest water quality (deionized water) also promoted an increase of about 16% in the compressive strength of the mold (Fig. 7b), which was attributed to a large reduction in the median pore size from 3.8 to 2.43μm (Table 7).
Median pore diameters of the plaster molds prepared using different preparation conditions.
| Sample | Run | A B C D | d50 (μm) |
|---|---|---|---|
| a) Reference | 1 | − − − − | 3.80 |
| b) Effect of mixing time | 9 | + − − − | 3.34 |
| c) Effect of water temperature | 5 | − + − − | 3.33 |
| d) Effect of water quality | 3 | − − + − | 2.43 |
A=mixing time, B=water temperature, C=water quality, and D=drying conditions.
 casting rate and (b) compressive strength of plaster molds.")
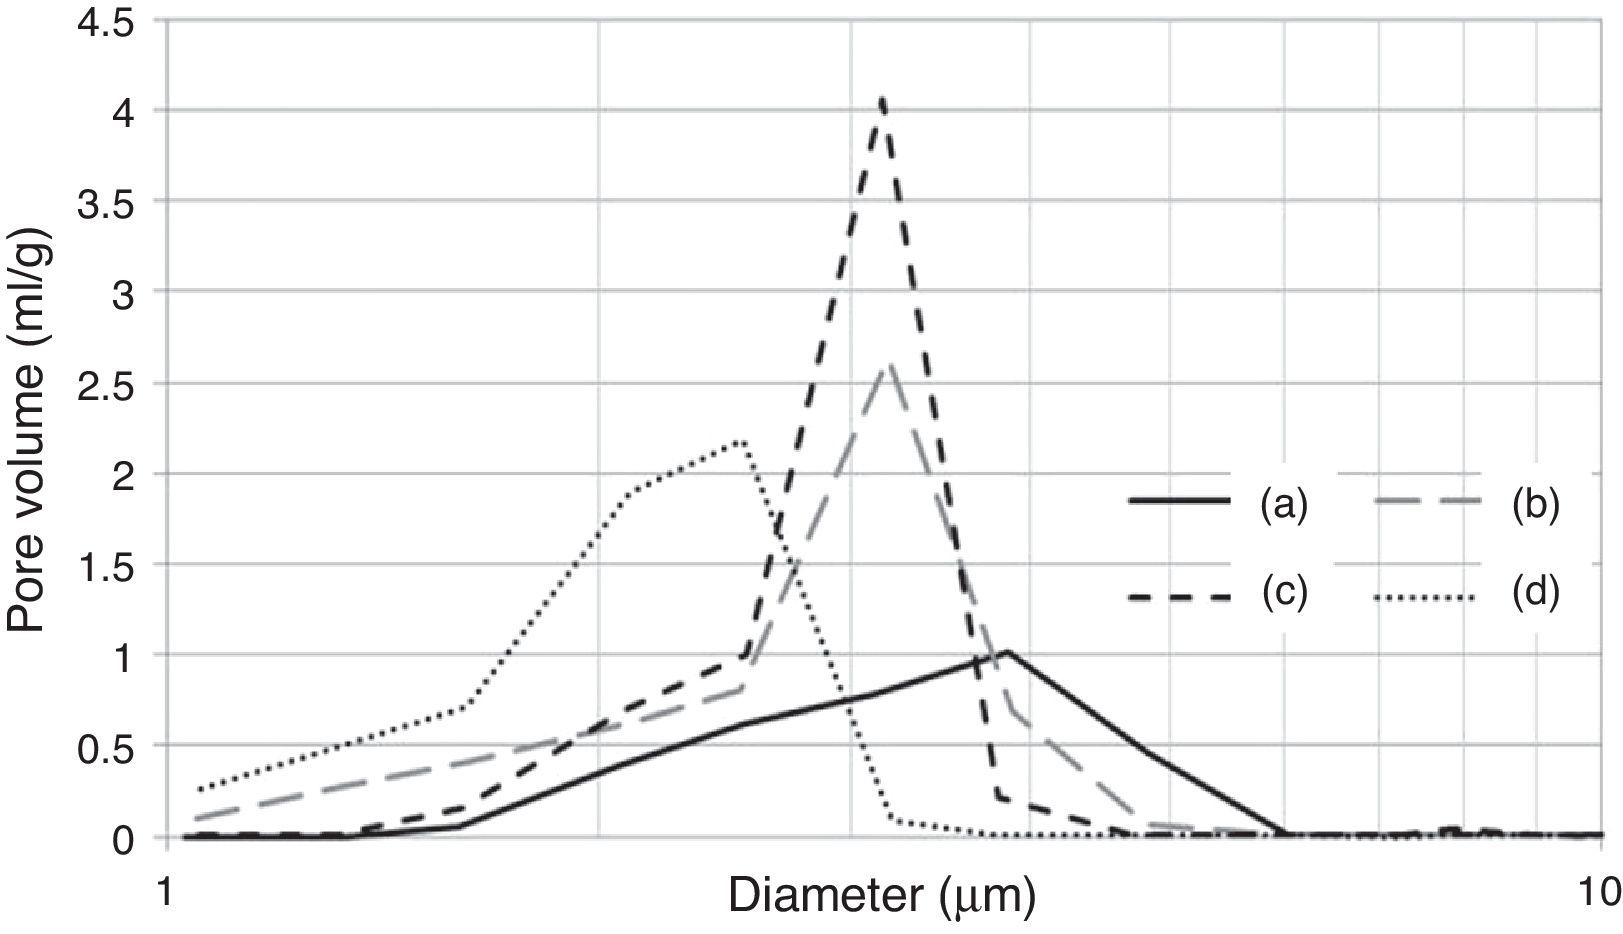
It is important to note that the highest water temperature (38°C) promoted a reduction in the median pore diameter (Table 7), with a corresponding reduction in the casting rate (Fig. 7a), in contrast to the case of the mixing time and water quality (the high levels of the aforementioned variables also reduced the median pore diameter, but with an increase in casting rate). This could be a result of the development of a narrow pore size distribution with few fine pores (<0.5μm, Fig. 8c) when using the highest water temperature; the lack of fine pores could have increased the suction of the mold, promoting an initial dense layer with higher resistance to the flow of water from the slip to the mold, reducing the absorbability of the mold, and therefore the casting rate.
 reference sample (all variables at low level, run 1 Table 2a), (b) effect of mixing time (longest mixing time, run 9 Table 2a), (c) effect of water temperature (highest water temperature, run 5 Table 2a) and (d) effect of water quality (highest water quality, run 3 Table 2a).")
Pore size distribution of plaster molds prepared under different conditions: (a) reference sample (all variables at low level, run 1 Table 2a), (b) effect of mixing time (longest mixing time, run 9 Table 2a), (c) effect of water temperature (highest water temperature, run 5 Table 2a) and (d) effect of water quality (highest water quality, run 3 Table 2a).
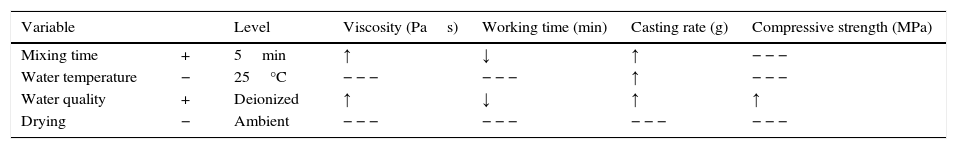
Optimization efforts should be focused on improving the casting rate as the main purpose of the plaster mold is to remove the water from the ceramic slip and obtain the desired thickness of the green cast body. Table 8 shows the preparation variables and the levels at which the casting rate was increased. The arrows in Table 8 illustrate the tendency of the experimental results (increase ↑ or decrease ↓) for each mold property as a function of the chosen preparation variables.
Optimization of the preparation variables for improving the casting rate and the corresponding effect on the mold properties.
| Variable | Level | Viscosity (Pas) | Working time (min) | Casting rate (g) | Compressive strength (MPa) | |
|---|---|---|---|---|---|---|
| Mixing time | + | 5min | ↑ | ↓ | ↑ | − − − |
| Water temperature | − | 25°C | − − − | − − − | ↑ | − − − |
| Water quality | + | Deionized | ↑ | ↓ | ↑ | ↑ |
| Drying | − | Ambient | − − − | − − − | − − − | − − − |
− − −, no statistically significant effect.
According to the results of the present study, it is possible to improve the casting rate, as an example by about 9% by optimizing the water temperature (Fig. 7a). However, when various mold properties are being assessed, as in the present study, it must be considered that when one input variable is changed to optimize a desired property, other properties may be adversely affected [21]; for example, the increase in viscosity and decrease in working time (Table 8) as a result of the improvement of the casting rate. The variables observed to improve the casting rate also accelerated the setting process (because of the increased viscosity and decreased working time) and enhanced the double interaction between mixing time and water quality. Therefore, it can be stated that the optimum preparation conditions presented in Table 7 are limited to a working time of about 2.3min (corresponding to 5min mixing time in Fig. 3b), longer time at these conditions could increase the probability of defects such as pin holes and incorrect filling of cavities due to high viscosity of the plaster suspension.
A water temperature of 38°C has been recommended to avoid variations in the setting time of the plaster molds [7]; however, in the present work a temperature of 25°C was found to be preferable due to a better casting rate and to reduce energy use. Considering the drying conditions, in contrast to previous results showing that controlled drying at 45 ¿C led to an improvement of the compressive strength with respect to ambient drying [9], we found in the present study that an ambient environment is preferable because it has no effect on mold properties and reduces the energy consumption. However, on an industrial scale, ambient environments are only suitable if there is enough time and space to store plaster molds to dry properly.
Therefore, the optimum variables revealed in this study to improve the casting rate are the use of deionized water with a temperature of 25°C, a mixing time of 5min, and an ambient environment to dry the mold, resulting in 2.3min of working time. However, the results showed that there is a trade-off between working time and casting rate. Hence if productivity of plaster molds were more critical than the casting rate would be advisable a shorter mixing time of 2min, improving the flow properties of the plaster suspension and extending the working time up to 4.5min (see Fig. 3b), with the possibility to produce more of molds per batch. The understanding of the effect of the preparation variables according to experimental results and physical phenomena involving during the process may lead to choosing the better conditions according to different circumstances of the process.
ConclusionsA full factorial design was used to determine the effect of the preparation variables of plaster molds on the rheology of the initial suspension and final properties of the mold. An analysis of the viscosity behavior over time provided an estimation of the working time, which is related to the time during which the Ca2+ and SO42− ions are dissolved in the water of the plaster suspension before the precipitation of gypsum crystals, where the suspension has ideal flow properties to conform the molds with low possibility of defects due to high viscosity. The working time was found to range from 1 to 5min depending on the preparation conditions. By modifying the preparation variables, and hence the conditions under which the reaction producing gypsum crystals occurs, it is possible to optimize the rheology of the plaster suspension and the final properties of the plaster mold. A correlation between the rheology of the plaster suspension and the final properties of the mold was observed when changing the preparation variables. Increasing the water quality and mixing time increased the viscosity and reduced the working time, i.e. accelerated the setting process and modified the crystal growth process, leading to a less porous structure in the final plaster mold that increased the compressive strength and casting rate. A better understanding of the effect of the conditions used to prepare plaster molds can be useful in practical applications of such materials. The results of the present study are expected to avoid unnecessary energy usage during processing and optimize the flow properties of the plaster suspension to prepare molds with high productivity and without defects (to improve the final quality of the product). From the results of the experimental design undertaken here to improve the casting rate, the optimum values were a mixing time of 5min, suspension made with deionized water at a temperature of 25°C, and environmental drying, resulting in a working time of 2.3min.
This work was supported by CONACyT-México under the project “Design of multilaminar composites with different structural and functional properties”, No. 106110 and scholarship No. 172425 (Rafael Ochoa).

