
Several characterization methods were applied to low cost ceramic membranes developed for wastewater treatment in membrane bioreactors (MBRs) and/or tertiary treatments. The membranes were prepared by four different procedures (uniaxial pressing and extrusion, both with and without starch addition to generate pores). The pore size of these symmetric ceramic membranes was measured by two different methods: bubble point and intrusion mercury porosimetry. A good agreement between both methods was achieved, confirming the validity of the bubble point method for the measurement of the mean pore size of membranes. Air and water permeations of these ceramic membranes were also studied. The relationship between the permeation of both fluids is consistent with the ratio of viscosities, according to the Hagen–Poiseuille equation.
En el presente trabajo se han caracterizado mediante diferentes métodos membranas cerámicas de bajo coste desarrolladas para tratar aguas residuales en reactores biológicos de membrana (MBR) o mediante tratamientos terciarios. Las membranas se prepararon mediante diferentes procedimientos (prensado uniaxial y extrusión, con o sin adición de almidón como material generador de poros). El tamaño del poro de estas membranas cerámicas simétricas se determinó mediante 2 métodos diferentes: punto de burbuja y porosimetría de intrusión de mercurio. Los resultados obtenidos mediante ambos métodos mostraban concordancia, lo que confirma la validez del método de punto de burbuja para la medida del tamaño del poro medio de las membranas. Además, se ha estudiado la permeabilidad al aire y agua de estas membranas cerámicas: la relación entre la permeabilidad de ambos fluidos es consistente con el ratio de viscosidades, de acuerdo con la ecuación de Hagen-Poiseuille.
Membrane bioreactors (MBR) combine a biological degradation process with the direct separation of activated sludge and liquid-solid by filtration membranes [1]. In addition, MBRs have important advantages such as space reduction relative to conventional activated sludge process, which leads to a decrease in their environmental impact, the capability of operating with higher concentrations of suspended solids, and the production of better quality effluent. However, one of the main drawbacks of MBR is membrane fouling. Despite the high cost of commonly used ceramic membranes (made of alumina, zirconia or titania), it is known that they are more hydrophilic than polymeric membranes, which means that ceramic membranes have a lower membrane fouling rate. Ceramic membranes are also more chemically, mechanically and thermally resistant. Other characteristics that influence membrane fouling are pore size and configuration (tubular, flat or hollow fiber) [2,3]. Currently, polymeric hollow fiber membranes are the most widely used in the industry because the manufacturing cost of ceramic membranes based on high purity oxides is higher than that of their polymeric counterparts. However, hollow fiber membranes are more likely to develop higher fouling rates and consequently give rise to higher maintenance costs [1]. As an alternative, low cost ceramic membranes whose composition is mainly based on clays and organic pore formers are cheaper, similar to the cost of polymeric membranes. The preparation of low cost ceramic membranes was described in a previous paper [4].
This work attempts to characterize two key parameters of low cost ceramic membranes: mean pore diameter and permeability. Several techniques can be used to measure the pore size distribution and average pore size (d50) of a membrane: nitrogen adsorption, intrusion mercury porosimetry, permporometry, the bubble point method, solute resistance tests and electronic microscopy (SEM, TEM). In this work, we will compare the results obtained by intrusion mercury porosimetry and the bubble point method. Both are simple and rapid techniques which have been widely used to evaluate the pore size of ceramic materials. They are standardized, repeatable and reproducible test methods.
The goal of this study is to draw a comparison between the average pore size results obtained using bubble point and intrusion mercury porosimetry characterization techniques applied to a set of low cost symmetrical ceramic membranes. As mercury manipulation has been restricted, this comparison could open up an alternative to intrusion mercury porosimetry. This work also addresses the relationship between the water and air permeabilities of the membranes.
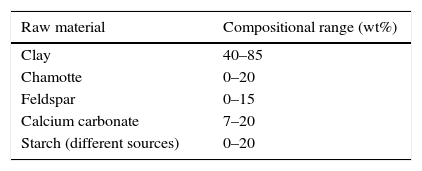
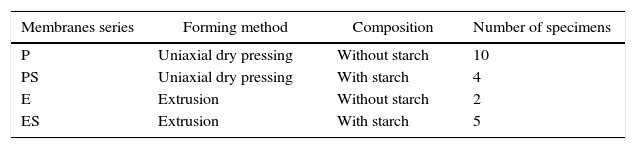
Experimental methodMembrane preparationLow cost ceramic membranes were prepared from raw materials normally used in the ceramic tile sector (clays, chamotte, feldspar and calcium carbonate) and organic pore formers (different starches provided by Roquette Laisa España, S.A.). The components were mixed in suitable proportions so that they could be easily processed by uniaxial dry pressing or extrusion. To obtain membranes with a broad range of porosity and pore sizes, the forming methods were combined with the addition of different proportions of starch to some compositions. Table 1 shows the compositional range used to obtain the ceramic membranes, where the proportion of clay, chamotte, feldspar, calcite and starch have been modified. Four different groups of membranes were prepared in this way, referred to as P, PS, E and ES (Table 2).
The process for producing the pressed membranes started with dry homogenization (manually and by means of an automatic mixer) of the different raw materials. The resulting compositions were moistened to 5.5kg H2O/100kg dry solid. Cylindrical test specimens, 0.7cm thick and 5cm in diameter, were formed from this powder by uniaxial dry pressing using an automatic laboratory press (Nannetti SpA, Italy). The test samples were oven-dried at 110°C to a constant weight.
Each batch of raw materials for the extruded membranes was kneaded to a consistency of 5kg, determined by penetrometry (using a cylinder with 1.5cm diameter) (Analogic penetrometer Geotester 0-6kg, Novatest S.r.l., Italy) [5], and allowed to stand for 24h to achieve uniform moisture in the mass. The water content of the compositions varies between 20 and 32wt%. Test pieces 1cm thick and 5cm in diameter were shaped from an extruded sheet, using a laboratory auger with a de-airing chamber (Model 050 C, Talleres Felipe Verdés, S.A., Spain). The test samples were weighed and afterwards dried at room temperature for 24h, and oven-dried at 110°C to a constant weight.
After drying, all the samples were weighed and the bulk density was measured by the mercury immersion method [6]. Next, the membranes were sintered with different thermal cycles, depending on their composition and the final properties required (sintering temperatures ranged from 1060 to 1160°C and dwelling time from 6 to 120min). After sintering, the membrane properties were determined. These properties included density, thickness, microstructure (observed by Scanning Electron Microscopy, FEG-ESEM Quanta 200 F, FEI, USA), and air and water permeability. Moreover, the average pore diameter and pore size distribution were determined by two techniques: intrusion mercury porosimetry and the bubble point method.
The present study was carried out with a large number of membranes with different pore sizes: 15 different compositions (classified in four series, as shown in Table 2) and 36 samples were tested to compare average pore size values obtained by both methods. In order to compare the permeability for air and water, 9 different compositions and 36 tests were carried out.
Characterization: bubble point and intrusion mercury porosimetryThe bubble point method allows the determination of membrane air permeability and, unlike the most common techniques used in the study of porous solids (nitrogen adsorption and intrusion mercury porosimetry), provides information about the pores that control the permeation [7–12]. This method is used to measure pores with size above 50nm and it is standardized by ASTM F316-03 [13], ISO 2942 [14] and ISO 4003 [15]. It consists of filling the porous structure of the membrane with a liquid and measuring the air pressure necessary to displace the liquid inside the pores. The minimum pressure necessary to blow the first observed air bubble corresponds to the largest pore size of the membrane; this value is known as the bubble point [15–18]. The mathematical relationship between pressure and pore size is given by Washburn equation:
where ΔP is the pressure drop (bar), dp is the pore size (μm), φ is the contact angle between the fluid and pore walls and γ is the liquid surface stress. In order to be able to use the Washburn equation, the pores are assumed to be cylindrical.
During the bubble point test, liquid intrusion will first occur through the largest pores. If the pores were cylindrical, the flow (m3s−1) through the membrane, considered as laminar, would be given by Hagen–Poiseuille equation [10,17,19]:
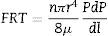
where Qv is the volumetric flow through the membrane, ΔP is the transmembrane pressure, n is the number of pores, r is the pore size, μ is the liquid viscosity and l is the pore length. If the above equation is employed for a gas, the volumetric flow rate should be expressed at the mean pressure, i.e. Qv should be calculated as the volumetric flow measured at Pm, where Pm is the mean pressure at both sides of the membrane. This is slightly different from the usual way of calculating the gas permeation through porous membranes (e.g. [20]). In laminar flow conditions, the molar flow rate is proportional to (P12−P22), where P1 is the pressure in the retentate and P2 is the pressure in the permeate. However, if the volumetric flow measured at the mean pressure (P1+P2)/2 is employed, it may easily be found that this volumetric flow rate is given by Eq. (2), where ΔP is (P1−P2) (see Appendix). This formulation of the gas permeation allows the same equation (2) to be used for liquids and gases.
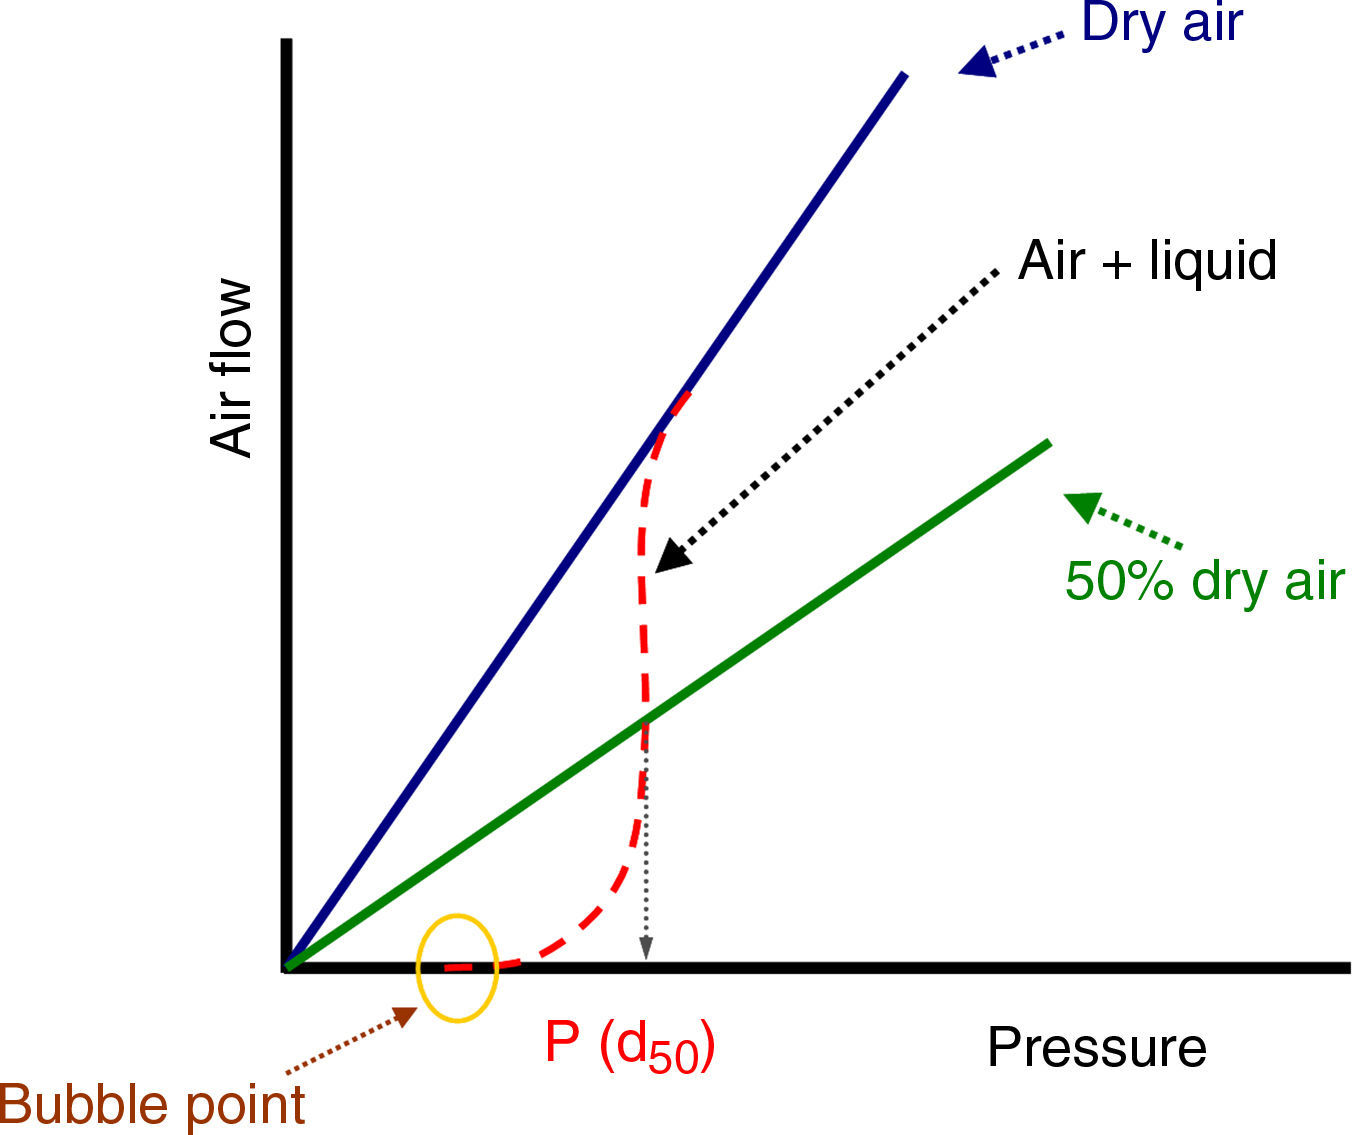
The average pore size (d50) is calculated using Eq. (1) from the pressure at the intersection point of the line that represents 50% of the air flow (mLmin−1) through the dry membrane versus the applied pressure with the equivalent curve for the wet membrane (Fig. 1). The pore sizes corresponding to 16% and 84% of the dry flow (named d16 and d84) are calculated in the same manner, giving an insight into the standard deviation of the pore size distribution.

Intrusion mercury porosimetry is also based on the Washburn equation, but in this technique mercury is the liquid used to fill the pores. By this method the mercury intrusion volume is recorded as a function of pressure or pore size [8,21]. This technique is normalized within DIN 66133 and ISO 15901 [22], but restrictions on the use of mercury may lead to its disappearance in the near future. Finally, the total volume of pores (Vf) and characteristic pore diameters (d16, d50 and d84) are calculated from experimental data.
The main difference between both methods is that the bubble point, besides being a non-destructive technique, measures the air flow through the pores, while intrusion mercury porosimetry records the intrusion volume of mercury coming into the membrane pores. Intrusion mercury porosimetry works with higher pressure, which is considered a limitation because it can lead to sample deformation in the case of polymeric membranes [9]. Another limitation in the case of asymmetric membranes is the inability of this method to distinguish between the pores which determine the flux (usually in the selective layer) and the larger pores in the support [23]. In addition, intrusion mercury porosimetry also measures pores that do not participate in the permeation (non-connected pores).
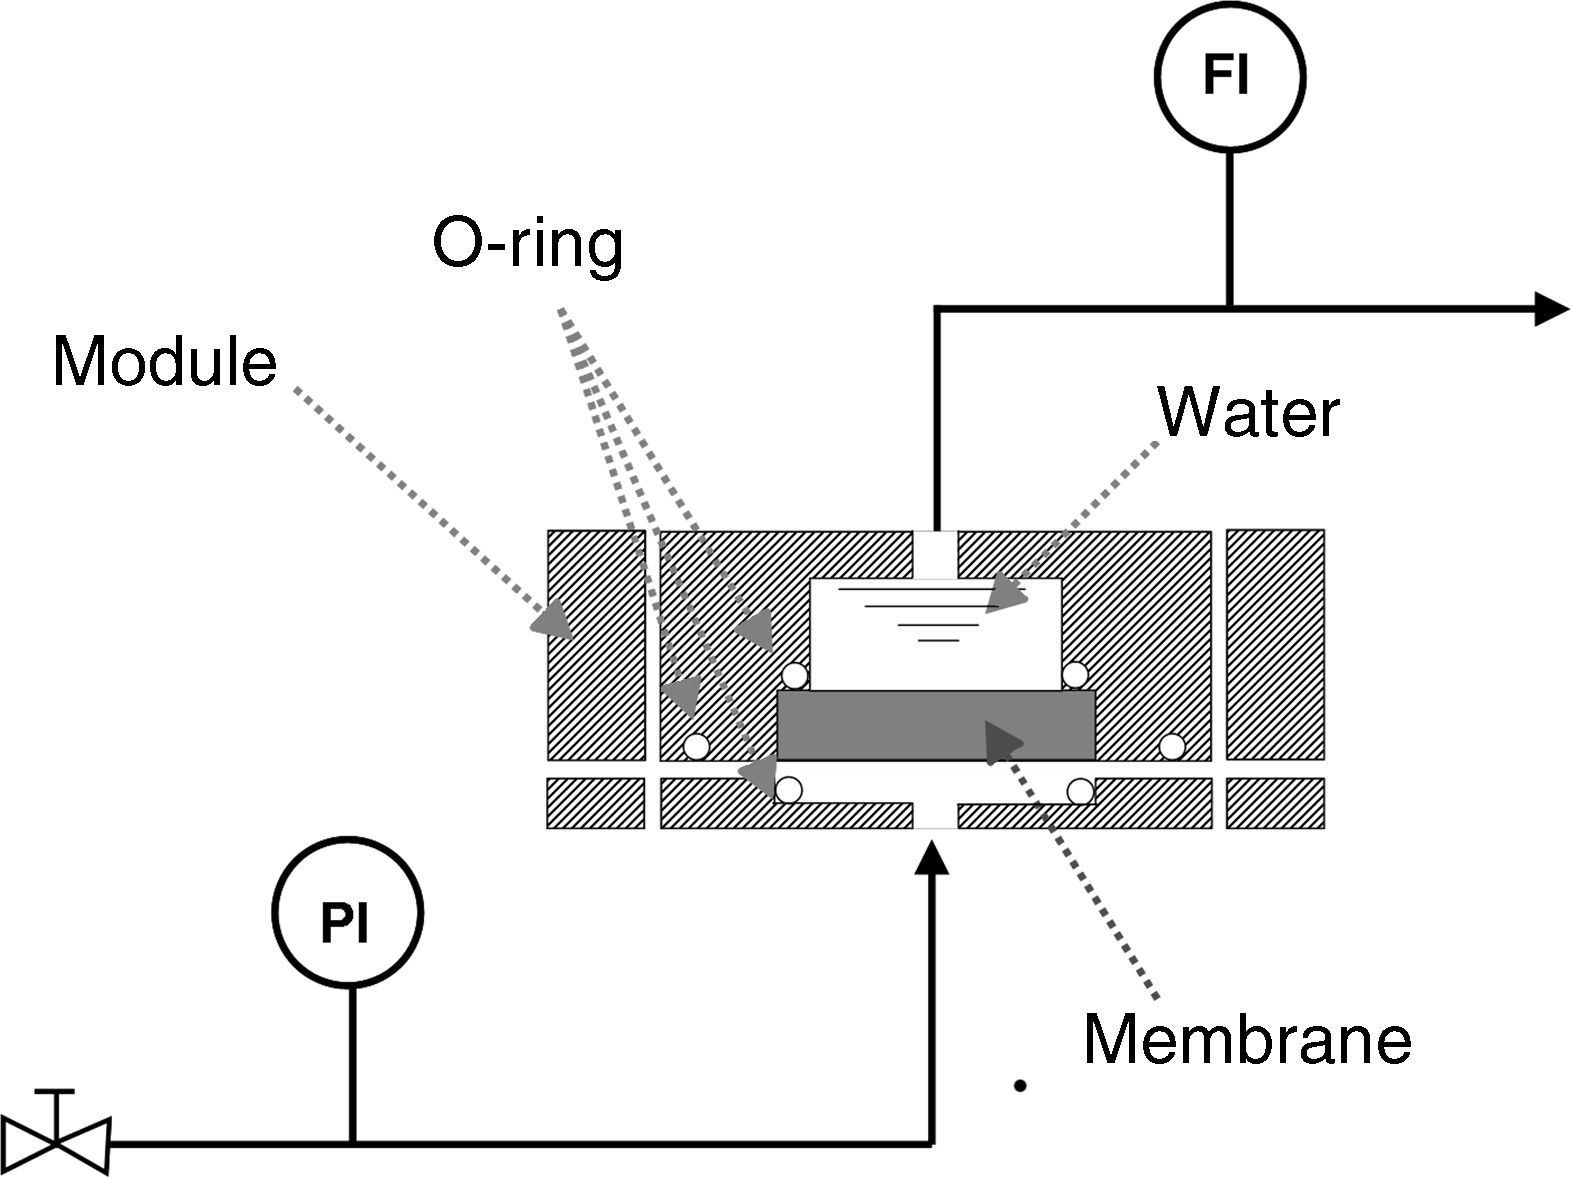
Bubble pointIn order to measure the pore size of the membranes by the bubble point method, two sets of air flow measurements were carried out. The first was performed with the dry membrane, measuring the air flow through the membrane while the transmembrane pressure (TMP) was gradually increased. A second set of measurements was performed with the same procedure, but the porous network of the membrane was previously filled with water (surface tension at the water/air interface, γ, is 72.75mN/m at 20°C [24]); this method is based on the fact that an air bubble will penetrate through the pore when its radius is equal to that of the pore, meaning that the contact angle is 0° (and cosφ=1) [25]. For this procedure, a steel module suitable for disk ceramic membranes with a diameter of 5cm was made and a set-up was designed as shown in Fig. 2. The sealing between the membrane and the module was made with Viton o-rings.
Intrusion mercury porosimetry
The pore size distribution for each membrane was also obtained by intrusion mercury porosimetry (Autopore IV 9500, Micromeritics Inc. USA). This technique is based on the measurement of the intrusion volume of a non-wetting liquid in order to calculate data related with the pore structure of the sample. Thus, the equipment continuously registers the variation of the intrusion volume of the mercury inside the sample depending on the pressure applied over the sample. Next, it calculates the pore diameter with the intrusion pressure, by means of the Washburn equation (surface tension at the mercury/air interface, γ, is 487mN/m at 20°C and contact angle, φ, is 135°), obtaining a graphic of cumulative pore volume versus pore size. Finally, the characteristic pore diameters (d16, d50 and d84) are calculated from experimental data.
Permeability: air and waterAir and water permeabilities were calculated by measuring the fluid flow (mLmin−1) through the membrane at room temperature while the applied pressure was gradually increased. The permeation was determined from the slope of the straight line obtained from the graphical plot of the air/water flux against applied pressure, per membrane area unit (m3h−1m−2bar−1). Air permeability was measured in the same module as described for the bubble point measurements, while water permeability was determined by means of two different pieces of equipment: an automatic liquid permeameter (LEP-1101-A, PMI, Ithaca, NY, USA) for membranes with higher permeability and a manual liquid permeameter for membranes with lower permeability.
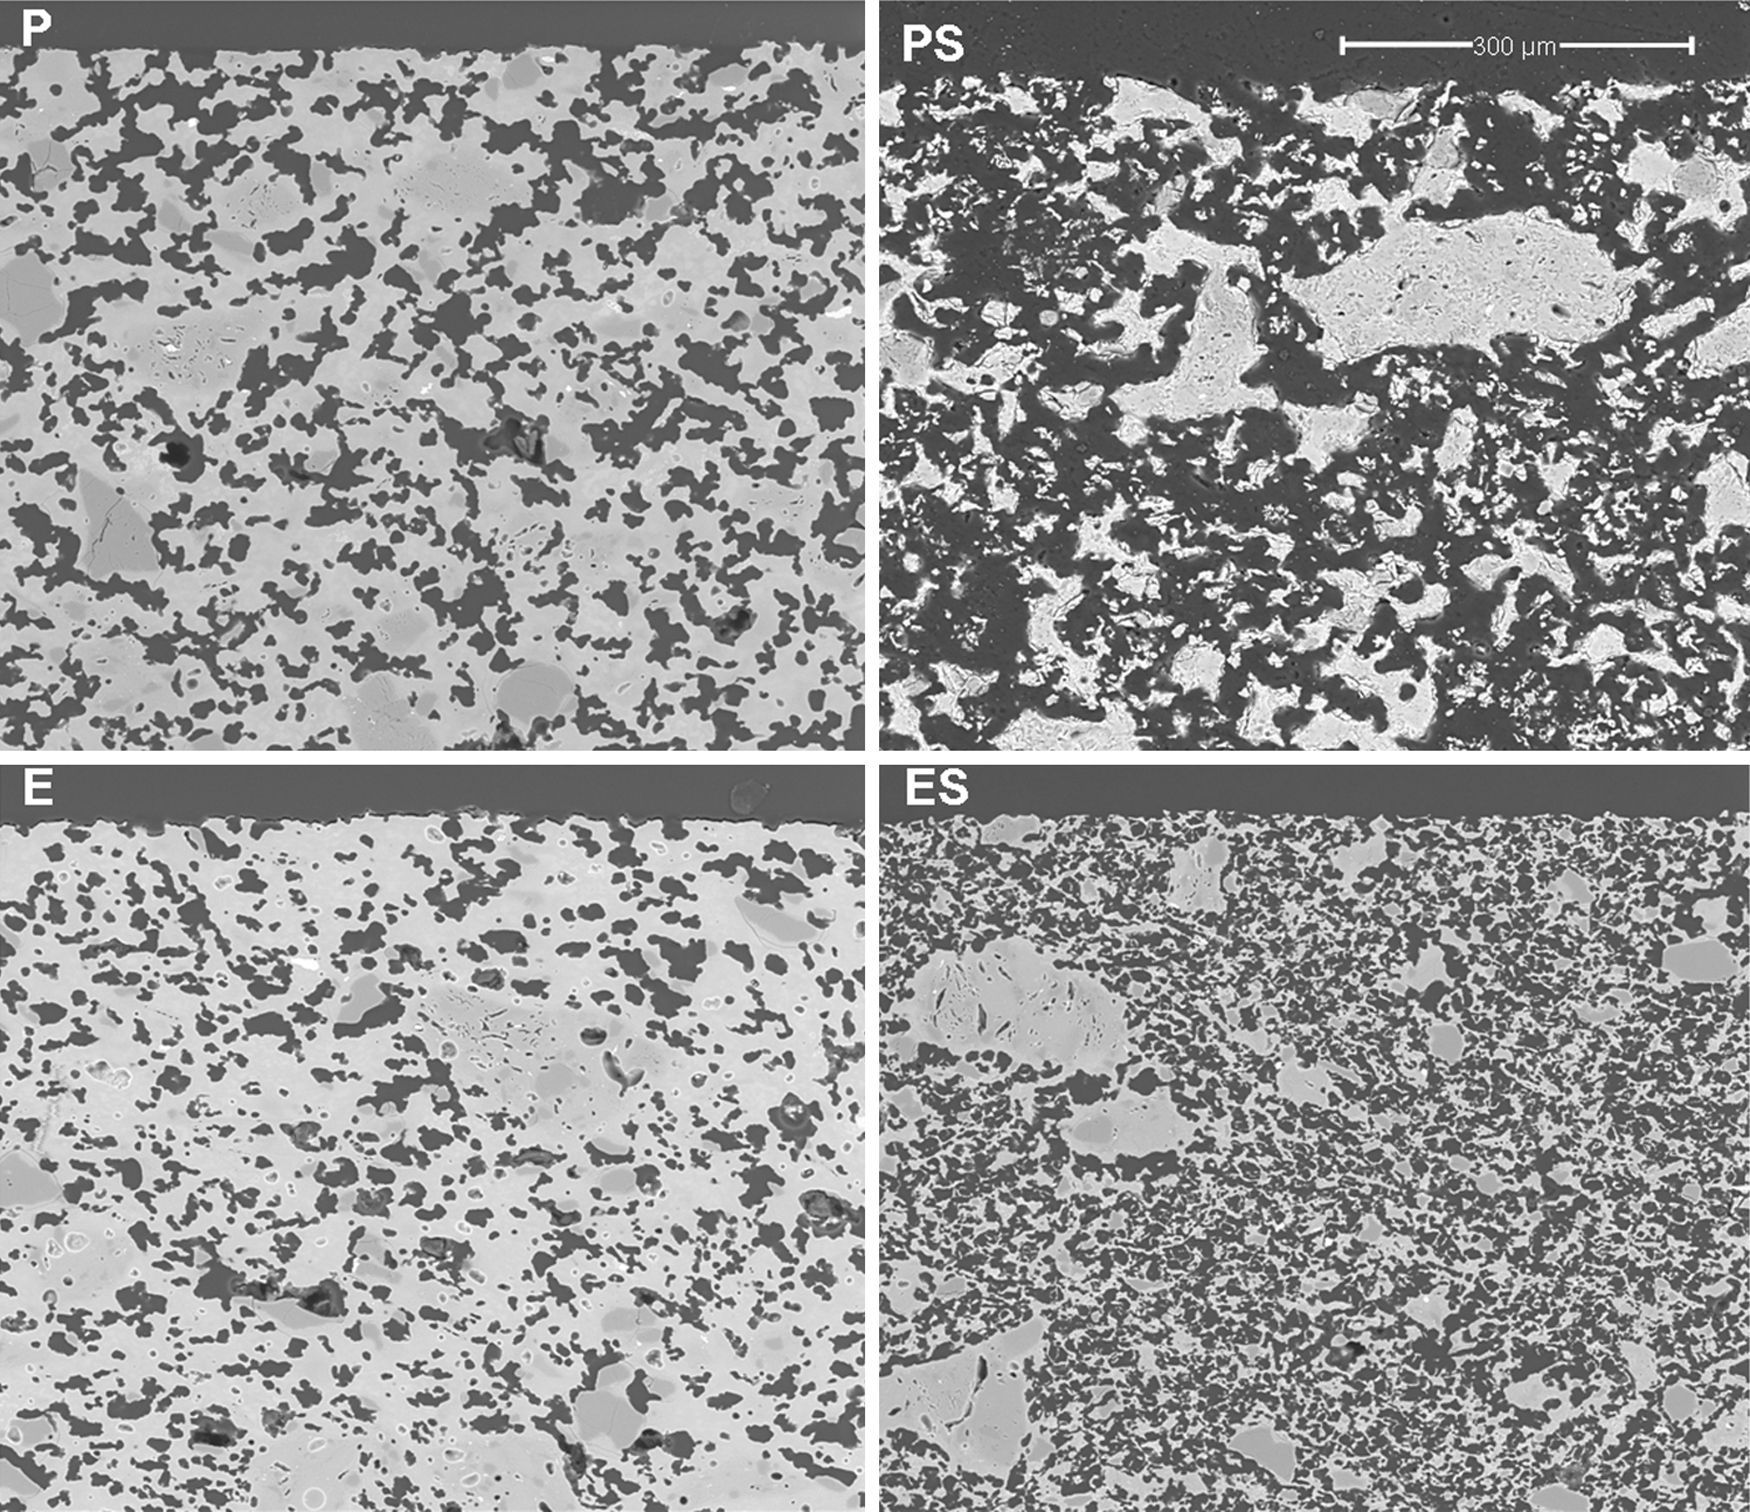
Results and discussionMembrane structure (SEM)Micrographs of polished sections of examples of the four types of membranes described in Table 2 are shown in Fig. 3. It can be seen that a continuous porous structure was created, the pores being larger when starch was employed as the pore generator in the preparation of the membrane (membranes PS and ES, compared with those without starch addition, P and S). The addition of starch increases porosity and pore size as well as pore connectivity, owed to the increase in the amount of interconnected pores created by starch burnout, which should result in an increase in permeability. This effect has been reported previously in the literature. Starch additions greater than 10wt% have been shown to increase the amount of interconnected pores created by starch burnout during the sintering step [4,26–28].
. Pores present a dark color in the micrographs.")
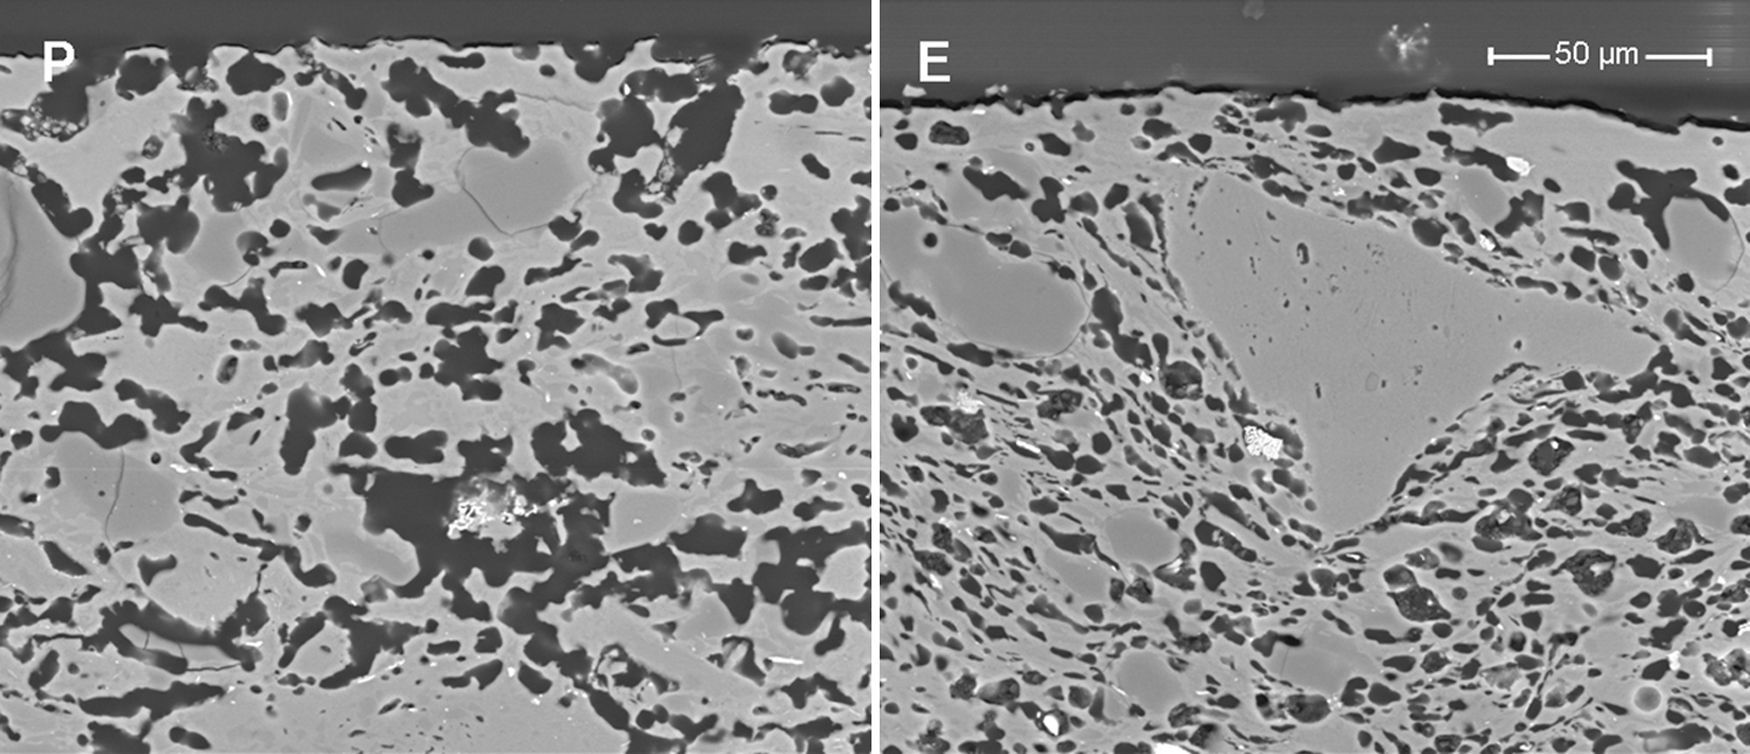
Samples obtained by extrusion (E and ES) have a lower pore size than the pressed samples owing to the different shaping processes (see Fig. 3). Fig. 4 shows the microstructures of two membranes of the same composition (high clay content and no starch), which have been obtained by extrusion and pressing. As can be seen, they differ mainly in the oriented and scarcely connected pore structure which is typical from the extruded materials. Pores from the pressed membrane are rounder and highly connected, whereas pores from the extruded membrane show a long shape and reduced connection. This characteristic microstructure is more evident in the surface of the membranes, where the oriented clay particles create a superficial layer that closes many pores near the surface. This effect have already been observed by several authors [4,29,30], who have reported that clay products manufactured by extrusion have a microstructure characterized by an orientated pore distribution. This is a consequence of the movement of the colloidal clay particles traveling through the auger extruder during the shaping step. Moreover, these pores have a reduced connectivity. In short, both the shaping method and the starch addition have a great influence on the microstructure of the support, modifying the pore size, porosity and pore connectivity and, consequently, the permeability, as it will be explained in Section “Air–water permeability”.
Bubble point and intrusion mercury porosimetry. Pores present a dark color in the micrographs.")
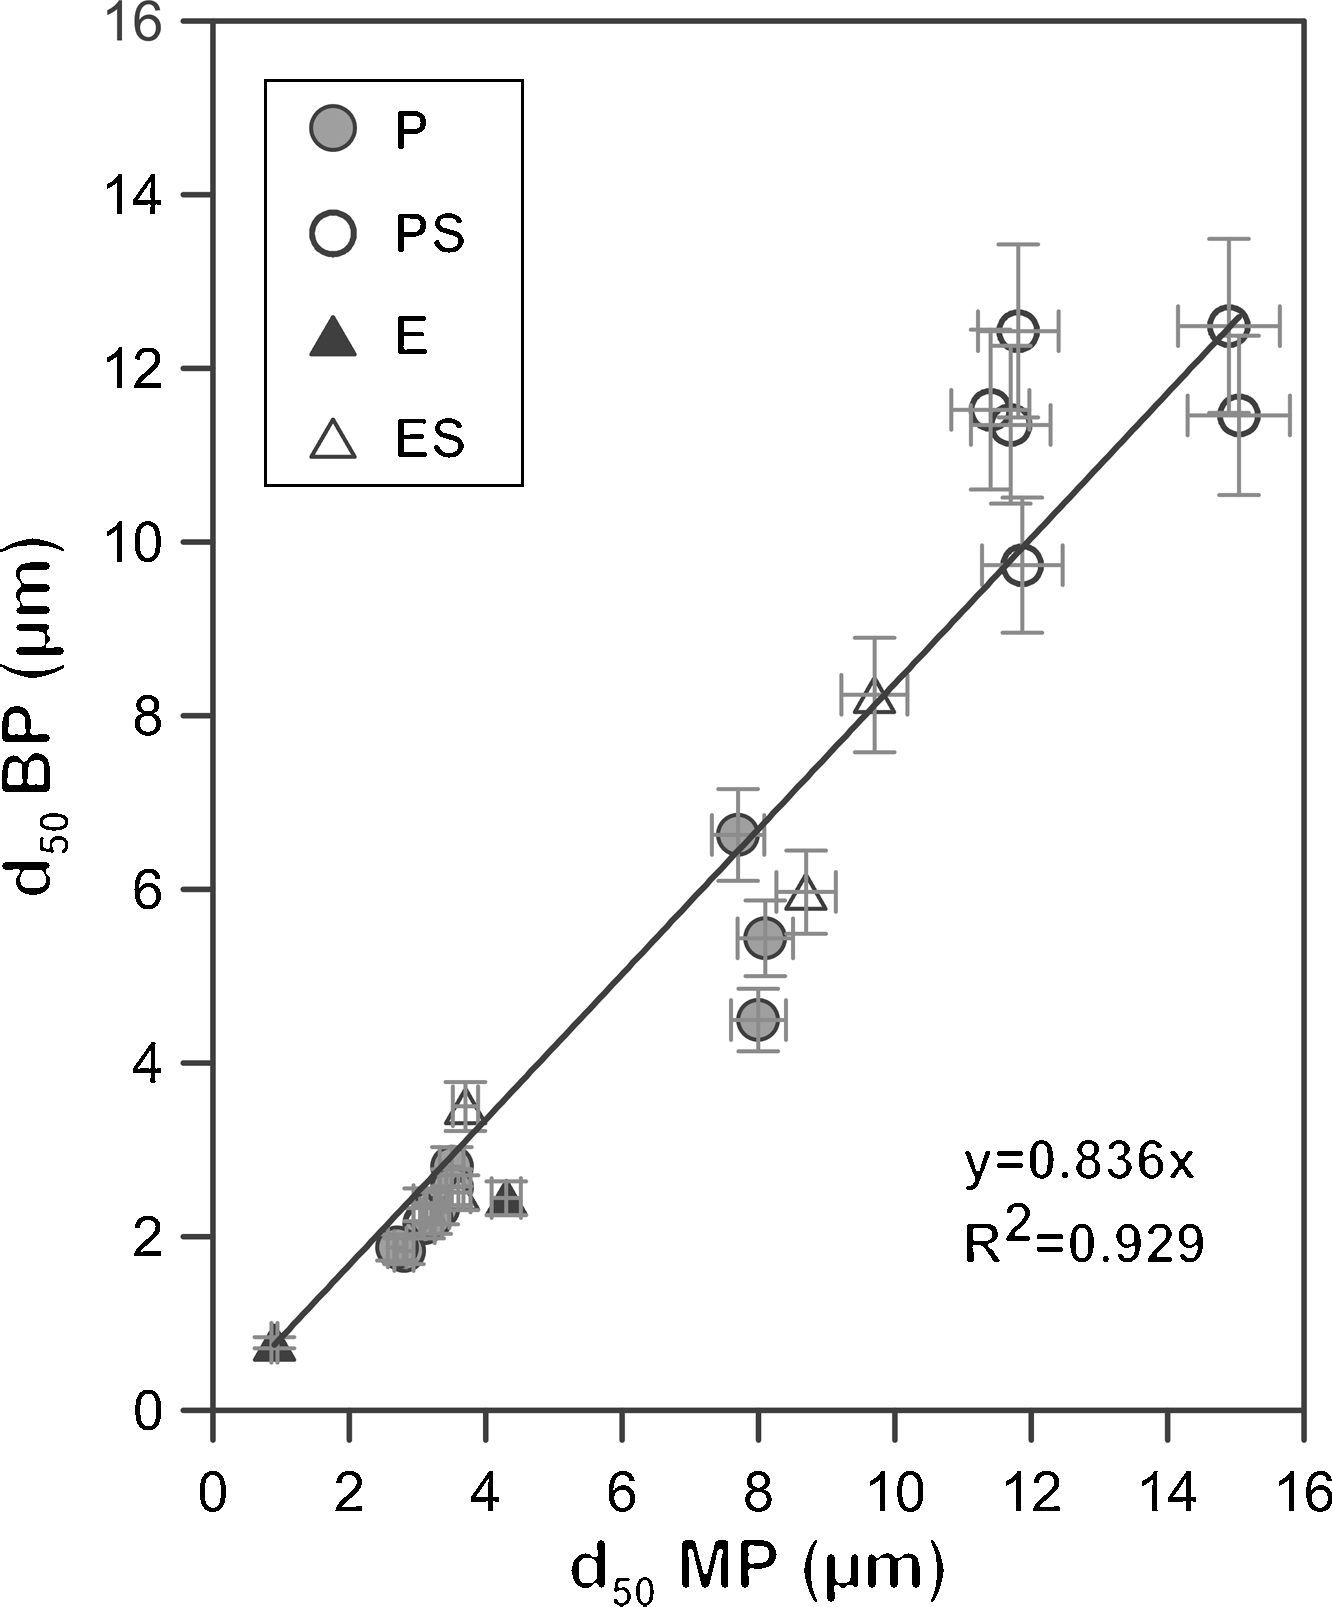
A graphical representation of the mean pore size obtained from the bubble point and intrusion mercury porosimetry characterization shows an approximate linear relationship between both methods with a coefficient R2 of 0.93 (Fig. 5) and a slope close to 1 (0.84). This suggests that both methods provide mean pore diameters of the same order in spite of the differences in the experimental approach. Small differences between the mean pore size measured by both methods are expected since in the bubble point method the mean pore diameter corresponds to a flow of a value of half as great as that in the absence of water (as it has been explained in Fig. 1), while in intrusion mercury porosimetry the mean pore diameter corresponds to the cut off pore size under which 50% of the total pore volume lies. In addition, since the real pores are not cylindrical, parallel and equal, the differences in both methods would affect the calculation of the mean value in different ways. The bubble point method measures pores that affect the liquid flow, which are pores that are connected to the surface and between them, but closed pores are not measured. On the other hand, intrusion mercury porosimetry technique measures all pores that mercury can reach with pressure, both open and non-connected pores. Moreover, because of the high pressures used, intrusion mercury porosimetry technique is able to reach smaller pores, which are no measurable for the bubble point method. Deviation between both methods have also been found by other authors, but the nature of the measured material affects to this deviation: Bhatia et al. [31] found that the mercury pore-size distributed results showed much larger pores in the geotextiles than did the bubble point method, whereas Calvo et al. [9] observed that mean pore diameters were lower for the intrusion mercury porosimetry curves when polycarbonate filters were analyzed.
 and intrusion mercury porosimetry (MP) methods (2 samples evaluated for each point).")
The good agreement, in spite of the differences between both methods, can be considered as confirmation of the validity of the bubble point method; which allows the replacement of intrusion mercury porosimetry technique by bubble point method to reduce the mercury use in characterization laboratories.
Finally, it is worth noting that the extruded samples show results closer to the linear relationship than the pressed samples. This could be due to the different microstructure that both shaping methods give to the supports, as described in Section “Membrane structure”. Supports obtained by means of the addition of starch in their composition also show a higher deviation from the linear relationship, probably owing to the fact that the big pores generated by the starch provide higher variability, being higher the error associated to the measurement. As it has been stated before, intrusion mercury porosimety provide the same status to all pores; on the other hand, bubble point method measures the effective diameter, which is affected by the pore size, since it influences the necessary energy to empty the pores. This has also been reported by Calvo et al. [9], who observed a better accordance for both characterizations (pore size distributions obtained by intrusion mercury posimetry and bubble point method) when pore size decreased.
The comparison between characteristic diameters (d16 and d84) calculated by bubble point method and intrusion mercury porosimetry shows the same tend that d50, so it has not been plotted in the present paper. A good agreement was achieved between the values obtained by these two different methods, which again is confirmation of the validity of the bubble point method. It is clear that the agreement was achieved because these membranes are symmetric. In the case of asymmetric membranes, the measurement of pore size distribution by intrusion mercury porosimetry would not reflect the size of the pores controlling the flow. In addition, the d84 pores generate the worst correlation (R2=0.919). This could be explained by the fact that mercury intrusion can measure very small and non-connected pores that take no part in the permeation, as it has been described previously.
Air–water permeabilityAccording to Eq. (2), a plot of the air flow (using the volume measured at the mean pressure) versus the transmembrane pressure (ΔP) should show a straight line (Fig. 6a). The slopes of these lines allow the permeation of each membrane to air to be calculated. On the other hand, water permeability is calculated by means of the slope of the straight line that appears when the water flow is represented versus ΔP (Fig. 6b). As Fig. 6a and b shows, pressed membranes show higher slopes (and permeabilities) than the extruded membranes. The permeability of the membranes obtained by uniaxial pressing is higher than those obtained by extrusion, confirming the results on microstructural features set out in Section “Membrane structure”: extruded membranes have smaller and less connected pores than pressed ones, which provokes a reduction in water and air permeability, effect that have been reported by the authors in previous works about low-cost ceramic membranes [4].
 (a) and water flow (b) versus transmembrane pressure for one example of each kind of membranes (1 sample evaluated for each curve).")
The addition of starch to the initial composition greatly improves the permeability, because compositions with starch have higher slopes than those without starch, as can be seen in Fig. 6a and b. The results are consistent with the microstructure observed in Section “Membrane structure”, where it has been stated that the addition of starch to the membrane's composition increase the pore size and the connectivity of the pores, owed to the porosity created when starch is burnt out during the sintering step, increasing the membrane's permeability (air and water). This is especially effective for starch percentages higher than 10wt%, since a connected coarse pore network is developed, as has been detailed in previous works [32].
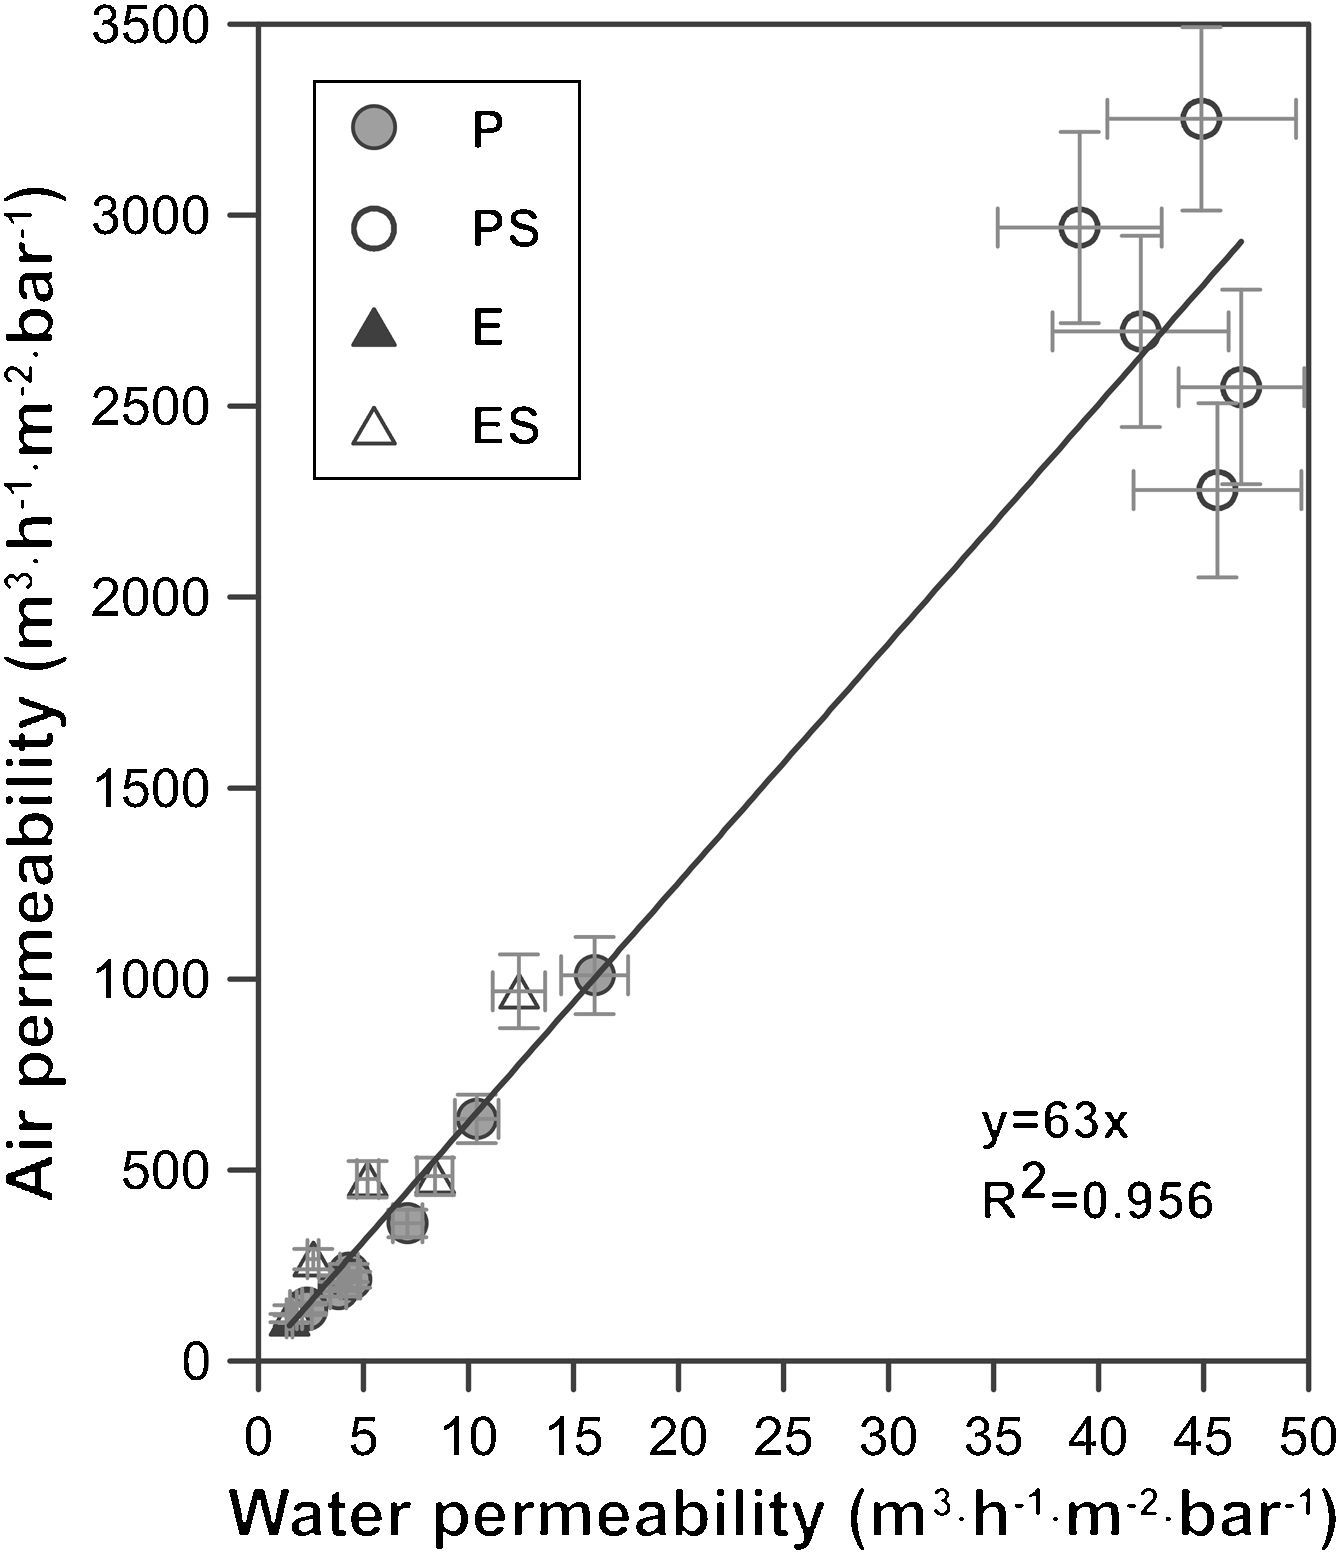
A graphical representation of air and water permeability obtained from the experimental values shows a linear relationship between both measurements with a coefficient R2 of 0.96 (Fig. 7). As has been pointed out previously, samples with higher permeability (membranes PS, shaped by pressing and with starch addition) do not follow the general trend as well as the rest of the samples. This is expected, since these samples exhibit permeability values that are twice or three times higher than those of the rest of samples. Moreover, mean pore size of PS samples follow the same pattern, since they do not fit to the general trend as well as the other compositions. Similar conclusions have been found in previous researches carried out by the same authors [4].
.")
The slope of the straight line in Fig. 7 (value 63) confirms the relationship between both measurements. The relationship between air and water permeabilities is close to the theoretical value of 56 calculated for the ratio of air and water permeation from the Hagen–Poiseuille equation, using the viscosities of air (1.837×10⁻⁵Nsm−2) and water (1.002×10⁻³Nsm−2) at 20°C (Eq. (3)):
where f is the ratio of air and water permeation, J is the flux and μ is the viscosity of every fluid (air or water).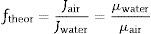
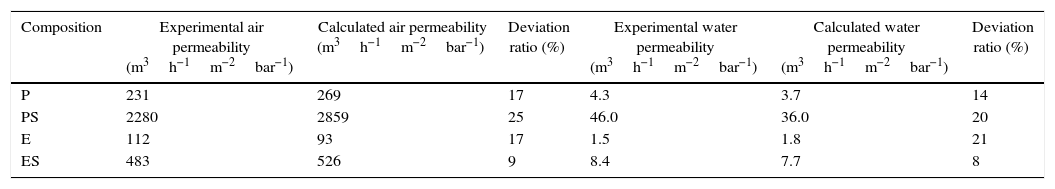
This good agreement between the ratio of permeabilities for air and water with the ratio of viscosities suggests that it could be possible to estimate the permeability for a fluid from the permeability experimentally measured with the other and vice versa, as Table 3 confirms.
Examples of permeability estimation based Eq. (3) for compositions of each series.
| Composition | Experimental air permeability (m3h−1m−2bar−1) | Calculated air permeability (m3h−1m−2bar−1) | Deviation ratio (%) | Experimental water permeability (m3h−1m−2bar−1) | Calculated water permeability (m3h−1m−2bar−1) | Deviation ratio (%) |
|---|---|---|---|---|---|---|
| P | 231 | 269 | 17 | 4.3 | 3.7 | 14 |
| PS | 2280 | 2859 | 25 | 46.0 | 36.0 | 20 |
| E | 112 | 93 | 17 | 1.5 | 1.8 | 21 |
| ES | 483 | 526 | 9 | 8.4 | 7.7 | 8 |
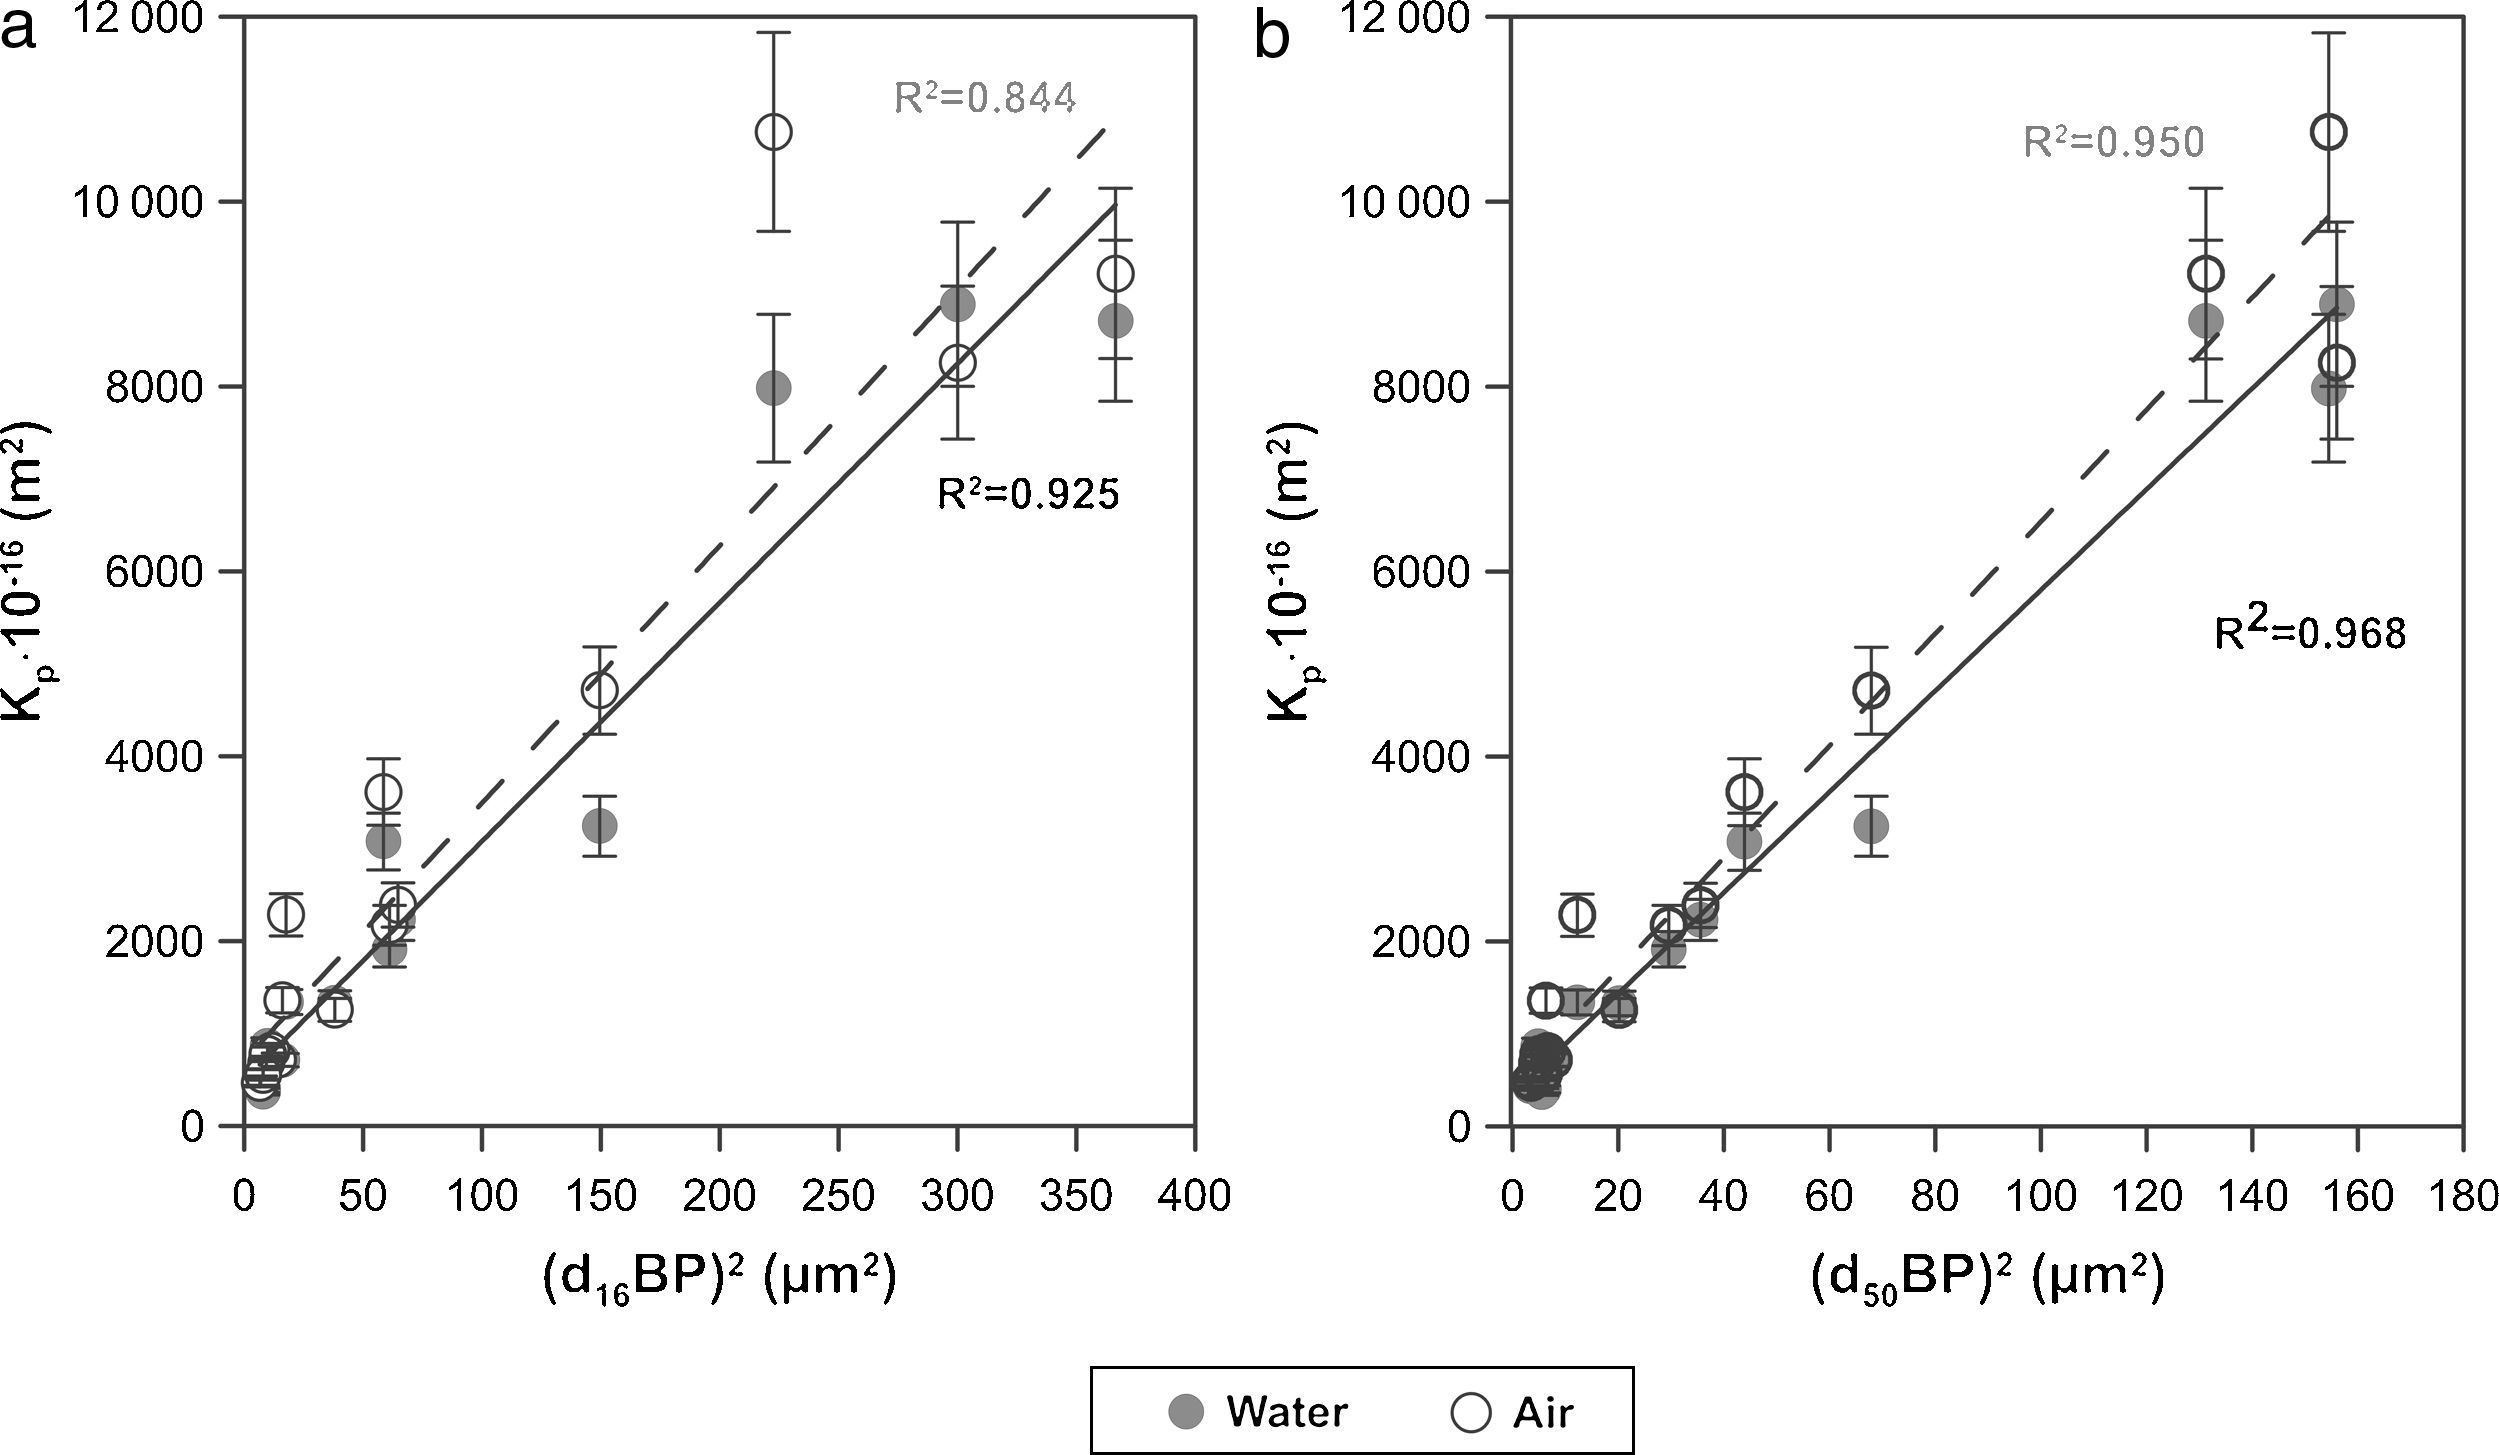
Finally, the influence of the pore size (obtained by the bubble point method and intrusion mercury porosimetry) over the water and air permeability coefficient (Kp) has been evaluated. As reported in a previous research study [33], the Hagen–Poiseuille (Eq. (4)) relates the permeability coefficient with the pore radius (r), the water viscosity (μ), the surface porosity (¿sf) and the tortuosity factor (τ):

Assuming that the ratio ¿sf/τ varies little between the membranes, the model predicts an approximately linear relationship between Kp and r2. This relationship has been represented in Fig. 8 for both d16 (a) and d50 (b), obtained by the bubble point method. The correlation is slightly better with the mean diameter (d50) obtained with the bubble point method, which indicates that d50 is a good parameter for defining the properties of the support as a membrane. The differences found between this trend and the trend obtained in the referenced work [33], where the correlation was slightly better with the d16 parameter (obtained with the mercury porosimeter), may be due to the different measuring techniques. Since mercury porosimeter measures all the pores of the membrane (connected and non-connected), the pore diameter d16 represents the pores of bigger diameter, which are the pores that have higher influence over the fluid permeability. On the other hand, bubble point method measures the pores that participate in the fluid flux, so the d50 is representative of the effective pore size. This possibly explains the differences obtained in the diameter that correlates better with the permeability.
Conclusions and d50 (b) pore size measured by bubble point (BP) method (2 samples evaluated for each point).")
A study of the relationship between mean pore sizes measured by two different methods (bubble point and intrusion mercury porosimetry) has been carried out using a set of low cost ceramic membranes prepared using different procedures and compositions. The air and water permeabilities of the tested membranes were compared, achieving a good correlation between both experimental values. These permeabilities were related by the Hagen–Poiseuille model with the ratio of the viscosities for air and water. Moreover, both permeabilities have a relationship with the square pore diameter, as the Hagen–Poiseuille equation predicts.
SEM images showed a higher porosity of the membranes prepared with starch, which also had higher permeability. This result confirms the suitability of starch as a pore former in the preparation of low cost ceramic membranes. Membranes prepared with uniaxial pressing provided higher permeability than those obtained by extrusion, for the same composition of the starting mixture.
To sum up, a good correlation between both methods was found. The consistency between the two methods opens up the possibility of replacing mercury intrusion in some applications. Good agreement was also obtained in the measurements of the pore size distribution width (d16 and d84).
This paper includes results of the NITRAMEM (IPT-2012-0069-310000) project, funded with a total amount of 870,455.39 Euros by the Ministry of Economy and Competitiveness and the European Regional Development Fund (ERDF) of the European Union, INNPACTO through the program, which the authors show their gratitude.
The Hagen–Poiseuille equation (2) was deduced for a non-compressible fluid. For a compressible fluid it can be expressed as:

Since the gas is compressible, the volumetric flow varies with the pressure, and it is preferable to give the volumetric flow as a function of the molar flow. According to the ideal gas equation we have:
where F is the molar flow. Substituting Eq. (A.2) in Eq. (A.1) we obtain:
By separating variables and integrating, with P2 and P1 as the pressure in retentate and permeate side respectively, we obtain:
Eq. (A.4) has been extensively used to describe the laminar flow in a porous membrane (e.g. [20]). However, if the volumetric flow measured at the mean pressure (Pm=(P1+P2)/2) is defined by:it is possible to rewrite Eq. (A.4) as:Thus Eq. (A.6) allows the same form of the Hagen–Poiseuille equation employed for liquids (Eq. (2)), but using as volumetric flow the value calculated at the mean pressure in the membrane (Eq. (A.5)).