


(1) To analyze the prevalence of Intimate Partner Violence by types. (2) To examine the relationship between sociodemographic characteristics and Intimate Partner Violence.
DesignCross-sectional study using a self-administered questionnaire.
SettingPrimary Healthcare centers in Spain.
Participants10,322 women (18–70 years) attending Primary Healthcare centers.
Main measurementsA compound index was calculated based on frequency, types, and duration of Intimate Partner Violence. Multivariable adjusted logistic regression models were used to identify the sociodemographic factors, which were independently associated with each Intimate Partner Violence category.
ResultsThe prevalence of Intimate Partner Violence was 24.8%. For the physical only category, no differences were observed regarding education or employment status, and women with the highest income have less risk. For the psychological only category, no differences were observed according to the income level. The risk increases as the education level decreases, and the greatest frequency of only psychological Intimate Partner Violence was observed in women who were unemployed or students. For both the physical and psychological category of Intimate Partner Violence, a clear risk increase is observed as income and education levels decrease. Retired women showed the highest frequency of this violence category.
ConclusionThe results show that Intimate Partner Violence affects women of all social strata, but the frequency and Intimate Partner Violence category will vary according to the socio-economic.
1) Analizar la prevalencia de Violencia de Pareja por tipos. 2) Examinar la relación entre las características sociodemográficas y la Violencia de Pareja.
DiseñoEstudio transversal a través de cuestionario autoadministrado.
EmplazamientoCentros de Atención Primaria en España.
Participantes10.322 mujeres (de 18 a 70 años) asistentes a Centros de Atención Primaria.
Mediciones principalesSe ha calculado un índice compuesto en función de la frecuencia, el tipo y la duración de la Violencia de Pareja. Se ha llevado a cabo modelos ajustados de regresión logística multivariable para identificar los factores sociodemográficos que se asocian de forma independiente con cada categoría de Violencia de Pareja.
ResultadosLa prevalencia total de Violencia de Pareja fue de 24.8%. Para la violencia física, no se observaron diferencias en cuanto a la educación y la situación laboral y las mujeres con mayores ingresos tienen menos riesgo de sufrir violencia física. Para violencia psicológica, no se observaron diferencias según el nivel de renta. El riesgo aumenta a medida que el nivel de educación disminuye, y en las mujeres desempleadas y las estudiantes. Para la categoría de violencia tanto física como psicológica, se observa un claro aumento del riesgo según disminuye el nivel de renta y el nivel educativo de las mujeres. Las mujeres jubiladas mostraron una mayor prevalencia de violencia en esta categoría.
ConclusionesLos resultados muestran que la IPV afecta a mujeres de todos los estratos sociales pero que la frecuencia de las diferentes categorías de IPV varían de acuerdo con el nivel socioeconómico.
Intimate Partner Violence (IPV) against women is currently recognized as a relevant public health problem and a violation of women's fundamental human rights.1 Furthermore, the serious physical and psychological health consequences of this violence are well known.2
Internationally, a systematic search conducted to compile evidence on the prevalence of IPV, yielded the global prevalence of physical and/or sexual intimate partner violence among all ever-partnered women was 30.0%,3 although there is considerable regional variation in the prevalence of physical and/or sexual partner violence.4
In general, the studies published to date have used convenience samples, or have been carried out in not very large samples, which has not permitted a comprehensive analysis of the sociodemographic characteristics of the abused women that usually need to be grouped due to simple size constraints. It should also be noted that most of the research on IPV prevalence and associated factors in the past have mainly focused on physical IPV,5,6 and that our understanding about emotional abuse is not so comprehensive. It would be of great interest to know the prevalence of IPV by type, the characteristics of the various kinds of abuse, and whether the factors associated with each of them and therefore the prevention strategies to adopt should be different.
Thus, the objectives here set are: (a) To analyze the prevalence of IPV by types (physical and psychological) and by excluding categories, in the previous year, prior to the previous year and in the women's lifetime; (b) To examine the relationship between sociodemographic characteristics and lifetime IPV, lifetime IPV physical only, psychological only and both physical and psychological.
MethodsDesign and participantsThis study was designed and developed by 6 research groups in Spain. In this cross-sectional survey, women were recruited during 2006–2007 from female patients aged 18–70 years old seeking medical care for whatever reason in primary healthcare centers. Women were considered non-eligible if they were illiterate, did not understand Spanish or had severe cognitive disabilities that impaired their ability to complete the written questionnaire. Following the ethical guidelines for research into domestic violence,7 females who attended the practice with a male partner were excluded.
Sample designA multistage cluster sampling scheme was used. Data were nationally and regionally representative. The first stratification variable was the province. Primary sampling units were the towns in each province, which were also grouped in strata according to their population size (non-capital city <10,000 inhabitants, non-capital 10,000–50,000 inhabitants, noncapital >50,000 inhabitants and capital city). Secondary sampling units were primary healthcare centers in the towns, and tertiary sampling units were the practices in these centers (physician). Final sampling units were the women who were randomly selected according to the scheduled time of the visit. The sample size required for a 95% confidence interval, an expected lifetime IPV prevalence of 30%, a sampling error of ±4%, and a design effect of 1.35, was 11,808.
ProceduresData were collected by the physician at the end of each woman's consultation. Women who met the eligibility criteria were invited to participate and, if they gave verbal informed consent for participation, a self-administered questionnaire was handed to them in an envelope. Once the questionnaire was completed, it was inserted in a sealed envelope by the woman and returned to the physician. The questionnaire could be answered in approximately 15min. All of the women were informed that confidentiality and anonymity of their responses would be guaranteed. The envelope contained information on community resources available in the province for battered women.
Variables associated with IPV- a)
Current IPV (previous 12 months). This was measured using the Index of Spouse Abuse (ISA),8 adapted and validated in Spain.9 The ISA, a 30-item scale, assesses the presence and severity of physical and psychological abuse by means of two independent sub-scales (ISA- Physical and ISA Psychological). Sexual violence is included in the ISA-Physical sub-scale. ISA's 2 subscales give continuous scores within a range between 0 and 100, and higher scores represent more severe abuse. The cut-off point on either of the two sub-scales is 6 for ISA-Physical and 14 for ISA-Psychological.
- b)
Past IPV (prior to the previous 12 months). The women were asked if an intimate partner had abused them physically (hit, slapped, kicked, pushed them, etc.) psychologically (threatened, insulted, humiliated, been extremely jealous, scared them, etc.) and/or sexually (forced them to engage in sexual activities against their will) prior to the previous 12 months. These three questions, which had been used in previous studies,10,11 showing high comprehensibility and acceptability, had three possible responses: “many times”, “sometimes” and “never”. In order to be consistent with the ISA classification of types of abuse, a woman was considered to have been physically abused prior to the previous 12 months if she answered “many times” or “sometimes” to either of the two questions about physical and/or sexual violence, and psychologically if she responded in the affirmative to the question about psychological IPV.
- c)
Lifetime IPV. A woman was considered to have experienced IPV at some point in her life if she scored above the cut-off point in any of the two ISA sub-scales and/or scored positive in any of the three questions about IPV prior to the previous year. Because there is usually a considerable overlap between IPV types, we created three mutually exclusive hierarchical categories of abuse through the combination of the different types1: Lifetime IPV only physical2; Lifetime IPV only psychological3; Lifetime IPV both physical and psychological. These categories were examined for each time period in which the IPV took place: previous year, prior to the previous year and lifetime.
- d)
Duration of IPV (years). This was measured by asking the following question: “For how many years did you suffer this abuse?”.
- e)
Age of onset of IPV (years). This was measured by asking the following question: “How old were you when this abuse started?”.
The following sociodemographic factors were taken into account for this study: country of origin, marital status, living with partner, employment status, education, monthly household income, age, number of children in the household, and population size of the municipality of residence.
Statistical analysisTo determine the prevalence of IPV, only “ever-partnered women” were included in the analysis. For descriptive univariate analyses, we used frequency tables for categorical variables, and means, medians (for variables with non-normal distribution), standard deviations, minimums and maximums for continuous ones. For the bivariate analysis, the chi-square test was used to analyze the links between categorical variables, and the Mann–Whitney non-parametric test was used to analyze the links between categorical and continuous variables with non-normal distribution. Raw OR's were calculated and four logistic regression analyses were executed in order to identify the sociodemographic factors, which were independently associated with each IPV category. Statistical significance was set at p<0.05.
Given that the global sample used in this study is not proportional to the population size in each region, we used weightings for all of the analyses. Furthermore, since the accuracy of the results might have been affected by the multistage stratified sampling method used, confidence intervals for all the analyses were adjusted by the design effect, using the statistical software package STATA, version 8.0.
Results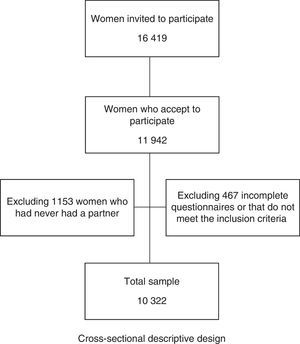
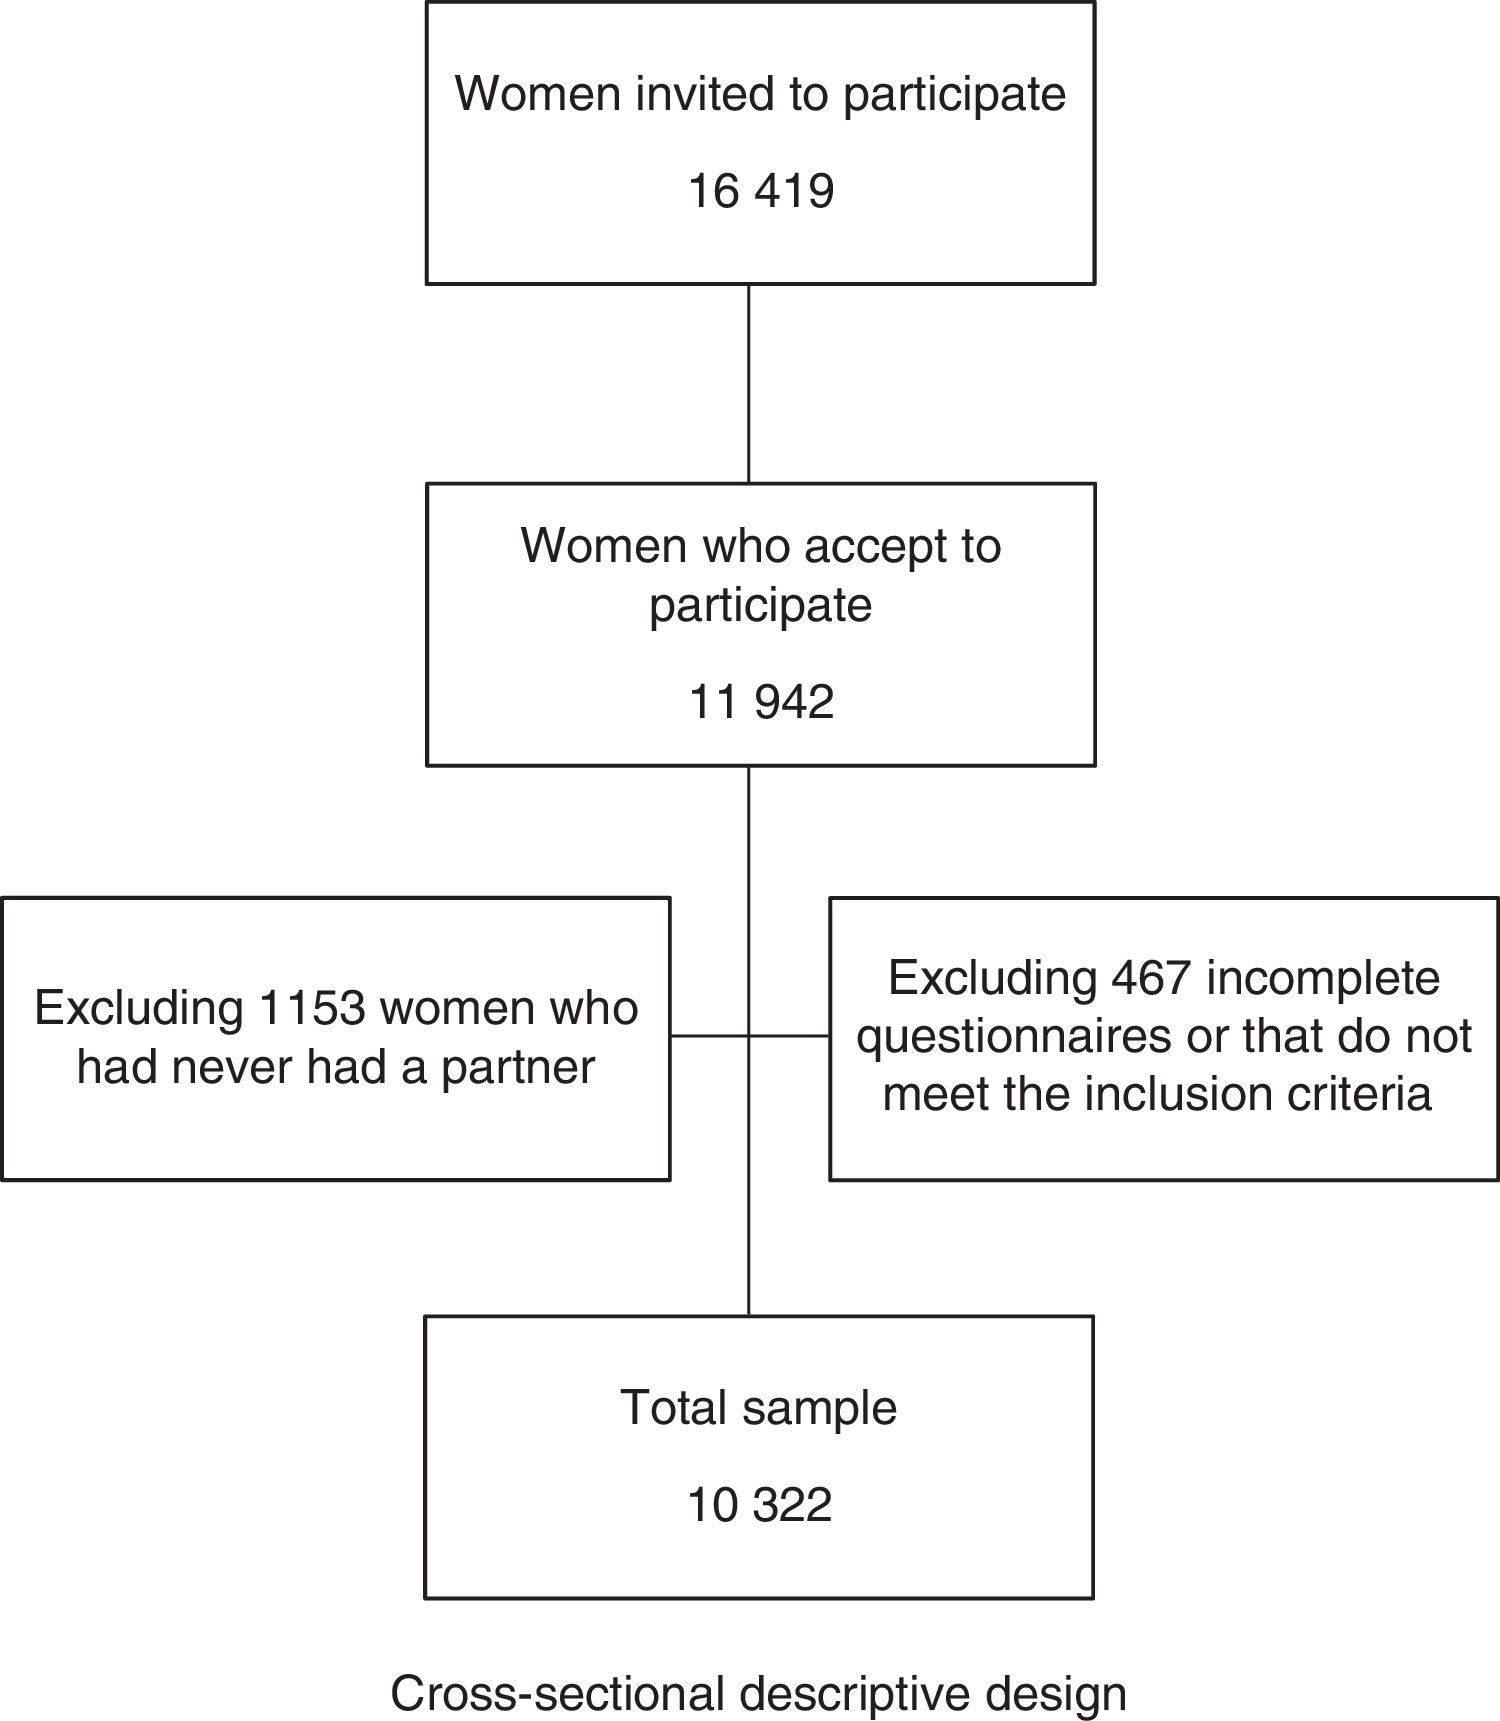
16,419 women were approached and the response rate was 72.8%, giving a sample of 11,942 women. The final sample was 10,322 after excluding 1153 women who had never had a partner and a further 467 due to incomplete data or because they did not meet the inclusion criteria.
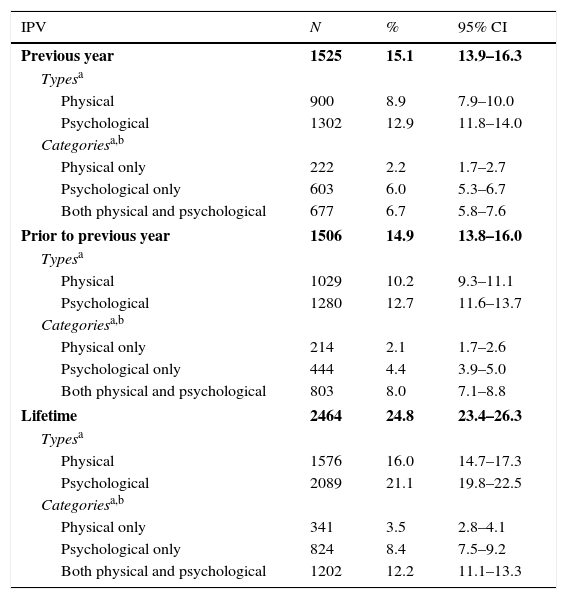
IPV prevalence rates by type and categoryAlmost one quarter of the women, 24.8% (n=2464) had experienced some type of IPV. The lifetime prevalence rate of physical and psychological IPV was 16% and 21.1% respectively. Regarding the different categories, 3.5% said that they had experienced only physical abuse, 8.4% only psychological abuse, and 12.2% both physical and psychological abuse. The prevalence of IPV in the previous year was 15.1% and prior to the previous year, 14.9%. Psychological abuse was also more prevalent than physical, both in the previous year and prior to the previous year, and the most prevalent category of abuse was also “both physical and psychological” (Table 1).
IPV prevalence in ever-partnered women attending primary healthcare centers in Spain.
| IPV | N | % | 95% CI |
|---|---|---|---|
| Previous year | 1525 | 15.1 | 13.9–16.3 |
| Typesa | |||
| Physical | 900 | 8.9 | 7.9–10.0 |
| Psychological | 1302 | 12.9 | 11.8–14.0 |
| Categoriesa,b | |||
| Physical only | 222 | 2.2 | 1.7–2.7 |
| Psychological only | 603 | 6.0 | 5.3–6.7 |
| Both physical and psychological | 677 | 6.7 | 5.8–7.6 |
| Prior to previous year | 1506 | 14.9 | 13.8–16.0 |
| Typesa | |||
| Physical | 1029 | 10.2 | 9.3–11.1 |
| Psychological | 1280 | 12.7 | 11.6–13.7 |
| Categoriesa,b | |||
| Physical only | 214 | 2.1 | 1.7–2.6 |
| Psychological only | 444 | 4.4 | 3.9–5.0 |
| Both physical and psychological | 803 | 8.0 | 7.1–8.8 |
| Lifetime | 2464 | 24.8 | 23.4–26.3 |
| Typesa | |||
| Physical | 1576 | 16.0 | 14.7–17.3 |
| Psychological | 2089 | 21.1 | 19.8–22.5 |
| Categoriesa,b | |||
| Physical only | 341 | 3.5 | 2.8–4.1 |
| Psychological only | 824 | 8.4 | 7.5–9.2 |
| Both physical and psychological | 1202 | 12.2 | 11.1–13.3 |
Most of the women in the sample were of Spanish origin (94.1%), married (65.7%), and lived with their partner (74.8%). 58.4% were employed, 32% had completed primary education and 28.3% had a college or university degree. Almost 6% had a monthly household income of over 1200 € and 41.1% had no children. Women in the sample group who were 40 years of age or younger was 49% and 38.2% lived in a provincial capital city.
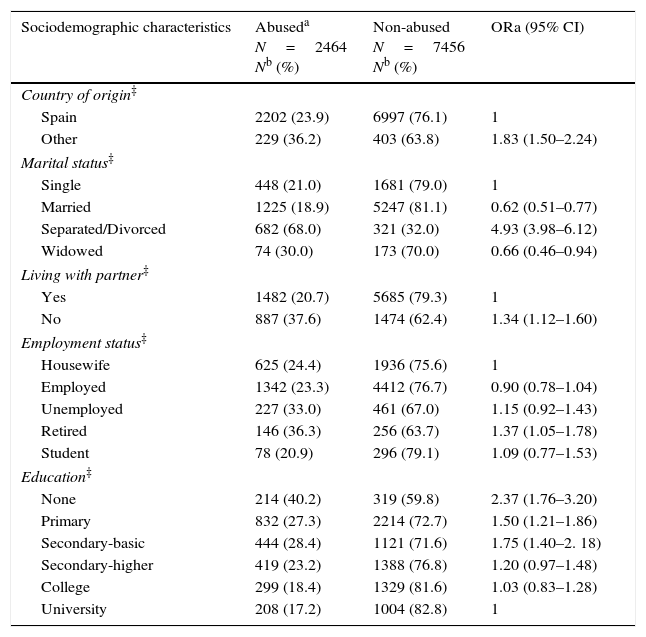
The prevalence of lifetime IPV was significantly higher among non-Spanish women (36.2%) than Spanish ones (23.9%) (OR=1.83); among separated and divorced women than single women (OR=4.93), among women not living with their partner (OR=1.34); and among retired women (OR=1.37). Women with the lowest levels of education (OR=2.37) were most likely to have experienced IPV. The prevalence of partner abuse was highest in medium-sized municipalities. IPV frequency increased significantly as the income level decreased, and the age of the woman and number of children increased. The median age of onset of IPV was 25 years and the median duration of the abuse was 7 years (Table 2).
Association between sociodemographic characteristics and lifetime IPV. Multivariate analysis.
| Sociodemographic characteristics | Abuseda N=2464 Nb (%) | Non-abused N=7456 Nb (%) | ORa (95% CI) |
|---|---|---|---|
| Country of origin‡ | |||
| Spain | 2202 (23.9) | 6997 (76.1) | 1 |
| Other | 229 (36.2) | 403 (63.8) | 1.83 (1.50–2.24) |
| Marital status‡ | |||
| Single | 448 (21.0) | 1681 (79.0) | 1 |
| Married | 1225 (18.9) | 5247 (81.1) | 0.62 (0.51–0.77) |
| Separated/Divorced | 682 (68.0) | 321 (32.0) | 4.93 (3.98–6.12) |
| Widowed | 74 (30.0) | 173 (70.0) | 0.66 (0.46–0.94) |
| Living with partner‡ | |||
| Yes | 1482 (20.7) | 5685 (79.3) | 1 |
| No | 887 (37.6) | 1474 (62.4) | 1.34 (1.12–1.60) |
| Employment status‡ | |||
| Housewife | 625 (24.4) | 1936 (75.6) | 1 |
| Employed | 1342 (23.3) | 4412 (76.7) | 0.90 (0.78–1.04) |
| Unemployed | 227 (33.0) | 461 (67.0) | 1.15 (0.92–1.43) |
| Retired | 146 (36.3) | 256 (63.7) | 1.37 (1.05–1.78) |
| Student | 78 (20.9) | 296 (79.1) | 1.09 (0.77–1.53) |
| Education‡ | |||
| None | 214 (40.2) | 319 (59.8) | 2.37 (1.76–3.20) |
| Primary | 832 (27.3) | 2214 (72.7) | 1.50 (1.21–1.86) |
| Secondary-basic | 444 (28.4) | 1121 (71.6) | 1.75 (1.40–2. 18) |
| Secondary-higher | 419 (23.2) | 1388 (76.8) | 1.20 (0.97–1.48) |
| College | 299 (18.4) | 1329 (81.6) | 1.03 (0.83–1.28) |
| University | 208 (17.2) | 1004 (82.8) | 1 |
| Sociodemographic characteristics | Abuseda N=2464 Nb (%) | Non-abused N=7456 Nb (%) | ORa (95% CI) |
|---|---|---|---|
| Monthly household income‡ | |||
| < €600 (euro) | 318 (39.6) | 486 (60.4) | 1.84 (1.36–2.49) |
| €601 – 900 | 438 (35.6) | 791 (64.4) | 1.68 (1.28–2.21) |
| €901–1200 | 528 (27.5) | 1394 (72.5) | 1.42 (1.10–1.84) |
| €1201–1800 | 570 (22.7) | 1946 (77.3) | 1.21 (0.94–1.55) |
| €1801–3600 | 389 (17.1) | 1886 (82.9) | 1.13 (0.88–1.46) |
| > €3601 | 111 (15.0) | 629 (85.0) | 1 |
| Population size‡ | |||
| < 10,000 inhabitants | 468 (21.8) | 1682 (78.2) | 1 |
| 10,000 – 50,000 inh. | 675 (27.0) | 1829 (73.0) | 1.35 (1.16–1.58) |
| > 50,000 inhabitants | 463 (25.5) | 1355 (74.5) | 1.17 (0.99–1.40) |
| Capital city | 858 (24.9) | 2590 (75.1) | 1.16 (1.00–1.35) |
| Age (years)‡ | |||
| 18–30 | 401 (20.0) | 1607 (80.0) | 1 |
| 31–40 | 606 (22.7) | 2064 (77.3) | 1.20 (1.00–1.45) |
| 41–50 | 696 (26.4) | 1936 (73.6) | 1.35 (1.10–1.64) |
| 51–70 | 732 (28.9) | 1799 (71.1) | 1.63 (1.32–2.00) |
| Number of children in the household‡ | |||
| None | 920 (23.1) | 3057 (76.9) | 1 |
| 1 | 639 (26.2) | 1800 (73.8) | 1.35 (1.17–1.57) |
| 2–3 | 752 (25.1) | 2248 (74.9) | 1.49 (1.28–1.74) |
| ≥4 | 47 (46.5) | 54 (53.5) | 3.62 (2.30–5.70) |
| Mean | Median | SD | m–M | |
|---|---|---|---|---|
| Age of onset of IPV (years) | 26.59 | 25.00 | 8.33 | 11–65 |
| Duration of IPV (years) | 10.20 | 7.00 | 9.92 | <1–50 |
SD, standard deviation; m–M, minimum–maximum.
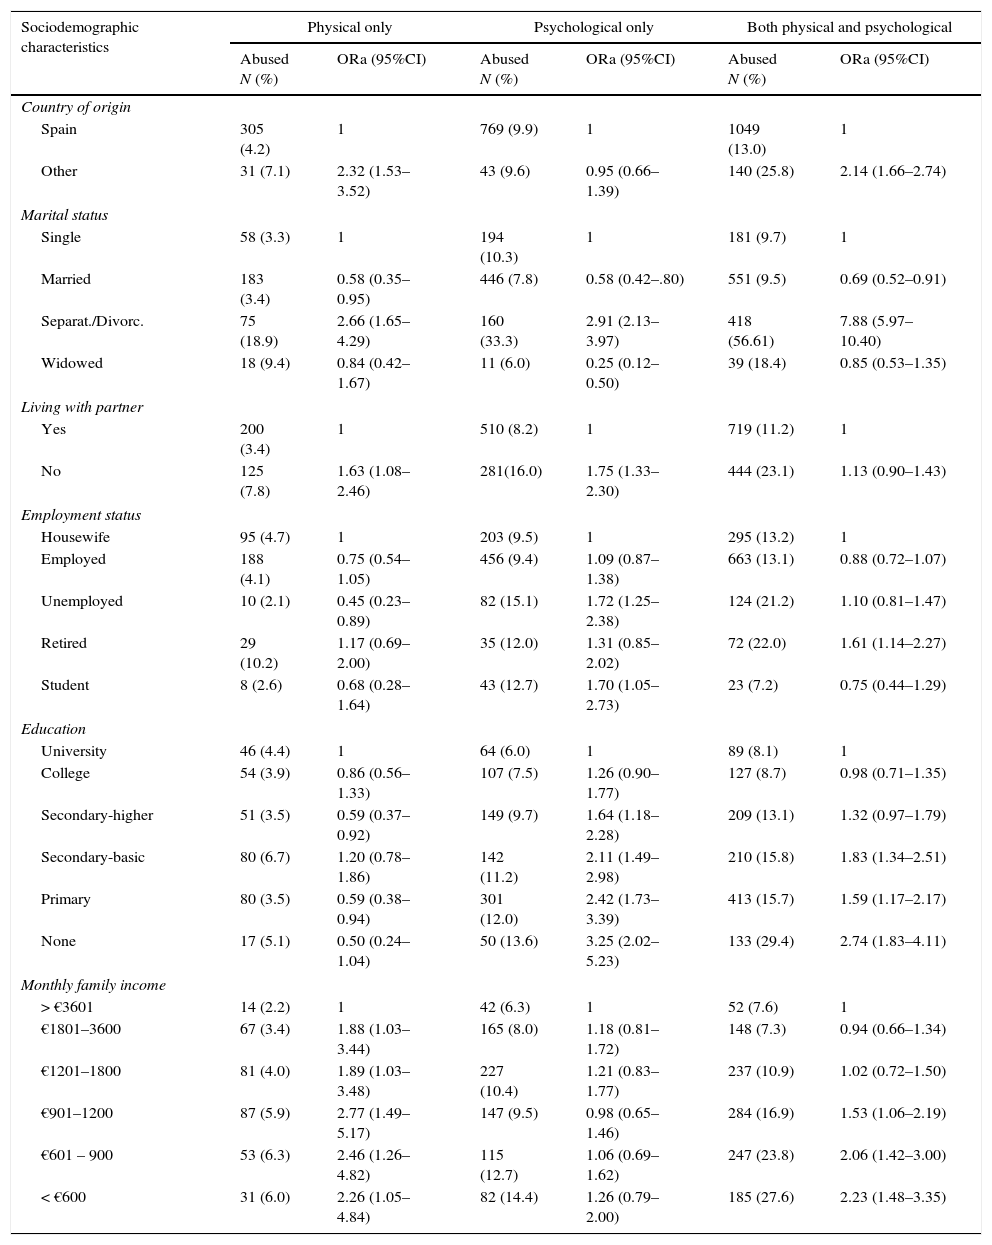
Separated/divorced women refer higher violence frequency in the three categories. There is also a significant tendency of greater IPV in the three categories as the age of the woman and number of children increases. Immigrant women show greater risk for IPV physical only (OR=2.32) and both physical and psychological than autochthonous women.
For the physical only category no differences were observed regarding education or employment status (although retired women showed the highest IPV frequency) and women with higher income levels show less risk.
For the psychological only category no differences were observed according to income levels; the risk increases as the education level decreases. Unemployed women (OR=1.72) and students (OR=1.70) show the highest frequency on IPV only psychological.
For the category of IPV both physical and psychological a clear increase in the risk is observed as income and education levels decrease, and retired women show the highest frequency of this category (Table 3).
Association between sociodemographic characteristics and each category of lifetime IPV. Multivariate analysis.
| Sociodemographic characteristics | Physical only | Psychological only | Both physical and psychological | |||
|---|---|---|---|---|---|---|
| Abused N (%) | ORa (95%CI) | Abused N (%) | ORa (95%CI) | Abused N (%) | ORa (95%CI) | |
| Country of origin | ||||||
| Spain | 305 (4.2) | 1 | 769 (9.9) | 1 | 1049 (13.0) | 1 |
| Other | 31 (7.1) | 2.32 (1.53–3.52) | 43 (9.6) | 0.95 (0.66–1.39) | 140 (25.8) | 2.14 (1.66–2.74) |
| Marital status | ||||||
| Single | 58 (3.3) | 1 | 194 (10.3) | 1 | 181 (9.7) | 1 |
| Married | 183 (3.4) | 0.58 (0.35–0.95) | 446 (7.8) | 0.58 (0.42–.80) | 551 (9.5) | 0.69 (0.52–0.91) |
| Separat./Divorc. | 75 (18.9) | 2.66 (1.65–4.29) | 160 (33.3) | 2.91 (2.13–3.97) | 418 (56.61) | 7.88 (5.97–10.40) |
| Widowed | 18 (9.4) | 0.84 (0.42–1.67) | 11 (6.0) | 0.25 (0.12–0.50) | 39 (18.4) | 0.85 (0.53–1.35) |
| Living with partner | ||||||
| Yes | 200 (3.4) | 1 | 510 (8.2) | 1 | 719 (11.2) | 1 |
| No | 125 (7.8) | 1.63 (1.08–2.46) | 281(16.0) | 1.75 (1.33–2.30) | 444 (23.1) | 1.13 (0.90–1.43) |
| Employment status | ||||||
| Housewife | 95 (4.7) | 1 | 203 (9.5) | 1 | 295 (13.2) | 1 |
| Employed | 188 (4.1) | 0.75 (0.54–1.05) | 456 (9.4) | 1.09 (0.87–1.38) | 663 (13.1) | 0.88 (0.72–1.07) |
| Unemployed | 10 (2.1) | 0.45 (0.23–0.89) | 82 (15.1) | 1.72 (1.25–2.38) | 124 (21.2) | 1.10 (0.81–1.47) |
| Retired | 29 (10.2) | 1.17 (0.69–2.00) | 35 (12.0) | 1.31 (0.85–2.02) | 72 (22.0) | 1.61 (1.14–2.27) |
| Student | 8 (2.6) | 0.68 (0.28–1.64) | 43 (12.7) | 1.70 (1.05–2.73) | 23 (7.2) | 0.75 (0.44–1.29) |
| Education | ||||||
| University | 46 (4.4) | 1 | 64 (6.0) | 1 | 89 (8.1) | 1 |
| College | 54 (3.9) | 0.86 (0.56–1.33) | 107 (7.5) | 1.26 (0.90–1.77) | 127 (8.7) | 0.98 (0.71–1.35) |
| Secondary-higher | 51 (3.5) | 0.59 (0.37–0.92) | 149 (9.7) | 1.64 (1.18–2.28) | 209 (13.1) | 1.32 (0.97–1.79) |
| Secondary-basic | 80 (6.7) | 1.20 (0.78–1.86) | 142 (11.2) | 2.11 (1.49–2.98) | 210 (15.8) | 1.83 (1.34–2.51) |
| Primary | 80 (3.5) | 0.59 (0.38–0.94) | 301 (12.0) | 2.42 (1.73–3.39) | 413 (15.7) | 1.59 (1.17–2.17) |
| None | 17 (5.1) | 0.50 (0.24–1.04) | 50 (13.6) | 3.25 (2.02–5.23) | 133 (29.4) | 2.74 (1.83–4.11) |
| Monthly family income | ||||||
| > €3601 | 14 (2.2) | 1 | 42 (6.3) | 1 | 52 (7.6) | 1 |
| €1801–3600 | 67 (3.4) | 1.88 (1.03–3.44) | 165 (8.0) | 1.18 (0.81–1.72) | 148 (7.3) | 0.94 (0.66–1.34) |
| €1201–1800 | 81 (4.0) | 1.89 (1.03–3.48) | 227 (10.4) | 1.21 (0.83–1.77) | 237 (10.9) | 1.02 (0.72–1.50) |
| €901–1200 | 87 (5.9) | 2.77 (1.49–5.17) | 147 (9.5) | 0.98 (0.65–1.46) | 284 (16.9) | 1.53 (1.06–2.19) |
| €601 – 900 | 53 (6.3) | 2.46 (1.26–4.82) | 115 (12.7) | 1.06 (0.69–1.62) | 247 (23.8) | 2.06 (1.42–3.00) |
| < €600 | 31 (6.0) | 2.26 (1.05–4.84) | 82 (14.4) | 1.26 (0.79–2.00) | 185 (27.6) | 2.23 (1.48–3.35) |
| Sociodemographic characteristics | Physical only | Psychological only | Both physical and psychological | |||
|---|---|---|---|---|---|---|
| Abused N (%) | ORa (95%CI) | Abused N (%) | ORa (95%CI) | Abused N (%) | ORa (95%CI) | |
| Population size (inhabitants) | ||||||
| <10,000 | 61 (3.5) | 1 | 178 (9.6) | 1 | 215 (11.3) | 1 |
| 10,000–50,000 | 93 (4.8) | 1.32 (0.92–1.89) | 205 (10. 1) | 1.14 (0.90–1.44) | 356 (16.3) | 1.57 (1.27–1.94) |
| >50,000 | 72 (5.0) | 1.22 (0.82–1.81) | 157 (10.4) | 1.01 (0.78–1.31) | 210 (13.4) | 1.24 (0.98–1.58) |
| Capital city | 116 (4.3) | 1.09 (0.77–1.55) | 283 (9.9) | 1.03 (0.82–1.28) | 420 (14.0) | 1.26 (1.02–1.56) |
| Age (years) | ||||||
| 18–30 | 45 (2.7) | 1 | 153 (8.7) | 1 | 186 (10.4) | 1 |
| 31–40 | 56 (2.6) | 1.24 (0.77–2.01) | 230 (10.0) | 1.52 (1.14–2.02) | 305 (12.9) | 1.00 (0.77–1.29) |
| 41–50 | 105 (5.1) | 2.23 (1.36–3.64) | 207 (9.7) | 1.36 (1.00–1.86) | 357 (15.6) | 1.12 (0.86–1.47) |
| 51–70 | 131 (6.8) | 3.39 (2.06–5.60) | 227 (11. 2) | 1.93 (1.40–2.65) | 340 (15.9) | 1.14 (0.86–1.52) |
| Number of children in the household | ||||||
| None | 129 (4.0) | 1 | 335 (9.9) | 1 | 421 (12.1) | 1 |
| 1 | 84 (4.5) | 1.16 (0.83–1.62) | 205 (10.2) | 1.43 (1.14–1.79) | 324 (15.3) | 1.46 (1.20–1.78) |
| 2–3 | 109 (4.6) | 1.71 (1.21–2.40) | 240 (9.6) | 1.40 (1.11–1.78) | 377 (14.4) | 1.58 (1.29–1.94) |
| ≥4 | 4 (6.9) | 2.75 (0.93–8.17) | 11 (16.9) | 2.98 (1.47–6.02) | 32 (37.2) | 4.95 (2.87–8.56) |
The IPV prevalence rates found in this study are consistent with those from other national samples in other countries, which range from 20% to 34% in the case of lifetime IPV,12,13 and from 4% to 38% in the case of IPV in the previous year.14,15
Psychological IPV was more prevalent than physical, and the most common situation was to experience both types of IPV together. This has also been found in previous studies.16,17
There is a clear overlap between the different types of IPV, and this has already been revealed in previous studies. However, few works have aimed to determine whether sociodemographic characteristics are different in the various categories or combinations of IPV types.16,17 In order to examine this, we created exclusive categories of abuse.The high number of women surveyed meant that we could explore some of the characteristics of IPV beyond global prevalence estimates, in depth. Likewise, we were able to provide an exhaustive description of the sociodemographic characteristics of abused and non-abused women, retaining for each one of the variables, categories that usually need to be grouped together due to sample size constraints. Most studies compare women with a high education level with those with a low one, and employed women with unemployed women.16–18
This might explain one of the most important findings of this work as it has allowed us to identify how variables such as employment, education and income level behave differently according to the IPV category analyzed. Thus, IPV only physical is reported similarly by all women with no differences regarding employment status or education level, and more frequently reported by women with lower income. On the contrary, psychological IPV (only psychological or related also to physical) is more frequently reported by women with lower education levels and moreover, a consistent gradient was found, although it was not associated with family incomes. This is a surprising result as it would be expected that women with lower education levels would have more difficulty in identifying when they are suffering psychological violence.
Immigrant women also show a greater risk for physical violence, physical only or together with psychological IPV. The immigrant women's lack of knowledge about the social context, institutions and services of the host country, together with a possible absence of a social network offering refuge, may accentuate the positive effect by having someone to turn to for support.
We found a clear and consistent association between any type of IPV and being separated or divorced, which is consistent with results from other studies.19,20 However, this is a cross-sectional study that does not allow conclusions to be drawn about causality, so that it may be the case that separated women were at greater risk for IPV or that violence could have ended with the marriage. This could be argued by the fact that women who do not live with a partner are those who report a higher IPV frequency, while those who were still married at the time of this study reported the lowest frequencies.
With regard to age, in both types of violence older women suffer a greater risk for both IPV types (physical or psychological). However, it is worth pointing out that for physical violence, a clear positive gradient is revealed in older women, and in those aged 51–70 the magnitude of the ORa of those women who suffer physical IPV is greater than those who suffer psychological IPV. The few works which contemplate the children variable do it dichotomically.8 In this study, the probability of suffering both types of IPV (physical and psychological) was increased with the number of children.
Concerning possible limitations, we excluded women who attended the practice accompanied by a husband or partner, and maybe the prevalence of IPV is greater among this subgroup of women, who may be experiencing control by their partners. Similarly, IPV has been associated with low sociocultural levels, and because of the methods used for this study we had to exclude illiterate women. Furthermore, women who did not understand Spanish (presumably foreigners) were also excluded, and the literature has shown that immigrant women are more likely to experience IPV than locals.21 Furthermore, it may be that more isolated and vulnerable women do not use services as much. Therefore, all of these issues could have led to an under-estimation of the real prevalence rates of IPV. However, this under-estimation could have been “compensated” for by an overestimation of the data derived from the fact that the sample group for this study was recruited in a primary care setting, and it has been found that abused women make a greater use of health services than non-abused ones.22
In conclusion, the results here obtained reveal that IPV affects women of all social strata, but the frequency and IPV category will vary according to their socioeconomic circumstances. This has important implications for the clinical practice as it will allow the design of preventive interventions or guidelines and action protocols for a healthcare response against IPV based upon the specific circumstances of each woman.
- -
The global prevalence of physical and/or sexual intimate partner violence among all ever-partnered women is 30.0%.
- -
The majority of the studies published analyze violence as a whole (any type of violence)
- -
In general, the studies published to date have used convenience samples (which limits the generalization of the results).
- -
We were able to provide an exhaustive description of the sociodemographic characteristics of abused and non-abused women, retaining for each one of the variables, categories that usually need to be grouped.
- -
Some variables such as employment, education and income level behave differently according to the IPV category analyzed
- -
IPV affects women of all social strata, but the frequency and IPV category will vary according to their socioeconomic circumstances
This study was funded by the Carlos III Health Institute (Ministry of Health, Spain). The funding source had no involvement in the study. The researchers were independent from the funders.
Conflicts of interestThe authors declare no conflict of interest.
