


Introduction
Health care organisations are known for their rapidly changing environment, not only is this aimed at resolving health problems and being subjected to technological changes, but it is also determined by patient needs and, therefore by exposure to sociological changes, which may be slower, but nevertheless more profound.1 This unstable environment can often cause occupational stress, which appears in different forms in professionals, depending on their position in the organisation.2,3 Two models, designed for the study of occupational stress, have demonstrated their ability to predict the appearance of health problems associated with this.4,5 These models are called effort-rewards imbalance (ERI) and control-demands. The first model (ERI) postulates that a change in the cost/benefits ratio in the working environment produces changes in the feeling of personal well-being.6 The control-demands model works on the idea that work situations characterised by limited control and high demands are associated with work discomfort. It also highlights the influence of the working environment characteristics, such as work profiles or requirements, and position as regards making decisions within the organisation ("latitude") with the ability to cope with occupational stress.7
With the control-demands model, proposed by Karasek, work satisfaction is defined in comparison with occupational stress, which assumes a perceived imbalance between demand and the capacity of the individual to respond under conditions in which failure, when faced with that demand, has important consequences.8,9
The perception of work satisfaction, measured as quality of life at work, has been shown to be a valuable dimension in itself and an objective for organisational intervention due to being a guarantee for maintaining human resources, and having demonstrated its incidence over the results of professional practice.10
The perception of professional quality of life is of interest for health care organisations, therefore it has to be precisely and accurately measured.
There are several tools for measuring work satisfaction/quality of professional life (QPL) that are valid in our country.8,9,11-13 Perhaps the most used at the moment, particularly in the primary care (PC) setting, are the Font Roja13 and the CVP-35 (QPL-35) questionnaires.8,9
The QPL-35 questionnaire, proposed by García,8 and constructed using the theoretical framework of the Karasek model (control-demand), has been validated in different environments in the Spanish health system. Its construction validity and intrasubject reliability have been evaluated,9,14 as well as its acceptable relationship with other tools that measure the impact of professional stress.15 It has also been widely used to evaluate the QPL,16 to identify areas of improvement in the organisation17 or to examine the effects of the "organisational climate" in health care workers.18 The discriminatory (whether it is able to classify subjects in different situations) and evaluation (whether it is able to detect changes in subjects) abilities are important when measuring characteristics associated with tools that measure subject perceptions.19 There is some evidence of the discriminatory ability of this tool, but not of its capability in detecting changes in the perception of QPL in the subjects.
Despite the abundance of tools that measure QPL, the lack of data as regards it evaluation ability (responsiveness or sensitivity to change) is a general problem. In extensive reviews carried out on tools that measure professional satisfaction in other settings, only occasionally are there data on their sensitivity to change.20
Given that the validation process of a measuring tool is a continuous one,19 and that there are gaps in how to interpret the results provided by this tool, which, on the other hand, appears useful to measure QPL, we planned the present study with the aim of determining the sensitivity to change of the QPL-35 and the minimally important difference (MID) that it is able to detect.
Methods
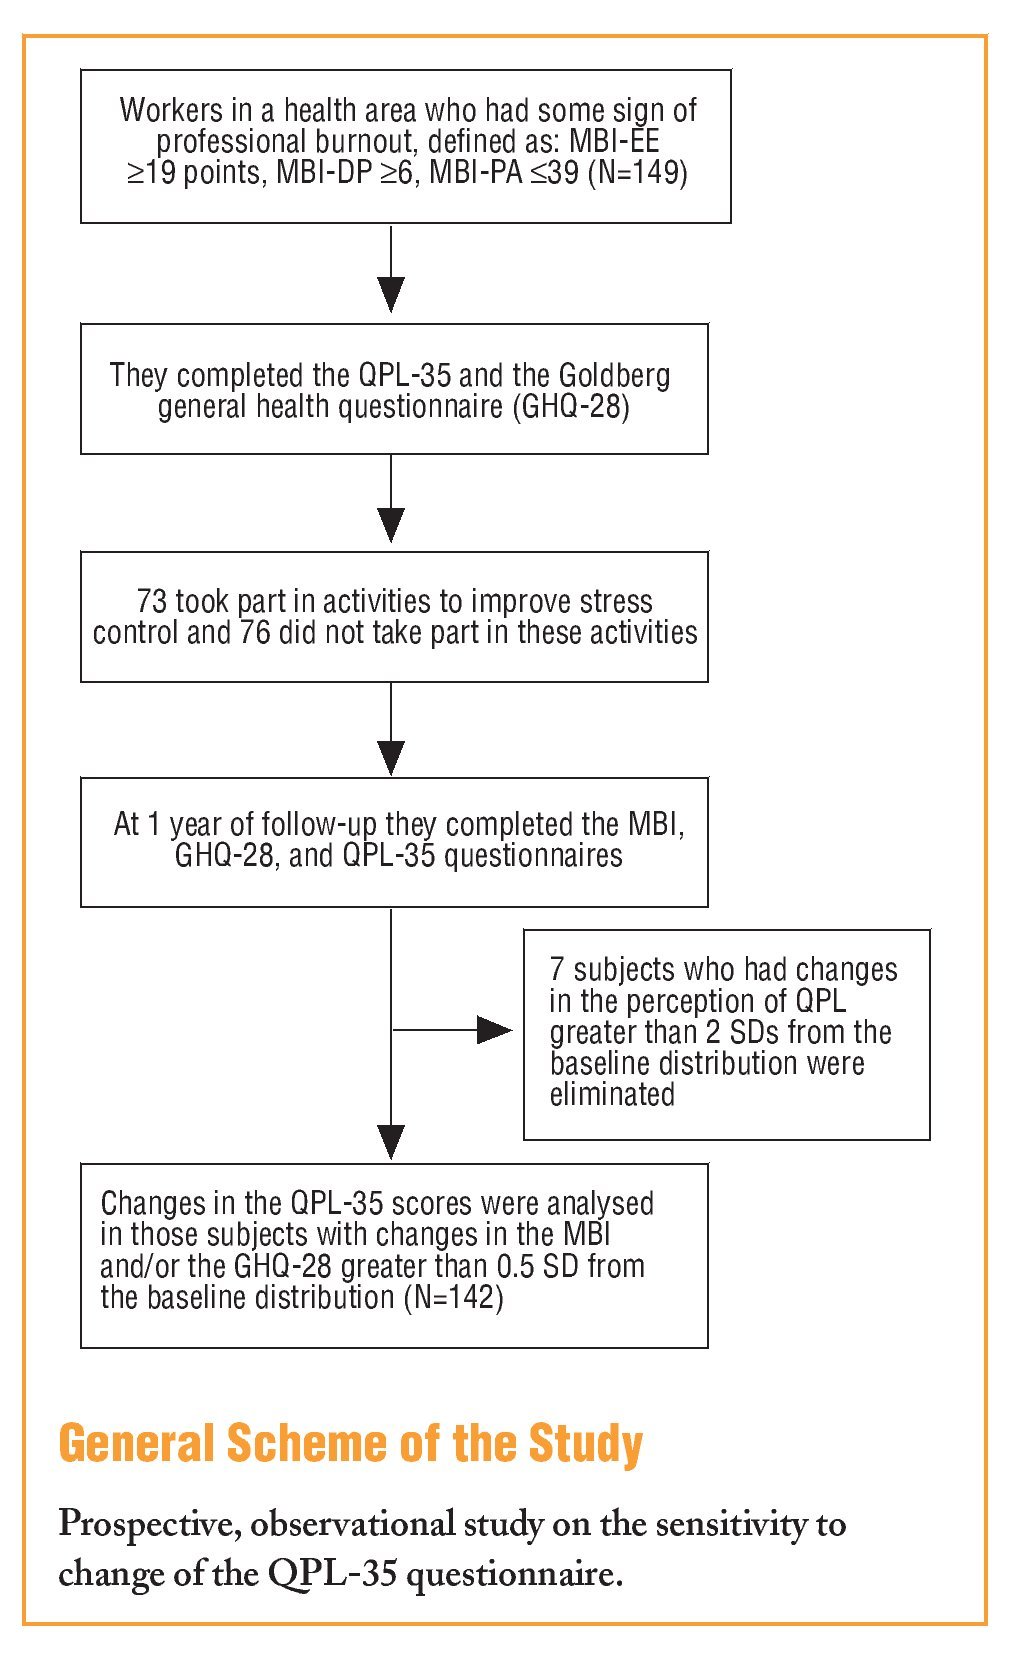
A prospective, observational study was carried out to assess the evaluative ability of the QPL-35 questionnaire.
The population selected for this was for this, was a group of PC workers from a health area who, in a survey on "professional burnout," had some data that indicated that they were affected by this. The Maslach (Maslach Burnout Inventory [MBI-HHS]) questionnaire was used to define possible "professional burnout."21,22 Subjects "at risk" were considered as those who had a score equal to or greater than 19 points in the emotional exhaustion scale (MBI-EE), or 6 or more points in the depersonalisation (MBI-DP) scale, or 39 or less points in the personal accomplishment (MBI-PA). The study on the burnout state was performed on all professional categories.
The subjects were asked to participate in a study on occupational stress and to fill in the Goldberg General Health Questionnaire (GHQ-28)23 and the QPL-35, at the time of inclusion and after a follow-up period of 12 months. During that time educational activities were carried out to improve coping with stress, in which 73 subjects out of the total who showed signs of burnout took part.
The activities for improving coping with stress used 2 methods, transpersonal relaxation and other cognitive-behavioural techniques, such as Schultz or Jacobson relaxation. All these activities were carried out in 20 hour workshops followed by 2 hours reinforcement sessions at 3, 6, and 12 months.
The QPL measuring tool was the CVP-35 (QPL-35) questionnaire, which has 35 questions that are answered on a scale of 1 to 10, to which categories are superimposed; "none" (values 1 and 2), "some" (values 3, 4, and 5), "quite a lot" (values 6, 7, and 8) and "a lot" (values 9 and 10). The proposed open questions were not used in the first version of the QPL-35.8 This questionnaire has 3 dimensions: "Management support" (QPL-MS), "work load" (QPL-WL), and "intrinsic motivation" (QPL-IM), as well as a direct question on the perception of QPL.9,14
Intrasubject variation was evaluated in the following variables: QPL and each one of its components, each one of the MBI questionnaire scales, emotional exhaustion, depersonalisation, and personal achievement, and total score in the GHQ.
The dispersion in the change of the response to the question on QPL in the QPL-35 was studied and those which were considered "protest responses" were eliminated. We understand as such the individual responses that show a change of over 2 standard deviations (SD) of the baseline score distribution in their QPL, given that, during the observation period, none of those included in the study had changes in the type of work that they carried out, nor were there any changes in working environment that could justify perceived changes in QPL of such magnitude.
Although studying these "protest responses" might be of interest in evaluating the working environment, we believe that they do not help in understanding how the measuring tool evaluated behaves. A correlation analysis was performed on the changes between the QPL variable and each one of its components with the change in score in each one of the scales of the MBI questionnaire and with the total score of the GHQ-28, using parametric and non-parametric methods (Pearson correlation coefficient and Spearman rho). Only the distribution of the QPL variation and the GHQ-28 score differed significantly from normal when evaluated with the Kolmogorov-Smirnov test.
Subsequently the variation in the baseline scores of all the subjects were analysed and the SD of these distributions were calculated. Those individuals who had positive or negative changes in each of the scales of over half a standard deviation (SD=0.5) were selected, looking for moderate or large changes in the classification proposed by Cohen.24 Thus those with changes greater than 0.5 SD from the distribution of the baseline scores are understood to be significant changes in the test scores used as a reference (MBI, GHQ-28).
The change in QPL dimension and each one of its components were evaluated in those who had changes of this magnitude in MBI or GHQ-28 scores.
Results
All professional categories were included in the group studied.
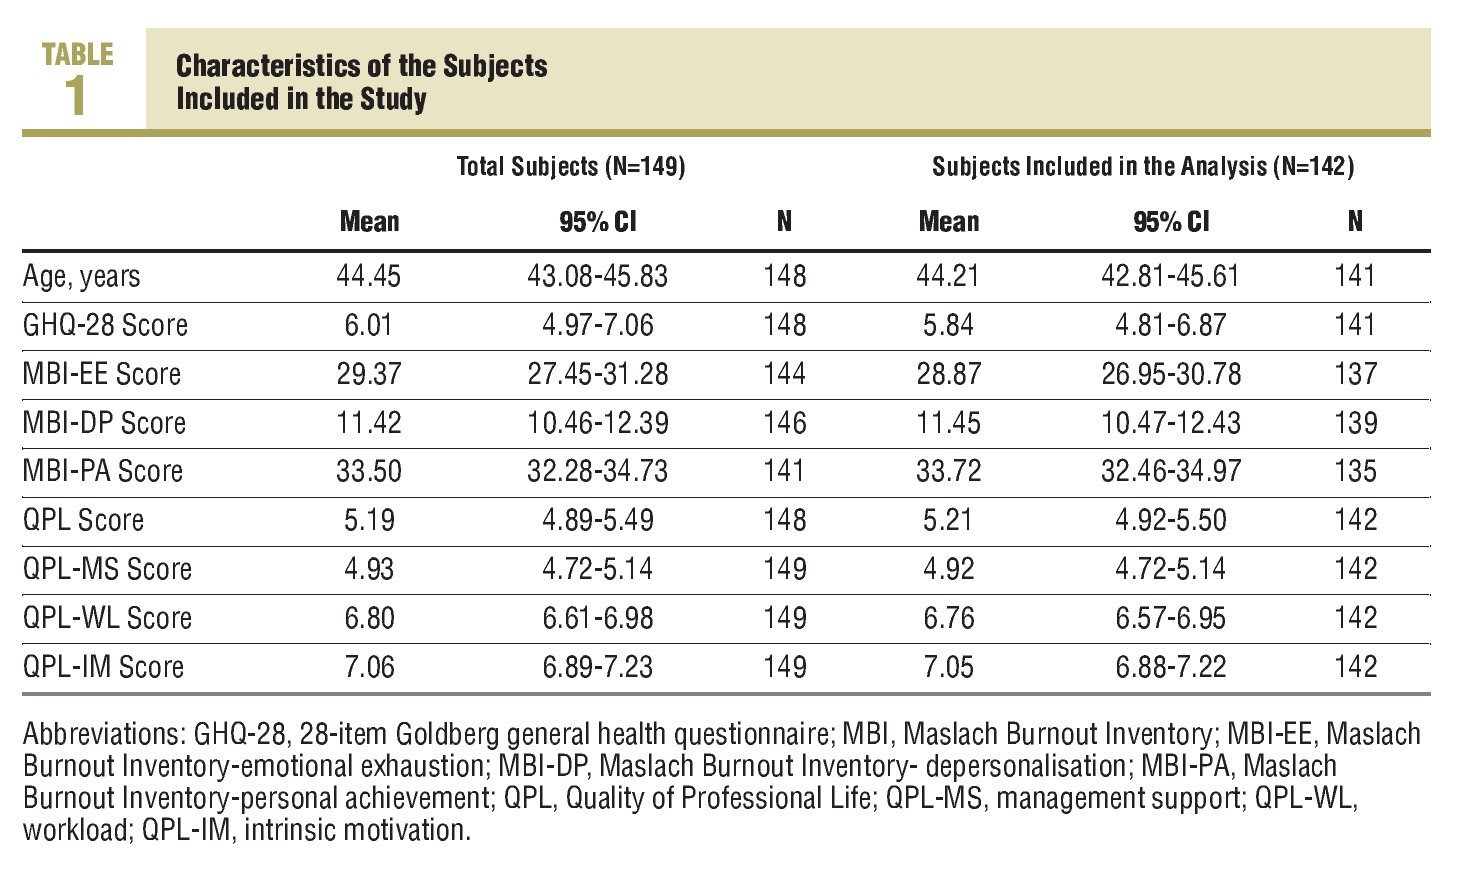
They included family doctors or paediatricians: 73 subjects (49.1%), 51 nursing professionals (34.2%), 4 auxiliary nurses (2.7%), 19 administration auxiliaries (12.8%), and 2 social workers (1.3%). Of this group, 75.20% (112/149) were female. Seven were excluded from the analysis, 3 due to a deterioration greater than or equal to 6 points and 4 due to an improvement greater than or equal to 6 points. Of those 7 excluded from the analysis, 5 were female and 2 were males (5 nurses and 2 administration auxiliaries). The exclusion of these subjects did not show any differences in the GHQ-28 scores, the MBI scales or in the QPL-35 measurements (Table 1).
The SD of the QPL baseline measurement for the 142 subjects included in the analysis was 1.75 points, and 1.26, 1.14, and 1.02 points, respectively, for the QPL-MS, QPLWL, and QPL-IM dimensions. The QPL varied by a mean of 0.11 points (SD=1.6 points), QPL-MS domain by 0.02 points (SD=1.09), workload perception (QPL-WL) decreased by 0.20 points (SD=1.07), and intrinsic motivation (QPL-MI) increased by a mean of 0.02 points (SD=1.00 points).
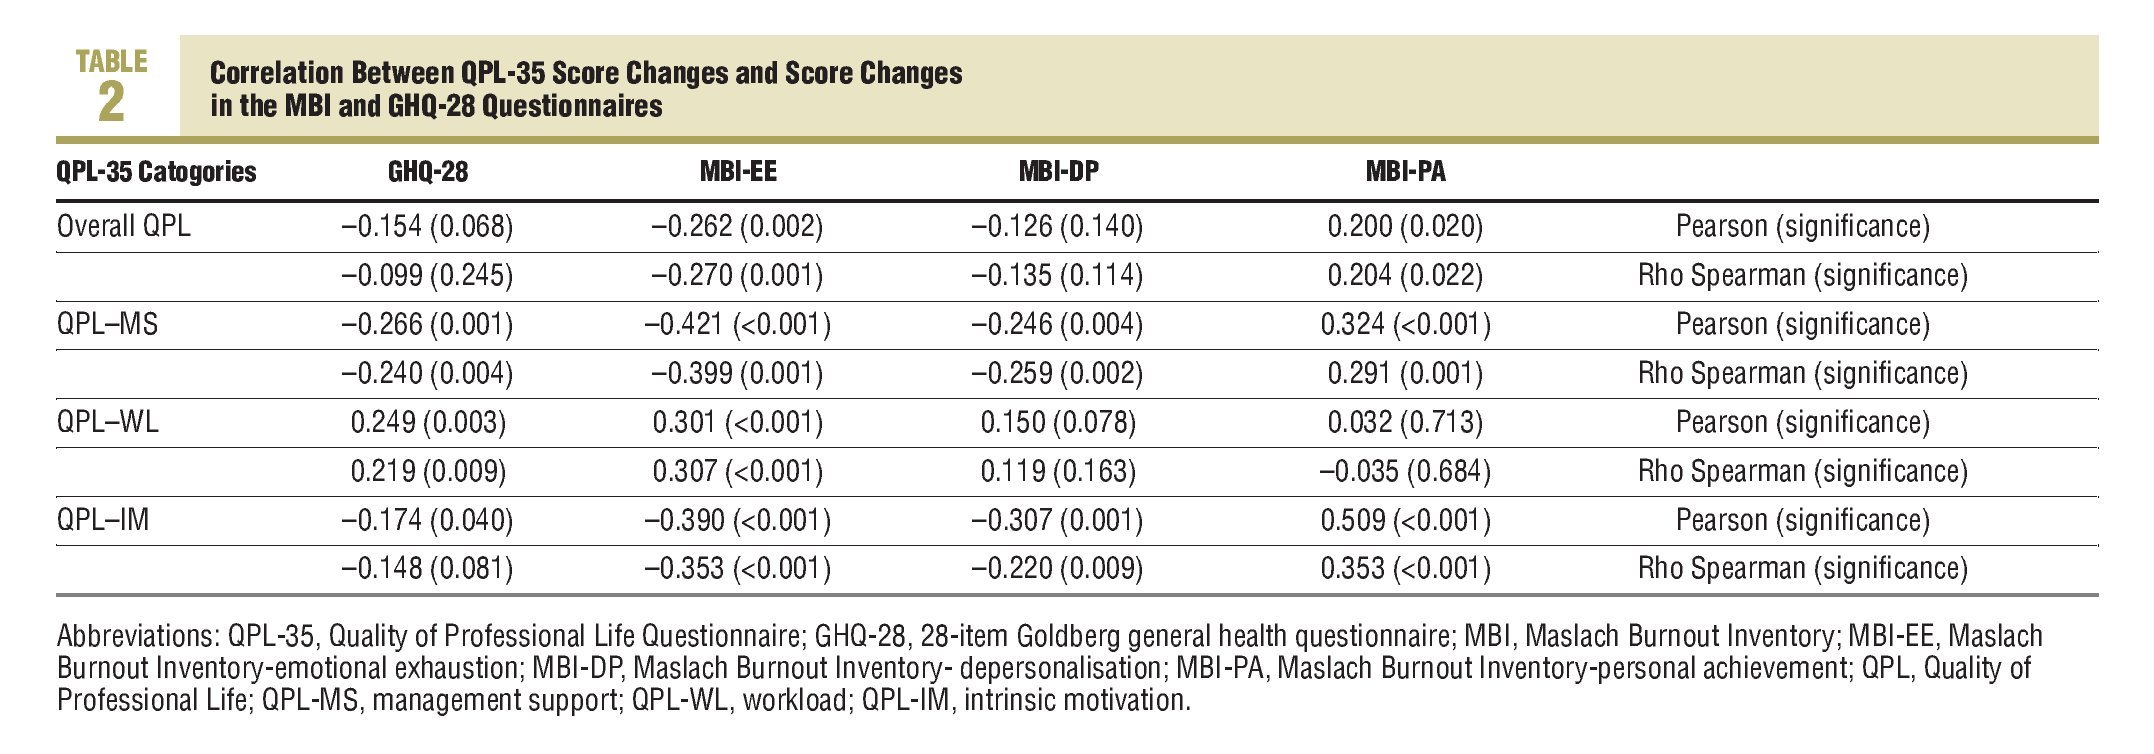
Table 4 shows the correlations between the variations in the QPL-35 scores and the MBI and GHQ-28 scales. All correlations fit the conceptual model and are stronger between the QPL-35 measurements with the MBI-EE than with the rest of the measurements. The magnitude of the correlation between the change in QPL-IM and the change in the MBI-PA should also be pointed out.
The SD for the baseline GHQ scores was 6.41 points. The SDs for the MBI-EE, MBI-DP, and MBI-PA domains, were 11, 62, 5.90, and 7.37 points, respectively. Therefore, the variations considered "significant" in these scores were those of a magnitude greater than 3.21 points in absolute value for the GHQ-28, and 5.81, 2.95, and 3.69 points for the MBI-EE, MBI-DP, and MBI-PA domains.
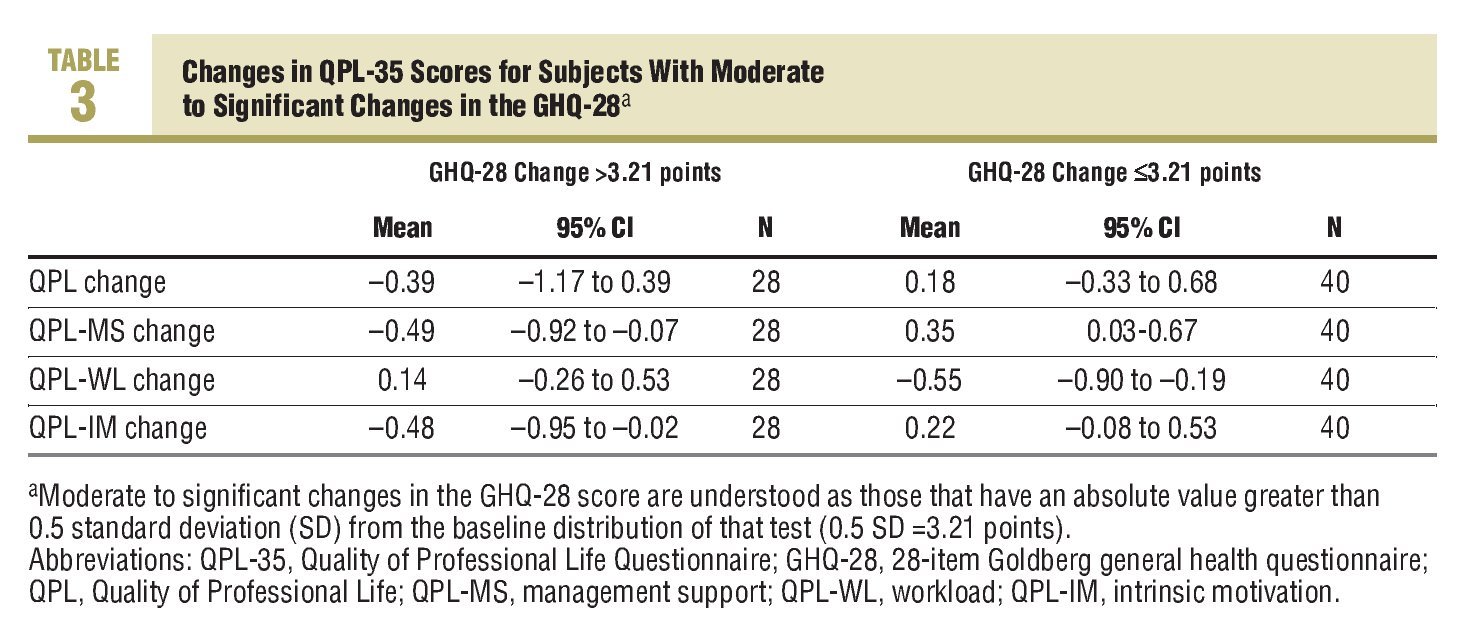
Table 3 shows the variation in the QPL-35 scores and its dimensions for those subjects with changes in the GHQ-28 score of greater than 0.5 SD. The decreases in the Goldberg test scores (improved perception of health) are accompanied by improvements in the QPL, QPL-MS, and QPL-IM of between 0.18 and 0.35 points and decreases in the perception of workloads greater than half a point. The deterioration in the perception of state of health, shown by higher scores in the GHQ-28, is inversely related to the scores in the QPL of a similar magnitude to that mentioned previously.

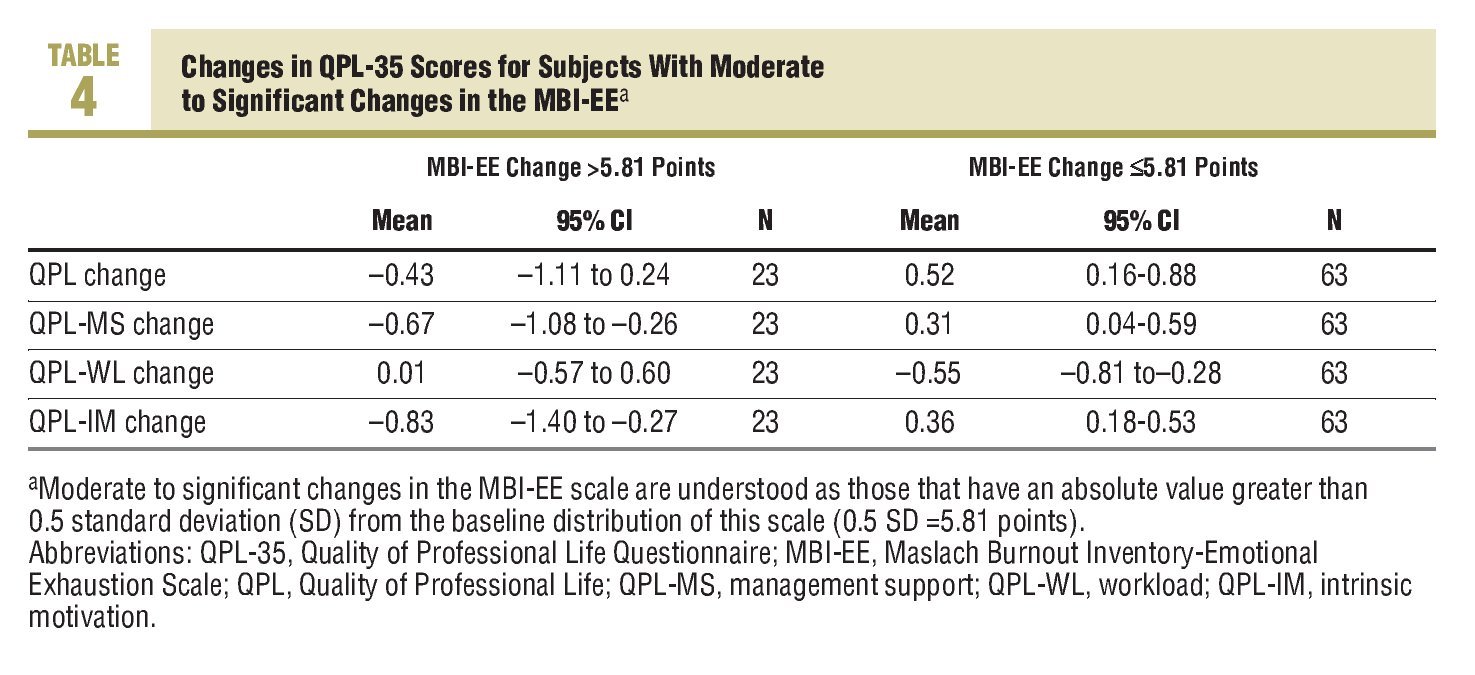
Table 4 shows the variations found in the QPL-35 for those subjects in whom the MBI-EE score changed significantly, either positively or negatively. When emotional exhaustion worsens, the QPL, the perception of QPL-MS and QPL-IM worsens by 0.43 to 0.83 points, the opposite occurs when emotional exhaustion improves, with variations of between 0.31 and 0.52 points.
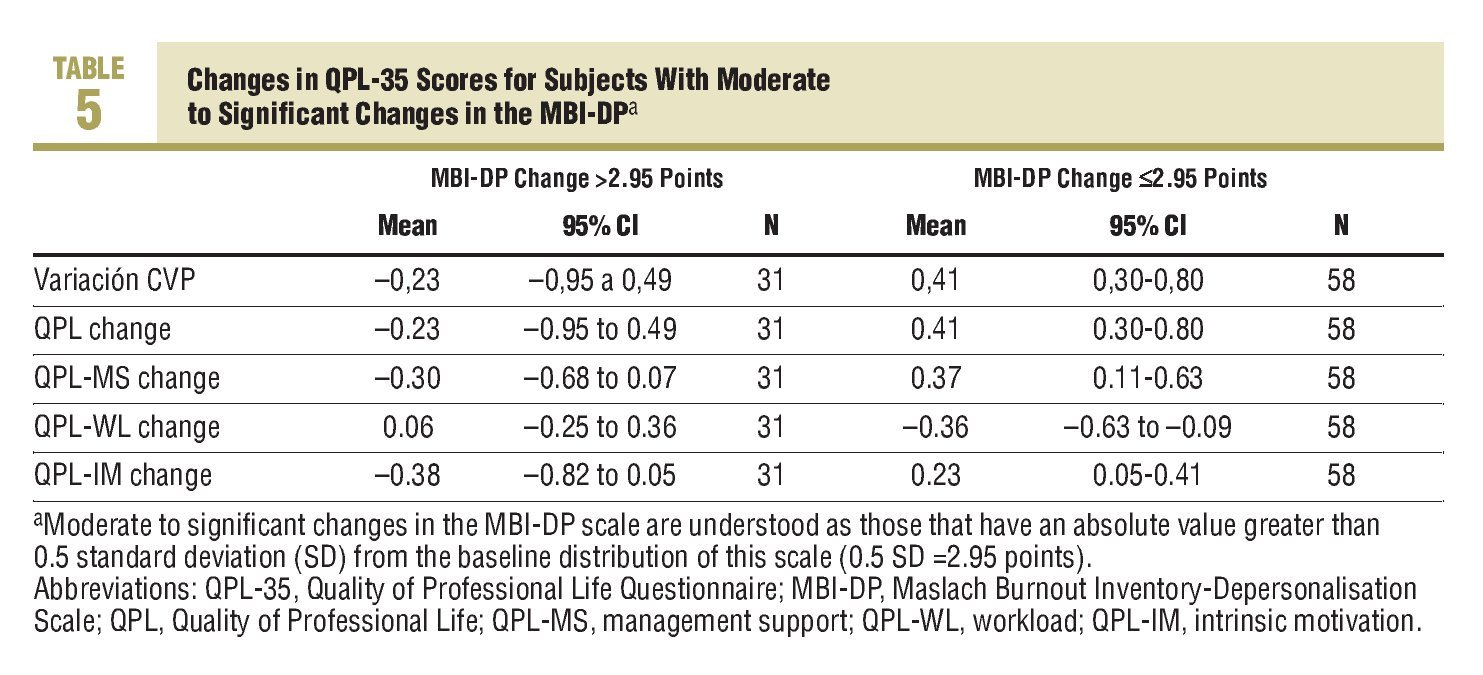
The observed variation in the measurements made with the QPL-35 in those who had a significant change in the MBI-EE is shown in Table 5. Although the mean variations are in the expected direction, the deteriorations in depersonalisation (increases in its score) correlate less with deteriorations in the QPL dimensions. Improvements in the order of 0.23 and 0.41 points are produced for the significant improvements in the MBI-EE domain.
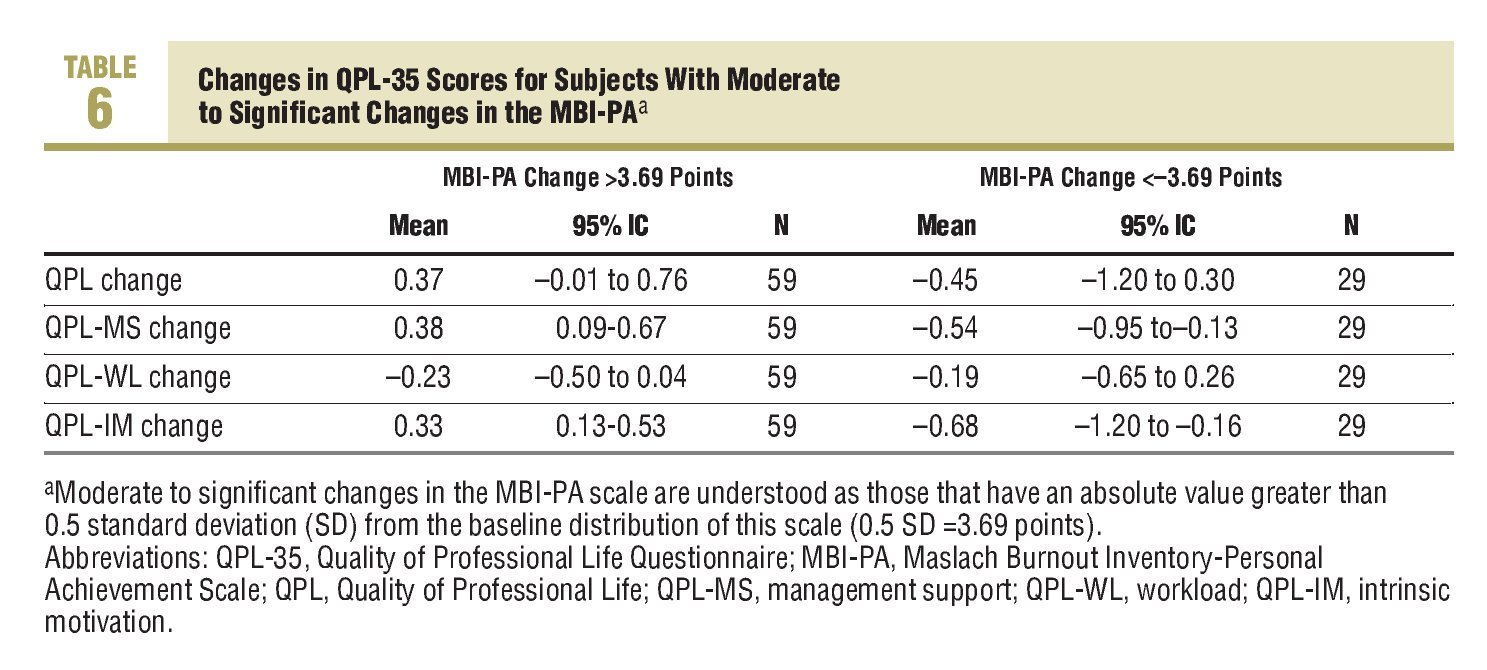
Finally, Table 6 shows the changes in the QPL scores associated with the changes in the personal achievement dimension of the MBI. Changes in the MBI-PA scores in any direction are associated with changes in the QPL, in the perception of QPLMS and in QPL-IM, of between 0.33 and 0.68 points. The higher changes are those observed in intrinsic motivation. When the score in the MBI-PA domain deteriorates by more than 0.5 SD, the QPL-IM drops between 0.16 and 1.20 points from the mean.
Discussion
The results obtained corroborate the validity of the QPL-35 construct. Firstly, it confirms, once again, its correlation with tools that measure general state of health (GHQ-28) and "professional burnout" (MBI).
It also shows that situations that cause these measurements to vary have a bearing on the QPL-35 scores, and each of its dimensions, in the same direction, that is, it shows that it is a "sensitive-to-change" tool.
On analysing the changes in the QPL-35 with the GHQ-28 health questionnaire it can be seen that the correlation is always weak (r<0.300), and only a decrease of 0.49 (0.07-0.92) points is clearly seen in the perception of management support (QPL-MS) in subjects whose perception of health worsened by more than 3.2 points and an improvement of similar magnitude (0.35 points) when the general health perception improved. Changes in the QPL-35 are more consistently associated with changes in the MBI, particularly in the emotional exhaustion domain.
The magnitude of the association between changes in the perception of intrinsic motivation (QPL-IM) and the personal achievement dimension (MBIPA) of the Maslach questionnaire should also be pointed out (r=0.509).
On studying the dimension of the changes of the overall assessment of the QPL and each of its domains, it is noted, in general, that there are more changes in the QPL-MS and QPL-IM than in the perception of workload (QPL-WL). As regards the overall measurement of QPL, as well as the QPL-MS and QPL-IM, changes between 0.33 and 0.68 points are observed in those subjects whose scores change significantly (more than 0.5 SD) in the GHQ-28 or in the MBI-EE or MBI-PA dimensions. In the subjects who had significant improvements in the depersonalisation dimension (MBI-DP), improvements are seen in the QPL, QPL-MS, QPL-IM, and decreases in the QPL-WL of between 0.23 and 0.40 points. However significant deteriorations in this scale are not associated with clear changes in the QPL dimensions. The MBI-EE dimension is the one that has more internal consistency in non-Anglo-Saxon populations,25 therefore we expected that the QPL changes in these groups would not be very stable.
The value of 0.5 points in the overall assessment of the QPL-35 and each of its dimensions could be set as MID from a populational point of view. This magnitude of change may be established as significant due to containing the majority of the variations observed in the subjects who had significant changes in the scales used a reference. Several decisions adopted on designing the study could be open to criticism, such as the use of a method based on the distribution of the responses and also the cutoff point chosen to consider a change in the reference scales as significant.
Methods to study the ability to interpret quality of life measurements can be classified between those based on external references (anchors) and those based on the distribution of the scores in the reference scales. To choose a method based on external references, they must be easy to interpret and also be correlated significantly with the measurements provided by the tool evaluated.26 Changes in reference scales do not have a unique interpretation and, in our experience, there is only a moderate correlation of some of these scales with the QPL-35.15 On the other hand, the practical results of an MID study in some quality of life studies give similar results using a distribution approach and the size of the effect and using comparisons with external references (anchors).27
We have no references on the possible sensitivity to change of tools that measure the QPL or work satisfaction or in those validated in Spanish,11-13 and there is not even a clear reference in questionnaires used internationally.20 Therefore, it could be argued whether the magnitude of the change selected in the reference scales (0.5 SD from the baseline distribution) is adequate, since it conditions the size of the MID. This cut-off point was chosen as it coincided with the definition of a "moderate" effect size and because it meant that grouping of subjects who had these changes would be of a sufficient size (at least 30 subjects). We believe that the result obtained with this measurement, an MID of 0.5, is in line with the level of knowledge on the detection of significant changes using quality of life questionnaires. The MID of 0.5 points represents approximately 50% of the SDs observed for the change in overall scores in the perception of QPL and each of its dimensions, and between 33% and 50% of the variation of the baseline distribution. There have been attempts to standards in which the MID for Likert type scales can be between 7 and 9 categories, it has been found that the MID in all cases has been found to be around 0.5 SD from the baseline distribution of the measurement.28 On the other hand, this difference which we can consider significant, is of the same magnitude as that proposed in other scales that measure quality of life with Likert type responses of a 7 point range. This led some authors to propose that in these types of scales significant changes may be found in a range of around 0.5 points.29,30
As a complementary aspect to the purpose of this study, it can be shown that the domains most sensitive to change in the subjects observed are those which, in the Karasek model (demand-control) fall into the group of resources to confront the demands. This does not enable us to state that the QPL-WL domain does not have a suitable evaluative capacity, since through other studies we know that the workload perception has increased in the last few years in the population from which the sample comes2 and, also, it could be that none of the changes in the follow up period substantially changed the real workload of the professionals. Although the association between workloads and the perception of QPL is well documented,2,15-18 we can assume that the QPL might improve without the appreciation of workloads changing significantly. This situation may be important when designing strategies to improve the perceived QPL, as we find ourselves faced with a bureaucratic and rigid system with limited capacity for motivation and incentives at an awkward time due to the increase in health care pressure and the lack of human resources.31
The results obtained with this measuring tool in the last few years2,15-18 support the need for an essential cultural change of the national health system from an organisational culture based on control of its "human resources" to optimise them, and take them to another future culture based on building confidence in its staff to boost them. Professionals have to feel supported by the system, represented by each and every one of its hierarchical managers. It will very interesting to apply this and other QPL measurement tools in the future, after implementing intervention strategies aimed not only at increasing the coping resources of health care professionals, but also aimed at increasing leadership abilities and support by their hierarchical managers.
In conclusion, we can establish that the QPL-35 is a useful tool for measuring the QPL, as well providing evidence of "natural" changes over time, or after improvement measures. The QPL-35 is a sensitive to change tool from a population point of view, and therefore, it has an evaluative capacity that was already assumed but was not proven until now. Changes in the order of 0.5 points in the perception of QPL or any of its domains can be important due to be associated with significant changes in the perception of emotional exhaustion, personal achievement or even in general health. There are some differences between the sensitivity of each dimension, which perhaps may be justified by the fact that workload is an element that, objectively, varies little at a populational level.
What Is Known About the Subject
•Quality of professional life is a variable of interest to the health system and, for this reason has to be measure with precision and accuracy.
•There are several profession quality of life measurement tools validated in primary care setting in the Spanish language, among which the QPL-35 has been widely used.
•Although the discriminatory ability of these questionnaires is well established, we do have data on their sensitivity to change.
What This Study Contributes
•The QPL-35 has an adequate evaluative capacity and is sensitive to changes in the perception of the quality of professional life at populational level.
•The minimally important difference in the score on the overall quality of life or in each of the QPL-35 domains can be set at 0.5 points.
•Important changes can be produced in the perception of the quality of professional life without the perception of changes in workload on the part of the workers.
Spanish version available www.elsevier.es/233.001
A commentary follow this article (page 334)
Correspondence: Dr. J. Martín Fernández.
Centro de Salud San Martín de Valdeiglesias.
La Bola, s/n. 28680 San Martín de Valdeiglesias. Madrid. España.
E-mail: jmartinefe@hotmail.com
Manuscript received November 29, 2007.
Manuscript accepted for publication January 7, 2008.
