


To establish a relationship between global longitudinal strain (GLS) and Galectin-3 in pre-clinical heart failure in diabetic patients. Galectin-3 is a biomarker in heart failure with depressed ejection fraction (HFdEF). The hypothesis is presented that Galectin-3 is related to GLS and can detect left ventricular dysfunction in heart failure with preserved ejection fraction.
MethodsGalectin-3 and GLS were measured in 121 asymptomatic individuals: 14 diabetics with mild depressed ejection fraction (mdEF) (LVEF 47.0±6.9); 76 diabetics with preserved ejection fraction (LVEF 61±5.5), and 31 controls (61.7±5.1).
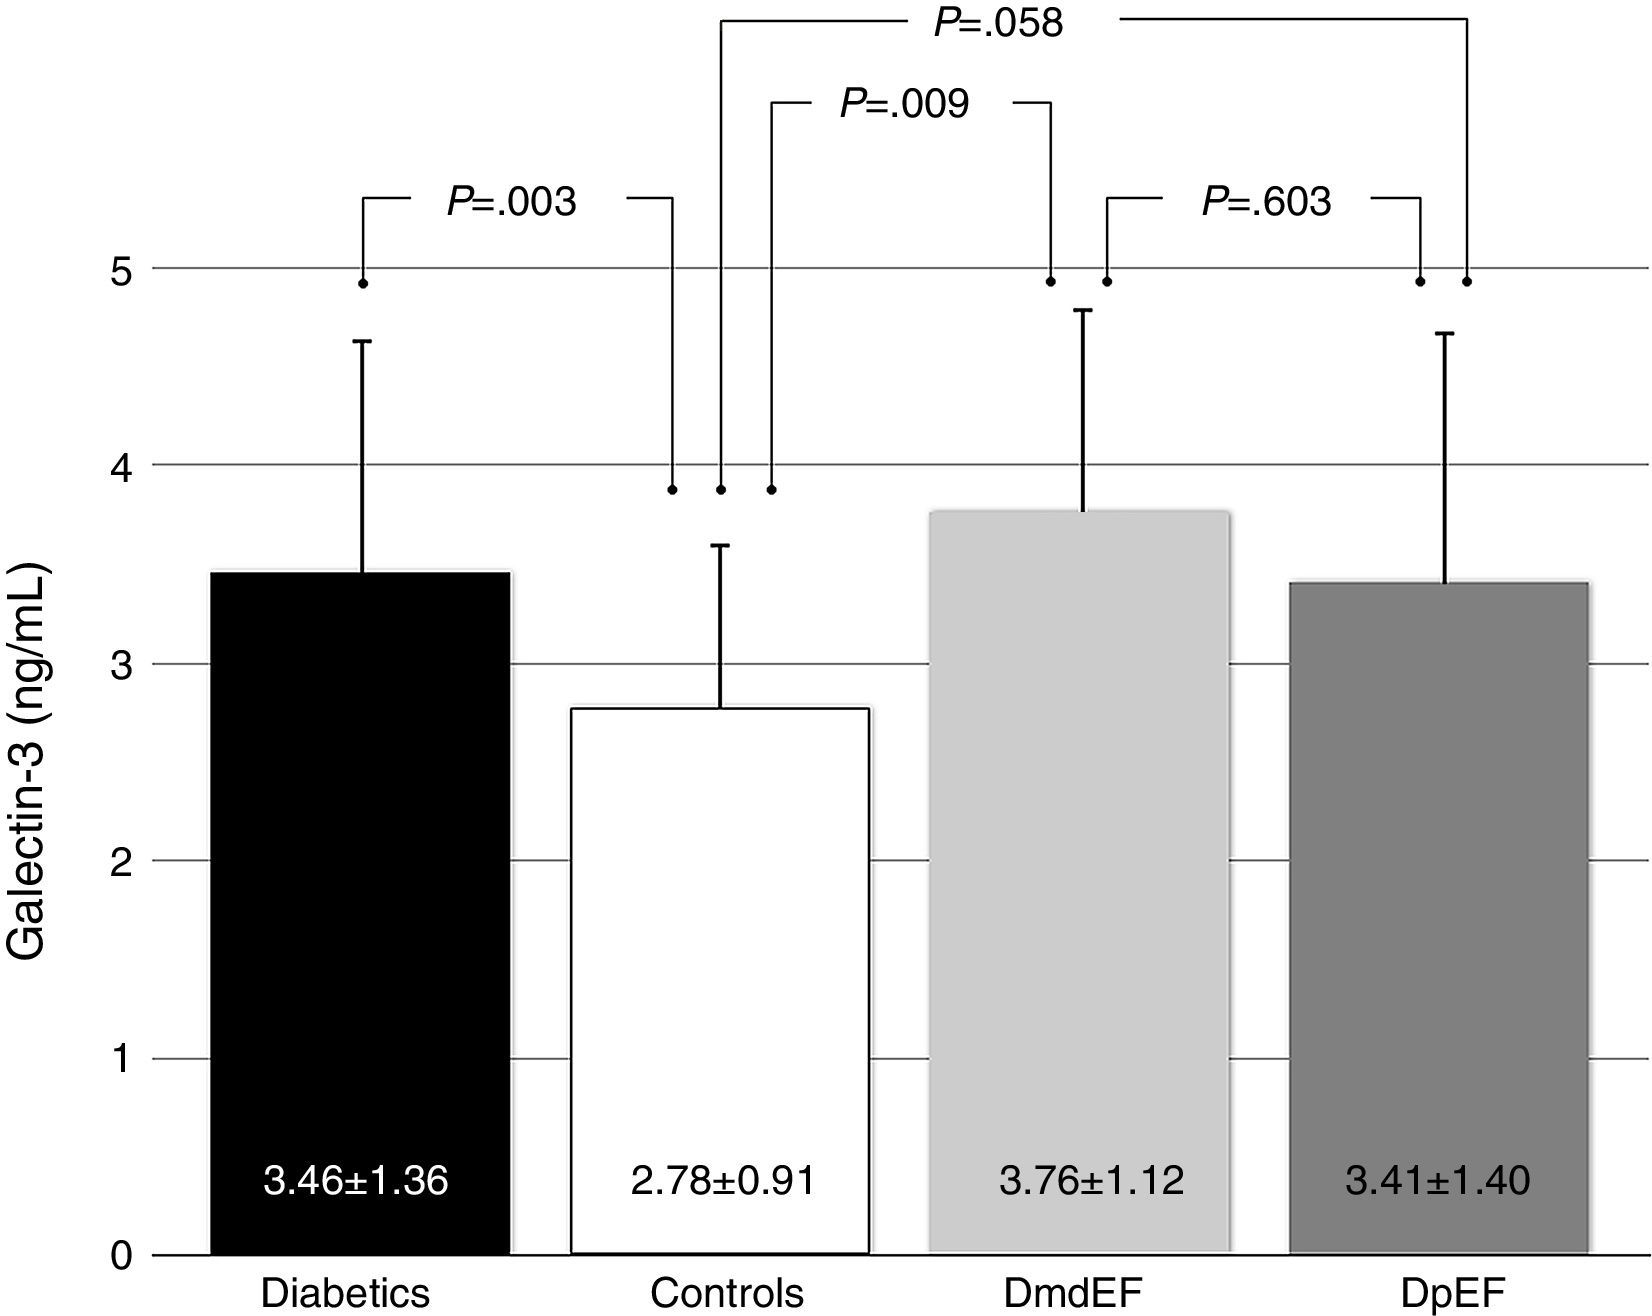
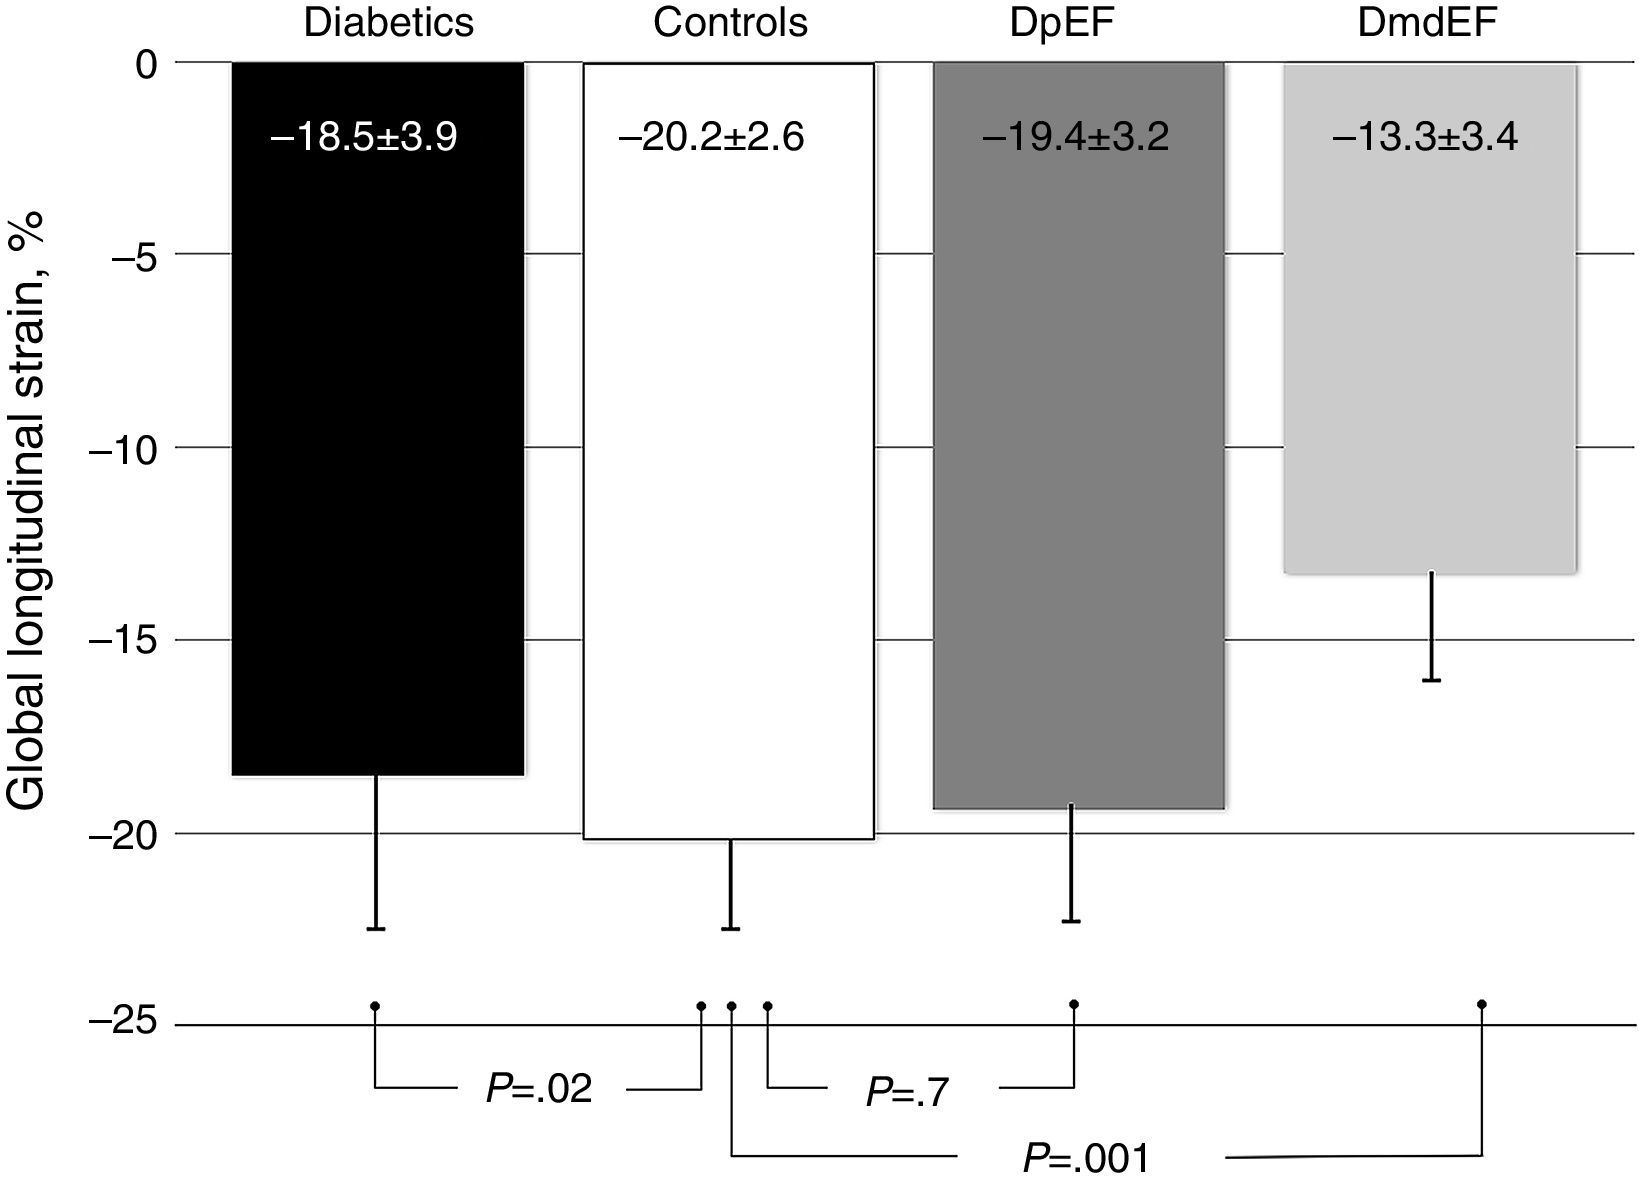
ResultsGalectin-3 was elevated in all diabetics vs controls (3.46±1.36 ng/ml vs 2.78±0.91 ng/ml; p=.003). It was also elevated in mdEF (3.76±1.12 ng/ml vs 2.78±0.9 ng/ml; p=.009) and pEF subjects (3.41±1.40 ng/ml vs 2.78±0.9 ng/ml; p=.058), respectively, vs controls. No difference in Gal-3 was found between diabetic groups (p=.603). Diabetics had lower GLS than controls (−18.5±3.9 vs −20±2.6; p=.022). Diabetics with mdEF had lower GLS than those with pEF (−13.3±3.41 vs −19±3.2; P<.001). There was no difference in GLS with pEF compared to controls (−19.4±3.2 vs −20±2.6; p=.70).
ConclusionsGalectin-3 is elevated in diabetic patients with mdEF, and is associated with a diminished GLS. GLS could be an early marker of left ventricular dysfunction as well as evidence of diabetic cardiomyopathy.
Establecer una asociación entre deformación longitudinal global (DLG) y galectina-3 en insuficiencia cardiaca preclínica en pacientes diabéticos.
Galectina-3 es un biomarcador en insuficiencia cardiaca con fracción de eyección deprimida. Nuestra hipótesis es que la DLG y galectina-3 correlacionan y pueden detectar disfunción ventricular en insuficiencia cardiaca con FEVI preservada.
MétodosSe midieron galectina-3 y DLG en 121 individuos asintomáticos: 14 diabéticos con FEVI deprimida leve (FEdl) (FEVI 47±6.9); 76 diabéticos con FEVI preservada (FEp) (FEVI 61±5.5) y 31 sujetos controles (FEVI 61.7±5.1).
ResultadosGalectina-3 se encontró elevada en todos los diabéticos vs controles (3.46±1.36ng/ml vs 2.78±0.91ng/ml; p=0.003). Está elevada en sujetos con FEdl (3.76±1.12 vs 2.78±0.9 vs ng/ml p=0.009) y FEp (3.41±1.40 vs 2.78±0.9ng/ml p=0.058), respectivamente vs controles; no encontramos diferencia en galectina-3 en ambos grupos de diabéticos (p=0.603). Los diabéticos tienen menor DLG que los controles (−18.5±3.9 vs −20±2.6; p=0.022). Los diabéticos con FEdl tienen DLG más disminuida que aquellos con FEp (−13.3±3.41 vs −19±3.2; p<0.001). No existe diferencia en DLG con FEp y controles (−19.4±3.2 vs −20±2.6; p=0.70).
ConclusionesGalectina-3 está elevada en diabéticos con FEdl y correlaciona DLG disminuida. DLG podría ser un marcador temprano de disfunción ventricular y evidencia en miocardiopatía diabética.
Diabetic cardiomyopathy was first described by Rubler in 1972.1,2 The term describes several mechanisms involved in the pathogenesis of this entity including changes in myocardial structure and metabolism that are not directly attributed to other co-morbidities such as coronary artery disease (CAD) or hypertension. Left ventricular hypertrophy, myocardial lypotoxicity, increased oxidative stress, cell death from apoptosis, impaired contractile reserve, altered substrate utilization as free fatty acids (FFA), mitochondrial dysfunction and fibrosis are among the mechanisms involved with these changes in structure and metabolism contributing to the progression of heart failure.2 In particular, fibrosis is one of the abnormalities that can be evaluated with the newer imaging techniques. Cardiac magnetic resonance (CMR) is the gold standard in the assessment of myocardial fibrosis given that T1 sequences separate normal from fibrotic tissue.3 Nonetheless, CMR is not widely available, and it is time and cost consuming with longer and exhausting protocols. Speckle tracking echocardiography measurement of these parameters has been validated against magnetic resonance imaging.4,5 Global longitudinal strain (GLS) is the simplest deformation parameter and probably the closest to routine clinical application.6 Quantitative assessment of myocardial function is now possible with speckle tracking echocardiography.7
More than half of patients with heart failure have preserved ejection fraction (HFpEF).8 Diagnosis and therapies are difficult because of a lack of specific biomarkers and imaging techniques. There is a need to anticipate the progression of heart failure in patients with diabetes and for that reason we propose a strategy of non-invasive analysis of inflammation-fibrosis LVD. Galectin-3 (Gal-3) has emerged as a new biomarker in heart failure and has a strong relationship with inflammation and fibrosis.9 Galectin-3 is a β-galactoside-binding member of the lectin family in which 14 mammalian galectins have been identified. Galectin-3 is an ∼30kDa protein and contains a carbohydrate recognition binding domain (CRD) of 130 aminoacids that enables the specific binding of β-galactosides and is encoded on by a single gene, LGALSS3 located on chromosome14, locus q21-q22. Galectin-3 has recently been linked to HF development.10,11 We believe that Galectin-3 could detect early stages of left ventricular dysfunction (LVD) in diabetic patients with preserved ejection fraction. On the other hand, newer echocardiography techniques allow evaluating LVD before ejection fraction declines. This study aims to analyze the relation between a cardiac biomarker of fibrosis, Gal-3, and the patterns of GLS in asymptomatic patients with type 2 diabetes and preserved ejection fraction.
MethodsParticipantsFrom April 1, 2015 to August 31, 2015 a total of 159 subjects from the endocrinology outpatient clinic were recruited. The study had ethics approval by our Institutional Review Board. Patients with type 2 diabetes and no history of cardiovascular disease were included. Thirty-one age- and sex-matched healthy volunteers were also studied. Each examination consisted of a clinical history and physical exam, anthropometry, blood samples and routine echocardiogram with strain measurements. Patients with a history of cardiovascular and renal disease, valvular heart disease, atrial fibrillation, angina or previous myocardial infarction were excluded. Two patients excluded had atrial fibrillation, one with chronic liver disease; two patients had myocardial infarction unknown to them and 9 had symptoms of angina; six had a history of stroke. Eighteen non-diabetic individuals in the control group were excluded because of depressed ejection fraction. A total of 121 participants were divided in 3 groups. Group 1: 14 patients with type 2 diabetes and mild depressed ejection fraction (mdEF); group 2: 76 patients with type 2 diabetes and preserved ejection fraction (pEF) and group 3: 31 age- and sex-matched controls without diabetes.
BiomarkerBlood samples were collected after an overnight fast and immediately centrifuged and stored at −70°C until assayed. Plasma concentrations of Gal-3 were measured using an enzyme-linked immunosorbent assay with a sensitivity of 10pg/ml (Abcam Inc., Cambridge, MA), according to the manufacturer's instructions.
EchocardiographyRoutine 2-dimensional and Doppler echocardiography was performed according to the American Society of Echocardiography and European Association of Cardiovascular Imaging guidelines using a ViVid E9 echocardiogram with a 1.5–3.6MHz transducer (GE Vingmed, Horten, Norway). Two certified echocardiologists unaware of the clinical history and Gal-3 level acquired and evaluated all echocardiograms. Indexed ventricular mass was assessed in a linear fashion using the paraesternal long axis view. Left ventricular ejection fraction was calculated with the bi-plane Simpson's method. Preserved ejection fraction was defined as an ejection fraction (EF) above 52% in male subjects and 54% in female subjects; mildly depressed ejection fraction was defined as 41–51% in men and 41–53% in women as described in ASE/EACVI guidelines.12 Pulsed-wave (PW) Doppler was performed in the apical 4-chamber view to obtain mitral inflow velocities to assess left ventricular (LV) filling. A 1-mm sample volume is then placed between the mitral leaflet tips during diastole. Diastolic function measurements include peak early filling (E-wave) and late diastolic filling (A-wave) velocities, the E/A ratio, and deceleration time. Pulsed wave tissue Doppler imaging (DTI) was performed in the 4CH apical view with sample volume positioned at 1cm within the septal insertion site of the mitral leaflet for E/e′. Diastolic dysfunction was defined with criteria described earlier.13 Three cardiac cycles were recorded in 4, 2 and 3 chambers for the offline speckle tracking analyses of GLS. Offline analyses were performed in EchoPAC PC 113.0.X. (GE Vingmed Horten Norway). The complete region of interest (ROI) was defined at end-diastole as the endocardial border: the inner contour of the myocardium; epicardial border: the outer contour of the myocardium; and myocardial midline: the middle ROI axis defined in the middle between the inner and outer ROI contours.14 Each of these contours can be either user-defined or generated automatically. In any case, these were generated automatically; our echocardiologists checked them and, if needed, edited the images manually taking care of defining the ROI to avoid pericardium inclusion.7 Normal reference values of GLS were taken from the literature.6 All individuals were in sinus rhythm at the time of imaging and had no significant cardiovascular abnormalities.
ReproducibilityFor inter and intraobserver variability, GLS and EF were assessed in a subset of 45 subjects randomly selected from the study population and analyzed with Bland–Altman analysis and the Wilcoxon rank with no significant differences between observers. For biplane GLS (SD) interpreter 1, −19.75 (4.09) vs interpreter 2, −19.75 (4.72), Wilcoxon rank test .55 and for EF (SD) interpreter 1, 57 (9.64) vs interpreter 2, 57.5 (11.26) difference -0.5 (5.09) Wilcoxon rank test .60.
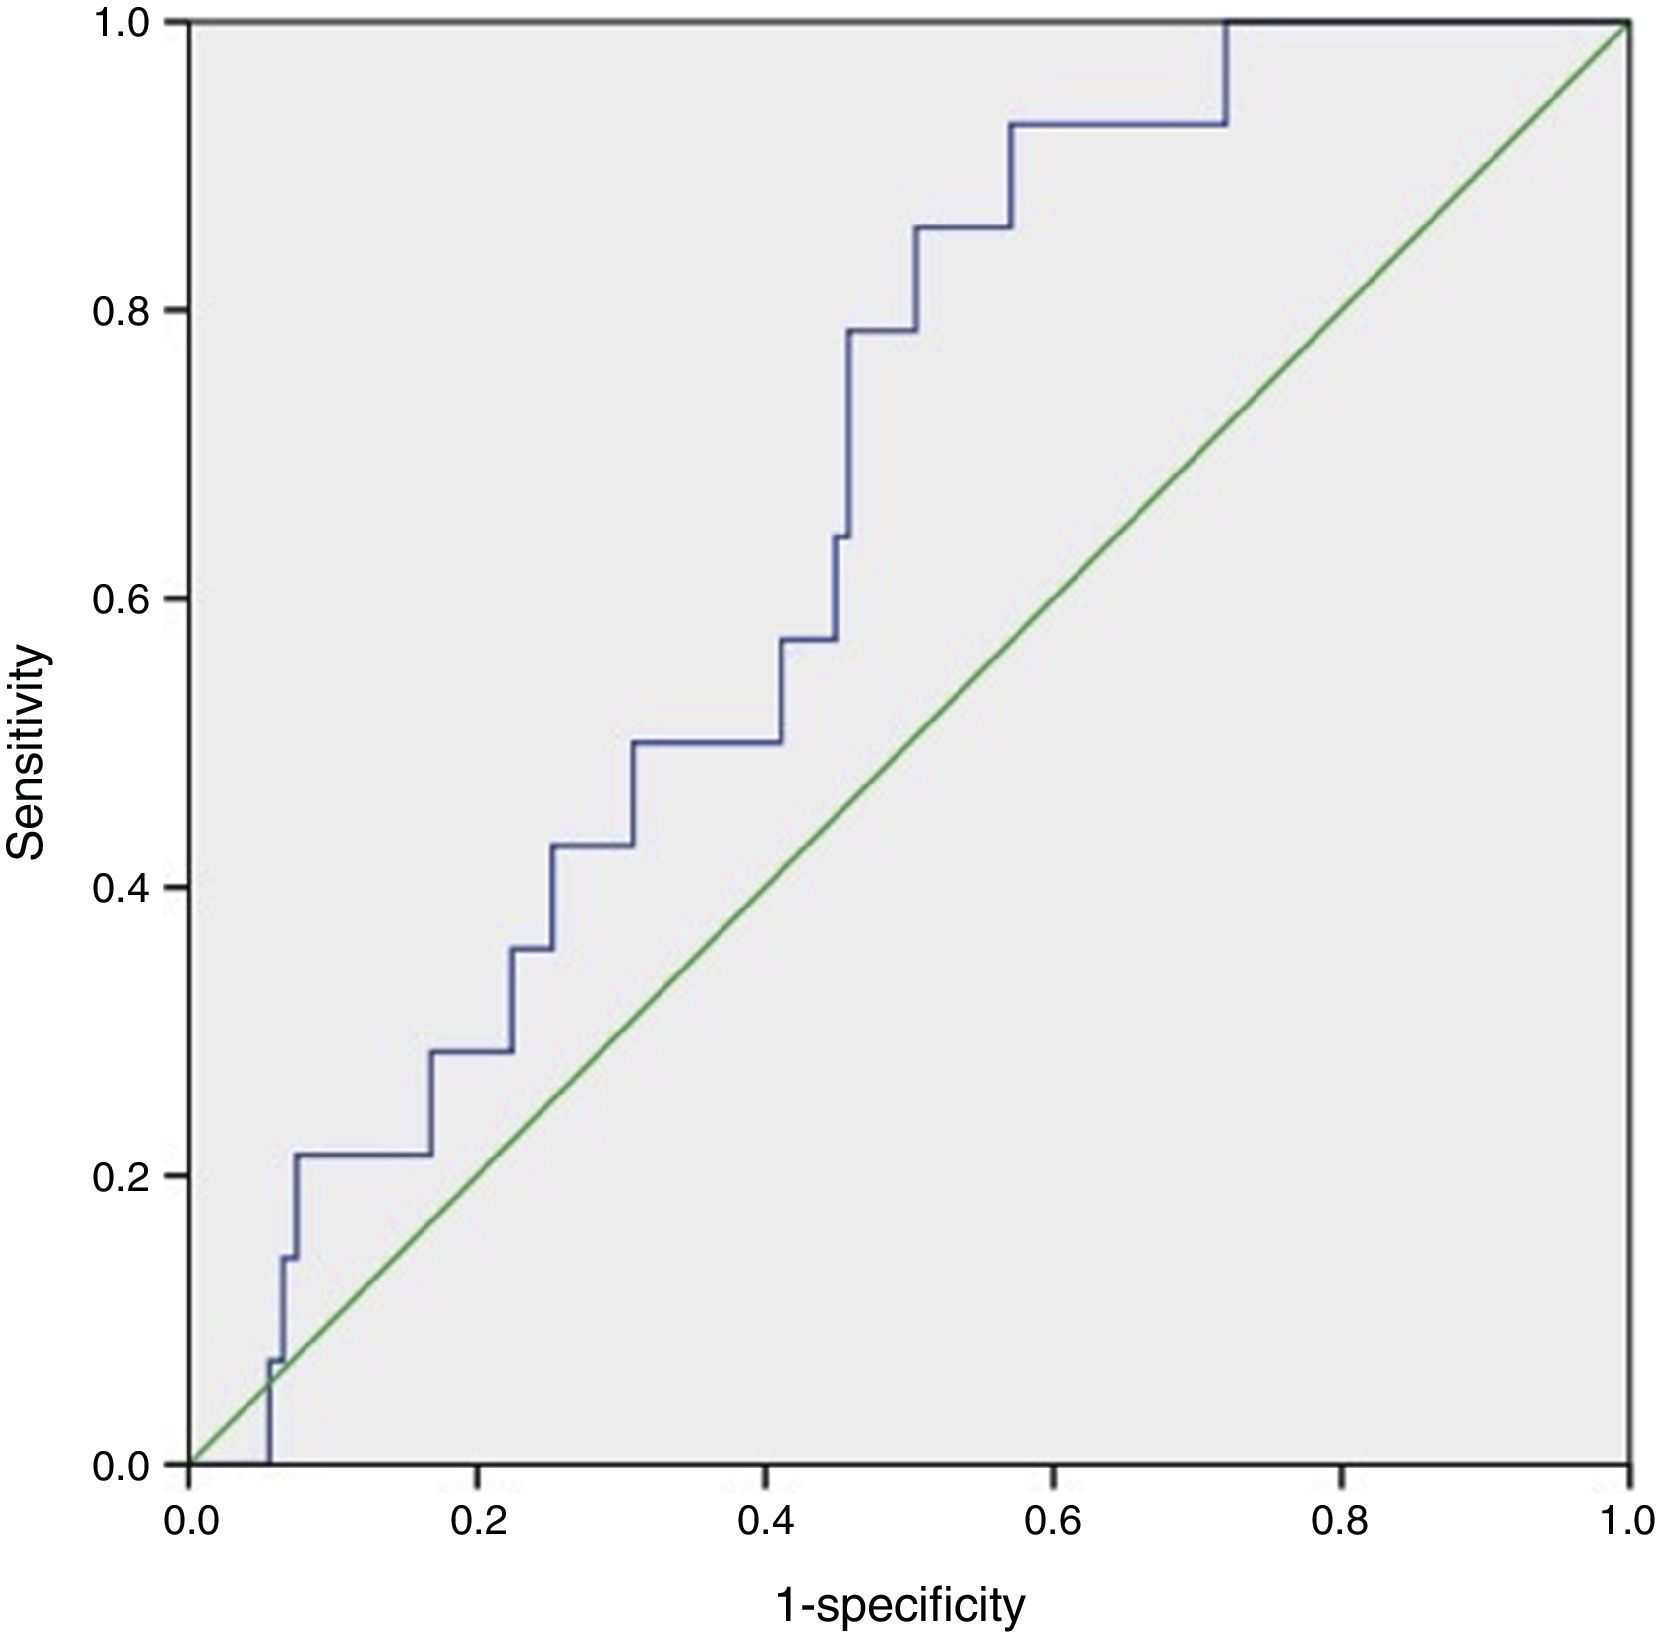
Statistical analysisCategorical values were reported as frequencies. Quantitative variables were tested for normality with the Kolmogorov–Smirnov test. For variables with normal distribution mean±standard deviation (SD) was used. Difference in quantitative data between groups was analyzed using a one-way ANOVA test. When a significant difference was found (p<0.05), the Tukey test was used to determine which group was unequal from the others (p<0.05). The Gal-3 cutoff point was assessed using receiver operating characteristics (ROC curve) and the Youden index. Area under the curve (AUC) values >0.5 with a p<0.05 were considered statistically significant (Fig. 1).
. Highest performance Gal-3 value was 2.71ng/ml with p=0.048, AUC: 0.663, sensitivity: 0.928, specificity: 0.381 and (NPV) negative predictive value: 0.96.")
All statistical data were analyzed with SPSS version 21.0 (IBM Corp., NY, USA).
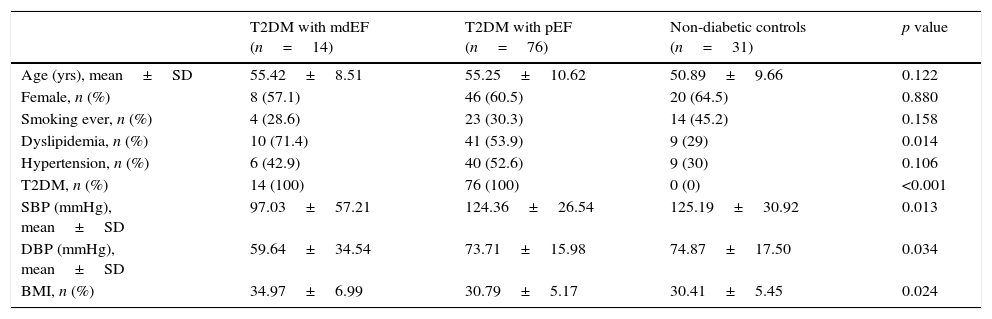
ResultsAll demographic results are described in (Table 1). There were no differences between groups according to age, sex, body mass index and other cardio-metabolic parameters.
Demographic characteristics of study group.
| T2DM with mdEF (n=14) | T2DM with pEF (n=76) | Non-diabetic controls (n=31) | p value | |
|---|---|---|---|---|
| Age (yrs), mean±SD | 55.42±8.51 | 55.25±10.62 | 50.89±9.66 | 0.122 |
| Female, n (%) | 8 (57.1) | 46 (60.5) | 20 (64.5) | 0.880 |
| Smoking ever, n (%) | 4 (28.6) | 23 (30.3) | 14 (45.2) | 0.158 |
| Dyslipidemia, n (%) | 10 (71.4) | 41 (53.9) | 9 (29) | 0.014 |
| Hypertension, n (%) | 6 (42.9) | 40 (52.6) | 9 (30) | 0.106 |
| T2DM, n (%) | 14 (100) | 76 (100) | 0 (0) | <0.001 |
| SBP (mmHg), mean±SD | 97.03±57.21 | 124.36±26.54 | 125.19±30.92 | 0.013 |
| DBP (mmHg), mean±SD | 59.64±34.54 | 73.71±15.98 | 74.87±17.50 | 0.034 |
| BMI, n (%) | 34.97±6.99 | 30.79±5.17 | 30.41±5.45 | 0.024 |
Plus-minus values are means±SD. There were no significant between-group differences at baseline except for T2DM (type 2 diabetes mellitus). SBP: systolic blood pressure; DBP: diastolic blood pressure; BMI: body mass index.
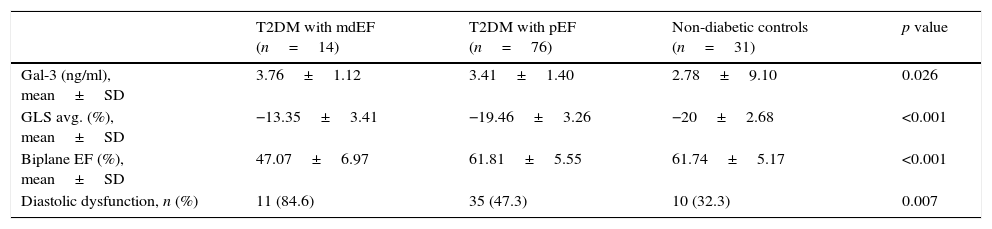
Based on updated echocardiographic guidelines,12 we compare diabetic individuals with mdEF vs pEF vs controls (Table 2). Gal-3 was elevated in all individuals with diabetes compared to controls (3.46±1.36ng/ml vs 2.78±0.91ng/ml; p=0.003) with no difference between diabetic patients with mild depressed ejection fraction and preserved ejection fraction (3.76±1.12ng/ml vs 3.41±1.4ng/ml; p=0.603) (Fig. 2). All echocardiographic variables are described in (Table 3).
Main findings between groups.
| T2DM with mdEF (n=14) | T2DM with pEF (n=76) | Non-diabetic controls (n=31) | p value | |
|---|---|---|---|---|
| Gal-3 (ng/ml), mean±SD | 3.76±1.12 | 3.41±1.40 | 2.78±9.10 | 0.026 |
| GLS avg. (%), mean±SD | −13.35±3.41 | −19.46±3.26 | −20±2.68 | <0.001 |
| Biplane EF (%), mean±SD | 47.07±6.97 | 61.81±5.55 | 61.74±5.17 | <0.001 |
| Diastolic dysfunction, n (%) | 11 (84.6) | 35 (47.3) | 10 (32.3) | 0.007 |
Plus-minus values are means±SD. There were significant differences in GLS (global longitudinal strain), biplane EF (ejection fraction) and diastolic dysfunction in diabetics vs controls.
. DpEF (diabetics with preserved ejection fraction).")
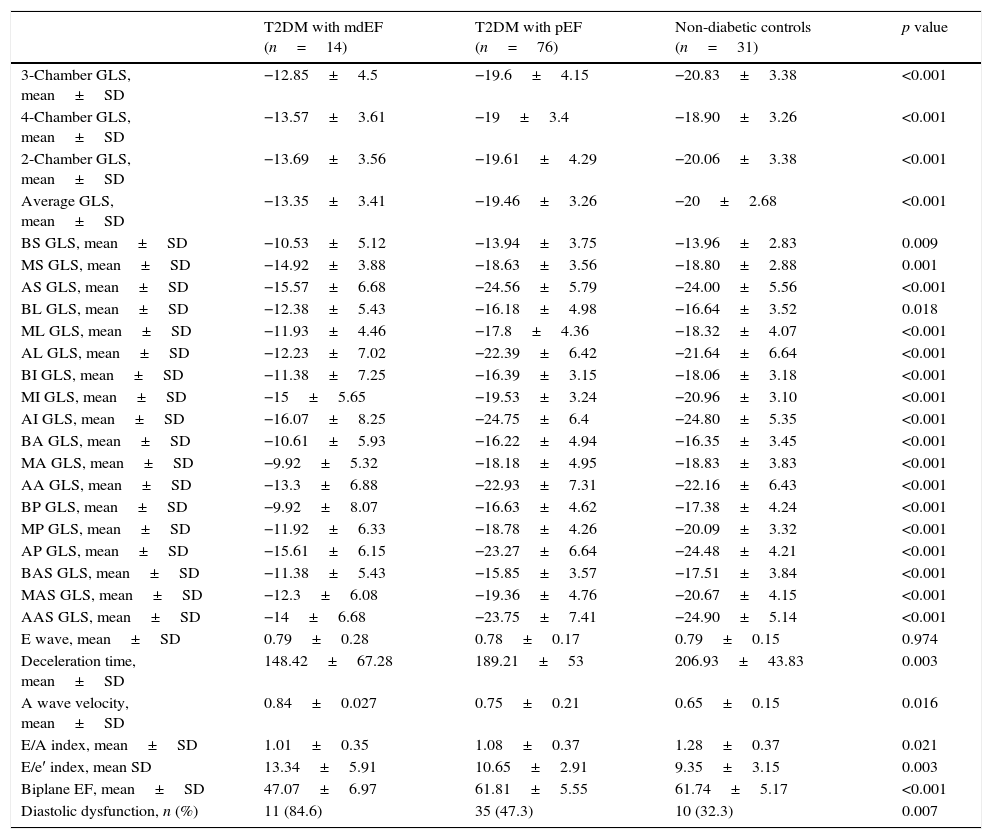
Echocardiographic variables.
| T2DM with mdEF (n=14) | T2DM with pEF (n=76) | Non-diabetic controls (n=31) | p value | |
|---|---|---|---|---|
| 3-Chamber GLS, mean±SD | −12.85±4.5 | −19.6±4.15 | −20.83±3.38 | <0.001 |
| 4-Chamber GLS, mean±SD | −13.57±3.61 | −19±3.4 | −18.90±3.26 | <0.001 |
| 2-Chamber GLS, mean±SD | −13.69±3.56 | −19.61±4.29 | −20.06±3.38 | <0.001 |
| Average GLS, mean±SD | −13.35±3.41 | −19.46±3.26 | −20±2.68 | <0.001 |
| BS GLS, mean±SD | −10.53±5.12 | −13.94±3.75 | −13.96±2.83 | 0.009 |
| MS GLS, mean±SD | −14.92±3.88 | −18.63±3.56 | −18.80±2.88 | 0.001 |
| AS GLS, mean±SD | −15.57±6.68 | −24.56±5.79 | −24.00±5.56 | <0.001 |
| BL GLS, mean±SD | −12.38±5.43 | −16.18±4.98 | −16.64±3.52 | 0.018 |
| ML GLS, mean±SD | −11.93±4.46 | −17.8±4.36 | −18.32±4.07 | <0.001 |
| AL GLS, mean±SD | −12.23±7.02 | −22.39±6.42 | −21.64±6.64 | <0.001 |
| BI GLS, mean±SD | −11.38±7.25 | −16.39±3.15 | −18.06±3.18 | <0.001 |
| MI GLS, mean±SD | −15±5.65 | −19.53±3.24 | −20.96±3.10 | <0.001 |
| AI GLS, mean±SD | −16.07±8.25 | −24.75±6.4 | −24.80±5.35 | <0.001 |
| BA GLS, mean±SD | −10.61±5.93 | −16.22±4.94 | −16.35±3.45 | <0.001 |
| MA GLS, mean±SD | −9.92±5.32 | −18.18±4.95 | −18.83±3.83 | <0.001 |
| AA GLS, mean±SD | −13.3±6.88 | −22.93±7.31 | −22.16±6.43 | <0.001 |
| BP GLS, mean±SD | −9.92±8.07 | −16.63±4.62 | −17.38±4.24 | <0.001 |
| MP GLS, mean±SD | −11.92±6.33 | −18.78±4.26 | −20.09±3.32 | <0.001 |
| AP GLS, mean±SD | −15.61±6.15 | −23.27±6.64 | −24.48±4.21 | <0.001 |
| BAS GLS, mean±SD | −11.38±5.43 | −15.85±3.57 | −17.51±3.84 | <0.001 |
| MAS GLS, mean±SD | −12.3±6.08 | −19.36±4.76 | −20.67±4.15 | <0.001 |
| AAS GLS, mean±SD | −14±6.68 | −23.75±7.41 | −24.90±5.14 | <0.001 |
| E wave, mean±SD | 0.79±0.28 | 0.78±0.17 | 0.79±0.15 | 0.974 |
| Deceleration time, mean±SD | 148.42±67.28 | 189.21±53 | 206.93±43.83 | 0.003 |
| A wave velocity, mean±SD | 0.84±0.027 | 0.75±0.21 | 0.65±0.15 | 0.016 |
| E/A index, mean±SD | 1.01±0.35 | 1.08±0.37 | 1.28±0.37 | 0.021 |
| E/e′ index, mean SD | 13.34±5.91 | 10.65±2.91 | 9.35±3.15 | 0.003 |
| Biplane EF, mean±SD | 47.07±6.97 | 61.81±5.55 | 61.74±5.17 | <0.001 |
| Diastolic dysfunction, n (%) | 11 (84.6) | 35 (47.3) | 10 (32.3) | 0.007 |
Plus-minus values are means±SD. BS: basal septal; MS: medium septal; AS: apical septal; BL: basal lateral; ML: medium lateral; AL: apical lateral; BI: basal inferior; MI: medium inferior; AI: apical inferior; BA: basal anterior; MA: medium anterior; AA: apical anterior; BP: basal posterior; MP: medium posterior; AP: apical posterior; BAS: basal antero-septal; MAS: medium antero-septal; AAS: apical antero-septal; GLS: global longitudinal strain; EF: ejection fraction.
Gal-3 was found to be higher in mdEF (2.78±0.9ng/ml vs 3.76±1.12ng/ml; p=0.009) and pEF subjects (2.78±0.9ng/ml vs 3.41±1.40ng/ml; p=0.058) compared to controls.
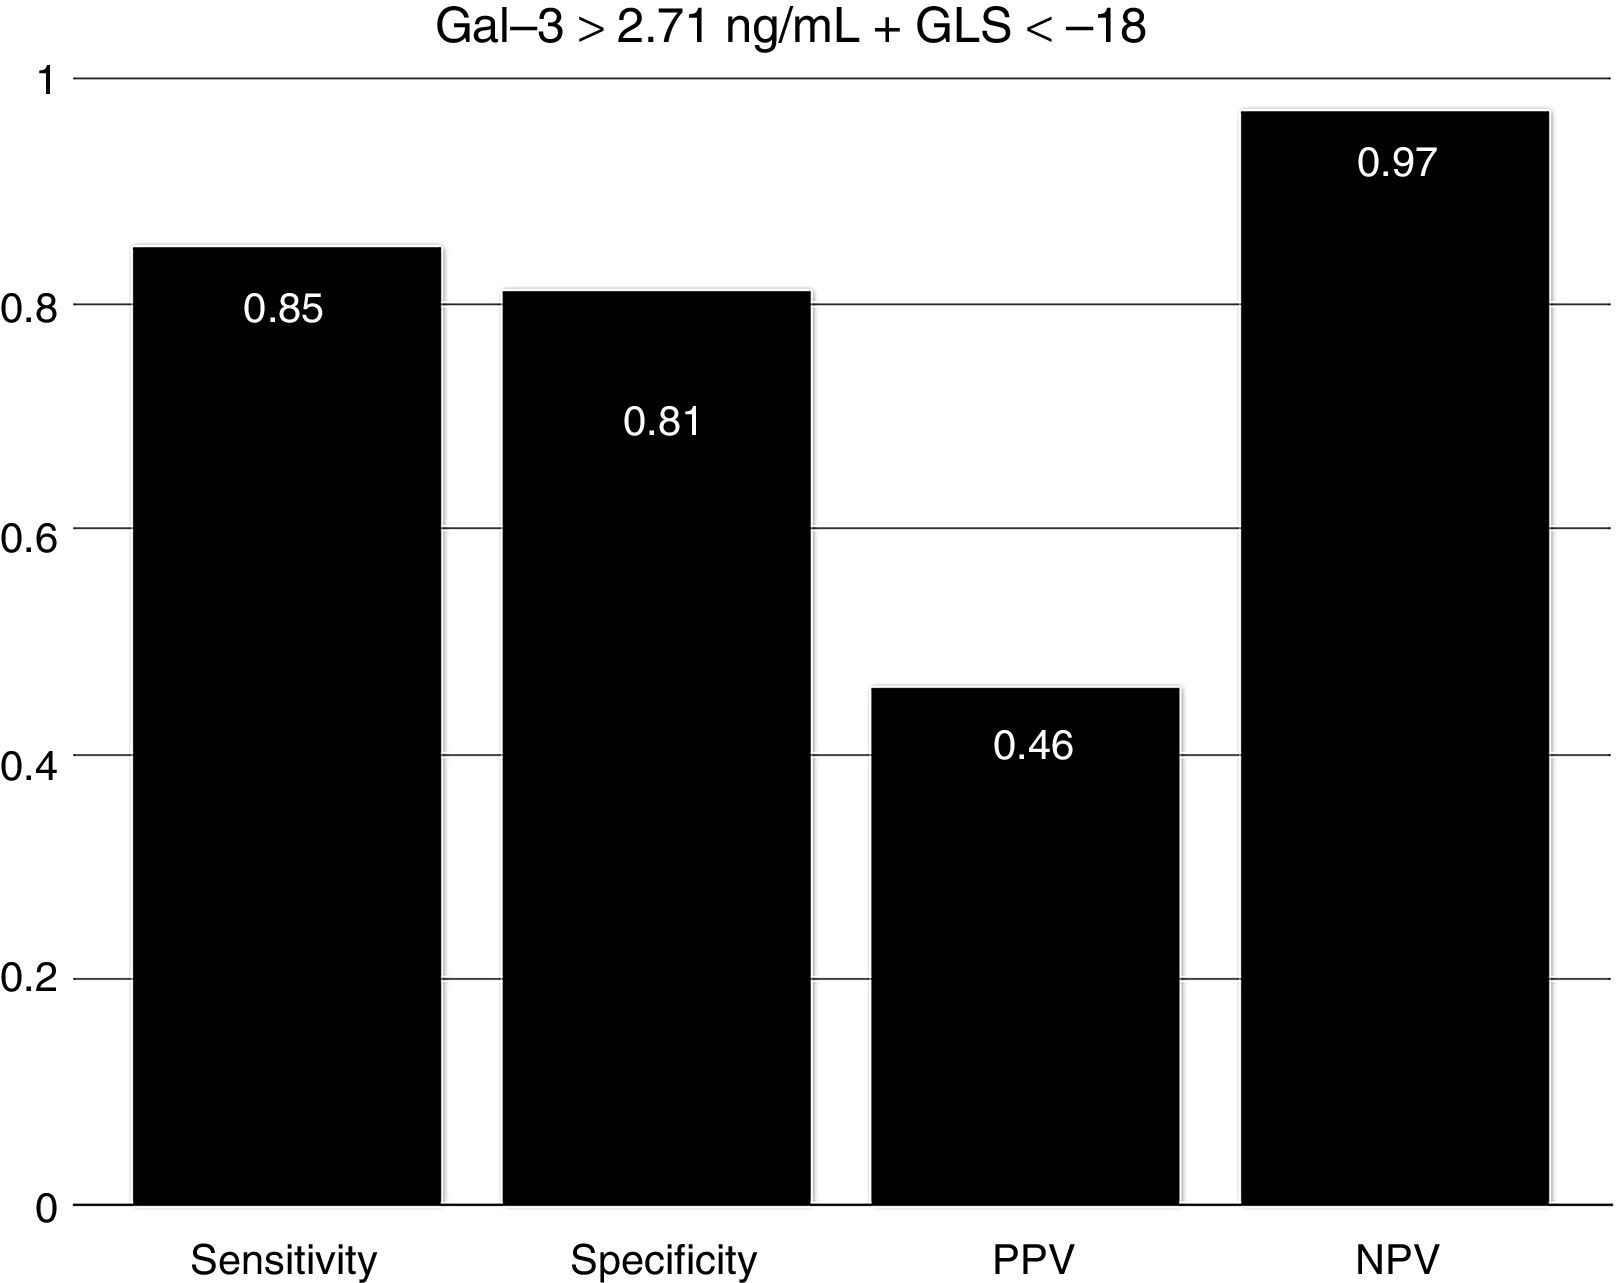
To assess the effect of diabetes progression on left ventricular function, we divided our cohort in those who had less than 10 years since diagnosis and those with more than 10 years. Gal-3 levels were higher in patients with more than 10 years (p=0.011). There was no significant statistical difference regarding EF (p=0.286) and GLS (p=0.228). Diastolic function was more frequently altered in the group with more than 10 years (p=0.03) (Table 2). When we compare diabetic individuals did not found difference in baseline Gal-3 in diabetes with mdEF n=14 (3.76±1.12ng/ml) vs pEF n=76 (3.41±1.4ng/ml) p=0.60, but consistently LVD with GLS between these groups (−13.35±3.41 vs −19.46±3.26) p=0.001. Compared to controls, all individuals with diabetes had worst GLS (p=0.022). There was no difference in GLS in diabetic patients with pEF when compared to non-diabetic controls (p=0.70). Patients with mdEF had significantly lower GLS than controls (p<0.001) (Fig. 3). Thirty per cent of those in the pEF group had impaired GLS values and 92.9% in the mdEF group. Both parameters move discretely in the desired direction, but with wide dispersion, without any correlation. Using 2 markers, Gal-3 (>2.71ng/ml) and GLS (<18%), we found a sensitivity of 0.85, a specificity of 0.81, a PPV of 0. 46 and a NPV of 0.97 for LVD (Fig. 4).
. DpEF (diabetics with preserved ejection fraction).")
 and NPV (negative predictive value). Using both parameters; Gal-3 at >2.71ng/ml and global longitudinal strain <18%.")
Left ventricular dysfunction (LVD) is now known to be a major co-morbidity in diabetes. Hypertension and DM are closely related and complicate each other. The activation of the rennin–angiotensin–aldosterone system causes insulin resistance.15,16 Cardiac remodeling occurs together with hypertension and DM.17 Difficult exists in specifying the cause of cardiac remodeling in diabetes because of the lack of criteria and tools, including biomarkers and imaging techniques. Microvasculopathy is a primary feature in diabetic cardiac remodeling but no surrogate can directly monitor disease progression. Therefore there is an increasing interest in the link between DM and heart failure. Diabetic cardiomyopathy is a term assigned to those patients with cardiomyopathy without coronary artery disease and hypertension.18 Multiple substrates are responsible for myocardial damage including fatty acid uptake, collagen metabolism, oxidation and fibrosis.2 Because Gal-3 is a marker of inflammation and fibrosis9 we aimed to correlate this biomarker with a non-invasive, easier and accessible tool in the evaluation of pre-clinical heart failure or incipient myocardial dysfunction in patients with diabetes.
It is estimated than more than 50% of patients presenting with signs and symptoms of heart failure suffer from heart failure with preserved ejection fraction (HFpEF).19 The vast majority of published articles on Gal-3 described patients with heart failure with reduced ejection fraction (HFrEF) not HFpEF.9 Echocardiography is a non-invasive tool in the global evaluation of heart disease. Some of its features includes left ventricular ejection fraction (LVEF). LVEF has been demonstrated in patients with heart failure in different scenarios such as coronary artery disease, valvular heart disease and other cardiomyopathies. LVEF has been the fundamental tool for systolic function; nonetheless it is less sensitive for detecting early myocardial disease than newer techniques.20 Asymptomatic myocardial dysfunction can occur in diabetic patients without CAD. LVEF could be normal but myocardial dysfunction in terms of abnormal deformation is not. GLS can detect myocardial abnormalities before EF declines.20 The presence of LVD was defined in a large meta-analysis of strain. The mean GLS in normal subjects was −19.7%, with a lower 95% CI of −18.9%.6 In a recent study, Holland et al. evaluated the 10-year outcomes in subclinical myocardial dysfunction evaluating GLS in a cohort of 249 type 2 diabetic patients with normal LVEF.21 Holland found that almost half of patients (45%) had evidence of LVD detected by GLS in a median follow-up of 7.4±2.6 years. GLS was independently associated with the primary endpoint. Patients with LVD had a significantly worse outcome than those without. They concluded that subclinical LVD is common in asymptomatic patients with type 2 DM, that it was detectable by GLS imaging and is independently associated with adverse outcome.21 In our study we found that GLS is depressed in all individuals with diabetes compared to controls (p=0.003) but there is no difference in GLS in diabetic patients with pEF when compared to controls (−19.4±3.2 vs −20±2.6; p=0.42) but Gal-3 was significantly elevated (p=0.008). Left ventricular dysfunction (GLS <−18) was found in 30.3% of pEF subjects. We assume at this point that diabetic individuals with pEF are in early phases of inflammation and extracellular matrix proliferation but these needs to be confirmed in a MRI study. Using 2 markers, Gal-3 (>2.71ng/ml) and GLS (<18%), we found a sensitivity of 0.85, a specificity of 0.81, a PPV of 0. 46 and a NPV of 0.97 for LVD.
Only a few studies have described the levels and clinical correlation of Gal-3 and HFpEF. The COACH study de Boer et al. found, in a cohort of 592 patients admitted with acute heart failure, that 19.2% (114) of patients with HFpEF and Gal-3 levels where comparable between HFrEF and HFpEF (∼20ng/ml).22 Our population was a non-Caucasian heart failure symptom-free cohort from the endocrinology outpatient clinic. Levels of Gal-3 were not highly elevated in this cohort compared to other studies (∼3.4pg/ml); in the fibrosis marker, Gal-3, and in the outcome in the general population, de Boer found a gender interaction, with female subjects having higher median Gal-3 levels 11.0ng/ml IQR (interquartile range 9.0–13.1ng/ml.) than men 10.7ng/ml IQR (8.9–12.8ng/ml) but they excluded non-Caucasian subjects.23 In the epidemiological field Ho et al.24 Investigated Gal-3 linked to the development of HF in the general population. Gal-3 concentrations were measured in 3353 participants from the Framingham Offspring Cohort and were associated independently with an increased risk for developing HF and mortality. Crude HF incidence rates were estimated by sex-specific Gal-3 quartile. Quartile 1: 3.9–11.1ng/ml, quartile 2: 11.1–13.1ng/ml, quartile 3: 13.1–15.4ng/ml and quartile 4: 16.8–51.1ng/ml. During a mean follow-up period of 11.2 years, 166 (5.1%) subjects developed HF. The heart failure incidence rate increased over Gal-3 quartiles, with rates of 2.8, 3.8, 5.2 and 12.4 events per 1000 persons-years in quartiles 1 through 4, respectively. Our cohort resembles quartile 1 of the Ho study. We believe that in diabetic patients adding GLS to standard echocardiograms is useful in the detection of early phases of LVD. The combination of Gal-3 and GLS has a high NPV of 0.94. At the same time our study demonstrates that Gal-3 was elevated in all diabetic individuals compared to controls (p=0.003). Gal-3 was found to be higher in patients with mdEF compared to pEF with diabetic subjects not reaching significance due to sample size (p=0.375). When compared to controls Gal-3 was found to be higher in pEF diabetic subjects (p=0.008).
Study limitationsWe studied only one of the substrates of DCM. It would have been useful to compare GLS with cardiac magnetic resonance for detection of fibrosis; however, it was not available at our institution. Also, non-significant differences could be as a result of the sample size basically in the mdEF group. We did not studied the existence of ischemic heart disease even in those diabetic subjects with more than 10 years of diagnostic so these make harder to consider DCM by itself, an lastly GLS is not a surrogate of Gal-3.
ConclusionsThis is a non-Caucasian study in a diabetic heart failure symptom free cohort. Global longitudinal strain is an easy and reproducible echocardiography tool in the evaluation and follow-up of DCM in diabetic subjects although is not a surrogate of Gal-3 because this biomarker is elevated in all diabetics. There still much to investigate in the physiopathology of DCM especially in asymptomatic patients with preserved ejection fraction. Including Gal-3 to standard echocardiography and GLS would be helpful in the early detection of LVD in DCM.
Ethical responsibilitiesProtection of people and animalsThe authors state that the procedures conformed to the ethical standards of human experimentation committee responsible and according to the World Medical Association and the Declaration of Helsinki.
Confidentiality of dataThe authors declare that they have followed the protocols of the workplace on the publication of patient data.
Right to privacy and informed consentThe authors have obtained the informed consent of patients and/or subjects referred to in Article consent. This document is held by the corresponding author.
FundingThis study has no funding.
Conflict of interestThe authors have no conflicts of interest to declare.
Authors would like to thank Neri A. Alvarez MD for statistical analysis, Gloria Jasso QFB for endocrinology lab analyses, Rodolfo Flores-Alexander English language professor and Sergio Lozano M.D. for English translation advice.