


The recent financial crisis in Europe has been especially interesting, since it started mainly as a private sector (banking) phenomenon but then evolved into a public (sovereign debt) crisis. Given that prices of a financial asset must reflect the risks associated to said asset, we expect the relationship between financial markets related to “private” and “public” assets to have changed fundamentally during the crisis: private markets should have led the incorporation of information during the early years of the crisis whereas the markets for government securities should have attained preeminence during the years of the sovereign debt crisis. We investigate this change in the leading role of information (risk) incorporation by looking at the relationships between the markets for sovereign CDSs, sovereign bonds and equity for thirteen European countries during the period 2008–2012. Our results suggest that during 2008–2009 equity markets led the process of incorporation of new information but during 2010 this leading role was assumed by sovereign CDS markets, thus suggesting a private-to-public risk transfer during the subprime crisis and a reversal to a public-to-private risk transfer during the sovereign debt crisis. In supplementary analyses we show, first, that the role of CDSs with respect to the other two markets is state dependent, i.e., sovereign CDSs play a stronger role in economies with higher perceived credit risk. Second, we perform a price discovery analysis between CDS markets of the different European countries, showing evidence that during the years 2007–2009 the Spanish CDSs led the price discovery process, while the Italian and French CDSs took over in 2011, results which are consistent with trading volume in the CDS markets.
The relationship between the markets of Credit Default Swaps (hereafter CDS) and other asset markets has attracted increasing attention, especially since CDSs became liquid enough to serve as effective hedging instruments. For example, since both CDS premiums and bond spreads are measures of credit quality, the co-movement between these two markets, at least at a firm level, has been extensively documented by, e.g., Norden and Weber (2009), Blanco et al. (2005), Zhu (2006) and Forte and Peña (2009). These papers find evidence that the CDS market leads the incorporation of new information when considered along with the bond market. Also, financial theory posits that prices in an efficient stock market must reflect the default probability of firms. Thus, Bystrom (2008) and Fung et al. (2008), among others, have studied the relationship between corporate equity prices and CDS spreads and found evidence which suggests that firm specific information is embedded into stock prices before it is embedded into CDS spreads. Fung et al. (2008) additionally document that the lower the credit quality of a company the stronger the feedback effect between the CDS market and the stock market.
However, the relationship between the markets of sovereign CDSs, sovereign bonds and stocks has been overlooked until very recently, probably because of the limited liquidity of some markets for sovereign CDSs. During the debt crisis of 2010 sovereign CDS markets started to receive increasing attention (e.g., Lonstaff et al., 2011; Dieckmann and Plank, 2011, or Gündüz and Kaya, 2012) and, as a consequence, the relationship between sovereign bonds and sovereign CDSs became the focus of many analyses (see, e.g., the papers by Arce et al., 2012; Coudert and Gex, 2010; Fontana and Scheicher, 2010; Delatte et al., 2012).
However, whether, and how, these two markets are related to stock markets has, to our knowledge, not been explored (one notable exception is the paper by Chan-Lau and Kim, 2004). In principle, stock markets should react to risk factors that affect the private sector, whereas the markets for sovereign securities (bonds or CDSs) should react to risk factors which affect the public sector. Thus, we would expect that in contexts of increased risk in the private sector the stock market would be the leading market in the incorporation of information (i.e. it would react first, and then the markets for sovereign securities would react if the private risk gets transferred to the public sector). In context of increased sovereign risk the opposite would be true, that is, sovereign markets would react first and, if there is a public-to-private risk transfer, then the stock market would follow. Interestingly, the recent financial crisis provides us with a perfect testing ground for this risk transfer between markets, given that the crisis started mainly as a private sector (banking) crisis, but then, at least in Europe, it evolved into a sovereign crisis.
In this paper we take advantage of this evolution to investigate the relationships (i.e. information or risk transfer) between the markets for sovereign bonds and CDSs and the stock markets for a wide sample of European countries, some of which have been affected quite substantially by the sovereign debt crisis. More specifically, we look at the process of information incorporation into the three markets in order to detect which market leads such process, and to test our hypothesis that in the early stages of the crisis private (stock) markets should lead the process whereas in the later stages the direction of the risk transfer probably changed, and sovereign markets would lead. Our results indeed confirm this hypothesis, and show that stock markets led the incorporation of information during 2008 and 2009 whereas the CDS markets seemed to take the leading role during 2010. In 2011 the stock market regains its leading role and, even though the relationships between the three markets weaken, sovereign bonds gain in importance. Further, we assess whether these relationships are state dependent, i.e., whether they depend on the level of perceived sovereign credit risk. To this end, we pool together the different countries in terms of their risk level. In line with previous research (Fontana and Scheicher, 2010; Delatte et al., 2012), we find that CDSs play a stronger leading role in economies with higher perceived credit risk.
As a final step, we study the relationship between the different European CDSs before and during the crisis. Several studies (e.g., Gündüz and Kaya, 2012; Lonstaff et al., 2011; Ang and Longstaff, 2011; Fontana and Scheicher, 2010, or Dieckmann and Plank, 2011) have shown that there is a high level of synchronicity in the movements of sovereign credit spreads due to systemic sovereign risk. Given this, we suggest the existence of an equilibrium relationship between the CDSs of pairs of countries and estimate equilibrium (error correction) models. We find evidence that the Spanish CDS led the price discovery process during 2007–2009. During 2010, however, the different CDS markets lost their equilibrium relationship (this is understandable, given the effects on the term premiums induced by the European sovereign debt crisis) so we test, alternatively, for Granger causality to examine whether a specific market exercises some sort of price leadership. Our findings point to the German CDS market as the leader of the incorporation of risk information during 2010. In 2011 this leadership position changes again: many sovereign CDSs in our sample recover an equilibrium path and the Italian CDS, as well as the French, lead the process of price discovery. These results are consistent with trading activity in the CDS markets.
Although the Sovereign debt crisis is far from being solved, during this last year it has become obvious that Greek debt restructuring will imply large losses for debt holders. ISDA has declared a Greek credit event,1 but the legitimacy of sovereign CDS settlement has been called into question during 2011 and 2012, given the ability of governments to influence the event of default. An interesting discussion about the future of CDSs can be found in Gelpern and Gulati (2012) who argue that the economic function of sovereign CDSs after Greece's situation is limited and uncertain, partly thanks to ISDA's insistence on reconciling the competing political demands of state regulators and its market constituents. European sovereign CDSs have continued to be traded though, suggesting that this view about the future of sovereign CDSs is not shared by all agents. For example, during 2012, the Italian, Spanish, French and German CDSs have been among the top ten most liquid worldwide CDSs, and as of January 2013, they are still within the top ten CDSs in terms of volume of trade.2
The rest of the paper is structured as follows. In Section 2, we briefly justify the existence of a relationship between sovereign credit markets and the domestic stock market. In Section 3, we describe our data. In Section 4, we estimate models that relate – at a country level and for pools of countries – the markets of sovereign CDSs, sovereign bonds and stocks. In Section 5, we report the results of a price discovery process among European CDSs. Finally, in Section 6 we conclude.
2The link between sovereign CDSs and stock marketsSovereign CDSs and bonds are quite different financial instruments, but the link between their markets has been vastly studied, both at the corporate and at the sovereign level. However, the link between sovereign CDSs and a country's stock market has been much less explored and usually only in indirect ways, since it is not immediately intuitive why we would expect a direct relationship between these markets. Lonstaff et al. (2011) find that emerging sovereign credit spreads are strongly linked to global factors such as US stock market returns and volatility indices, and Berndt and Obreja (2010) show that European corporate CDSs are significantly related to a factor which captures “economic catastrophe risk”. Fontana and Scheicher (2010) also find that common factors drive the CDS market. Finally, Manasse and Zavalloni (2013) show that fundamentals and structural fragilities matter for sovereign risk.
Chan-Lau and Kim (2004) directly linked the CDS and stock markets by extending Merton's theory of the firm to sovereign issuers. An efficient stock market should incorporate in a timely manner the information relevant to the default probability of firms: the value of any credit derivative must be linked to the probability of the underlying entity being exposed to a credit event at some point in the future (Merton, 1974). For entities with traded equity this probability is, in fact, often estimated using information from the stock market. Chan-Lau and Kim (2004) extend this reasoning to sovereign securities and suggest that the only substantial difference between a corporate and a sovereign issuer with the same amount of debt is that default risk is higher for the sovereign for every asset value because a sovereign issuer may choose to default even when it is technically solvent. Their analysis of eight emerging markets shows that the correlation patterns between sovereign CDS spreads and stock market performance suggest a strong link by which as the credit situation worsens, the stock market falls (we detail these findings in Section 3).3
In a paper explaining the interconnectedness between sovereigns, banks and insurance companies, Merton et al. (2013) argue that the assets of a country are whatever sovereign assets the creditor gets claim to, including taxing power. This reasoning opens the door to considering claims to different assets, and different proxies to these assets. A related study is the paper by Gray et al. (2007) which uses a contingent claims approach to measure, analyze and manage sovereign credit risk. In this analysis, the sectors of a national economy are viewed as interconnected portfolios of assets, liabilities and guarantees, and the equity of the sovereign balance sheet is measured by the junior claims, whose value is derived from sovereign assets. They explain that risky debt, base money and local currency debt, serve as the best proxy for the sovereign “shares”. Both papers use Merton (1974) as a framework.
Gapen et al. (2008) develop a structural credit risk model where the volatility of sovereign assets becomes a major factor in determining a country's default risk. However, to our knowledge, it has not been shown so far that the stock market could be a good proxy for a country's “equity”. In other words, what constitutes the liability of a country may be clear, but it is not so obvious how to measure the equity part. Some studies have used GDP of a country as a proxy for the country's equity: see, e.g., Boehmer and Megginson (1990), Reinhart and Rogoff (2010) or Hilscher and Nosbusch (2010). Alternatively, Dieckmann and Plank (2011) analyze the determinants of credit risk and use the ratio of total debt outstanding to GDP as a measure of a country's indebtedness.
Our approach to this issue will be in line with Chan-Lau and Kim (2004): we suggest that the stock market can be taken as a proxy for the evolution of the equity of a country. Corporate and sovereign credit instruments share exposure to systematic risk. From basic asset pricing analysis, the price of any asset can be expressed as the asset's payoffs discounted by an appropriate stochastic discount factor (SDF hereafter). All risk corrections necessary for the pricing of assets should be incorporated into the SDF. In the most popular pricing model, the consumption-CAPM, the SDF is related to the growth in marginal utility of consumption but general linear factor pricing models have become a popular alternative, where the SDF is expressed as a (linear) function of a set of risk factors. The challenge of these models is to find the factors that measure consumption risk or other sources of aggregate marginal utility growth (aggregate risks).
This asset pricing rationale allows us to connect the sovereign credit market and the stock market. Roll and Ross (1980), Chen et al. (1986) and Bansal et al. (2005) have documented the relationship of consumption to returns, interest rates, growth in GDP, and other macroeconomic variables, all of which measure in one way or another the risks associated to the state of the economy. As Chen et al. (1986) state, “any systematic variables that affect the economy's pricing operator or that influence dividends would also influence stock market returns”. This pricing operator – the SDF – “also depends on the risk premium; hence, unanticipated changes in the premium will influence returns” and pricing. Then, the SDF, which lies at the core of any pricing model, becomes a key channel for the transmission of sovereign credit risk to the country's firms. News about the present and future credit quality of a country will move the risk premium of the companies operating in this country (even though some of them may not be listed in that country's stock exchange and henceforth are not accounted for in country-level data) and thus lead to an effect on stock prices. News about deteriorating credit quality will raise the risk premium and lower prices. Furthermore, as was pointed out in Coronado et al. (2011), the credit risk problem can also be transmitted into prices through the asset's payoff. If countries devote increasing parts of their revenues toward external debt, governments will have little money left over for investment, thus deteriorating future growth. Consumers and firms become hard-pressed with taxes levied in order to pay the debt, so consumption and investment drop, leading to declining profits and expected payoffs. The sovereign credit risk problem becomes a generalized market risk. A vicious circle could be generated since declining firms’ equity could affect solvency and reinforce the problem. In the above situations, the private sector will absorb the sovereign credit risk in what we could call a public-to-private risk transfer.
The above arguments work also in the opposite direction, i.e., a worsening situation in the country's companies must affect the credit quality of that country – we have witnessed this risk transfer in the context of the 2008 subprime crisis –, while improvements in the firms’ financial situation contribute to a better credit quality for the country overall. This would reflect a private-to-public risk transfer.
Our analysis in this paper is, therefore, in the spirit of Dieckmann and Plank (2011). These authors analyzed 18 advanced economies from 2007 to 2010 and found that the state of a country's domestic financial system has strong explanatory power of the behavior of CDS spreads, suggesting a private-to-public risk transfer. A similar result is found by Ang and Longstaff (2011) with a sample ending on January 2011. Ejsing and Lemke (2010) document linkages between CDSs of Euro area banks and their governments’ CDSs, also suggesting a private-to-public risk transfer. Overall, these results point at governments absorbing the risks of the private sector during the 2007–2008 crisis. We extend these analyses and suggest the possibility of a two-way risk transfer.4 We hypothesize a possible reverse channel in which a worsening public debt could lead to a lower overall value of the firms, which could be reflected in both the debt and equity components. We test this hypothesis examining whether the evolution of sovereign CDSs was translated to the stock market. Stock markets should reflect more generally the spread of sovereign risk into the private economy than the markets of liquid corporate CDSs, which are in many cases scarce and mostly limited to the financial sector.
The following sections contain our analysis of the relationships between bond, CDS and stock markets, although we place some emphasis on the latter two.
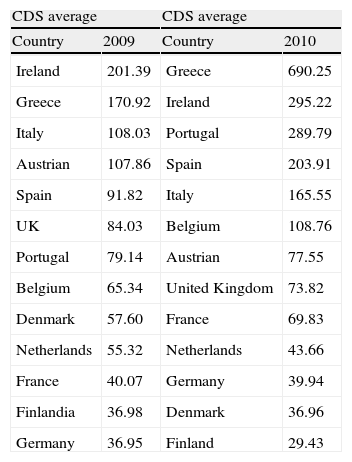
3An exploratory look at the dataWe use daily data of the closing prices of the 5-year sovereign CDS spreads, the 5-year government bond spreads and of stock indexes. Data come from Bloomberg and were supplied by Credit Market Analytics (CMA) Data Vision. The benchmark maturity of sovereign CDSs tends to be five years, though contracts of 10-year maturity are also available. We use the mid-points between quoted bid and ask points for the 5-year maturity CDS denominated in USD, which is the standard currency in this market.5 Our sample contains data for thirteen European countries: Spain, Portugal, Italy, France, Ireland, United Kingdom, Greece, Germany, Austrian, Belgium, Netherlands, Finland and Denmark. The sample covers a period similar to those in Gündüz and Kaya (2012) and Fontana and Scheicher (2010), who focus on smaller sets of countries. Our choice of countries is determined by the need to have a set of risky countries (i.e. countries with a high CDS premium), in order to document how the relationship between stocks and CDSs has behaved during and before the 2010 turmoil, and a subset of safer countries (i.e. countries with low risk premium) to use as a sort of control. The two subsamples are described in Table 1b.
As a proxy for the stock market in each economy we use daily closing prices of the country's main stock index: IBEX-35 (Spain), PSI-20 (Portugal), FTSEMIB (Italy), CAC-40 (France), ISEQ-20 (Ireland), FTSE-100 (United Kingdom), FTSE Athex-20 (Greece), DAX (Germany), WBI (Austrian), BEL-20 (Belgium), AEX (Netherlands), HEX (Finland) and KFX (Denmark).
Since we are especially interested in looking at the stability of the co-movement between bonds, CDSs and stock markets and at the hypothesized change in the direction of the risk transfer, our sample starts in January 2008 and ends in June 2012, covering the subprime crisis (2008–2009), the initial sovereign-debt crisis (2010) and the final years 2011–2012.
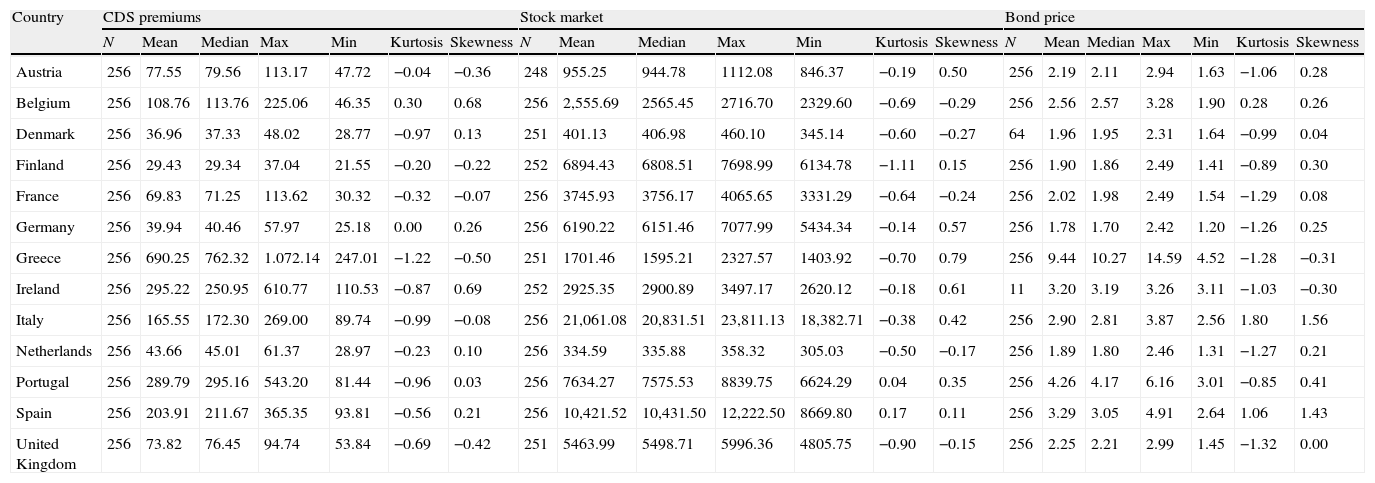
Table 1a shows descriptive statistics in basis points for each country's CDS, bond and the stock market index. There is a wide dispersion within the sample: in 2010, the lowest CDS average spread was 29.43 basis points (bp) for Finland and the highest one was 690.25bp for Greece. In that same year, the lowest average bond spread was 1.78bp and 1.89bp for Germany and Netherlands, respectively, whereas the highest spread was 9.44bp for Greece.
Descriptive statistics.
| Country | CDS premiums | Stock market | Bond price | ||||||||||||||||||
| N | Mean | Median | Max | Min | Kurtosis | Skewness | N | Mean | Median | Max | Min | Kurtosis | Skewness | N | Mean | Median | Max | Min | Kurtosis | Skewness | |
| Austria | 256 | 77.55 | 79.56 | 113.17 | 47.72 | −0.04 | −0.36 | 248 | 955.25 | 944.78 | 1112.08 | 846.37 | −0.19 | 0.50 | 256 | 2.19 | 2.11 | 2.94 | 1.63 | −1.06 | 0.28 |
| Belgium | 256 | 108.76 | 113.76 | 225.06 | 46.35 | 0.30 | 0.68 | 256 | 2,555.69 | 2565.45 | 2716.70 | 2329.60 | −0.69 | −0.29 | 256 | 2.56 | 2.57 | 3.28 | 1.90 | 0.28 | 0.26 |
| Denmark | 256 | 36.96 | 37.33 | 48.02 | 28.77 | −0.97 | 0.13 | 251 | 401.13 | 406.98 | 460.10 | 345.14 | −0.60 | −0.27 | 64 | 1.96 | 1.95 | 2.31 | 1.64 | −0.99 | 0.04 |
| Finland | 256 | 29.43 | 29.34 | 37.04 | 21.55 | −0.20 | −0.22 | 252 | 6894.43 | 6808.51 | 7698.99 | 6134.78 | −1.11 | 0.15 | 256 | 1.90 | 1.86 | 2.49 | 1.41 | −0.89 | 0.30 |
| France | 256 | 69.83 | 71.25 | 113.62 | 30.32 | −0.32 | −0.07 | 256 | 3745.93 | 3756.17 | 4065.65 | 3331.29 | −0.64 | −0.24 | 256 | 2.02 | 1.98 | 2.49 | 1.54 | −1.29 | 0.08 |
| Germany | 256 | 39.94 | 40.46 | 57.97 | 25.18 | 0.00 | 0.26 | 256 | 6190.22 | 6151.46 | 7077.99 | 5434.34 | −0.14 | 0.57 | 256 | 1.78 | 1.70 | 2.42 | 1.20 | −1.26 | 0.25 |
| Greece | 256 | 690.25 | 762.32 | 1.072.14 | 247.01 | −1.22 | −0.50 | 251 | 1701.46 | 1595.21 | 2327.57 | 1403.92 | −0.70 | 0.79 | 256 | 9.44 | 10.27 | 14.59 | 4.52 | −1.28 | −0.31 |
| Ireland | 256 | 295.22 | 250.95 | 610.77 | 110.53 | −0.87 | 0.69 | 252 | 2925.35 | 2900.89 | 3497.17 | 2620.12 | −0.18 | 0.61 | 11 | 3.20 | 3.19 | 3.26 | 3.11 | −1.03 | −0.30 |
| Italy | 256 | 165.55 | 172.30 | 269.00 | 89.74 | −0.99 | −0.08 | 256 | 21,061.08 | 20,831.51 | 23,811.13 | 18,382.71 | −0.38 | 0.42 | 256 | 2.90 | 2.81 | 3.87 | 2.56 | 1.80 | 1.56 |
| Netherlands | 256 | 43.66 | 45.01 | 61.37 | 28.97 | −0.23 | 0.10 | 256 | 334.59 | 335.88 | 358.32 | 305.03 | −0.50 | −0.17 | 256 | 1.89 | 1.80 | 2.46 | 1.31 | −1.27 | 0.21 |
| Portugal | 256 | 289.79 | 295.16 | 543.20 | 81.44 | −0.96 | 0.03 | 256 | 7634.27 | 7575.53 | 8839.75 | 6624.29 | 0.04 | 0.35 | 256 | 4.26 | 4.17 | 6.16 | 3.01 | −0.85 | 0.41 |
| Spain | 256 | 203.91 | 211.67 | 365.35 | 93.81 | −0.56 | 0.21 | 256 | 10,421.52 | 10,431.50 | 12,222.50 | 8669.80 | 0.17 | 0.11 | 256 | 3.29 | 3.05 | 4.91 | 2.64 | 1.06 | 1.43 |
| United Kingdom | 256 | 73.82 | 76.45 | 94.74 | 53.84 | −0.69 | −0.42 | 251 | 5463.99 | 5498.71 | 5996.36 | 4805.75 | −0.90 | −0.15 | 256 | 2.25 | 2.21 | 2.99 | 1.45 | −1.32 | 0.00 |
The main descriptive statistics for the thirteen countries in our sample are reported. Data included are only observations from 2010. Variables included are: CDS (sovereign CDS premium), stock index and bond price.
Average CDS premium.
| CDS average | CDS average | ||
| Country | 2009 | Country | 2010 |
| Ireland | 201.39 | Greece | 690.25 |
| Greece | 170.92 | Ireland | 295.22 |
| Italy | 108.03 | Portugal | 289.79 |
| Austrian | 107.86 | Spain | 203.91 |
| Spain | 91.82 | Italy | 165.55 |
| UK | 84.03 | Belgium | 108.76 |
| Portugal | 79.14 | Austrian | 77.55 |
| Belgium | 65.34 | United Kingdom | 73.82 |
| Denmark | 57.60 | France | 69.83 |
| Netherlands | 55.32 | Netherlands | 43.66 |
| France | 40.07 | Germany | 39.94 |
| Finlandia | 36.98 | Denmark | 36.96 |
| Germany | 36.95 | Finland | 29.43 |
| CDS average | CDS average | ||
| Country | 2011 | Country | 2012 |
| Greece | 2108.37 | Greece | 3535.66 |
| Portugal | 813.79 | Portugal | 1143.40 |
| Ireland | 709.32 | Ireland | 628.63 |
| Spain | 319.77 | Spain | 456.45 |
| Italy | 302.65 | Italy | 450.56 |
| Belgium | 215.31 | Belgium | 257.23 |
| France | 129.37 | France | 193.12 |
| Austrian | 110.59 | Austrian | 177.17 |
| Denmark | 74.06 | Denmark | 124.28 |
| UK | 73.03 | Netherlands | 113.18 |
| Netherlands | 66.97 | Germany | 89.02 |
| Germany | 66.79 | Finlandia | 73.89 |
| Finlandia | 49.77 | UK | 73.33 |
CDS average premiums for each country in 2010 are reported. This justifies our pooling of the countries into two groups in the panel analysis: European countries with lower spreads (CDS average premium below 100bp) and European countries with higher spreads (CDS average premium above 100bp).
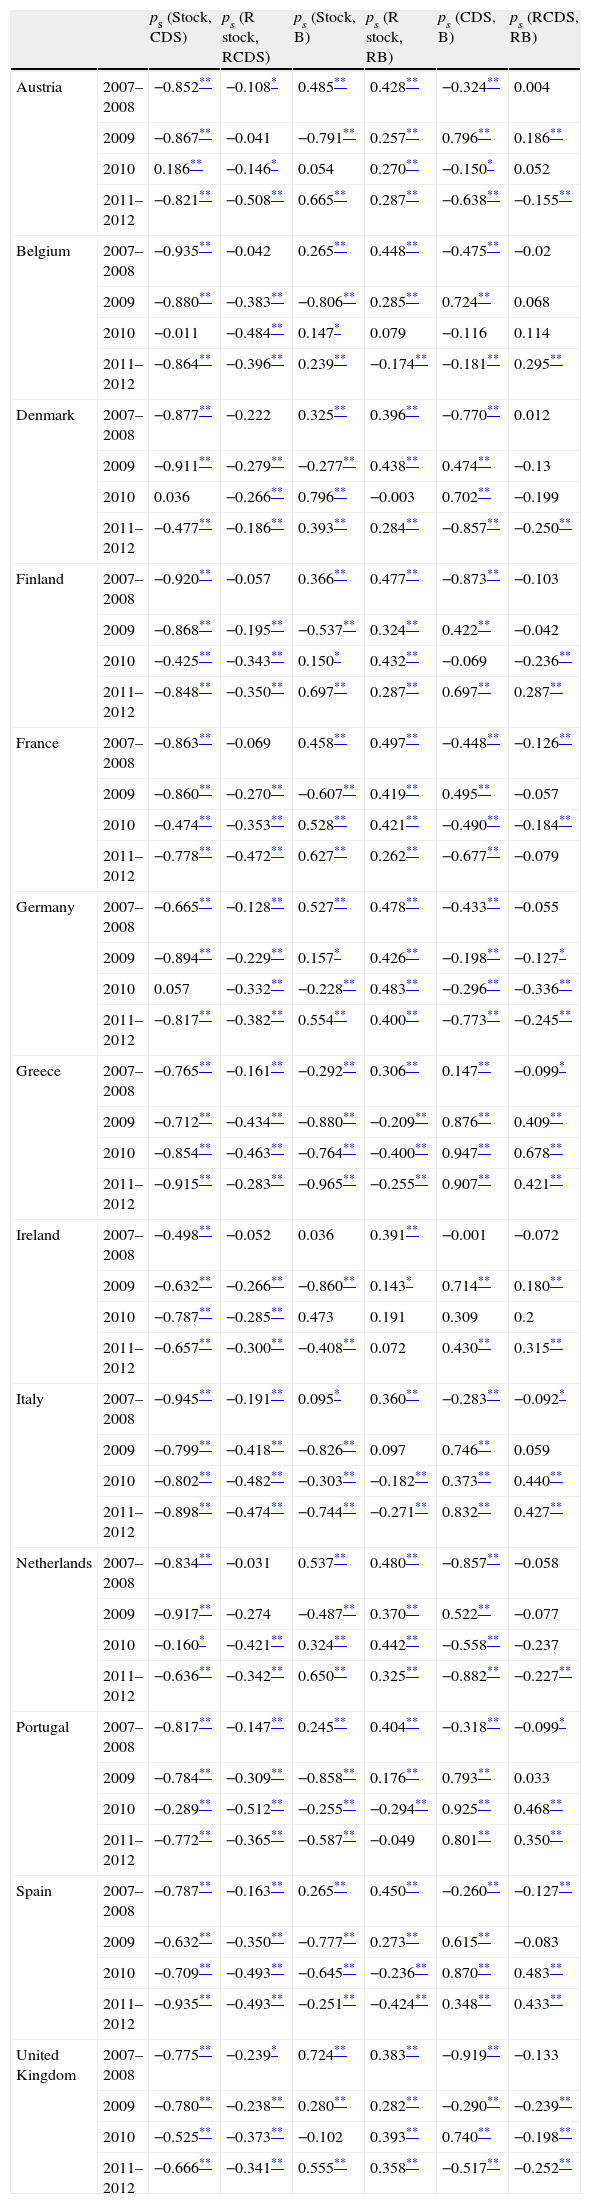
Table 2 reports Spearman pairwise rank correlations between the stock index, the sovereign CDS and the bond spreads of daily time-series at a country-level. We look at levels as well as percentage changes. Stock indexes and sovereign CDSs are negatively correlated, consistent with the pattern observed in the previous figures. Despite this result, we observe that the lower correlations take place in 2010 for all countries except Spain, Italy, Ireland and Greece.
Contemporaneous correlation of country specific time-series.
| ps (Stock, CDS) | ps (R stock, RCDS) | ps (Stock, B) | ps (R stock, RB) | ps (CDS, B) | ps (RCDS, RB) | ||
| Austria | 2007–2008 | −0.852** | −0.108* | 0.485** | 0.428** | −0.324** | 0.004 |
| 2009 | −0.867** | −0.041 | −0.791** | 0.257** | 0.796** | 0.186** | |
| 2010 | 0.186** | −0.146* | 0.054 | 0.270** | −0.150* | 0.052 | |
| 2011–2012 | −0.821** | −0.508** | 0.665** | 0.287** | −0.638** | −0.155** | |
| Belgium | 2007–2008 | −0.935** | −0.042 | 0.265** | 0.448** | −0.475** | −0.02 |
| 2009 | −0.880** | −0.383** | −0.806** | 0.285** | 0.724** | 0.068 | |
| 2010 | −0.011 | −0.484** | 0.147* | 0.079 | −0.116 | 0.114 | |
| 2011–2012 | −0.864** | −0.396** | 0.239** | −0.174** | −0.181** | 0.295** | |
| Denmark | 2007–2008 | −0.877** | −0.222 | 0.325** | 0.396** | −0.770** | 0.012 |
| 2009 | −0.911** | −0.279** | −0.277** | 0.438** | 0.474** | −0.13 | |
| 2010 | 0.036 | −0.266** | 0.796** | −0.003 | 0.702** | −0.199 | |
| 2011–2012 | −0.477** | −0.186** | 0.393** | 0.284** | −0.857** | −0.250** | |
| Finland | 2007–2008 | −0.920** | −0.057 | 0.366** | 0.477** | −0.873** | −0.103 |
| 2009 | −0.868** | −0.195** | −0.537** | 0.324** | 0.422** | −0.042 | |
| 2010 | −0.425** | −0.343** | 0.150* | 0.432** | −0.069 | −0.236** | |
| 2011–2012 | −0.848** | −0.350** | 0.697** | 0.287** | 0.697** | 0.287** | |
| France | 2007–2008 | −0.863** | −0.069 | 0.458** | 0.497** | −0.448** | −0.126** |
| 2009 | −0.860** | −0.270** | −0.607** | 0.419** | 0.495** | −0.057 | |
| 2010 | −0.474** | −0.353** | 0.528** | 0.421** | −0.490** | −0.184** | |
| 2011–2012 | −0.778** | −0.472** | 0.627** | 0.262** | −0.677** | −0.079 | |
| Germany | 2007–2008 | −0.665** | −0.128** | 0.527** | 0.478** | −0.433** | −0.055 |
| 2009 | −0.894** | −0.229** | 0.157* | 0.426** | −0.198** | −0.127* | |
| 2010 | 0.057 | −0.332** | −0.228** | 0.483** | −0.296** | −0.336** | |
| 2011–2012 | −0.817** | −0.382** | 0.554** | 0.400** | −0.773** | −0.245** | |
| Greece | 2007–2008 | −0.765** | −0.161** | −0.292** | 0.306** | 0.147** | −0.099* |
| 2009 | −0.712** | −0.434** | −0.880** | −0.209** | 0.876** | 0.409** | |
| 2010 | −0.854** | −0.463** | −0.764** | −0.400** | 0.947** | 0.678** | |
| 2011–2012 | −0.915** | −0.283** | −0.965** | −0.255** | 0.907** | 0.421** | |
| Ireland | 2007–2008 | −0.498** | −0.052 | 0.036 | 0.391** | −0.001 | −0.072 |
| 2009 | −0.632** | −0.266** | −0.860** | 0.143* | 0.714** | 0.180** | |
| 2010 | −0.787** | −0.285** | 0.473 | 0.191 | 0.309 | 0.2 | |
| 2011–2012 | −0.657** | −0.300** | −0.408** | 0.072 | 0.430** | 0.315** | |
| Italy | 2007–2008 | −0.945** | −0.191** | 0.095* | 0.360** | −0.283** | −0.092* |
| 2009 | −0.799** | −0.418** | −0.826** | 0.097 | 0.746** | 0.059 | |
| 2010 | −0.802** | −0.482** | −0.303** | −0.182** | 0.373** | 0.440** | |
| 2011–2012 | −0.898** | −0.474** | −0.744** | −0.271** | 0.832** | 0.427** | |
| Netherlands | 2007–2008 | −0.834** | −0.031 | 0.537** | 0.480** | −0.857** | −0.058 |
| 2009 | −0.917** | −0.274 | −0.487** | 0.370** | 0.522** | −0.077 | |
| 2010 | −0.160* | −0.421** | 0.324** | 0.442** | −0.558** | −0.237 | |
| 2011–2012 | −0.636** | −0.342** | 0.650** | 0.325** | −0.882** | −0.227** | |
| Portugal | 2007–2008 | −0.817** | −0.147** | 0.245** | 0.404** | −0.318** | −0.099* |
| 2009 | −0.784** | −0.309** | −0.858** | 0.176** | 0.793** | 0.033 | |
| 2010 | −0.289** | −0.512** | −0.255** | −0.294** | 0.925** | 0.468** | |
| 2011–2012 | −0.772** | −0.365** | −0.587** | −0.049 | 0.801** | 0.350** | |
| Spain | 2007–2008 | −0.787** | −0.163** | 0.265** | 0.450** | −0.260** | −0.127** |
| 2009 | −0.632** | −0.350** | −0.777** | 0.273** | 0.615** | −0.083 | |
| 2010 | −0.709** | −0.493** | −0.645** | −0.236** | 0.870** | 0.483** | |
| 2011–2012 | −0.935** | −0.493** | −0.251** | −0.424** | 0.348** | 0.433** | |
| United Kingdom | 2007–2008 | −0.775** | −0.239* | 0.724** | 0.383** | −0.919** | −0.133 |
| 2009 | −0.780** | −0.238** | 0.280** | 0.282** | −0.290** | −0.239** | |
| 2010 | −0.525** | −0.373** | −0.102 | 0.393** | 0.740** | −0.198** | |
| 2011–2012 | −0.666** | −0.341** | 0.555** | 0.358** | −0.517** | −0.252** |
We report Spearman's rank correlation coefficients ρ, calculated for pairs of country-specific time series (years 2008, 2009, 2010 and 2011–2012; R Stock: return on the stock index; RB and RCDS: bond yield return and CDS spread return, respectively.
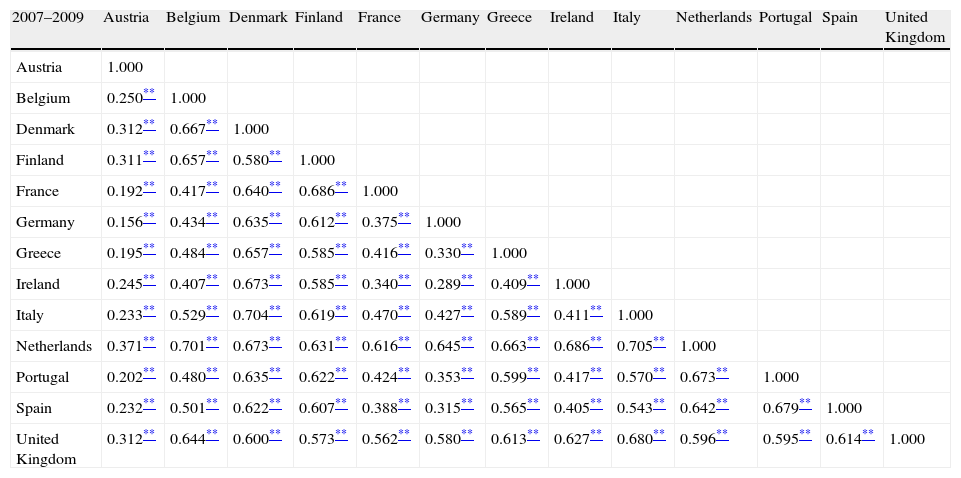
Table 3 shows the pairwise rank correlations between pairs of sovereign CDS spreads. In line with Lonstaff et al. (2011), we find that many of these correlations of sovereign credit spreads are large and positive and they increase during crisis periods. For example, the correlation between Italy and Belgium is 0.87 and the correlation between Italy and Spain is 0.86 for 2011/2012. The average correlation is about 0.51 for the 2007–2009 sample period, 0.61 in 2010 and 0.66 in 2011/2012.
Correlation matrix of sovereign CDS spread changes.
| 2007–2009 | Austria | Belgium | Denmark | Finland | France | Germany | Greece | Ireland | Italy | Netherlands | Portugal | Spain | United Kingdom |
| Austria | 1.000 | ||||||||||||
| Belgium | 0.250** | 1.000 | |||||||||||
| Denmark | 0.312** | 0.667** | 1.000 | ||||||||||
| Finland | 0.311** | 0.657** | 0.580** | 1.000 | |||||||||
| France | 0.192** | 0.417** | 0.640** | 0.686** | 1.000 | ||||||||
| Germany | 0.156** | 0.434** | 0.635** | 0.612** | 0.375** | 1.000 | |||||||
| Greece | 0.195** | 0.484** | 0.657** | 0.585** | 0.416** | 0.330** | 1.000 | ||||||
| Ireland | 0.245** | 0.407** | 0.673** | 0.585** | 0.340** | 0.289** | 0.409** | 1.000 | |||||
| Italy | 0.233** | 0.529** | 0.704** | 0.619** | 0.470** | 0.427** | 0.589** | 0.411** | 1.000 | ||||
| Netherlands | 0.371** | 0.701** | 0.673** | 0.631** | 0.616** | 0.645** | 0.663** | 0.686** | 0.705** | 1.000 | |||
| Portugal | 0.202** | 0.480** | 0.635** | 0.622** | 0.424** | 0.353** | 0.599** | 0.417** | 0.570** | 0.673** | 1.000 | ||
| Spain | 0.232** | 0.501** | 0.622** | 0.607** | 0.388** | 0.315** | 0.565** | 0.405** | 0.543** | 0.642** | 0.679** | 1.000 | |
| United Kingdom | 0.312** | 0.644** | 0.600** | 0.573** | 0.562** | 0.580** | 0.613** | 0.627** | 0.680** | 0.596** | 0.595** | 0.614** | 1.000 |
| 2010 | Austria | Belgium | Denmark | Finland | France | Germany | Greece | Ireland | Italy | Netherlands | Portugal | Spain | United Kingdom |
| Austria | 1.000 | ||||||||||||
| Belgium | 0.257** | 1.000 | |||||||||||
| Denmark | 0.265** | 0.728** | 1.000 | ||||||||||
| Finland | 0.244** | 0.685** | 0.771** | 1.000 | |||||||||
| France | 0.236** | 0.692** | 0.684** | 0.631** | 1.000 | ||||||||
| Germany | 0.285** | 0.698** | 0.790** | 0.711** | 0.715** | 1.000 | |||||||
| Greece | 0.155* | 0.673** | 0.635** | 0.621** | 0.589** | 0.602** | 1.000 | ||||||
| Ireland | 0.136* | 0.731** | 0.663** | 0.612** | 0.589** | 0.597** | 0.702** | 1.000 | |||||
| Italy | 0.217** | 0.762** | 0.733** | 0.660** | 0.637** | 0.663** | 0.683** | 0.752** | 1.000 | ||||
| Netherlands | 0.251** | 0.717** | 0.779** | 0.674** | 0.650** | 0.719** | 0.607** | 0.629** | 0.707** | 1.000 | |||
| Portugal | 0.242** | 0.770** | 0.717** | 0.669** | 0.699** | 0.727** | 0.719** | 0.790** | 0.791** | 0.698** | |||
| Spain | 0.146* | 0.739** | 0.686** | 0.651** | 0.678** | 0.664** | 0.707** | 0.753** | 0.787** | 0.649** | 0.810** | 1.000 | |
| United Kingdom | 0.175** | 0.738** | 0.638** | 0.601** | 0.550** | 0.569** | 0.562** | 0.625** | 0.715** | 0.622** | 0.645** | 0.622** | 1.000 |
| 2011–2012 | Austria | Belgium | Denmark | Finland | France | Germany | Greece | Ireland | Italy | Netherlands | Portugal | Spain | Kingdom |
| Austria | 1.000 | ||||||||||||
| Belgium | 0.826** | 1.000 | |||||||||||
| Denmark | 0.717** | 0.713** | 1.000 | ||||||||||
| Finland | 0.714** | 0.711** | 0.707** | 1.000 | |||||||||
| France | 0.856** | 0.813** | 0.688** | 0.723** | 1.000 | ||||||||
| Germany | 0.805** | 0.749** | 0.666** | 0.687** | 0.814** | 1.000 | |||||||
| Greece | 0.296** | 0.420** | 0.252** | 0.264** | 0.316** | 0.267** | 1.000 | ||||||
| Ireland | 0.630** | 0.707** | 0.578** | 0.564** | 0.641** | 0.614** | 0.394** | 1.000 | |||||
| Italy | 0.760** | 0.867** | 0.690** | 0.683** | 0.768** | 0.694** | 0.396** | 0.679** | 1.000 | ||||
| Netherlands | 0.760** | 0.762** | 0.751** | 0.725** | 0.768** | 0.790** | 0.303** | 0.619** | 0.729** | 1.000 | |||
| Portugal | 0.530** | 0.628** | 0.442** | 0.438** | 0.543** | 0.459** | 0.419** | 0.720** | 0.608** | 0.474** | 1.000 | ||
| Spain | 0.763** | 0.820** | 0.633** | 0.620** | 0.739** | 0.665** | 0.395** | 0.710** | 0.853** | 0.656** | 0.637** | 1.000 | |
| United Kingdom | 0.778** | 0.761** | 0.650** | 0.649** | 0.773** | 0.783** | 0.320** | 0.590** | 0.716** | 0.724** | 0.504** | 0.680** | 1.000 |
This table reports the pairwise correlation coefficients of the sovereign CDS returns for the indicated countries.
The prices (levels) of these three markets do not obey an equilibrium or long-run relationship. In time-series terms, they are not cointegrated variables. Therefore a Vector Error Correction Model (VECM) representation is not appropriate and a traditional price discovery process similar to that in, e.g., Forte and Peña (2009) is not directly applicable.6 Instead, we use a rolling VAR framework to study the co-movement between the three markets. Previous literature (Merton et al., 2013; Gray et al., 2007; Longstaff, 2010; Lonstaff et al., 2011; Blanco et al., 2005; and Norden and Weber, 2009) shows that the VAR model is appropriate for the analysis of the co-movement of markets because it captures lead-lag relationships within and between stationary variables in a simultaneous multivariate framework.7
We estimate the following three-dimensional VAR:
where Rt is the stock index return in period t, RCDSt is the sovereign CDS spread return in period t and RBt is the sovereign bond yield return in period t. The lag order of the VAR is p and ¿it is the innovation in market i in period t. The lag structure and the maximum lag order p have been determined using the SIC criteria. Besides, we implement a Lagrange-Multiplier test in order to check that there is no autocorrelation in the residuals at the lag order selected.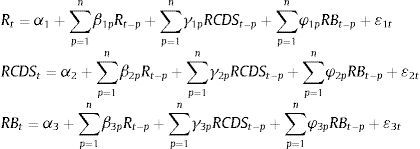
We study how the relationships between the three assets have evolved over time, both before and during the financial crisis, by estimating Eq. (1) country by country by means of a rolling VAR. We estimate each VAR with daily observations over a 6-month time frame, the rolling window being one month. The first estimation contains data from January 2008 to June 2008, and the last estimation includes data from January 2011 to June 2012. There are a total of 49 estimations of the model for each country.
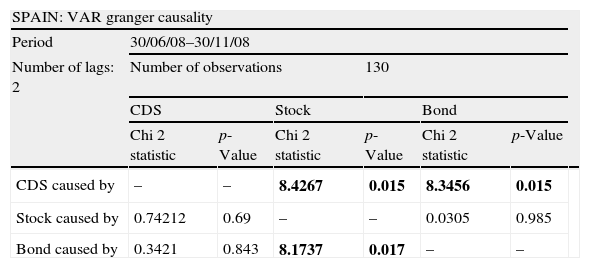
We highlight the main lead–lag relationships and we detail the period in which they take place. Lead–lag relationships are established on the basis of Granger causality. We report periods when the p-value for the Granger causality test (GC) is larger than 5%, and when the direction and significance of the relationship is maintained during more than 4 consecutive rolling periods. To illustrate how these periods have been selected we report more detailed results for Spain as an example in Table 4a.
p-Values from the Spanish 6-month rolling VAR. In bold are shown significant p-values at 5% level.
| SPAIN: VAR granger causality | |||||||
| Period | 30/06/08–30/11/08 | ||||||
| Number of lags: 2 | Number of observations | 130 | |||||
| CDS | Stock | Bond | |||||
| Chi 2 statistic | p-Value | Chi 2 statistic | p-Value | Chi 2 statistic | p-Value | ||
| CDS caused by | – | – | 8.4267 | 0.015 | 8.3456 | 0.015 | |
| Stock caused by | 0.74212 | 0.69 | – | – | 0.0305 | 0.985 | |
| Bond caused by | 0.3421 | 0.843 | 8.1737 | 0.017 | – | – | |
| Period | 31/03/10–31/08/10 | ||||||
| Number of lags: 2 | Number of observations: | 130 | |||||
| CDS | Stock | Bond | |||||
| Chi 2 statistic | p-Value | Chi 2 statistic | p-Value | Chi 2 statistic | p-Value | ||
| CDS caused by | – | – | 2.5459 | 0.28 | 2.2845 | 0.319 | |
| Stock caused by | 14.253 | 0.001 | – | – | 0.365 | 0.833 | |
| Bond caused by | 12.684 | 0.002 | 12.684 | 0.002 | – | – | |
| Period | 30/09/11–29/02/12 | ||||||
| Number of lags: 2 | Number of observations: | 128 | |||||
| CDS | Stock | Bond | |||||
| Chi 2 statistic | p-Value | Chi 2 statistic | p-Value | Chi 2 statistic | p-Value | ||
| CDS caused by | – | – | 7.3762 | 0.025 | 8.009 | 0.018 | |
| Stock caused by | 2.6284 | 0.269 | – | – | 1.768 | 0.413 | |
| Bond caused by | 1.508 | 0.47 | 3.203 | 0.202 | – | – | |
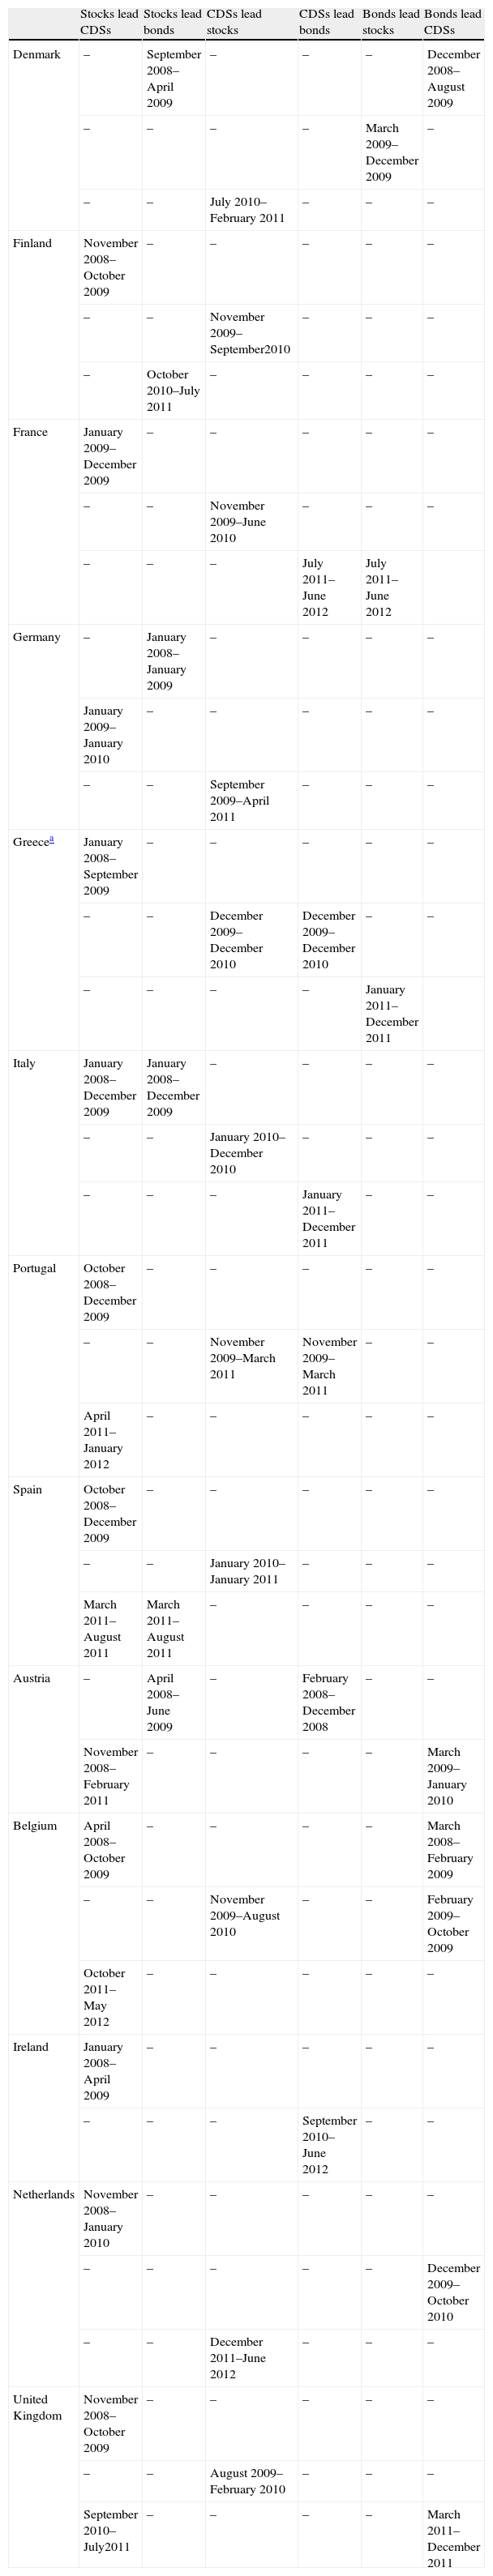
In most countries, stock markets took a leading role in 2008 with respect to the bond and CDS markets. This relationship started early in 2008 for some countries, as in the cases of Greece, Italy, Austria, Belgium, Ireland, later during 2008 for others such us Finland, Portugal, Spain, Netherlands, UK, and in January 2009 for France and Germany. This leadership role lasted until the end of 2009 or the beginning of 2010, depending on the cases. This result can be observed for all thirteen countries in the sample, the sole exception being Denmark, where we instead find that stocks lead sovereign bonds. These findings are consistent with a transmission of information from the private sector (stocks) to the public sector (CDS), or a private-to-public risk transfer that has already been commented on and found by other authors (e.g., Dieckmann and Plank, 2011). Due to space restrictions in Table 4b we present the main results in a schematic manner.8
Main results from the 6-month rolling VAR. Periods when the p-value of the Granger causality test is 5% or less and when the relationship is maintained at less during 4 consecutive rolling periods, are reported.
| Stocks lead CDSs | Stocks lead bonds | CDSs lead stocks | CDSs lead bonds | Bonds lead stocks | Bonds lead CDSs | |
| Denmark | – | September 2008–April 2009 | – | – | – | December 2008–August 2009 |
| – | – | – | – | March 2009–December 2009 | – | |
| – | – | July 2010–February 2011 | – | – | – | |
| Finland | November 2008–October 2009 | – | – | – | – | – |
| – | – | November 2009–September2010 | – | – | – | |
| – | October 2010–July 2011 | – | – | – | – | |
| France | January 2009–December 2009 | – | – | – | – | – |
| – | – | November 2009–June 2010 | – | – | – | |
| – | – | – | July 2011–June 2012 | July 2011–June 2012 | ||
| Germany | – | January 2008–January 2009 | – | – | – | – |
| January 2009–January 2010 | – | – | – | – | – | |
| – | – | September 2009–April 2011 | – | – | – | |
| Greecea | January 2008–September 2009 | – | – | – | – | – |
| – | – | December 2009–December 2010 | December 2009–December 2010 | – | – | |
| – | – | – | – | January 2011–December 2011 | ||
| Italy | January 2008–December 2009 | January 2008–December 2009 | – | – | – | – |
| – | – | January 2010–December 2010 | – | – | – | |
| – | – | – | January 2011–December 2011 | – | – | |
| Portugal | October 2008–December 2009 | – | – | – | – | – |
| – | – | November 2009–March 2011 | November 2009–March 2011 | – | – | |
| April 2011–January 2012 | – | – | – | – | – | |
| Spain | October 2008–December 2009 | – | – | – | – | – |
| – | – | January 2010–January 2011 | – | – | – | |
| March 2011–August 2011 | March 2011–August 2011 | – | – | – | – | |
| Austria | – | April 2008–June 2009 | – | February 2008–December 2008 | – | – |
| November 2008–February 2011 | – | – | – | – | March 2009–January 2010 | |
| Belgium | April 2008–October 2009 | – | – | – | – | March 2008–February 2009 |
| – | – | November 2009–August 2010 | – | – | February 2009–October 2009 | |
| October 2011–May 2012 | – | – | – | – | – | |
| Ireland | January 2008–April 2009 | – | – | – | – | – |
| – | – | – | September 2010–June 2012 | – | – | |
| Netherlands | November 2008–January 2010 | – | – | – | – | – |
| – | – | – | – | – | December 2009–October 2010 | |
| – | – | December 2011–June 2012 | – | – | – | |
| United Kingdom | November 2008–October 2009 | – | – | – | – | – |
| – | – | August 2009–February 2010 | – | – | – | |
| September 2010–July2011 | – | – | – | – | March 2011–December 2011 |
As the year 2010 progressed, the leading role of the stock market disappeared. During this year, sovereign debt attracted all the attention and relegated the stock market to a secondary role. As the results in Table 4b show, it was indeed the CDS markets that took on the leading role with respect to stock markets in Denmark, Finland, France, Germany, Spain, Greece, Portugal, Italy, Belgium, UK. We find no obvious relationship in Austria, the Netherlands, and Ireland. Besides the expected negative sign relating the CDSs and the stock market, we find that the magnitude of the coefficients associated with CDSs also grew noticeably during 2010.
With respect to the link between CDS and bond markets, and following the discussion of Blanco et al. (2005), we suggest that CDS markets benefit from being the easiest venue in which to trade credit risk. They do not suffer from short-sales constraints and trading large quantities of credit risk is possible. Furthermore, participants hedging loan and counterparty exposures are able to do so in the CDS market, whereas they cannot do so in the bond market. Along this line, a report by ISDA (2010) points to this role of sovereign CDS markets. Sovereign CDSs provide effective hedges not only for holders of government bonds but also for international banks that extend credit to that particular country's corporations and banks, for investors in stocks and for entities that have significant real estate or corporate holdings in the country. For many of these participants, the sovereign CDS acts as proxy hedge for credit risk in the country. Implicit in this reasoning is the fact that there is a broad set of investors using sovereign CDSs, and it is this concentration of liquidity which gives CDS markets the lead over bond markets. Indeed, we find that in Greece, Portugal and Ireland – probably the countries with the most relevant sovereign risk in our sample – CDSs led the bond market during the sovereign crisis. For Austria, Belgium, Denmark and Netherlands the opposite seems to be true and the bond market leads the CDSs (note that these four countries did not have high credit risk), but only for Denmark lead both CDSs and stock markets. Altogether, during this period bond markets seemed to be lagging (as in Blanco et al., 2005; Forte and Peña, 2009).
The previous picture changed during 2011. In 2011, lead–lag relationships became less intense and we do not find much evidence of Granger causality. The movement in the three markets becomes more synchronized than in previous years and in many cases the information appears to be embedded into prices at the same time. We can observe a comeback of the leading role for the stock markets with respect to the credit market in five countries (Finland, Portugal, Spain, Belgium and UK), and we observe that the CDS remains to be the principal means of information incorporation in the Italian, Dutch and Irish cases where it leads at least one of the other two markets. Nevertheless, we find in 2011 an important role for bonds with respect to CDSs for Greece, France and the UK. These results are consistent with a drying up of liquidity in the Greek CDS market during 2011, and with the uncertainty raised in the markets during this year about the ability of ISDA to declare a sovereign credit event and consequently to the usefulness of sovereign CDS. As the seriousness of the situation in peripheral Europe, especially in Greece, was becoming obvious, sovereign bonds regained some attention – alternative approaches to hedging cash bonds are shorting government bonds or buying protection on sovereign CDX indices.
Along this sample period, reciprocal Granger causality appears during some short periods of time for a considerable number of countries, and there is evidence of a feedback process during these times. However, we have focused on commenting on the dates when the leading role of an asset class can be clearly appreciated for a majority of countries.
4.2Pooling of countries with comparable risksIt emerges from the rolling VAR estimations that there are three main sub-periods which closely match calendar years: in 2008 and 2009, we witness a leading role of the stock market and a private to public risk transfer. In 2010 CDSs take up the leadership role in a public to private risk transfer. Finally, in 2011 and 2012, we see no clear significant relationship dominate.
To provide a more complete insight into the relationships among the three markets we perform a complementary analysis pooling together countries of comparable risk. We estimate pooled VARs with the following structure:
where Rit is the stock index return of country i at time t, RCDSit is the return of the sovereign CDS spread of country i at time t, RBit is the return of the sovereign bond yield for country i at time t, p is the lag order and ¿ijt is the innovation in market j of country i at time t. Each year we pool the countries in our data into two groups according to their average CDS premiums: the first group (high risk) contains the countries with average premiums above 100bp and the second (low risk) pools the countries with risk premiums below 100bp The countries in each group are shown in Table 1b. We estimate Eq. (2) for each group and for years 2009–2012; we do not perform this analysis for year 2008 given that average CDS premiums for all countries were below 100bp. We have not included in the pools data from the UK or Denmark, since these countries have a different currency.9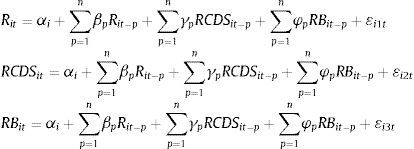
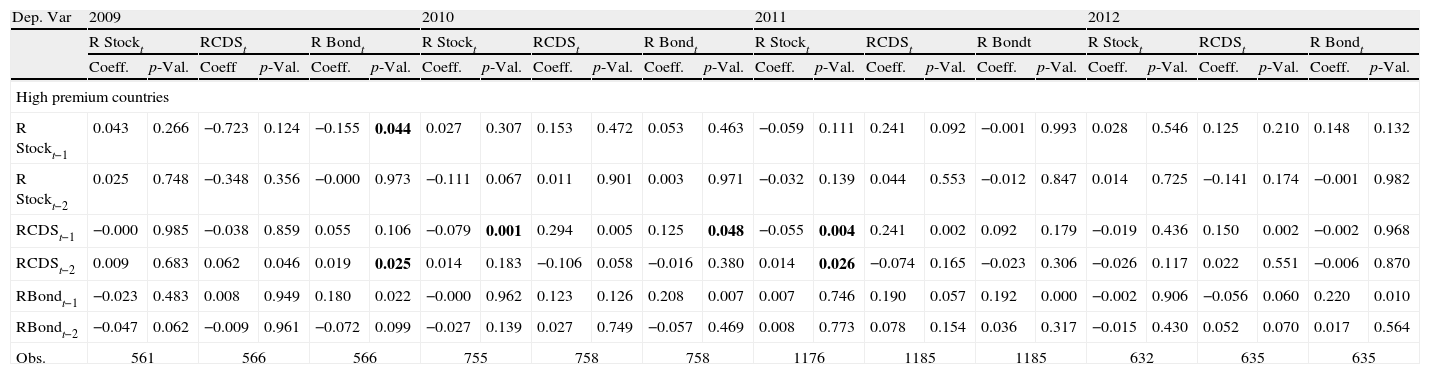
Given that our panels are “large-T”, we use traditional time series methodologies to estimate the panels. In particular, we perform a GLS estimation of the panel allowing for the error terms to be autocorrelated across time, with panel specific autocorrelation (Table 5).10
Aggregate lead-lag analysis with fixed-effect large-T panel regressions.
| Dep. Var | 2009 | 2010 | 2011 | 2012 | ||||||||||||||||||||
| R Stockt | RCDSt | R Bondt | R Stockt | RCDSt | R Bondt | R Stockt | RCDSt | R Bondt | R Stockt | RCDSt | R Bondt | |||||||||||||
| Coeff. | p-Val. | Coeff | p-Val. | Coeff. | p-Val. | Coeff. | p-Val. | Coeff. | p-Val. | Coeff. | p-Val. | Coeff. | p-Val. | Coeff. | p-Val. | Coeff. | p-Val. | Coeff. | p-Val. | Coeff. | p-Val. | Coeff. | p-Val. | |
| High premium countries | ||||||||||||||||||||||||
| R Stockt−1 | 0.043 | 0.266 | −0.723 | 0.124 | −0.155 | 0.044 | 0.027 | 0.307 | 0.153 | 0.472 | 0.053 | 0.463 | −0.059 | 0.111 | 0.241 | 0.092 | −0.001 | 0.993 | 0.028 | 0.546 | 0.125 | 0.210 | 0.148 | 0.132 |
| R Stockt−2 | 0.025 | 0.748 | −0.348 | 0.356 | −0.000 | 0.973 | −0.111 | 0.067 | 0.011 | 0.901 | 0.003 | 0.971 | −0.032 | 0.139 | 0.044 | 0.553 | −0.012 | 0.847 | 0.014 | 0.725 | −0.141 | 0.174 | −0.001 | 0.982 |
| RCDSt−1 | −0.000 | 0.985 | −0.038 | 0.859 | 0.055 | 0.106 | −0.079 | 0.001 | 0.294 | 0.005 | 0.125 | 0.048 | −0.055 | 0.004 | 0.241 | 0.002 | 0.092 | 0.179 | −0.019 | 0.436 | 0.150 | 0.002 | −0.002 | 0.968 |
| RCDSt−2 | 0.009 | 0.683 | 0.062 | 0.046 | 0.019 | 0.025 | 0.014 | 0.183 | −0.106 | 0.058 | −0.016 | 0.380 | 0.014 | 0.026 | −0.074 | 0.165 | −0.023 | 0.306 | −0.026 | 0.117 | 0.022 | 0.551 | −0.006 | 0.870 |
| RBondt−1 | −0.023 | 0.483 | 0.008 | 0.949 | 0.180 | 0.022 | −0.000 | 0.962 | 0.123 | 0.126 | 0.208 | 0.007 | 0.007 | 0.746 | 0.190 | 0.057 | 0.192 | 0.000 | −0.002 | 0.906 | −0.056 | 0.060 | 0.220 | 0.010 |
| RBondt−2 | −0.047 | 0.062 | −0.009 | 0.961 | −0.072 | 0.099 | −0.027 | 0.139 | 0.027 | 0.749 | −0.057 | 0.469 | 0.008 | 0.773 | 0.078 | 0.154 | 0.036 | 0.317 | −0.015 | 0.430 | 0.052 | 0.070 | 0.017 | 0.564 |
| Obs. | 561 | 566 | 566 | 755 | 758 | 758 | 1176 | 1185 | 1185 | 632 | 635 | 635 | ||||||||||||
| Dep. Var | 2009 | 2010 | 2011 | 2012 | ||||||||||||||||||||
| R Stockt | RCDSt | R Bondt | R Stockt | RCDSt | R Bondt | R Stockt | RCDSt | R Bondt | R Stockt | RCDSt | R Bondt | |||||||||||||
| Coeff. | p-Val. | Coeff | p-Val. | Coeff. | p-Val. | Coeff. | p-Val. | Coeff. | p-Val. | Coeff. | p-Val. | Coeff. | p-Val. | Coeff. | p-Val. | Coeff. | p-Val. | Coeff. | p-Val. | Coeff. | p-Val. | Coeff. | p-Val. | |
| Other countries | ||||||||||||||||||||||||
| R Stockt−1 | −0.007 | 0.717 | −0.869 | 0.000 | −0.163 | 0.015 | 0.191 | 0.026 | −0.439 | 0.191 | 0.091 | 0.022 | −0.015 | 0.763 | 0.058 | 0.767 | −0.478 | 0.069 | 0.027 | 0.574 | 0.115 | 0.292 | 0.128 | 0.154 |
| R Stockt−2 | 0.151 | 0.000 | −0.456 | 0.002 | 0.095 | 0.027 | −0.113 | 0.061 | 0.202 | 0.042 | −0.181 | 0.037 | 0.019 | 0.523 | −0.032 | 0.661 | −0.363 | 0.003 | 0.029 | 0.443 | −0.106 | 0.256 | 0.030 | 0.656 |
| RCDSt−1 | −0.010 | 0.074 | 0.025 | 0.706 | 0.036 | 0.005 | −0.037 | 0.080 | 0.194 | 0.024 | −0.012 | 0.698 | −0.030 | 0.209 | 0.132 | 0.168 | −0.008 | 0.835 | −0.026 | 0.305 | 0.150 | 0.004 | −0.026 | 0.584 |
| RCDSt−2 | 0.021 | 0.030 | 0.023 | 0.804 | 0.006 | 0.515 | −0.006 | 0.788 | −0.026 | 0.397 | −0.010 | 0.569 | −0.016 | 0.227 | 0.059 | 0.173 | 0.021 | 0.394 | −0.019 | 0.218 | 0.035 | 0.348 | 0.025 | 0.431 |
| RBondt−1 | −0.038 | 0.079 | −0.093 | 0.160 | 0.163 | 0.005 | −0.003 | 0.804 | 0.021 | 0.710 | 0.084 | 0.001 | 0.008 | 0.389 | 0.042 | 0.347 | 0.108 | 0.034 | −0.000 | 0.998 | −0.061 | 0.155 | 0.306 | 0.000 |
| RBondt−2 | −0.123 | 0.004 | 0.352 | 0.007 | −0.252 | 0.006 | 0.024 | 0.156 | −0.032 | 0.560 | 0.000 | 0.965 | −0.049 | 0.060 | 0.177 | 0.018 | 0.079 | 0.151 | −0.022 | 0.409 | 0.036 | 0.334 | −0.015 | 0.611 |
| Obs. | 1019 | 1020 | 1021 | 731 | 738 | 738 | 447 | 449 | 449 | 575 | 577 | 577 | ||||||||||||
For each market (stock, CDS and bond) we estimate large-T (GLS with autocorrelated errors) panel regressions to study the aggregate lead lag relationship across markets. We report coefficients and p-values. We show two tables: the first refers to countries with CDS’ premiums above 100bp and the second refers to countries with lower spreads according to results showed in Table 1b. In bold are shown significant p-values at 5% level.
Panel data results confirm and qualify our previous findings. For countries with high risk premiums, the main result that emerges from the panel analysis is the strong role of CDSs leadership with respect to bonds and stocks during year 2010, a relationship which is maintained after the 2010 sovereign crisis with respect to the stock market. Before 2010 we observe a leading role of sovereign CDSs and stocks with respect to bonds. For these countries we do not find any other significant leadership relationships.
Results differ for the low-risk countries. During 2009 the stock market also led the bond and CDSs markets. However, and we find that this is the main difference with the set of high risk countries, during 2010 there is no role for CDSs: the stock market continues to be the main venue for incorporating new information. If we use a 10% significance level then a leading role for CDS in relation to stock markets emerges. Interestingly, the impact of CDSs in the stock market – measured by the VAR coefficient – is reduced in half for the low-risk countries.
The results for 2011 are also revealing: for the eight countries with higher sovereign credit risk we observe that the leading role of sovereign CDSs remains (despite the Greek situation). On the other hand, for low-risk countries the picture is quite different and the bond market leads somehow the other two markets, displaying a bidirectional GC with the stock market. Within this sample no role for sovereign CDSs is evident anymore. Related results are Fontana and Scheicher (2010) and Arce et al. (2012) although for samples ending in 2010, and October 2011, respectively.
During the first six months of 2012, we do not detect any clear relationship, although for high risk countries an emerging leading role of bonds with respect to the CDSs can be observed at 10% significance level, a result consistent with some of the country by country results.
To sum up, we stress that the role of sovereign CDSs with respect to the other two markets is state dependent, as the results for years 2010 and 2011 clearly indicate, i.e., the level of sovereign credit risk affects the importance of sovereign CDSs. Similar results for corporate CDSs have been reported in the literature by Norden and Weber (2009) and Fung et al. (2008). Also, the results of the pooled analysis are consistent with a private-to-public risk transfer during the subprime period before the sovereign crisis and a reversal (i.e. a public-to-private transfer) during 2010, especially for the high-risk countries.
5Price discovery among different European Sovereign CDS marketsOne of the key functions of financial markets is price discovery, i.e., the efficient and timely incorporation of the information implicit in investor trading into market prices (Lehmann, 2002). Previous studies show evidence of major commonalities between sovereign CDSs (Lonstaff et al., 2011; Fontana and Scheicher, 2010; Gündüz and Kaya, 2012; or Dieckmann and Plank, 2011). Most notably, Ang and Longstaff (2011) find that systemic sovereign risk has its roots in financial markets, and their principal components analysis shows that there is greater commonality among the Eurozone sovereigns than the US sovereigns. Other papers refer to this spread of sovereign credit risk as “contagion in the Eurozone” (i.e. Manasse and Zavalloni, 2013, or Caporin et al., 2012).
We now explore possible price discovery relationships between the CDSs of the different European countries. We find that during 2007–2009 the countries’ CDS price series were cointegrated I(1) variables, a feature that also appears in 2011 for all the CDS, except for those of Greece, Portugal and Ireland. Thus, CDSs of different countries seem to obey a long-run equilibrium relationship, so we can apply price discovery methodologies and assess whether a specific country's CDS was more important for the discovery of credit risk. During 2010 these equilibrium relationships disappear, so we perform a simpler reduced-form VAR analysis to test the leading role of the changes in the CDS spreads.11
Price discovery analysis has been applied in similar setups by Fontana and Scheicher (2010), Blanco et al. (2005), Mayordomo and Peña (2011), Chu et al. (1999), and more generally, by Baillie et al. (2002), De Jong (2002) and Yan and Zivot (2010) among others. Our methodology is based in the statistics developed by Gonzalo and Granger (1995). In this model, two markets are assumed to be cointegrated, so they share a common trend (factor). The contribution of each market to the common factor is defined to be a function of the error correction coefficient in the VECM that links the movements in the markets. The common factor is, thus, decomposed and superior price discovery is attributed to the market that adjusts the least to price movements in the other market.
Limiting our analysis to pairs of countries, we first test for cointegration using the uniequation test by Phillips and Ouliaris (1990), where only one cointegration vector is tested for (this is the maximum possible number of cointegration vectors, so a multivariate test in the Johansen framework is not necessary). The existence of cointegration means that at least the level of one market adjusts to an equilibrium relationship. Then, in the cases where we can reject the null hypothesis of no-cointegration we estimate, the following VECM:
where ΔCDSctry1(2)t is the change in the sovereign CDS spread of country 1(2) at time t, CDSctry1(2)t is the sovereign CDS spread of country 1(2) at time t, p is the lag order index and ¿1(2)t are i.i.d. shocks.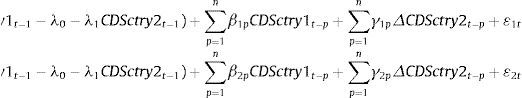
The α coefficients determine each market's contribution to the price discovery and reveal which of the two CDSs leads the credit price discovery. If the CDS of country 2 is contributing significantly to price discovery, α1 will be negative and statistically significant, as the CDS of market 1 adjusts to incorporate this information. If the CDS of country 1 leads the price discovery, then α2 will be positive and statistically significant. If both αi are significant, then both countries contribute to price discovery. The relative importance of both countries in the price discovery is then defined from:
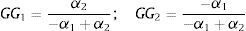
Since GG1+GG2=1, we interpret that country i's CDS leads the process of price discovery if GGi is greater than 0.5. Additionally, (4) implies that price discovery occurs entirely in market i if αi=0.
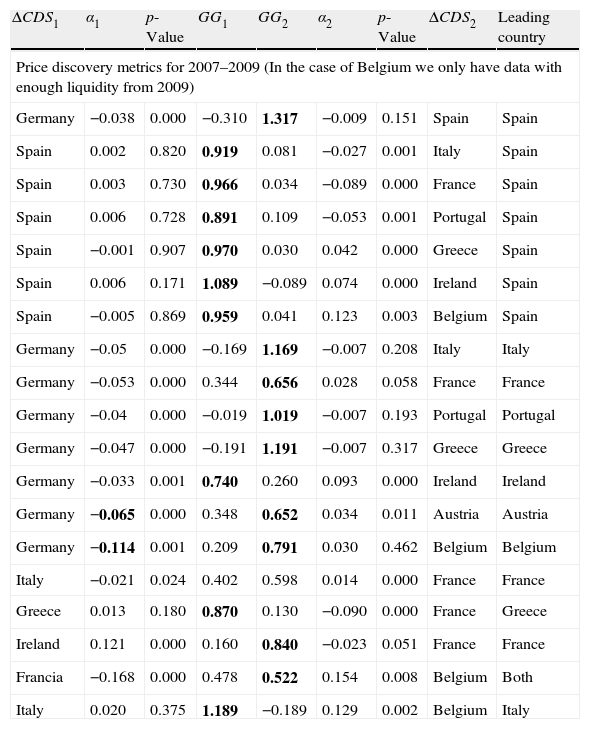
Results of the price discovery among countries in the euro area are displayed in Table 6. For those countries where we find cointegrating relationships during the 2007–2009 period, the evidence points to a clear leadership role of the Spanish CDS and, secondarily, of those of France and Italy. The German CDS does not play a role in the price discovery in relation to peripheral Europe or to the other countries for which we find cointegration (France, Austria, Belgium). Besides, it is noteworthy that we do not find evidence of cointegration for the CDSs of Austria, Finland or Netherlands in the euro area, or UK and Denmark, outside the euro area.
Price discovery metrics for 2007–2009 period by pairs of countries.
| ΔCDS1 | α1 | p-Value | GG1 | GG2 | α2 | p-Value | ΔCDS2 | Leading country |
| Price discovery metrics for 2007–2009 (In the case of Belgium we only have data with enough liquidity from 2009) | ||||||||
| Germany | −0.038 | 0.000 | −0.310 | 1.317 | −0.009 | 0.151 | Spain | Spain |
| Spain | 0.002 | 0.820 | 0.919 | 0.081 | −0.027 | 0.001 | Italy | Spain |
| Spain | 0.003 | 0.730 | 0.966 | 0.034 | −0.089 | 0.000 | France | Spain |
| Spain | 0.006 | 0.728 | 0.891 | 0.109 | −0.053 | 0.001 | Portugal | Spain |
| Spain | −0.001 | 0.907 | 0.970 | 0.030 | 0.042 | 0.000 | Greece | Spain |
| Spain | 0.006 | 0.171 | 1.089 | −0.089 | 0.074 | 0.000 | Ireland | Spain |
| Spain | −0.005 | 0.869 | 0.959 | 0.041 | 0.123 | 0.003 | Belgium | Spain |
| Germany | −0.05 | 0.000 | −0.169 | 1.169 | −0.007 | 0.208 | Italy | Italy |
| Germany | −0.053 | 0.000 | 0.344 | 0.656 | 0.028 | 0.058 | France | France |
| Germany | −0.04 | 0.000 | −0.019 | 1.019 | −0.007 | 0.193 | Portugal | Portugal |
| Germany | −0.047 | 0.000 | −0.191 | 1.191 | −0.007 | 0.317 | Greece | Greece |
| Germany | −0.033 | 0.001 | 0.740 | 0.260 | 0.093 | 0.000 | Ireland | Ireland |
| Germany | −0.065 | 0.000 | 0.348 | 0.652 | 0.034 | 0.011 | Austria | Austria |
| Germany | −0.114 | 0.001 | 0.209 | 0.791 | 0.030 | 0.462 | Belgium | Belgium |
| Italy | −0.021 | 0.024 | 0.402 | 0.598 | 0.014 | 0.000 | France | France |
| Greece | 0.013 | 0.180 | 0.870 | 0.130 | −0.090 | 0.000 | France | Greece |
| Ireland | 0.121 | 0.000 | 0.160 | 0.840 | −0.023 | 0.051 | France | France |
| Francia | −0.168 | 0.000 | 0.478 | 0.522 | 0.154 | 0.008 | Belgium | Both |
| Italy | 0.020 | 0.375 | 1.189 | −0.189 | 0.129 | 0.002 | Belgium | Italy |
| ΔCDS1 | α1 | p-Value | GG1 | GG2 | α2 | p-Value | ΔCDS2 | Leading country |
| Price discovery metrics for 2011 | ||||||||
| Italy | −0.058 | 0.033 | 2.634 | −1.634 | −0.094 | 0.000 | Germany | Italy |
| Italy | −0.086 | 0.039 | 2.178 | −1.178 | −0.159 | 0.000 | Spain | Italy |
| Italy | −0.062 | 0.040 | 1.811 | −0.811 | −0.139 | 0.000 | France | Italy |
| Italy | 0.094 | 0.000 | 1.480 | −0.480 | 0.102 | 0.000 | Belgium | Italy |
| Italy | 0.011 | 0.609 | 1.266 | −0.266 | 0.052 | 0.006 | Finland | Italy |
| Italy | 0.034 | 0.063 | 2.404 | −1.404 | 0.059 | 0.001 | Austria | Italy |
| France | 0.039 | 0.224 | 2.026 | −1.026 | 0.078 | 0.010 | Germany | France |
| France | −0.014 | 0.379 | 0.728 | 0.272 | 0.038 | 0.028 | Spain | France |
| France | 0.08 | 0.019 | 2.041 | −1.041 | 0.158 | 0.000 | Belgium | France |
| France | −0.021 | 0.399 | 0.614 | 0.386 | 0.034 | 0.157 | Finland | France |
| France | 0.047 | 0.148 | 2.234 | −1.234 | 0.085 | 0.009 | Austria | France |
We show the Gonzalo-Granger statistics (in (5)) for the pairs of countries where there is evidence of cointegration, but we only report the results for pairs once we have identified the main leader. We only include countries in the euro area. Bold values are the GC results for the leading countries.
Price discovery metrics for 2007–2009 (In the case of Belgium we only have data with enough liquidity from 2009).
During 2010, possibly due to the Sovereign Debt crisis, the cointegration relationships disappear and CDSs seem not to obey to equilibrium relationships anymore (or, alternatively, risk premiums become non-stationary, a fact that is also reported by Dieckmann and Plank, 2011). In order to be able to infer which country, if any, played a leading role we apply a reduced-form VAR in the changes in the spreads.
Dividing countries into groups of three we estimate the following VAR model:
where RCDSctryit is the return in country i’ sovereign CDS spread at time t.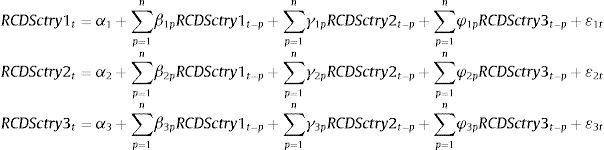
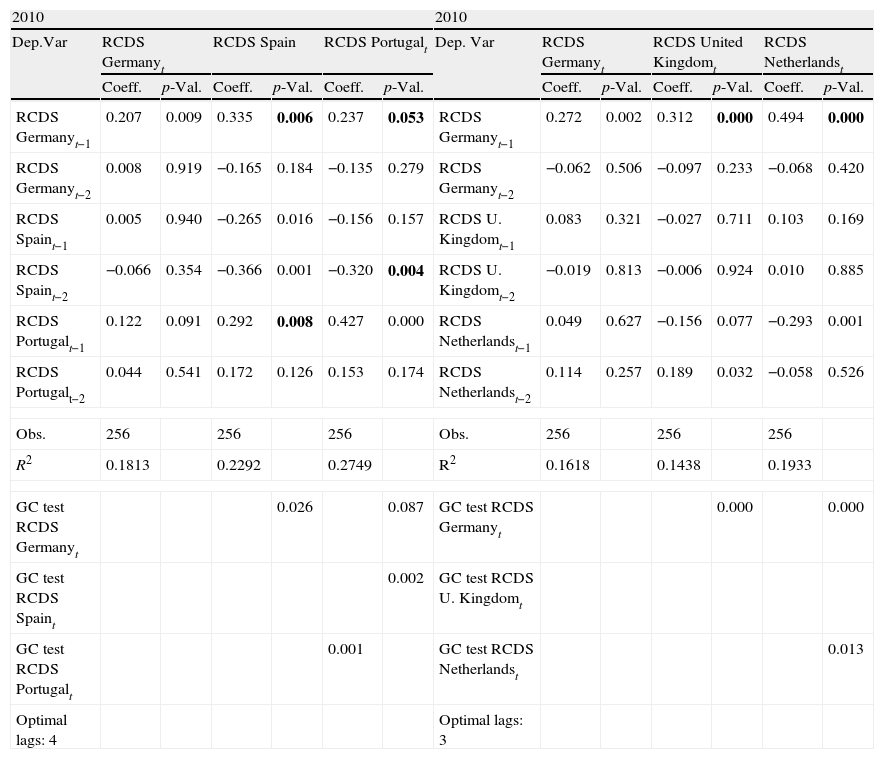
In this case, (see Table 7), the German CDS becomes the main player, leading the incorporation of information in relation to Portugal, Italy, Greece, Spain, Belgium, France, UK, Finland and the Netherlands. We find bidirectional Granger causality with respect to Denmark and no leadership in the case of Ireland.
CDS-specific lead-lag analysis with three dimensional VAR model.
| 2010 | 2010 | ||||||||||||
| Dep.Var | RCDS Germanyt | RCDS Spain | RCDS Portugalt | Dep. Var | RCDS Germanyt | RCDS United Kingdomt | RCDS Netherlandst | ||||||
| Coeff. | p-Val. | Coeff. | p-Val. | Coeff. | p-Val. | Coeff. | p-Val. | Coeff. | p-Val. | Coeff. | p-Val. | ||
| RCDS Germanyt−1 | 0.207 | 0.009 | 0.335 | 0.006 | 0.237 | 0.053 | RCDS Germanyt−1 | 0.272 | 0.002 | 0.312 | 0.000 | 0.494 | 0.000 |
| RCDS Germanyt−2 | 0.008 | 0.919 | −0.165 | 0.184 | −0.135 | 0.279 | RCDS Germanyt−2 | −0.062 | 0.506 | −0.097 | 0.233 | −0.068 | 0.420 |
| RCDS Spaint−1 | 0.005 | 0.940 | −0.265 | 0.016 | −0.156 | 0.157 | RCDS U. Kingdomt−1 | 0.083 | 0.321 | −0.027 | 0.711 | 0.103 | 0.169 |
| RCDS Spaint−2 | −0.066 | 0.354 | −0.366 | 0.001 | −0.320 | 0.004 | RCDS U. Kingdomt−2 | −0.019 | 0.813 | −0.006 | 0.924 | 0.010 | 0.885 |
| RCDS Portugalt−1 | 0.122 | 0.091 | 0.292 | 0.008 | 0.427 | 0.000 | RCDS Netherlandst−1 | 0.049 | 0.627 | −0.156 | 0.077 | −0.293 | 0.001 |
| RCDS Portugalt−2 | 0.044 | 0.541 | 0.172 | 0.126 | 0.153 | 0.174 | RCDS Netherlandst−2 | 0.114 | 0.257 | 0.189 | 0.032 | −0.058 | 0.526 |
| Obs. | 256 | 256 | 256 | Obs. | 256 | 256 | 256 | ||||||
| R2 | 0.1813 | 0.2292 | 0.2749 | R2 | 0.1618 | 0.1438 | 0.1933 | ||||||
| GC test RCDS Germanyt | 0.026 | 0.087 | GC test RCDS Germanyt | 0.000 | 0.000 | ||||||||
| GC test RCDS Spaint | 0.002 | GC test RCDS U. Kingdomt | |||||||||||
| GC test RCDS Portugalt | 0.001 | GC test RCDS Netherlandst | 0.013 | ||||||||||
| Optimal lags: 4 | Optimal lags: 3 | ||||||||||||
| Dep. Var | RCDS Germanyt | RCDS Italyt | RCDS Greecet | Dep. Var | RCDS Germanyt | RCDS Austrian | RCDS Denmarkt | ||||||
| Coeff. | p-Val. | Coeff. | p-Val. | Coeff. | p-Val. | Coeff. | p-Val. | Coeff. | p-Val. | Coeff. | p-Val. | ||
| RCDS Germanyt−1 | 0.257 | 0.001 | 0.350 | 0.003 | 0.277 | 0.014 | RCDS Germanyt−1 | 0.160 | 0.107 | 0.454 | 0.000 | 0.247 | 0.003 |
| RCDS Germanyt−2 | −0.015 | 0.849 | −0.251 | 0.028 | −0.158 | 0.156 | RCDS Germanyt−2 | −0.054 | 0.609 | −0.024 | 0.774 | −0.022 | 0.807 |
| RCDS Italyt−1 | −0.0004 | 0.995 | 0.195 | 0.039 | −0.077 | 0.399 | RCDS Austriant−1 | 0.009 | 0.897 | 0.131 | 0.035 | −0.008 | 0.897 |
| RCDS Italyt | −0.050 | 0.440 | −0.185 | 0.049 | −0.190 | 0.038 | RCDS Austriant−2 | −0.132 | 0.089 | −0.091 | 0.146 | 0.001 | 0.981 |
| RCDS Greecet−1 | 0.119 | 0.052 | −0.057 | 0.523 | 0.218 | 0.012 | RCDS Denmarkt−1 | 0.308 | 0.008 | 0.531 | 0.000 | 0.045 | 0.648 |
| RCDS Greecet−2 | 0.010 | 0.870 | 0.145 | 0.108 | 0.039 | 0.656 | RCDS Denmarkt−2 | 0.058 | 0.646 | −0.068 | 0.504 | −0.018 | 0.866 |
| Obs. | 256 | 256 | 256 | Obs. | 257 | 257 | 257 | ||||||
| R2 | 0.1331 | 0.1384 | 0.1252 | R2 | 0.2284 | 0.5934 | 0.1498 | ||||||
| GC test RCDS Germanyt | 0.002 | 0.026 | GC test RCDS Germanyt | 0.000 | – | ||||||||
| GC test RCDS Italyt | – | 0.049 | GC test RCDS Austriant | – | – | ||||||||
| GC test RCDS Greecet | GC test RCDS Denmarkt | 0.058 | 0.000 | ||||||||||
| Optimal lags: 2 | Optimal lags: 8 | ||||||||||||
| Dep. Var | RCDS Germanyt | RCDS France | RCDS Irelandt | Dep. Var | RCDS Germanyt | RCDS Belgium | RCDS Finlandt | ||||||
| Coeff. | p-Val. | Coeff. | p-Val. | Coeff. | p-Val. | Coeff. | p-Val. | Coeff. | p-Val. | Coeff. | p-Val. | ||
| RCDS Germanyt−1 | 0.235 | 0.007 | 0.347 | 0.001 | 0.245 | 0.037 | RCDS Germanyt−1 | 0.251 | 0.009 | 0.345 | 0.000 | 0.272 | 0.001 |
| RCDS Germanyt−2 | −0.034 | 0.699 | 0.091 | 0.391 | −0.059 | 0.620 | RCDS Germanyt−2 | 0.110 | 0.264 | −0.082 | 0.385 | −0.022 | 0.799 |
| RCDS Francet−1 | 0.046 | 0.507 | −0.189 | 0.028 | −0.002 | 0.984 | RCDS Belgiumt−1 | 0.135 | 0.167 | 0.064 | 0.494 | 0.206 | 0.016 |
| RCDS Francet−2 | 0.032 | 0.653 | −0.054 | 0.533 | −0.135 | 0.164 | RCDS Belgiumt−2 | −0.014 | 0.884 | −0.037 | 0.687 | −0.0004 | 0.995 |
| RCDS Irelandt−1 | 0.087 | 0.102 | 0.156 | 0.017 | 0.065 | 0.374 | RCDS Finlandt−1 | 0.025 | 0.823 | −0.013 | 0.899 | −0.207 | 0.034 |
| RCDS Irelandt−2 | 0.023 | 0.656 | −0.025 | 0.698 | 0.063 | 0.380 | RCDS Finlandt−2 | −0.154 | 0.168 | 0.050 | 0.639 | −0.161 | 0.100 |
| Obs. | 256 | 256 | 256 | Obs. | 256 | 256 | 256 | ||||||
| R2 | 0.1694 | 0.1252 | 0.1831 | R2 | 0.1946 | 0.2043 | 0.1800 | ||||||
| GC test RCDS Germanyt | 0.005 | 0.010 | GC test RCDS Germanyt | 0.001 | 0.006 | ||||||||
| GC test RCDS Francet | – | – | GC test RCDS Belgiumt | – | 0.037 | ||||||||
| GC test RCDS Irelandt | GC test RCDS Finlandt | ||||||||||||
| Optimal lags: 4 | Optimal lags: 6 | ||||||||||||
The CDS-specific VAR model consists of three-equations with CDS sovereign returns (RCDS) of each country as dependent variables respectively. In this table, we report coefficients (Coeff.) and p-values. We show the p-value for the Granger causality test (GC) only in the cases in which it is significant at a 5% level. In bold are shown significant p-values at 5% level.
After the German CDS, the Spanish one appears as the next most important participant, before Italy or Greece. If we take a look at the average daily CDS volumes negotiated during 2010, we can observe both the German and Spanish CDSs in the top ten list. It is noteworthy how the trading volume of the Spanish CDS increased during the year – finishing 2010 with an average daily notional trade of $924,066,884, the most liquid out of the 1000 references that DTCC publishes –, while the German CDS remained in the seventh position, finishing the year with a daily average notional volume of $288,624,653.12
Trade in the Greek CDSs dropped during 2010 and 2011 as the inability of Greece to face the due payments of the sovereign debt and the needs to reschedule and restructure were becoming clear. The Greek CDS ranked 5th in trading volume by March 2010 – with an average daily notional of $450,000,000 – while by December 2010 it ranked 16th – with an average daily notional of $206,761,780 – and by September 2011 it was in the 40th position – with an average daily notional of $150,000,000. It continued to fall during 2012: by February 2012 it was around the 500th position. This highlights that CDS instruments are useful while there is still uncertainty about the future credit condition of the reference entity. Once the creditworthiness has been clarified (the underlying entity becomes either bankrupt or reliable) the reference CDS stops attracting attention.
During 2011 many sovereign CDS markets returned to an equilibrium path, so we perform a price discovery analysis (Table 6). The three countries with the worst credit situation, Greece, Portugal and Ireland, however, are set apart and do not show evidence of cointegration. Italy emerges now as the price discovery leader, followed by France, a result consistent with market data: Italy is the European country with higher amount of public debt issued and its credit situation has been worsening during 2011. Its CDS was at the top of the 1000 more liquid CDSs reported by DTCC, with a daily average notional traded of $1,550,000,000 as of June 2011, followed by the French CDS. Spain and Germany do not play a significant role anymore.13
6ConclusionsIn this paper we investigate the relationships between the markets for sovereign bonds and CDSs and the stock markets for a wide sample of European countries.
We start our study by justifying the link between sovereign debt markets and stock markets, an area where limited work has been done so far. While at a firm level, finance theory suggests that an efficient stock market should incorporate information on the default probability of firms in a timely manner, there have been few attempts to measure a “country's equity”. We argue, however, that the country's firms proxy for this equity and, thus, the country's credit information should flow to stock markets (and vice versa), so a worsening credit situation of the companies should be reflected in the country's credit quality.
Second, we looked at the process of information incorporation into the three markets (sovereign bonds and CDSs and stocks). Our results confirm the hypothesis that in the early stages of the crisis private (stock) markets led the process whereas in later stages the direction of the risk transfer changed and sovereign markets led this process. Our findings are in line with those of Arce et al. (2012), Coudert and Gex (2010) and Fontana and Scheicher (2010). A country-by-country analysis shows that debt markets lagged the stock markets during 2007–2009, while credit markets, CDS markets to be precise, led the incorporation of new information during 2010. During 2011, stock markets recovered the leading role in many economies and the sovereign bond market gained in importance.
We find that these relationships are state dependent: CDSs played a stronger leading role in economies with higher perceived credit risk. Overall, our results are strongly consistent with a private-to-public risk transfer during the subprime crisis and a public-to-private risk transfer during the European sovereign credit crisis.
Third, given the high level of commonality in sovereign credit spreads already reported in the literature, we analyze the relationship between the different European CDSs. During 2007–2009, we find CDSs of several countries obeying equilibrium relationships. Interestingly, the Spanish CDS turns out to be the market where price discovery takes place and where informed traders transact most (a result which at first may seem surprising, but which is aligned with the large observed trade volume in Spanish CDSs). During 2010, the different CDS markets lost their equilibrium relationship but we still find that movements in the German CDS Granger cause the movements in the rest of European CDSs, thus confirming a sort of German price leadership. In 2011, CDSs respond to equilibrium relationships again, but during that period Italy becomes the country in which information is embedded first, a finding which is also coherent with the behavior of trading volume. Some countries, such as Greece, Portugal and Ireland – all of them distressed economies – are not included in the 2011 price discovery analysis because of the non-stationarity of their credit swap spreads.
On March 9, 2012 ISDA declared unanimously that Greece triggered the payment on default insurance contracts by using legislation that forces losses on all private creditors. This is the first sovereign credit event in an advanced euro-economy. Since DTCC began tracking CDS in 2003, the only other sovereign credit event to trigger a payout was Ecuador in January 2009.
We thank Jens Hilscher, Sergio Mayordomo, two anonymous referees, participants at the Eastern Finance Association Annual Meeting 2012, and Participants at the XX Finance Forum 2012, for helpful comments and suggestions. TC acknowledges financial support from the Spanish Ministerio de Ciencia e Innovación via project ECO2011-29144. JGB acknowledges the Barcelona GSE and financial support from the Spanish Ministerio de Economía y Competitividad via project ECO2011-25607.
Data from 2013-02-01 Weekly Activity Report and Market Activity Report June 20, 2012–September 19, 2012 Depository Trust and Clearing Corporation.
Ang and Longstaff (2011) also document this behavior: systemic sovereign credit risk in the U.S. declines significantly when the S&P 500 increases, and similarly for the Eurozone when the DAX increases.
Merton et al. (2013) is one example of a paper trying to explain feedback loops among sovereign and banks, although in their research so far they do not consider non-financial companies.
According to anecdotal evidence the 5-year CDS is more liquid and it is more often used as a reference in financial markets. Delatte et al. (2012), Lonstaff et al. (2011), and Longstaff (2010), Coudert and Gex (2010), Arce et al. (2012) use sovereign CDS of the same tenor. Dieckmann and Plank (2011), Gündüz and Kaya (2012) and Fontana and Scheicher (2010) use 10 years CDS but their results are robust to using 5 years CDS spreads.
We do not examine the price discovery process between CDSs and bonds in sovereign credit markets. This topic has already been addressed by Arce et al. (2012) and Fontana and Scheicher (2010) among others. Our findings support and corroborate theirs.
Other examples in different areas are Engsted and Tanggaard (2004), who study the co-movement of US and UK stock markets, or Ap Gwilym and Buckle (2001),who focus on the lead-lag relationship between the FTSE100 stock index and its derivative contracts.
Detailed results are available upon request.
We did perform the analysis including these two countries in the panel with lower credit risk and the results did not change at all, suggesting that there is no significant currency risk effect in the relationship between the three assets. Estimations are available upon request.
We cannot allow the panels to be correlated contemporaneously given that our panels are unbalanced. The use of smaller samples where the panels can be balanced leads to comparable results, though, and the standard errors of the estimates are only marginally affected.
Caporin et al. (2012) explain the convenience of this model in the particular setup of measuring contagion across CDSs.
These quantities have increased during 2011, more than doubling in the case of Germany. During this year, the Spanish CDS follows the Italian CDS, which is at the top of the most negotiated CDSs.
We also performed a VAR analysis with 2011 data in order to include every country in the sample, and the results are robust in suggesting that Italy is the main leader. These results are available upon request.

