


This paper analyses the effect of rating signals on banks’ stock market returns during the period 2004–2012. The results obtained show that investors respond to rating announcements. Specifically, it is found that before the financial crisis, positive rating signals issued by Standard and Poor's and Moody's, and negative ratings signals issued by Fitch and Standard and Poor's, have a significant effect on the return on banks’ shares. Conversely, in a context in which the banks experienced a significant worsening of their financial situation and the rating agencies were in the spotlight, investors reacted not only to rating downgrades as expected, but also to rating upgrades. Furthermore, the results suggest that investors do not react with the same intensity to the ratings signals issued by the rating agencies. Analysis of the causal relationship between rating signals and returns on banks’ shares indicates that the policies of the rating agencies are not totally independent of changes occurring in the financial markets.
The subprime crisis of 2007 in the United States and the subsequent sovereign debt crisis in the European Union have again reopened the debate over the role of rating agencies and the excessive impact of their ratings on the financial markets. In this context, as referred to by the Financial Crisis Inquiry Report (2011) and Benmelech and Dlugosz (2010), during the subprime crisis the agencies were accused of relaxing their rating criteria in evaluating structured products. Furthermore, during the sovereign debt crisis in Europe the rating agencies were criticised for their inaccurate downgrading of the sovereign ratings of the countries with financial problems (IMF, 2010). At the same time, the agencies were also criticised for the conflicts of interest deriving from their business model, their lack of transparency, and the excessive credibility they received from investors and regulators (Bank of England, 2011).
Regulators, concerned about the systemic risks that may be caused by changes in ratings during times of financial instability, carried out various regulatory reforms. In 2008, the International Organisation of Securities Commissions (IOSCO) revised its code of conduct with the aim of increasing transparency, independence and competition among the rating agencies. In 2009, the European Parliament passed a new regulation (Regulation (EC) No 1060/2009) compelling agencies operating in Europe to register with the Committee of European Securities Regulators. Subsequently, in July 2011, this competence was transferred to the European Securities and Markets Authority (ESMA). In 2009 the United States Securities and Exchange Commission also imposed restrictions aimed at avoiding conflicts of interest between rating agencies and issuers, demanding greater diffusion of the statistics on ratings performance, and increasing the transparency of rating methodologies. In light of these reforms in Europe and the United States, the Basel Committee reviewed the role of ratings in the calculation of regulatory capital. Other G-20 countries also reformed their regulations to tighten supervision of the rating agencies. Finally, the Financial Stability Board published a set of principles (FSB, 2010) to reduce the excessive reliance of investors, regulations and other agents on the rating agencies.
Despite the criticisms received and the succession of regulatory reforms described above, ratings continue to have a significant effect in the financial markets (Bank of England, 2011). Although the effect of rating announcements (i.e. signals) on the financial markets has been amply discussed in the literature on sovereign ratings, very few studies analyse this question for the case of banks’ issuer ratings. Notable papers on sovereign ratings include Kaminsky and Schmukler (2002), Brooks et al. (2004), Martell (2005), Ferreira and Gama (2007), Arezki et al. (2011), Hill and Faff (2010) and Afonso et al. (2012). All these studies find that while rating downgrades have a significant effect on the stock and bond markets, rating upgrades have a limited effect.
The present paper, to the best of our knowledge, is the first study to analyse the effects of rating announcements for banks in the European Union on the returns of their shares for a period covering a full economic cycle. To analyse this question, the study uses changes in bank issuer ratings and their short- and long-term perspectives, namely watchlists and outlooks, awarded during the period 2004–2012 by the three principal rating agencies: Standard and Poor's, Moody's, and Fitch. Furthermore, unlike previous research that focuses on the effect of ratings signals during the financial crisis, this paper explores not only the negative rating signals (i.e. rating downgrades and negative perspectives), but also the positive signals (i.e. rating upgrades and positive perspectives). In addition, the long period considered allows analysis of how the financial crisis and the changes in market sensitivity impact ratings signals. Furthermore, the reverse causation is also analysed, that is, whether rating agencies react to markets in their rating policies.
The results obtained show how investors modify their investment strategies in accordance with rating signals. Specifically, the results suggest that before the financial crisis, positive rating signals issued by Standard and Poor's and Moody's, and negative ratings signals issued by Fitch and Standard and Poor's have a significant effect on the returns on banks’ shares. On the other hand, with the worsening of the banks’ asset situation during the crisis (Financial Stability Report of the European Central Bank, 2008a,b) and the criticisms levelled against the agencies, their negative signals of banks’ issuer ratings have a significant effect on share returns. Similarly, the rating upgrades also have a significant effect, even higher than downgrades, as investors are less likely to expect upgrades during a period of financial distress. Lastly, it should be highlighted that the different effect of ratings on banks’ share returns suggests that investors react differently to the agencies’ ratings announcements.
In addition, regarding the hypothesis of whether rating agencies also follow stock market fluctuations when deciding their ratings, the results suggest that the rating policies are not totally immune to the variations occurring in the financial markets. Therefore, the findings suggest that the ratings agencies do not strictly follow a “through-the-cycle” strategy, as claimed in their methodological reports (e.g. Moody's, 2007a,b) and by some authors in the literature (e.g. Altman and Rijken, 2004, 2006). However, it should be highlighted that with the onset of the financial crisis the rating agencies reacted to a lesser extent to changes in the stock markets. In addition, the results also suggest that the reactions to the previous changes in the stock markets vary according to the rating agency analysed.
The rest of the paper is structured as follows. Section 2 briefly reviews the literature on the influence of rating announcements on the stock markets. Section 3 describes the sample and performs a descriptive analysis of ratings behaviour during the period of analysis. Section 4 describes the methodology used both in analysing events (rating signals) and in studying the causal relationship between the changes in ratings and abnormal stock returns. Section 5 reports the empirical results. Finally, the conclusions are presented.
2Review of the literature2.1Effect of sovereign rating signals on the financial marketsA large number of studies analyse the effects of rating changes on bond and stock markets. However, most of the studies analysing the impact of rating signals on the financial markets have focussed on sovereign ratings, while very few have analysed this question exclusively for the case of banks. Outstanding studies of sovereign ratings include Brooks et al. (2004), who examine the effect of rating signals on the returns of the national stock markets. Gande and Parsley (2005) study the effect of change in the sovereign rating of a country on the sovereign credit differentials of other countries (spillover effect). In particular, these authors find evidence that sovereign rating downgrades trigger cross-border effects. Ferreira and Gama (2007) examine the spillover effects of sovereign ratings on international stock market returns. Afonso et al. (2012) analyse the effect of sovereign rating signals on bond yields, stock markets and the sovereign credit default swap spreads of the European Union countries. All these studies find evidence that only negative rating signals have a significant effect on the financial markets. This suggests that governments tend to advance positive information to the financial markets on their financial situation, while they are reluctant to advance information of a negative character.
More recent studies such as Arezki et al. (2011) show that the spillover effect analysed by other studies in the literature depends on the type of rating awarded, on the country in which the downgrade occurs, and on the rating agency that issues the rating signal. These authors found that negative signals of ratings which are close to the speculative grade have a systematic spillover effect among the Eurozone countries. This shows that the effect of rating signals increases as the credit quality of the entities evaluated diminishes.
Hill and Faff (2010) show that of the three main rating agencies, Standard and Poor's issues most rating signals and their ratings have the greatest impact on the stock markets. This study finds that outlooks and watchlists have a greater influence than rating changes themselves on the returns on shares, and shows that the reaction of the financial markets is more intense during periods of economic crisis. Finally, these authors, who also study lead-lag relationships among agencies, find evidence that Standard and Poor's is the leading agency in non-advanced economies, while Moody's leads in advanced economies.
In another recent study, Caselli et al. (2014) analyse the spillover effect of Eurozone sovereign rating changes on domestic bank share prices in the period 2002–2012, considering the effect of the recent financial crisis. These authors find evidence of the strong negative spillover effect of sovereign rating changes on bank share prices in the case of downgrades, but no significant effect in the case of upgrades. This result shows that stock returns after downgrades are significantly negative, but insignificant in the cases of upgrades.
In the same line, Correa et al. (2014) analyse the effect of the sovereign rating changes on bank stock returns in 37 countries during the period 1995 and 2011. These authors found evidence that sovereign rating downgrades have a large negative effect on bank stock returns for those banks that could receive stronger support from their corresponding governments. Thus, these results suggest that the risk of the governments and domestic banks are significantly connected.
Finally, Alsakka et al. (2016), analyse the differences of opinion in sovereign ratings issued by the three main rating agencies and their effect on the main European stock markets during the recent financial crisis. Their results show that the investors only react significantly to negative rating signals issued by Standard and Poor's. Additionally, these authors find evidence that market responses are affected by disagreements between Standard and Poor's, Fitch and Moody's. Finally, these authors, find evidence that only negative rating signals issued by Standard and Poor's affect the own-country stock market and spill over to other European markets.
2.2Effect of the bank rating signals on the financial marketsFew papers have dealt with the effect of bank ratings on the stock market. Schweitzer et al. (1992) examine the impact of rating changes on bank share prices in the United States. The results show that both positive and negative rating signals have a significant yet limited effect on the returns of bank shares. The comparison of these results with those obtained for non-financial firms reveals that the differences are not significant with rating upgrades, but are significantly different with rating downgrades.
The second study of note in the field of bank ratings is Billet et al. (1998), who analyse the relationship between changes in bank risk and the use of guaranteed deposits during the period 1990–1995. Their results demonstrate the existence of a negative relationship between rating downgrades and the abnormal returns of the banks analysed. Richards and Deddouche (1999) analyse the effect of bank rating signals for the case of emerging markets during the period 1989–1998. Their results show that either rating signals have no significant effect on bank shares or the effect is contrary to that expected.
Gropp and Richards (2001) examine the impact of rating signals for 32 European banks during the period 1989–2000. These authors argue that while the rating signals have a weak impact on the price of bonds, the impact on the stock price is significant. The effect of the signal on the stock price depends on the underlying reason. Specifically, in the case of the rating downgrades associated with an increase in the bank's risk, they found a positive impact on the abnormal returns. On the other hand, rating downgrades associated with a worsening of the outlook for solvency have a significant negative impact on abnormal returns. Therefore, these results lend support to the hypothesis that ratings provide relevant market information that is not completely discounted by investors. Hence, the market assumes that agencies have access to information that is not in the public domain and/or have a comparative advantage in the processing of public information.
Finally, Alsakka et al. (2015) analyse only the effect of banks’ rating downgrades on their corresponding stock returns and volatility during the period of the recent financial crisis and for the case of European banks. They specifically analyse whether investor perceptions of banks’ rating downgrades changed with the entry into force of the new regulations on credit rating agencies in Europe. Their results show that the new regulation regime in 2011 did not have a strong effect on investors’ perceptions about the banks’ rating downgrades. Furthermore, these authors highlight that the effect of the rating downgrades issued by Moody's, Standard and Poor's and Fitch do not have the same effect on the European Banks’ stock returns.
Therefore, the present paper contributes to the literature by analysing the effects rating announcements for banks in the European Union on the returns of their shares considering the effect of the recent financial crisis. In particular, the present paper considers both rating upgrades and downgrades, as well as the short- and long-term perspectives of the future change in ratings. In addition, for the particular case of issuer banks ratings, it is also analysed whether there is evidence of the reverse causation, that is, whether rating agencies react to the changes occurring in the stock markets.
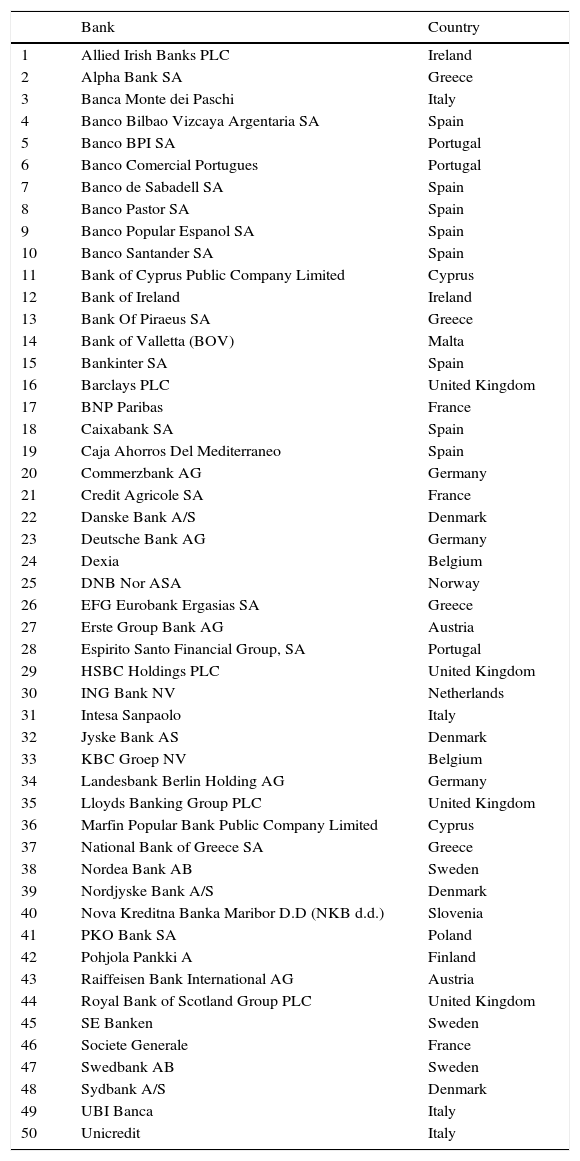
3Data and sampleThis study analyses the relationship between the different rating announcements (i.e. signals) issued by the three principal rating agencies (Standard and Poor's, Moody's and Fitch) for the European Banks included in the 2011 EU stress test. Table 1 lists the 50 banks from 19 European Union member countries considered in the sample. Some of the banks that took the EU stress test are not included because they are not quoted on stock exchanges.1 The type of rating used is the long-term issuer rating, essentially because this type of rating reflects the total probability of default on the basis of both the banks’ intrinsic solvency and the external support that they may receive in the event of bankruptcy.2 The analysis consisted of daily observations during the period from January 2004 to June 2012. In turn, this period is divided into two sub-periods: the pre-crisis period (January 2004 to 14 September 2008) and the period of financial crisis (15 September 2008 to 15 June 2012).3 This split allows us to analyse the differential impact that the financial crisis had on the effect of the issuer signals on the returns of banks’ shares.
List of the banks considered in the sample.
| Bank | Country | |
|---|---|---|
| 1 | Allied Irish Banks PLC | Ireland |
| 2 | Alpha Bank SA | Greece |
| 3 | Banca Monte dei Paschi | Italy |
| 4 | Banco Bilbao Vizcaya Argentaria SA | Spain |
| 5 | Banco BPI SA | Portugal |
| 6 | Banco Comercial Portugues | Portugal |
| 7 | Banco de Sabadell SA | Spain |
| 8 | Banco Pastor SA | Spain |
| 9 | Banco Popular Espanol SA | Spain |
| 10 | Banco Santander SA | Spain |
| 11 | Bank of Cyprus Public Company Limited | Cyprus |
| 12 | Bank of Ireland | Ireland |
| 13 | Bank Of Piraeus SA | Greece |
| 14 | Bank of Valletta (BOV) | Malta |
| 15 | Bankinter SA | Spain |
| 16 | Barclays PLC | United Kingdom |
| 17 | BNP Paribas | France |
| 18 | Caixabank SA | Spain |
| 19 | Caja Ahorros Del Mediterraneo | Spain |
| 20 | Commerzbank AG | Germany |
| 21 | Credit Agricole SA | France |
| 22 | Danske Bank A/S | Denmark |
| 23 | Deutsche Bank AG | Germany |
| 24 | Dexia | Belgium |
| 25 | DNB Nor ASA | Norway |
| 26 | EFG Eurobank Ergasias SA | Greece |
| 27 | Erste Group Bank AG | Austria |
| 28 | Espirito Santo Financial Group, SA | Portugal |
| 29 | HSBC Holdings PLC | United Kingdom |
| 30 | ING Bank NV | Netherlands |
| 31 | Intesa Sanpaolo | Italy |
| 32 | Jyske Bank AS | Denmark |
| 33 | KBC Groep NV | Belgium |
| 34 | Landesbank Berlin Holding AG | Germany |
| 35 | Lloyds Banking Group PLC | United Kingdom |
| 36 | Marfin Popular Bank Public Company Limited | Cyprus |
| 37 | National Bank of Greece SA | Greece |
| 38 | Nordea Bank AB | Sweden |
| 39 | Nordjyske Bank A/S | Denmark |
| 40 | Nova Kreditna Banka Maribor D.D (NKB d.d.) | Slovenia |
| 41 | PKO Bank SA | Poland |
| 42 | Pohjola Pankki A | Finland |
| 43 | Raiffeisen Bank International AG | Austria |
| 44 | Royal Bank of Scotland Group PLC | United Kingdom |
| 45 | SE Banken | Sweden |
| 46 | Societe Generale | France |
| 47 | Swedbank AB | Sweden |
| 48 | Sydbank A/S | Denmark |
| 49 | UBI Banca | Italy |
| 50 | Unicredit | Italy |
Note: List of the European Banks subjected to the 2011 EU stress test and considered in the sample.
Previous studies in the literature (Hill and Faff, 2010; Afonso et al., 2012) show that the impact on the financial markets of the short- and long-term perspectives, i.e. the watchlists and outlooks, is at least as significant as the rating changes. Consequently, the rating signals are defined on the basis of changes in ratings, watchlists and outlooks. The data on ratings were obtained from Reuters’ CreditViews database, Orbis and Bankscope (Bureau van Dijk).
Watchlists and outlooks are defined as follows. Positive outlooks refer to ratings under review for a possible upgrade in the medium term and the changes from a negative outlook to a stable outlook. Negative outlooks, on the contrary, refer to ratings under review in the medium term for a possible downgrade as well as changes occurring from a positive outlook to a stable outlook. Negative (positive) watchlists contain the ratings on this list for a possible downgrade (upgrade), and the confirmation of the rating for a bank previously placed on the watchlist for a possible upgrade (downgrade).
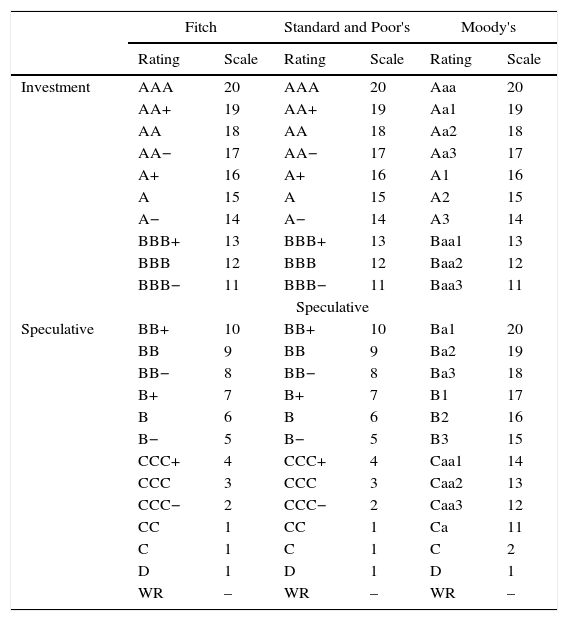
The categorical scale (AAA/Aaa, AA/Aa1, …, C, D) of the ratings of Standard and Poor's, Fitch and Moody's, was transformed into a numerical scale formed by 20 categories as specified in Annex 1 following the studies by Alsakka et al. (2014) and Williams et al. (2013). In order to take into account the current rating and the perspectives in the short term (watchlist) and in the medium term (outlook) an index is defined that takes values from 1 to 20, where the highest values represent a higher credit quality and consequently a lower probability of default. This index is defined as proposed by Hill and Faff (2010) on the basis of adding (subtracting) 0.5 points to (from) the current rating, when a positive (negative) watchlist is issued, or adding (subtracting) 0.25 points when a positive (negative) outlook is issued.4 The index is similar to the comprehensive credit rating (CCR) proposed by Gande and Parsley (2005), in which one point is added to (subtracted from) the current rating if a positive (negative) outlook occurs.
In the index proposed by Gande and Parsley (2005) different levels of ratings with different perspectives may take the same value when they are not really equivalent. For example, if a change occurs from A+ with a positive outlook to AA− with a stable outlook, the variation in the rating level is nil and the value of the index is equal to 17 according to the index proposed by these authors. This is because according to the numerical scale defined in Annex 1, the numerical value for a rating of A+ is 16 and with a positive outlook one point is added. Consequently, with such a change a rating of A+ has the same value as a rating of AA− and a stable outlook, when really these ratings refer to totally different levels of solvency as the agencies point out in their methodological reports.
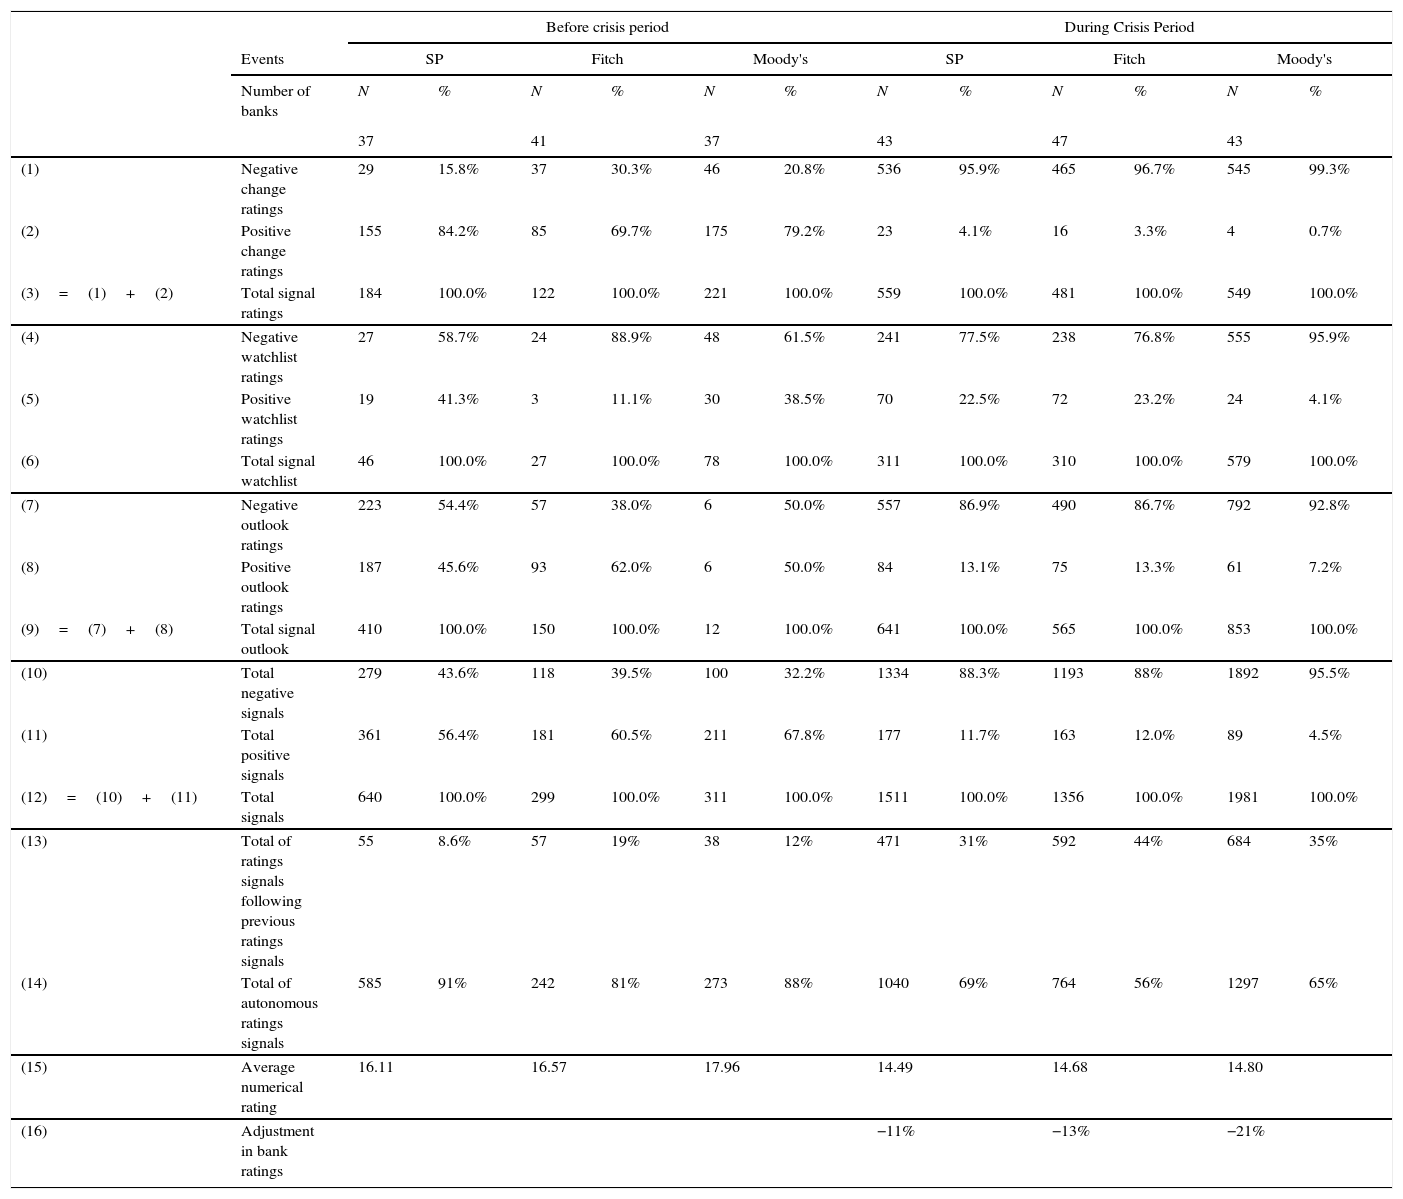
An analysis of the distribution of rating signals reveals that before the financial crisis there were more positive than negative signals (Table 2). Specifically, positive signals represent 56.4%, 60.5% and 67.8% of the total number of signals issued by Standard and Poor's, Fitch and Moody's, respectively. Conversely, the negative signals represent 43.6%, 39.5% and 32.2% in Standard and Poor's, Fitch and Moody's, respectively. This tendency is inverted during the financial crisis, since negative signals represent 88.3% in Standard and Poor's, 88% in Fitch and 95.5% in Moody's. In contrast, the positive signals in Standard and Poor's, Fitch and Moody's represent 11.7%, 12% and 4.5%, respectively.
Descriptive statistics of bank issuer ratings.
| Before crisis period | During Crisis Period | ||||||||||||
|---|---|---|---|---|---|---|---|---|---|---|---|---|---|
| Events | SP | Fitch | Moody's | SP | Fitch | Moody's | |||||||
| Number of banks | N | % | N | % | N | % | N | % | N | % | N | % | |
| 37 | 41 | 37 | 43 | 47 | 43 | ||||||||
| (1) | Negative change ratings | 29 | 15.8% | 37 | 30.3% | 46 | 20.8% | 536 | 95.9% | 465 | 96.7% | 545 | 99.3% |
| (2) | Positive change ratings | 155 | 84.2% | 85 | 69.7% | 175 | 79.2% | 23 | 4.1% | 16 | 3.3% | 4 | 0.7% |
| (3)=(1)+(2) | Total signal ratings | 184 | 100.0% | 122 | 100.0% | 221 | 100.0% | 559 | 100.0% | 481 | 100.0% | 549 | 100.0% |
| (4) | Negative watchlist ratings | 27 | 58.7% | 24 | 88.9% | 48 | 61.5% | 241 | 77.5% | 238 | 76.8% | 555 | 95.9% |
| (5) | Positive watchlist ratings | 19 | 41.3% | 3 | 11.1% | 30 | 38.5% | 70 | 22.5% | 72 | 23.2% | 24 | 4.1% |
| (6) | Total signal watchlist | 46 | 100.0% | 27 | 100.0% | 78 | 100.0% | 311 | 100.0% | 310 | 100.0% | 579 | 100.0% |
| (7) | Negative outlook ratings | 223 | 54.4% | 57 | 38.0% | 6 | 50.0% | 557 | 86.9% | 490 | 86.7% | 792 | 92.8% |
| (8) | Positive outlook ratings | 187 | 45.6% | 93 | 62.0% | 6 | 50.0% | 84 | 13.1% | 75 | 13.3% | 61 | 7.2% |
| (9)=(7)+(8) | Total signal outlook | 410 | 100.0% | 150 | 100.0% | 12 | 100.0% | 641 | 100.0% | 565 | 100.0% | 853 | 100.0% |
| (10) | Total negative signals | 279 | 43.6% | 118 | 39.5% | 100 | 32.2% | 1334 | 88.3% | 1193 | 88% | 1892 | 95.5% |
| (11) | Total positive signals | 361 | 56.4% | 181 | 60.5% | 211 | 67.8% | 177 | 11.7% | 163 | 12.0% | 89 | 4.5% |
| (12)=(10)+(11) | Total signals | 640 | 100.0% | 299 | 100.0% | 311 | 100.0% | 1511 | 100.0% | 1356 | 100.0% | 1981 | 100.0% |
| (13) | Total of ratings signals following previous ratings signals | 55 | 8.6% | 57 | 19% | 38 | 12% | 471 | 31% | 592 | 44% | 684 | 35% |
| (14) | Total of autonomous ratings signals | 585 | 91% | 242 | 81% | 273 | 88% | 1040 | 69% | 764 | 56% | 1297 | 65% |
| (15) | Average numerical rating | 16.11 | 16.57 | 17.96 | 14.49 | 14.68 | 14.80 | ||||||
| (16) | Adjustment in bank ratings | −11% | −13% | −21% | |||||||||
Note: Distribution of signals regarding issuer ratings of the European Banks subjected to the 2011 EU stress test considered before and since the start of the financial crisis. The % columns represent the weight of each type of signal (negative or positive) among the total signals (change, watchlist or outlook ratings). Rows 13 and 14 show the issuer rating signals that follow previous ratings signals issued in the previous 15 days by another agency, the agency itself or reactions to previous signals in the sovereign ratings. Row 15 shows the average rating issued by each rating agency. Finally, row 16 presents the average fall in the ratings issued by each rating agency as a consequence of the financial crisis.
Table 2 also shows a concentration of the signals issued during the period of financial crisis because previously the ratings were fairly stable, implying that the rating agencies review the ratings more frequently. Furthermore, it can be observed that with the onset of the financial crisis there is also a significant fall in ratings. In particular, the ratings issued by Standard and Poor's, Fitch and Moody's were downgraded by 11%, 13% and 21%, respectively. Therefore, these descriptive results suggest the procyclic behaviour of bank rating, as pointed out by some authors in the literature (Bangia et al., 2002; Catarineu-Rabell et al., 2002; Amato and Furfine, 2003; Zicchino, 2005; Salvador et al., 2014).
The data on daily prices of the banks’ shares were obtained from the Thomson Reuters Datastream database. The return (Rt) is defined as the logarithm difference between the price of the shares on days t and t−1.5 Survival bias is avoided by considering banks that operate throughout the entire period as well as those that were delisted. The stock price is expressed in euros; shares quoted in any other currency were converted into euros using the exchange rate current on the day the share was traded. For this conversion, the foreign currency/euro exchange rate obtained from the Thomson 3000 Xtra database is used.
Additionally, for shares listed in different stock markets, both shares listed in the bank's main country of operation and those listed in other countries are taken into account. Among the different types of shares, only ‘common stocks’ are considered. Consequently shares with special characteristics such as deposit certificates (ADRs), real estate investment funds (REITs) and preference shares are excluded from the analysis.
4Methodology4.1Ratings signals and abnormal returnsEvent methodology is used to analyse the impact of issuer rating signals (event) on banks’ share returns (Arezki et al., 2011). This methodology consists of analysing the behaviour of the abnormal returns (AR) of the shares at the moment that the rating signal is issued. The ARs are defined as the difference between the return at moment t and the expected return (Eq. (1)). This difference is defined according to the methodology of adjusted mean return. The adjusted mean return is calculated following Hill and Faff (2010) as the mean return between 230 and 30 days of trading previous to the day when the rating signal is issued.6
where the subscript t refers to the trading day and subscript i, to the bank analysed. ARit refers to the abnormal return of bank i on day t. Rit refers to the return on shares of bank i on day t. Finally, E(Rit), refers to the expected return of bank i on day t.
Abnormal returns, ARit, cumulated during consecutive days give what are known as cumulative abnormal returns (CARs). To analyse the impact of banks’ issuer rating signals on CARs, the period defined as event includes the abnormal returns cumulated between the day when the issuer rating signal was issued and the next day (t=0 and t=1). These short windows prevent contamination problems from other ratings signals as shown by Gande and Parsley (2005).
To analyse the impact of rating signals on the abnormal returns of banks’ shares the following Eq. (2) is estimated.7
where CARit refers to the cumulated abnormal return during the period in which the event occurs (t and t+1) in bank i, that is, the day when the issuer rating signal was issued and the next day. Pratingit is a dummy variable that takes a value equal to one if the rating of bank i is upgraded, and zero otherwise. Nratingit is a dummy variable that takes a value equal to one if the rating of bank i is downgraded, and zero otherwise. In order to capture together the effect on CARs of the possible rating changes in the short and medium term, outlooks are defined not only as outlooks as they are by the rating agencies, but also as watchlists. Poutit is a dummy variable taking a value equal to one if the rating is placed on the watchlist or outlook for a possible upgrade or has been confirmed after having been placed on the watchlist or outlook for a possible downgrade. Likewise, Noutit is a dummy variable taking a value equal to unity if the rating has been placed on the watchlist or outlook for a possible downgrade or has been confirmed after having been placed on the watchlist or outlook for a possible upgrade. Last_Indexit is the rating – measured by the index defined previously – of bank i immediately before the event.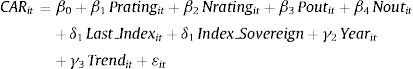
To control for the economic cycle of the country in which the bank's shares are listed, the long-term sovereign rating of each agency is introduced (Index_Sovereign).8 As the Bank for International Settlements (2011) points out, there are different channels through which the changes in sovereign creditworthiness can affect banks’ creditworthiness. Banks hold domestic sovereign debt and use sovereign securities as collateral to access the funding of central banks. At the same time, the sovereign guarantees bank assets by providing public resources to avoid bank defaults. Furthermore, Borensztein et al. (2013) point out that the sovereign risk is transmitted to the non-sovereign issuer through restrictive measures, and administrative and capital controls. Therefore, a worsening in sovereign creditworthiness negatively affects banks’ issuer ratings. In this context, Williams et al. (2013) and Alsakka et al. (2014), among others, provide evidence of the effects of changes in sovereign ratings on the bank's issuer ratings.
Additionally, to control for possible time effects this paper considers a set of year dummy variables: Yearit, which takes a value equal to one if the share is quoted in a given year and zero otherwise. A continuous time variable, Trendit, is also considered corresponding to the month in which the event occurs.
The estimation of Eq. (2), following Ferreira and Gama (2007) and Alsakka et al. (2016), is based on a sample of ratings events days matched with an equal number of non-event ratings collected randomly from all the non-event days in the sample. Furthermore, with the aim of ensuring that returns do not reflect market noise and rating clustering, following Ferreira and Gama (2007) and Alsakka et al. (2016), the non-event days are excluded from the 30 days previous to and following (t−30, t+30) days when a rating signal is issued. At the same time, also removed are the signals issued by one agency that reacts to ratings signals issued in the previous 15 days (t−15) by another agency, the agency itself or reactions to previous signals in the sovereign ratings.
4.2Effect of stock market variations on bank ratingsA second question of interest is the possibility that the rating agencies are not immune to pressure occurring in the financial markets, and consequently react to variations in the stock markets. To answer this question, following the procedure of Afonso et al. (2012) a Granger causality test is calculated, where the ratings signals are estimated according to the previous changes in banks’ share returns.
where ΔIndexit refers to the rating signals occurring in the bank analysed i between days t and t−1. ΔARit refers to the variation of the abnormal return on the share (i) between days t and t−1. The causality test consists of testing the joint significance of all coefficients accompanying the lagged variables. If all lagged variables turn out to be significant, the implication is that the past abnormal returns cause (in the Granger sense) the variations in ratings. That is, if in Eq. (3) past values of the variation of abnormal returns are jointly significant, changes in the stock markets will cause, in the Granger sense, variations in the ratings. This would imply that in their reaction to the events occurring in the financial markets the rating agencies do not completely follow a medium/long-term (through-the-cycle) strategy as they defend in their methodological reports.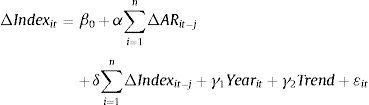
In order to control for the possible time effects in which the shares of bank i are quoted, a year dummy variable and a continuous variable (Trend) are introduced that refer to the year and the month of quotation. Because the causal relationship is analysed in the short-term context, as in Afonso et al. (2012) the number of lags is restricted from 1 day, 1 week (5 working days) and 2 weeks (10 working days).
One concern about this procedure is that Granger causality does not necessarily imply true causality if there is a potential non-controlled factor that could be driving the ratings changes. Given that this paper considers daily data, it is difficult to reconcile such information with that of the financial statements of banks in order to include some additional factors (such as profitability, leverage, efficiency, and so on) that may be causing the observed relationship in the Granger causality tests. For this reason, the robustness of the causality test is tested with an alternative approach. The procedure of Salvador et al. (2014) is followed, in which the bank ratings are estimated in accordance with the variables that measure profitability, own resources, liquidity, efficiency, size, credit risk management, the economic environment in which the banks mainly carry out their activity, and an indicator that explicitly measures the perception and the volatility of the returns on banks’ shares (the beta). If the coefficient of this variable is statistically significant, it will imply that rating agencies follow the evolution of the stock market when issuing their ratings.
Therefore, as in other studies in the literature, an ordered probit model with individual fixed effects is used.9 This model in turn considers the possible structural change in the rating agency behaviour as a consequence of the financial crisis. To do this, as in Salvador et al. (2014), a dummy variable (CS) is considered which takes a value equal to unity for the quarters after the start of the crisis, and zero otherwise. This variable also interacts with the variables that determine the rating. Consequently, if the coefficient accompanying the interaction of this dummy with any explanatory variable is statistically non-zero, it means that during the crisis period the effect of this factor has changed and, with it, the behaviour of the rating agency. The specification of Eq. (4) is therefore as follows:
where, Yit* is a latent variable, which is a linear function of a set of explanatory variables xit−1 selected according to the methodological reports of Standard and Poor (2011a,b), Fitch (2009, 2011), Fitch (2012) and Moody's (2007a,b), and some previous studies such as Bellotti et al. (2011) and Salvador et al. (2014). Specifically, these variables measure profitability, efficiency, capital, size, credit risk management, the economic and legal environment and the variations that occur in the financial markets. The variables, which are included in Eq. (4), were extracted from the Bloomberg and Bankscope database and are listed as described in what follows.
In order to test the hypothesis of whether or not rating agencies are immune to the pressure occurring in the financial markets, the beta of the banks’ shares is considered. This variable (Beta) is obtained by regressing the returns on banks’ shares against the representative index in which the bank is listed. In this line, another important credit risk factor is loan quality. As no information is available on doubtful assets, we use as proxy the ratio of the provisions for doubtful credits to total assets (Loanloss).
One important factor in measuring the bank's creditworthiness is profitability, as it captures the resources that protect it from the risks inherent to the activity that it performs (Moody's, 2007a). In this context, this factor has commonly been used in different studies on modelling bank ratings (Caporale et al., 2011; Hammer et al., 2012; Salvador et al., 2014). This factor is measured by the ratio between pre-tax profits and total assets (ROA).
Another key factor in the evaluation of the bank's asset situation is its solvency level, as it acts as a measure of absorption of losses in the event of running into difficulties. This factor is measured as the quotient between equity and total assets (Capital).
The high competition normally faced by credit institutions and the standardisation of banking products have led banks to reduce their net margin. In this vein, with the aim of optimising costs and increasing profitability, efficiency is another important factor that determines the rating. Efficiency is captured through the cost to income ratio defined as the quotient between operating expenses – overheads – and the net margin (Efficiency). According to this ratio, a higher value means a higher level of inefficiency, because a higher percentage of the net margin will be used to cover operating expenses.
Liquidity is also considered, since lack of liquidity can lead to a bank's failure (Fitch, 2011; Moody's, 2007a). This factor is captured by the ratio between customers deposits and total assets (Liquidity).
Another important factor modelling bank ratings is size (Caporale et al., 2011; Shen et al., 2012; Salvador et al., 2014). This is because greater size is assumed to imply greater external support from the economic authorities in the event of the bank getting into difficulties (the too-big-to-fail hypothesis). This hypothesis is based on the argument that the economic authorities will try to avoid the failure of the large banks due to the possible systemic effect on the economy as a whole. Thus, size is considered as the logarithm of total assets (Size).
As Moody's (2007a) state, banks can be negatively affected by weak legal and/or political environments. In this context, Fitch (2011) points out that the analysis of the economic environment is the starting point for analysing the banks’ asset situation. For this reason, according to the index defined, the numerical value of the long-term sovereign rating of each agency is also considered (Index_Sovereign).
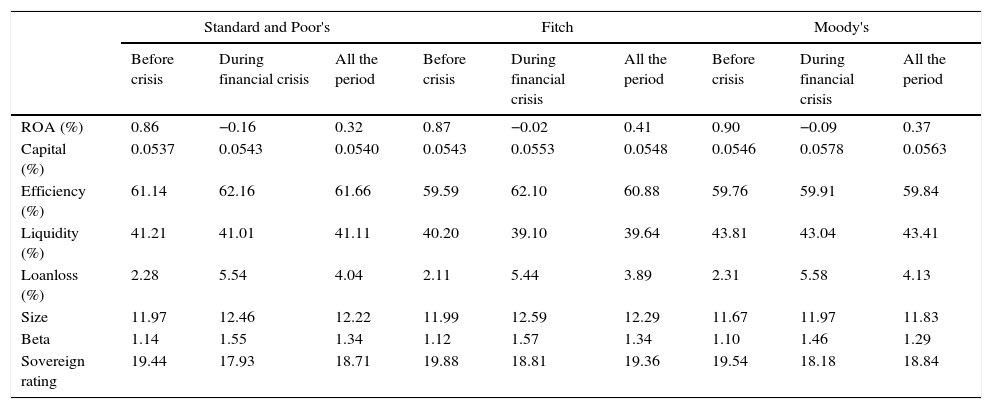
Table 3 presents the mean values of each of these variables in the periods before and during the financial crisis. In general terms, the financial crisis was accompanied by a worsening of the banks’ asset situation as reflected in the falling levels of profitability, liquidity, size, and the respective sovereign ratings. The quality of the assets on the balance sheet also fell, as shown by the increased level of loan loss provisions. Despite this worsening creditworthiness, we note that there was an increase in the levels of capital and efficiency. The increase in capital levels can be explained both by the requirement from regulators to increase the level of capital and by the injections of capital many banks received from the economic authorities. Likewise, the improvement in efficiency may be due to the initial reforms carried out in the restructuring process of some banking sectors through mergers, acquisitions and other reforms. Finally, we note that during the financial crisis investors’ perceptions of bank risks changed, as shown by the increase in volatility of the returns on banks’ shares in comparison with the returns of the reference index in which the bank is listed.
Average values of the creditworthiness factors and the volatility of returns on banks’ shares.
| Standard and Poor's | Fitch | Moody's | |||||||
|---|---|---|---|---|---|---|---|---|---|
| Before crisis | During financial crisis | All the period | Before crisis | During financial crisis | All the period | Before crisis | During financial crisis | All the period | |
| ROA (%) | 0.86 | −0.16 | 0.32 | 0.87 | −0.02 | 0.41 | 0.90 | −0.09 | 0.37 |
| Capital (%) | 0.0537 | 0.0543 | 0.0540 | 0.0543 | 0.0553 | 0.0548 | 0.0546 | 0.0578 | 0.0563 |
| Efficiency (%) | 61.14 | 62.16 | 61.66 | 59.59 | 62.10 | 60.88 | 59.76 | 59.91 | 59.84 |
| Liquidity (%) | 41.21 | 41.01 | 41.11 | 40.20 | 39.10 | 39.64 | 43.81 | 43.04 | 43.41 |
| Loanloss (%) | 2.28 | 5.54 | 4.04 | 2.11 | 5.44 | 3.89 | 2.31 | 5.58 | 4.13 |
| Size | 11.97 | 12.46 | 12.22 | 11.99 | 12.59 | 12.29 | 11.67 | 11.97 | 11.83 |
| Beta | 1.14 | 1.55 | 1.34 | 1.12 | 1.57 | 1.34 | 1.10 | 1.46 | 1.29 |
| Sovereign rating | 19.44 | 17.93 | 18.71 | 19.88 | 18.81 | 19.36 | 19.54 | 18.18 | 18.84 |
Note: The table shows the mean of the factors that define the financial situation of the banks evaluated for each rating agency, along with perception and volatility of the returns on banks’ shares (beta). These values are shown for the pre-crisis period, during the financial crisis and for the entire period.
This section presents the results of the estimation of Eq. (2), which analyses the effect of bank rating signals on cumulative abnormal returns (CARs). In order to analyse the possible impact of the financial crisis, Eq. (2) is estimated separately for the periods before and since the start of the financial crisis. It is evident that the financial crisis entailed a structural change in the relationship of these variables.
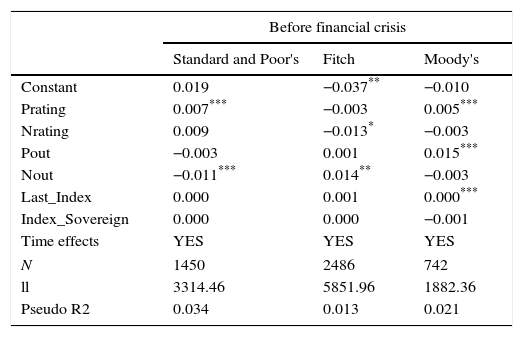
Table 4 captures the results of the estimation of Eq. (2), which analyses the impact of the different rating signals issued by Standard and Poor's, Fitch and Moody's, on the CARs during the period before the financial crisis.10 The results indicate that in Standard and Poor's, rating upgrades (Prating) have a significant positive effect on CARs, specifically, an increase of 0.7%. Similarly, the negative outlooks (Nout) imply a decrease in CARs of 1.1%. If we compare the effect of negative and positive rating signals, we find that negative signals have a greater effect on CARs than positive signals. In part, this could be explained by the fact that during a period of economic growth, investors might be less likely to expect a negative signal issued by a rating agency than a positive signal.
Effect of rating signals on cumulative abnormal returns before the crisis. Dependent variable: cumulative abnormal returns (CARs) during the event.
| Before financial crisis | |||
|---|---|---|---|
| Standard and Poor's | Fitch | Moody's | |
| Constant | 0.019 | −0.037** | −0.010 |
| Prating | 0.007*** | −0.003 | 0.005*** |
| Nrating | 0.009 | −0.013* | −0.003 |
| Pout | −0.003 | 0.001 | 0.015*** |
| Nout | −0.011*** | 0.014** | −0.003 |
| Last_Index | 0.000 | 0.001 | 0.000*** |
| Index_Sovereign | 0.000 | 0.000 | −0.001 |
| Time effects | YES | YES | YES |
| N | 1450 | 2486 | 742 |
| ll | 3314.46 | 5851.96 | 1882.36 |
| Pseudo R2 | 0.034 | 0.013 | 0.021 |
Note: Results of the estimation of Eq. (2) for Standard & Poor's, Fitch, and Moody's during the pre-crisis period. CAR refers to cumulative abnormal return at the time of the event. Prating (Nrating) is equal to unity if the issuer rating of the bank is upgraded (downgraded) and zero otherwise. Pout (Nout) is a dummy variable taking a value equal to one if a rating is placed on a watchlist or outlook for a possible upgrade (downgrade) of the rating or if the rating is confirmed after having been placed on a watchlist or outlook for a possible downgrade (upgrade). Last_Index is the rating of bank immediately before the event. Index_Sovereign is the long-term sovereign rating of the country in which the bank's shares are listed. Finally, a set of year dummy variables is included, as well as a tendency (Trend) referencing the month of quotation to capture the time effects. All the equations are estimated by pooled OLS as different tests were performed to determine whether or not the individual effects associated with each bank are significant.
Similarly, for the case of Fitch, the results suggest that during the period before the crisis a downgrade in rating (Nrating) implies a decrease in CARs of 1.3%. Conversely, we note that negative outlook (Nout) has a significant and positive effect on CARs. One explanation for this latter result may be that during the pre-crisis period, outlooks were less common among the different types of ratings signals, so investors expected a downgrade only when a negative outlook had been issued.
Lastly, in the case of Moody's, the results (Table 4) show that only positive rating signals have a significant effect on CARs. Specifically, the rating upgrades (Prating) and positive outlook (Pout) signals imply an increase in CARs of 0.5% and 1.5%, respectively. This result reflects how investors increase their investment in the shares of those banks to which Moody's issues a positive signal. Furthermore, it should be highlighted that the impact of the signals issued is greater for the higher rating levels, as reflected in the positive and significant coefficient of the Last_Index variable.
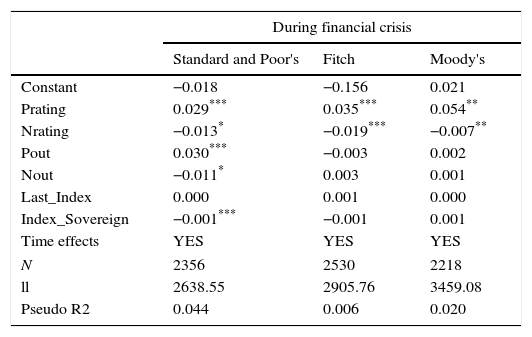
Table 5 shows the results of the estimation of Eq. (2) for each of the agencies analysed during the financial crisis period. On comparing the results presented in Table 5 with the results before the crisis (Table 4), we observe a significant change in the effect of the rating signals on the CARs. In Standard and Poor's, at the start of the crisis both the ratings changes and outlooks have the expected sign and a significant effect on the CARs. Specifically, for the positive signals, the results show that rating upgrades (Prating) and positive outlooks (Pout) imply an increase in CARs of 2.9% and 3%, respectively. The significant and positive effect can be interpreted as an improvement in the expectations of the asset situation of the banks evaluated. Likewise, the results for this agency show that rating downgrades and negative outlooks have a significant effect on CARs of −1.3 and 1.1 percentage points, respectively. This implies that investors perceive the negative rating signals as a deterioration in the expectations of the financial situation of the banks evaluated.
Effect of rating signals on cumulative abnormal returns in the crisis. Dependent variable: cumulative abnormal returns (CARs) during the event.
| During financial crisis | |||
|---|---|---|---|
| Standard and Poor's | Fitch | Moody's | |
| Constant | −0.018 | −0.156 | 0.021 |
| Prating | 0.029*** | 0.035*** | 0.054** |
| Nrating | −0.013* | −0.019*** | −0.007** |
| Pout | 0.030*** | −0.003 | 0.002 |
| Nout | −0.011* | 0.003 | 0.001 |
| Last_Index | 0.000 | 0.001 | 0.000 |
| Index_Sovereign | −0.001*** | −0.001 | 0.001 |
| Time effects | YES | YES | YES |
| N | 2356 | 2530 | 2218 |
| ll | 2638.55 | 2905.76 | 3459.08 |
| Pseudo R2 | 0.044 | 0.006 | 0.020 |
Note: Results of the estimation of Eq. (2) for Standard & Poor's, Fitch, and Moody's during the financial crisis. CAR refers to cumulative abnormal return at the time of the event. Prating (Nrating) is equal to unity if the issuer rating of the bank is upgraded (downgraded) and zero otherwise. Pout (Nout) is a dummy variable taking a value equal to one if a rating is placed on a watchlist or outlook for a possible upgrade (downgrade) of the rating or if the rating is confirmed after having been placed on a watchlist or outlook for a possible downgrade (upgrade). Last_Index is the bank's rating immediately before the event. Index_Sovereign is the long-term sovereign rating of the country in which the bank's shares are listed. Finally, a set of year dummy variables is included, as well as a tendency (Trend) referencing the month of quotation to capture the time effects. All the equations are estimated by pooled OLS as different tests are performed to determine whether or not the individual effects associated with each bank are significant.
If we compare the effect of the different types of signals, we note that the positive signals have a greater effect on CARs than negative signals. In part, this could be because during a period of a financial distress investors may be less likely to expect a positive signal issued by a rating agency than a negative signal. Furthermore, the results support the hypothesis that outlooks have a similar effect in the market to rating changes (e.g. Hill and Faff, 2010; Afonso et al., 2012; Alsakka and Gwilym, 2013). In this context, the International Monetary Fund (2011) report states that the rating agencies have a certification role in the regulation mainly through issuing outlooks and watchlists for possible changes in the rating. Finally, it must be emphasised, as reflected by the significant negative coefficient of the sovereign rating (Index_Sovereign), that banks’ abnormal returns are lower and the ratings signals have a greater impact in those countries where the financial crisis was less intense.
In the case of Fitch, as in the period before the crisis, their rating downgrades (Nrating) have a negative and significant effect on the banks’ abnormal returns. Specifically, these signals lead to a decrease in CARs of 1.9 percentage points. However, unlike the pre-crisis period, the ratings upgrades (Prating) have a significant effect on CARs of 3.5 percentage points. Thus, these results indicate that investors interpret the ratings signals of this agency as a change in the credit risk of the banks evaluated. Additionally, as in the case of Standard and Poor's, the upgrades ratings have a higher effect than the downgrades, as this type of signal is less likely to be expected by investors during a period of financial distress in which the rating agencies, in general, adjust downwards the banks’ ratings.
Finally, in Moody's, the results (Table 5) show that with the financial crisis, as we expected, ratings changes have a significant effect on CARs. In this sense, the downgrades (Nrating) and upgrades (Prating) ratings lead to a decrease in CARs of 0.7% and 5.4%, respectively. Furthermore, for this agency the positive signals (less expected) are also found to have a greater effect than negative signals.
In sum, although with the onset of the subprime crisis the rating agencies were accused of relaxing their criteria during the period of economic growth, the rating signals continue to have a significant impact on the financial markets.11 Investors react not only to negative rating signals but also to positive ratings signals. Even in a context of economic downturn when most banks experienced a significant worsening of their financial situation, and consequently, underwent a downward adjustment in ratings, positive signals have a greater effect on CARs than negative signals, as investors are less likely to expect the former. Lastly, it should be highlighted that the different effect of ratings on banks’ share returns suggests that investors react differently to the rating announcements issued by each rating agency.
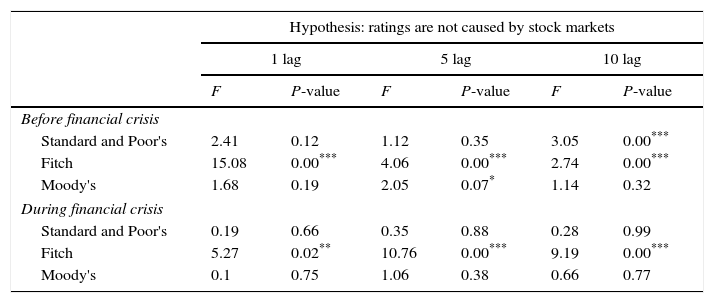
5.2Causal relationship between ratings signals and stock marketsThis section presents the results of the analysis of the causal relationship between the variations occurring in ratings and returns on banks’ shares, based on the estimation of Eqs. (3) and (4). To this end, Table 6 reports the results of the Granger test for the periods before and since the start of the financial crisis. Likewise, Table 7 displays the results of the estimation of Eq. (4) that models the so-called issuer bank ratings in accordance with the changes that occur in the stock markets and the factors that define their creditworthiness according to the methodological reports of the rating agencies and the previous literature.
Granger causality test, before and during the financial crisis.
| Hypothesis: ratings are not caused by stock markets | ||||||
|---|---|---|---|---|---|---|
| 1 lag | 5 lag | 10 lag | ||||
| F | P-value | F | P-value | F | P-value | |
| Before financial crisis | ||||||
| Standard and Poor's | 2.41 | 0.12 | 1.12 | 0.35 | 3.05 | 0.00*** |
| Fitch | 15.08 | 0.00*** | 4.06 | 0.00*** | 2.74 | 0.00*** |
| Moody's | 1.68 | 0.19 | 2.05 | 0.07* | 1.14 | 0.32 |
| During financial crisis | ||||||
| Standard and Poor's | 0.19 | 0.66 | 0.35 | 0.88 | 0.28 | 0.99 |
| Fitch | 5.27 | 0.02** | 10.76 | 0.00*** | 9.19 | 0.00*** |
| Moody's | 0.1 | 0.75 | 1.06 | 0.38 | 0.66 | 0.77 |
Note: Eq. (4) is estimated taking into account the time effects when the share is listed. To test the joint significance of the coefficients accompanying the lagged variable (previous changes in the abnormal returns) that cause, in the sense of Granger, the endogenous variable (ratings signals), the F-statistic and the corresponding P-value are computed. The number of lags in each of the tests is 1, 5, and 10, corresponding to 1 day, 1 week and 2 weeks, respectively. Panels I and II refer to the period before and during the financial crisis, respectively.
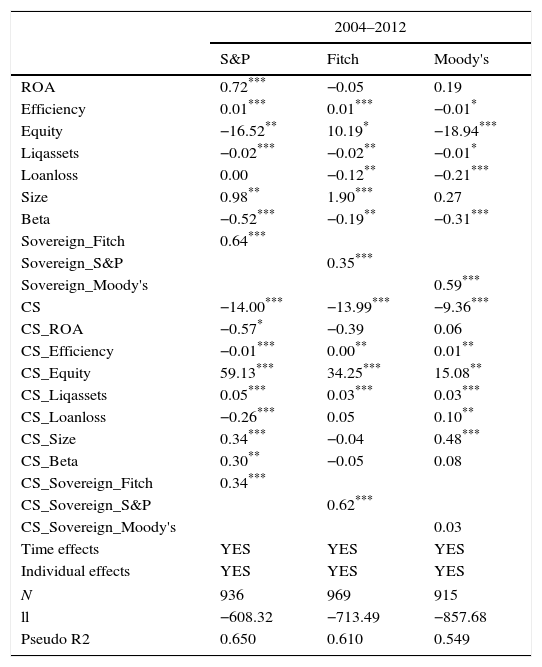
Ordered probit model. Probability of obtaining a certain rating according to the changes occurring in the stock markets, and the creditworthiness of the banks evaluated.
| 2004–2012 | |||
|---|---|---|---|
| S&P | Fitch | Moody's | |
| ROA | 0.72*** | −0.05 | 0.19 |
| Efficiency | 0.01*** | 0.01*** | −0.01* |
| Equity | −16.52** | 10.19* | −18.94*** |
| Liqassets | −0.02*** | −0.02** | −0.01* |
| Loanloss | 0.00 | −0.12** | −0.21*** |
| Size | 0.98** | 1.90*** | 0.27 |
| Beta | −0.52*** | −0.19** | −0.31*** |
| Sovereign_Fitch | 0.64*** | ||
| Sovereign_S&P | 0.35*** | ||
| Sovereign_Moody's | 0.59*** | ||
| CS | −14.00*** | −13.99*** | −9.36*** |
| CS_ROA | −0.57* | −0.39 | 0.06 |
| CS_Efficiency | −0.01*** | 0.00** | 0.01** |
| CS_Equity | 59.13*** | 34.25*** | 15.08** |
| CS_Liqassets | 0.05*** | 0.03*** | 0.03*** |
| CS_Loanloss | −0.26*** | 0.05 | 0.10** |
| CS_Size | 0.34*** | −0.04 | 0.48*** |
| CS_Beta | 0.30** | −0.05 | 0.08 |
| CS_Sovereign_Fitch | 0.34*** | ||
| CS_Sovereign_S&P | 0.62*** | ||
| CS_Sovereign_Moody's | 0.03 | ||
| Time effects | YES | YES | YES |
| Individual effects | YES | YES | YES |
| N | 936 | 969 | 915 |
| ll | −608.32 | −713.49 | −857.68 |
| Pseudo R2 | 0.650 | 0.610 | 0.549 |
Note: Results of the estimation of the model (Eq. (4)) for the issuer rating issued by each rating agency in accordance with to the changes that occurs in the stock markets, and the creditworthiness of the banks evaluated. This model includes individual effects and time fixed effects.
Table 6 shows that the previous changes in the abnormal returns are significantly related with the ratings signals issued by the three rating agencies before the crisis. The fact that the lagged values of the change in the abnormal returns are significant in Eq. (3) implies that the rating agencies were not immune to the variations occurring in the stock markets before the crisis. Consequently, during this period the ratings issued by the three rating agencies do not totally follow the “through-the-cycle” strategy, despite what they claim in their methodological reports as pointed out by Bangia et al. (2002) and Salvador et al. (2014), among others.
During the crisis period Table 6 shows that the null hypothesis of non-significance of the lagged values of the variations in the abnormal returns can be rejected only for the case of Fitch. Therefore, these results seem to suggest that only in this agency do the ratings seem not to be totally independent of the pressures occurring in the financial markets. In contrast, the ratings issued by Moody's and Standard and Poor's during the crisis seem to be more independent of variations in the financial markets.
One drawback of the Granger causality test is that it does not necessarily imply true causality if the variables under analysis are driven by a different common process. To test if there is a potential bias caused by non-controlled factors, an ordered probit model is estimated in which the ratings are explained by a set of determinants which include an indicator that explicitly measures the perception and the volatility of the returns on banks’ shares. In this case, Table 7 shows the results of the estimation of Eq. (4) that models the issuer bank ratings considering, among other factors, the beta of the banks’ shares. It can be appreciated that the rating agencies take into account the variations occurring in the financial markets because the beta of the returns on banks’ shares is significant and negative in the estimations. That means that higher volatility, or systematic risk, of a bank share in comparison to the stock market lowers the probability of obtaining a higher rating. It should be noted that in the case of Standard and Poor's this effect changed with the onset of the financial crisis. Specifically, the beta coefficient is positive in the crisis period; however, the total effect of this variable (the sum of the coefficients with and without the interaction with CS) in this period is still negative. Therefore, these results are consistent with those obtained in the causality test, showing that rating agencies are not totally immune of the changes occurring in the stock markets. Although it should be highlighted that this effect decreased during the period of financial crisis, when doubts increased regarding the behaviour of the three principal rating agencies (Fitch, Standard and Poor's and Moody's) and the quality of the ratings issued.
6ConclusionsThis paper analyses the effect that issuer rating signals have on the returns on shares of the European banks during 2004–2012, enabling us to determine whether investors respond to bank rating announcements. Furthermore, this period allows us to test the differential impact that the financial crisis may have had on the effect of issuer signals on the returns on bank shares. With the outbreak of the subprime crisis and the subsequent sovereign debt crisis in the peripheral countries of the European Union (Portugal, Ireland, Italy, Greece and Spain), banks experienced a significant worsening of their financial situation (Laeven and Valencia, 2013; European Central Bank, 2008a,b). At the same time the rating agencies were accused of relaxing their rating criteria during the period of economic growth up to the start of the subprime crisis (Securities and Exchange Commission, 2008). In this context, while stable ratings and positive rating signals dominated before the crisis, once the crisis began negative signals prevailed.
To analyse the impact of bank rating signals on abnormal share returns, the cumulative abnormal returns are regressed on the changes in ratings, watchlists and outlooks during the period before and during the financial crisis. The results show that before the financial crisis positive rating signals issued by Standard and Poor's and Moody's, and negative ratings signals issued by Fitch and Standard and Poor's have a significant effect on the return on banks’ shares. On the other hand, during the crisis and the subsequent financial uncertainty, investors react not only to rating downgrades as expected, but also to rating upgrades. In that case, the positive signals have the greatest effect, as these signals are less expected during a period of financial distress. Furthermore, the results suggest that investors do not react with the same intensity to the ratings signals issued by the rating agencies.
When analysing the possible causal relationship between banks’ issuer ratings and their abnormal stock returns, mainly during the pre-crisis period the results offer evidence supporting the hypothesis that ratings do not remain totally immune to changes in the financial markets. Thus these results call into question the rating agencies’ claim that they strictly follow a “through-the-cycle” strategy as they state in their methodological reports. However, with the crisis and in response to the criticisms received, Standard and Poor's reacts less in response to the changes in the financial markets, in an attempt to place more weight on rating stability.
Overall, these results provide evidence that although the rating agencies are in the firing line because of the mistakes made before the start of the crisis, their ratings continue to have a significant impact on the financial markets (Bank of England, 2011). This highlights the importance of the authorities increasing the regulation and supervision of rating agencies, since ratings have a significant impact on the stability of the financial markets.
Carlos Salvador Muñoz acknowledges the financial help of Spain's Ministry of Education and Science through research program (ECO2015-67656-P).
Ratings scale of the rating agencies and the numerical scale defined.
| Fitch | Standard and Poor's | Moody's | ||||
|---|---|---|---|---|---|---|
| Rating | Scale | Rating | Scale | Rating | Scale | |
| Investment | AAA | 20 | AAA | 20 | Aaa | 20 |
| AA+ | 19 | AA+ | 19 | Aa1 | 19 | |
| AA | 18 | AA | 18 | Aa2 | 18 | |
| AA− | 17 | AA− | 17 | Aa3 | 17 | |
| A+ | 16 | A+ | 16 | A1 | 16 | |
| A | 15 | A | 15 | A2 | 15 | |
| A− | 14 | A− | 14 | A3 | 14 | |
| BBB+ | 13 | BBB+ | 13 | Baa1 | 13 | |
| BBB | 12 | BBB | 12 | Baa2 | 12 | |
| BBB− | 11 | BBB− | 11 | Baa3 | 11 | |
| Speculative | ||||||
| Speculative | BB+ | 10 | BB+ | 10 | Ba1 | 20 |
| BB | 9 | BB | 9 | Ba2 | 19 | |
| BB− | 8 | BB− | 8 | Ba3 | 18 | |
| B+ | 7 | B+ | 7 | B1 | 17 | |
| B | 6 | B | 6 | B2 | 16 | |
| B− | 5 | B− | 5 | B3 | 15 | |
| CCC+ | 4 | CCC+ | 4 | Caa1 | 14 | |
| CCC | 3 | CCC | 3 | Caa2 | 13 | |
| CCC− | 2 | CCC− | 2 | Caa3 | 12 | |
| CC | 1 | CC | 1 | Ca | 11 | |
| C | 1 | C | 1 | C | 2 | |
| D | 1 | D | 1 | D | 1 | |
| WR | – | WR | – | WR | – | |
Note: As the numerical scale decreases, the credit quality also decreases as the probability of default increases. The bottom categories are grouped, due to the small number of observations in the sample.
For instance, Caixa Ontinyent or Caja de Ahorros de Vitoria y Alava were subjected to the 2011 EU stress test but they are not listed.
Specifically, the issuer rating in Fitch is called “Long Issuer Default Rating” and in Moody's “Long Term Bank Deposits Ratings”. Standard and Poor's, as in previous studies about bank ratings including Williams et al. (2013) and Alsakka et al. (2014), consider issuer long-term foreign currency rating.
The start of the crisis is dated as 15 September 2008 when Lehman Brothers was officially declared bankrupt, with the consequent negative effects on the finance markets as shown by Afonso et al. (2012).
0.5 points are added (subtracted) in the case of positive (negative) watchlists because this type of signal indicates the possibility of rating changes in the short term (three months). On the other hand, in the case of outlooks 0.25 points are added (subtracted) since these signals indicate a possible upgrade (downgrade) of the ratings in the medium-long term (from 1 to 2 years).
In the case of public holidays, the price is taken to be that corresponding to the last day of trading, t−1, to calculate the return on shares.
Although the results were not included in this study as a measure of robustness, as in Brooks et al. (2004) expected return between 120 and 21 days prior to the event is calculated. The results are fairly similar to those presented.
These models are estimated following a data pool model. It is also analysed whether it was appropriate to consider a random effects model or a fixed effects model by analysing the proportion of the variance of the disturbance explained by the random effects. The results showed that in all cases this proportion is nil and consequently it is not appropriate to consider a random effects model. Furthermore, the Breusch and Pagan Lagrangian test of whether it is appropriate to consider a simple OLS with fixed effects as opposed to a random effects model indicates that in all cases a simple OLS with individual effects is preferable to a random effects model. Various tests were performed to determine whether the individual effects associated with each bank are significant or not. It was considered whether the individual effects were jointly significant; results showed that they were not. Therefore, the tests indicate that estimating a data pool model is preferable to a panel data model. Furthermore, in order to prevent potential heteroscedasticity and/or autocorrelation problems in the residuals, as in Gande and Parsley (2005), Ferreira and Gama (2007) and Arezki et al. (2011), Eqs. (2)–(4) are estimated considering a White correction on the standard deviation of the estimated coefficients.
As in the case of the bank ratings, the sovereign rating was also converted to a numeric scale as specified in Annex 1.
As Greene (2003) notes, the results of the estimations with logit and probit models are practically the same. The main difference between the two specifications lies essentially in the form of the accumulative distribution function. The probit model assumes a normal accumulative distribution function, while the logit model assumes a logistical accumulative distribution. The precision of this specification has been demonstrated in previous studies modelling bank ratings, of which Caporale et al. (2011), Öğüt et al. (2012), Shen et al. (2012), Salvador et al. (2014) are particularly noteworthy.
The number of observations for each regression does not coincide with the number of observations in Table 2 because in some cases different events occur at the same time. For example, the issuer rating of the Spanish Bank Banco Popular was downgraded from BBB− to BB+ and placed in negative outlook on May 25, 2012.
Therefore, the results are in accordance with the asymmetric information hypothesis raised by Abad-Romero and Robles-Fernandez (2006), among others. This hypothesis is based on the fact that ratings contain information on firms’ future financial outlook that is unknown to the financial markets. Therefore, a downgrade (upgrade) in the rating due to a negative (positive) financial outlook for the bank implies a reduction (increase) in the price and in the returns of its shares.

