


This paper analyses the risk-taking behavior of a fund manager in response to prior performance by conducting a comparative analysis between ethical and conventional investment portfolios. We examine the influence on managerial risk taking of the compensation and employment incentives. Our analysis looks at the British and Italian markets. We find differences in behavior between the two groups, with ethical investment portfolios managers enjoying greater freedom for shifting the risk taken. We can also see a greater influence of employment incentives in risk decision taking with respect to the managers of conventional investment portfolios. The results we have obtained are very similar for both the British and Italian markets.
The influence of prior mutual fund performance on mutual fund managers’ attitude to risk is a matter of interest that has been broadly covered in finance literature. Brown et al. (1996) are the first to analyze in their seminal study the influence that the incentives arising from the asymmetrical structure of the relationship between performance and fund flow have on the fund managers’ attitude to risk. Huang et al. (2007) and other authors, show that while the mutual funds with the best prior performance are those that attract the greatest amount of inflows, the funds with the worst prior performance did not suffer proportional outflows.
Bearing in mind that the managers’ wages depend in part on the assets they manage (Khorana, 1996), a compensation incentive arises. Fund managers seek to hold themselves in the best possible place in the year-end performance-based rankings in order to attract the greatest amount of inflow and thereby maximize their salaries. Brown et al. (1996) show how this incentive creates tournament behavior among mutual fund managers, meaning that those who occupy the lowest positions in the ranking at the end of the first part of the year (interim losers) increase their level of risk to a greater extent than those fund managers in the best positions (interim winners), in an attempt to catch up with them.
There has been much research in this area, showing empirical evidence for or against the results from Brown et al. (1996). Among those reporting empirical evidence in favor are Goriaev et al. (2001) and Basak et al. (2008), among others. Empirical evidence against this hypothesis is shown by Qiu (2003) and Goriaev et al. (2005), among others.
Other authors associate the thesis proposed by Brown et al. (1996) with a number of determining factors. For example Busse (2001) considers that such behavior varies depending on modifications to the frequency of data, while Taylor (2003) shows the benchmark as being the triggering event of the strategic response of fund managers. The study from Hallahan et al. (2008) argues against Taylor's theory. Furthermore, Kempf and Ruenzi (2008) believe that the size of the fund management company also influences its behavior.
Others focus on the risk of termination or employment incentives – the possibility that the fund manager might lose his or her job – as being the main factor determining the behavior of the fund manager with respect to risk (e.g., Qiu, 2003). Kempf et al. (2009) argue that in a bearish market employment incentives dominate, while compensation incentives are more common in a bullish market. They can also see that when compensation incentives prevail, the lowest ranking fund managers over the first part of the year are those who increase risk-taking in the second part of the year to the greatest extent. When employment incentives are foremost, on the other hand, the opposite occurs.
In this study, we analyze whether or not the ranking obtained by a fund based on its performance over the first part of the year has an influence on behavior, compared to the risk taken by the fund manager in the second part of the year. We conduct this analysis from the perspective of a comparison between ethical and conventional mutual funds.
We also extend the analysis to examine whether or not there is a difference in behavior depending on whether compensation or employment incentives dominate and whether or not both types of incentives influence mutual fund managers in the same way, regardless of whether they manage ethical or conventional funds.
The most interesting point of this study is the comparative analysis of risk-taking behavior of conventional and ethical fund managers in response to prior performance, as to the best of our knowledge no prior research examines this matter in the case of socially responsible mutual funds. The boom in recent years of ethical mutual funds both in Europe and elsewhere highlights the importance of examining the behavior of fund managers and investors in mutual funds of this nature. Furthermore, bearing in mind that ethical funds not only pursue financial interests but also have more socially orientated objectives, it is reasonable to surmise that their behavior differs in certain aspects.
With respect to ethical mutual funds, the topic most frequently analyzed by researchers is a comparison of their financial performance with that of conventional investment funds. Certain authors have found evidence in favor of ethical funds (e.g., Derwall and Koedijk, 2009), while others have presented evidence to the contrary, (e.g., Renneboog et al., 2008). There is also research that argues that there are no significant differences in the levels of financial performance of both types of funds, as proposed by Cummings (2000); Kreandert et al. (2005); and Bauer et al. (2007).
Behavioral finance literature also examines socially responsible investment. Such is the case of research that examined the behavior of investors, as seen in Geczy et al. (2003), Renneboog et al. (forthcoming, 2007), and Bollen (2007).
Investor behavior is of particular interest in our paper, and it further justifies the comparative study of ethical and conventional fund managers. The fact that the ethical mutual fund investor shows himself as more sensitive to positive prior performance and less sensitive to negative prior performance suggests a structure that is even more asymmetrical, in the performance-fund flow relationship, and thus there are even greater incentives for fund managers to take on additional risk. In other words, ethical mutual fund managers enjoy greater flexibility to modify the risk taken.
The remainder of the paper is structured as follows. In the second section, we explain the growing importance of the ethical mutual fund industry, especially in the two countries we study. Section 3 describes the database used in our analysis. Section 4 presents our methodology. Section 5 provides empirical results. Section 6 contains a series of tests to confirm the robustness of the findings. Finally, Section 7 concludes.
2British and Italian ethical mutual fund marketsAn ethical mutual fund functions in exactly the same way as a conventional fund, with one fundamental difference. When selecting the investments that will make up the portfolio, managers not only consider criteria such as return and risk but also a range of ecological, social and ethical aspects. This type of mutual fund is aimed at investors who not only wish to ensure maximum returns with minimum risk but also seek a series of related social objectives, including, for example, the environment, the encouragement of human rights in certain areas and the promotion of good corporate governance practices.
Ethical mutual fund portfolios are comprised of carefully selected companies who have passed through a strict ethical screen. An Ethics Committee is responsible for analyzing negative screens that will prevent the financing of pre-determined activities (e.g., companies that are in breach of certain ethical principles, such as human rights), as well as positive screens that seek to influence business attitudes by working towards more sustainable development therefore providing incentives in the form of investment for companies that act in a socially responsible manner.
Countries in which socially responsible investment is most common have seen a gradual growth in Social Investment Forums that aim to promote such activity by running informative campaigns, publicly advising as to good business practices and facilitating dialogue and the dissemination of information regarding the ethical investment industry. In North America, it is worth mentioning the US Social Investment Forum and the Social Investment Organization (SIO) in Canada. Seven similar institutions have already been set up in Europe (in the United Kingdom, the Netherlands, Germany, France, Italy, Switzerland and Belgium) with others planned (e.g., Spain, Norway, and Austria). In Asia, there is for example the Association for Sustainable & Responsible Investment in Hong Kong, as well as the Ethical Investment Association in Australia.
In 2001, the European Social Investment Forum (EUROSIF) was founded, a non-profit-making pan-European association set up to promote sustainability in financial markets, thanks to the efforts of five national social investment forums: France, Germany, Italy, the Netherlands and the UK, who together have basically established the direction the organization will take and the strategy it is to adopt. The importance of socially responsible investment, on both a European and global level, has continued to grow year after year. This has led to the appearance of financial instruments through which investors are able to channel their ethical investment.
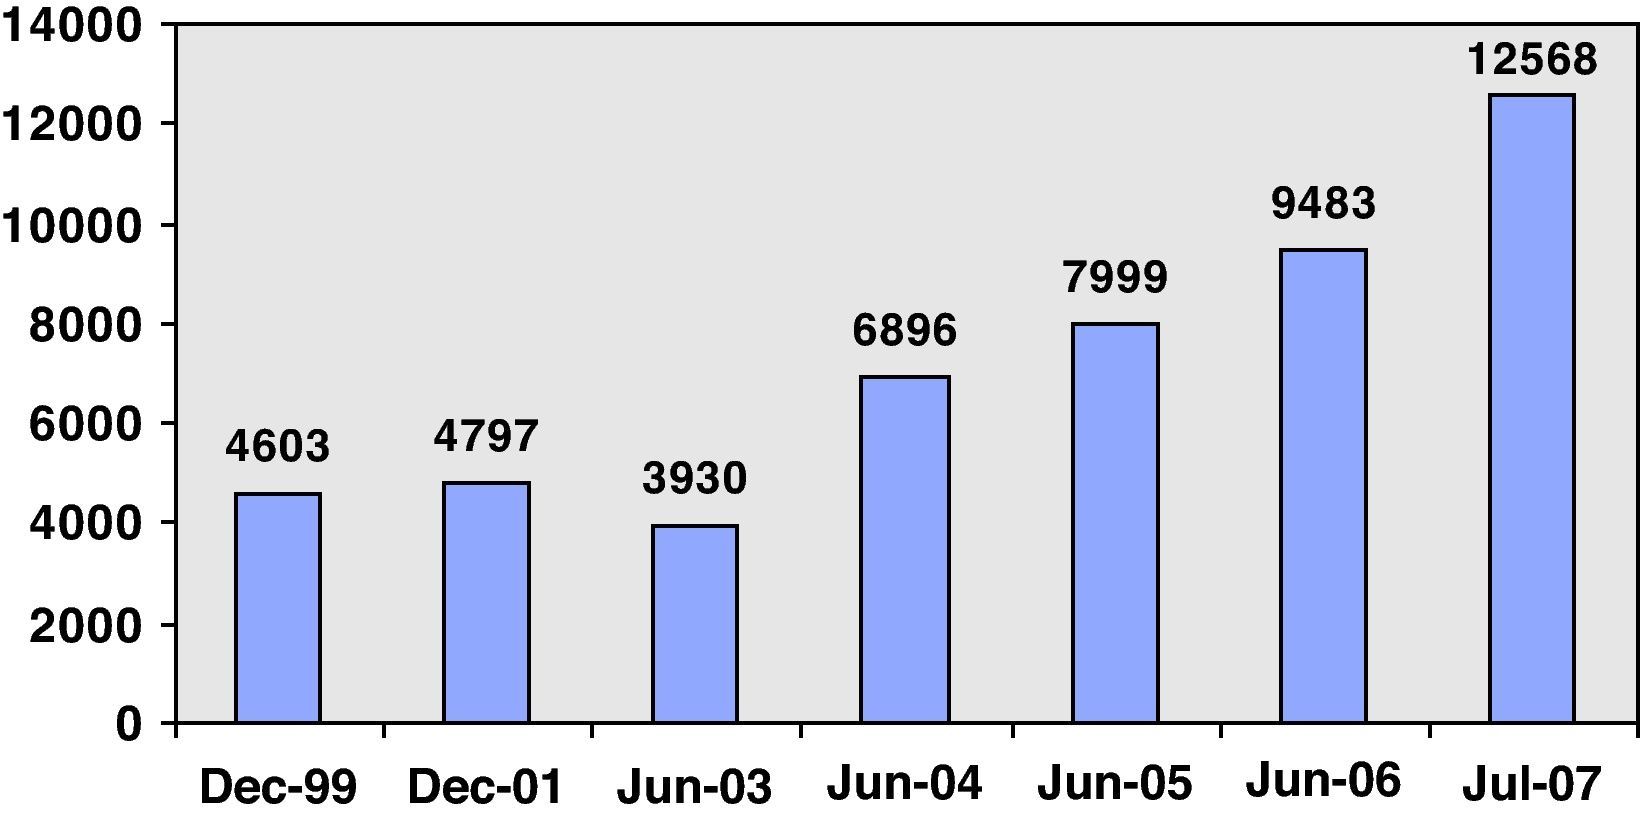
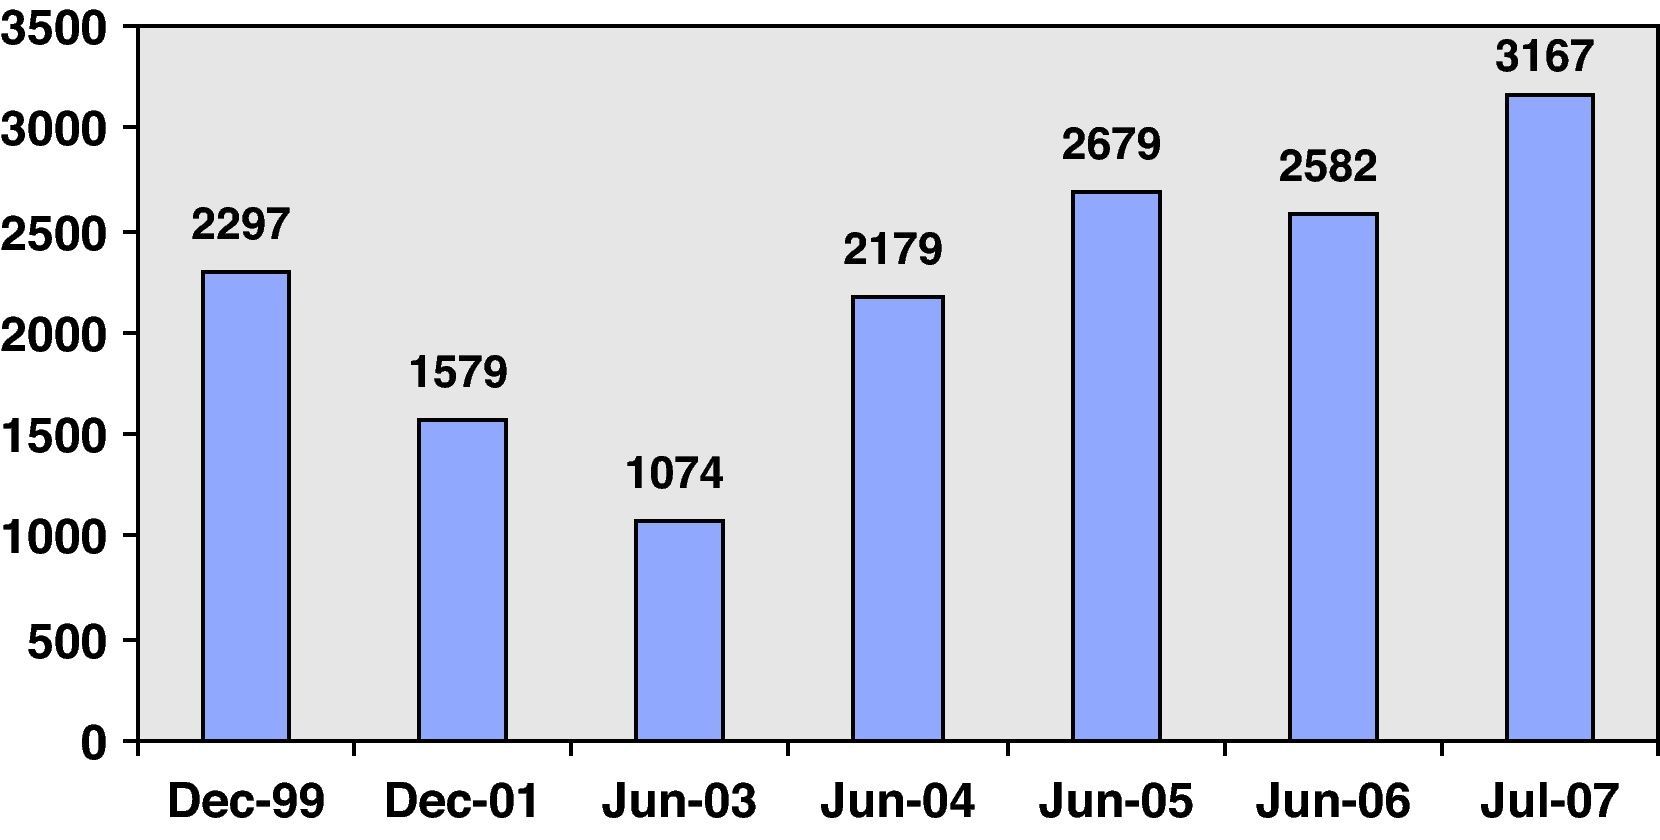
One of the most important instruments is the ethical mutual fund. Their significance can be seen in Figs. 1 and 2, which show the evolution of total assets managed by ethical mutual funds in the British and Italian markets, respectively, over the past few years.
. Graph 1 shows the evolution of total assets managed by UK ethical mutual funds from December 1999 to July 2007. The data were obtained from reports drawn up by the SIRI (Sustainable Investment Research International) Group.")
Evolution of total assets managed by British ethical mutual funds (€ millions).
Graph 1 shows the evolution of total assets managed by UK ethical mutual funds from December 1999 to July 2007. The data were obtained from reports drawn up by the SIRI (Sustainable Investment Research International) Group.
. Graph 2 shows the evolution of total assets managed by Italian ethical mutual funds from December 1999 to July 2007. The data were obtained from reports drawn up by the SIRI (Sustainable Investment Research International) Group.")
Evolution of total assets managed by Italian ethical mutual funds (€ millions).
Graph 2 shows the evolution of total assets managed by Italian ethical mutual funds from December 1999 to July 2007. The data were obtained from reports drawn up by the SIRI (Sustainable Investment Research International) Group.
In the case of the British market in Fig. 1, we can easily see important growth from December 1999 to July 2007, with the exception of the period between December 2001 and June 2003 during which there was a minor recession that can be explained by the economic crisis at that time in financial markets on a global level. We can also see, however, the significance of the amount of total assets managed by socially responsible mutual funds in the British market as of July 2007, reaching the sum of €12568 million, representing an increase of 173% with respect to the equivalent figure in December 1999.
In the Italian market (Fig. 2) the total assets managed by ethical mutual funds also grew, generally speaking, in spite of two periods of recession between December 1999 to June 2003 and from June 2005 to June 2006. However, although these figures are below those returned by the British market, the total assets managed by this type of investment fund in Italy in July 2007 rose to €3167 million, representing an increase of 38% with respect to the start of the period analyzed. From these figures, it is clear that from both a professional and an academic perspective that it is of great interest to examine the ethical mutual fund industry in the UK and Italy.
3DataThe database contains the monthly returns of all global equity (GE) mutual funds, both of a conventional and ethical nature, as registered for sale in British1 and Italian markets for the period between January 1994 and December 2007. Our database is free of survivorship bias, as we also include those funds that did not survive the whole period examined.
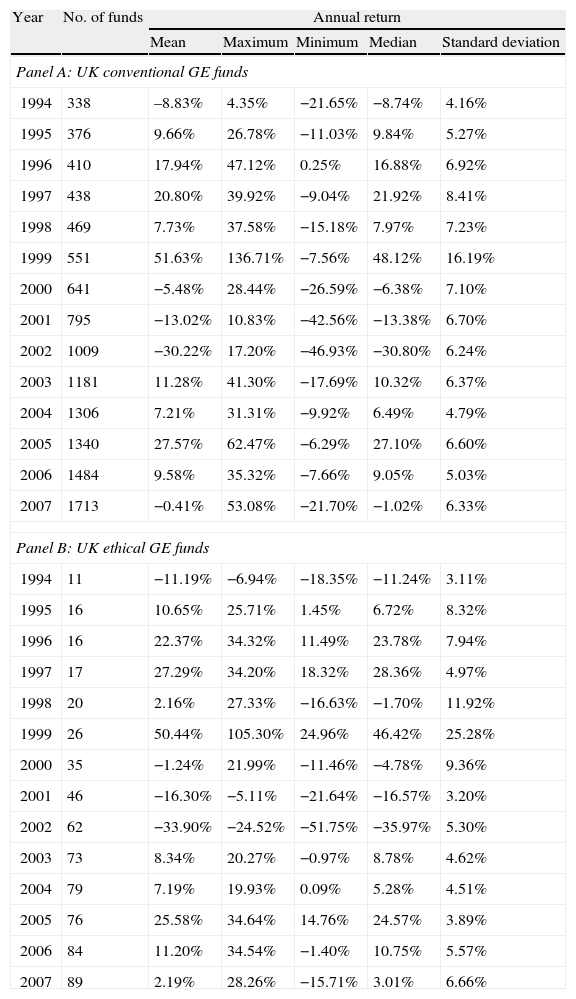
All funds with less than 12 monthly returns a year are eliminated from our study in order to guarantee the statistical robustness of empirical analysis. Given that global funds, by definition, have no geographical limitations with respect to investment, the MSCI World has been used as the benchmark index. The summary statistics of the sample are presented here in Tables 1 and 2, for British funds and Italian funds, respectively.
Summary statistics for British ethical and conventional GE fundsa.
| Year | No. of funds | Annual return | ||||
| Mean | Maximum | Minimum | Median | Standard deviation | ||
| Panel A: UK conventional GE funds | ||||||
| 1994 | 338 | –8.83% | 4.35% | −21.65% | −8.74% | 4.16% |
| 1995 | 376 | 9.66% | 26.78% | −11.03% | 9.84% | 5.27% |
| 1996 | 410 | 17.94% | 47.12% | 0.25% | 16.88% | 6.92% |
| 1997 | 438 | 20.80% | 39.92% | −9.04% | 21.92% | 8.41% |
| 1998 | 469 | 7.73% | 37.58% | −15.18% | 7.97% | 7.23% |
| 1999 | 551 | 51.63% | 136.71% | −7.56% | 48.12% | 16.19% |
| 2000 | 641 | −5.48% | 28.44% | −26.59% | −6.38% | 7.10% |
| 2001 | 795 | −13.02% | 10.83% | −42.56% | −13.38% | 6.70% |
| 2002 | 1009 | −30.22% | 17.20% | −46.93% | −30.80% | 6.24% |
| 2003 | 1181 | 11.28% | 41.30% | −17.69% | 10.32% | 6.37% |
| 2004 | 1306 | 7.21% | 31.31% | −9.92% | 6.49% | 4.79% |
| 2005 | 1340 | 27.57% | 62.47% | −6.29% | 27.10% | 6.60% |
| 2006 | 1484 | 9.58% | 35.32% | −7.66% | 9.05% | 5.03% |
| 2007 | 1713 | −0.41% | 53.08% | −21.70% | −1.02% | 6.33% |
| Panel B: UK ethical GE funds | ||||||
| 1994 | 11 | −11.19% | −6.94% | −18.35% | −11.24% | 3.11% |
| 1995 | 16 | 10.65% | 25.71% | 1.45% | 6.72% | 8.32% |
| 1996 | 16 | 22.37% | 34.32% | 11.49% | 23.78% | 7.94% |
| 1997 | 17 | 27.29% | 34.20% | 18.32% | 28.36% | 4.97% |
| 1998 | 20 | 2.16% | 27.33% | −16.63% | −1.70% | 11.92% |
| 1999 | 26 | 50.44% | 105.30% | 24.96% | 46.42% | 25.28% |
| 2000 | 35 | −1.24% | 21.99% | −11.46% | −4.78% | 9.36% |
| 2001 | 46 | −16.30% | −5.11% | −21.64% | −16.57% | 3.20% |
| 2002 | 62 | −33.90% | −24.52% | −51.75% | −35.97% | 5.30% |
| 2003 | 73 | 8.34% | 20.27% | −0.97% | 8.78% | 4.62% |
| 2004 | 79 | 7.19% | 19.93% | 0.09% | 5.28% | 4.51% |
| 2005 | 76 | 25.58% | 34.64% | 14.76% | 24.57% | 3.89% |
| 2006 | 84 | 11.20% | 34.54% | −1.40% | 10.75% | 5.57% |
| 2007 | 89 | 2.19% | 28.26% | −15.71% | 3.01% | 6.66% |
aPanel A shows the number of British conventional global equity portfolios (mutual funds, pension funds,...) that make up the sample for each of the years 1994–2007 covered by our research. It also reports the mean, the maximum, the minimum and the median, as well as the standard deviation of the annual returns. Panel B shows the same information as Panel A but for ethical UK GE funds.
Summary statistics for Italian ethical and conventional GE fundsa.
| Year | No. of funds | Annual return | ||||
| Mean | Maximum | Minimum | Median | Standard deviation | ||
| Panel A: Italian conventional GE funds | ||||||
| 1994 | 57 | −6.99% | 13.12% | −23.08% | −7.02% | 5.91% |
| 1995 | 62 | 8.12% | 38.99% | −7.87% | 8.76% | 7.45% |
| 1996 | 72 | 15.38% | 28.46% | −12.57% | 16.49% | 5.98% |
| 1997 | 79 | 24.53% | 38.19% | −21.60% | 24.56% | 8.52% |
| 1998 | 100 | 13.21% | 61.79% | −33.16% | 14.23% | 10.95% |
| 1999 | 126 | 48.54% | 135.97% | 0.19% | 46.18% | 19.83% |
| 2000 | 174 | −5.24% | 35.36% | −44.10% | −6.58% | 11.97% |
| 2001 | 244 | −12.83% | 25.77% | −62.06% | −13.17% | 9.32% |
| 2002 | 340 | −30.84% | 23.62% | −63.78% | −32.39% | 7.79% |
| 2003 | 409 | 8.80% | 39.87% | −5.19% | 7.35% | 6.41% |
| 2004 | 451 | 4.51% | 25.03% | −6.23% | 4.34% | 4.52% |
| 2005 | 473 | 23.53% | 62.47% | −24.47% | 23.20% | 7.96% |
| 2006 | 552 | 7.32% | 33.98% | −4.80% | 7.08% | 4.73% |
| 2007 | 616 | −0.69% | 31.17% | −15.43% | −1.80% | 6.78% |
| Panel B: Italian ethical GE funds | ||||||
| 1994 | 1 | – | – | – | – | – |
| 1995 | 2 | 3.06% | 7.05% | −0.93% | 3.06% | 5.65% |
| 1996 | 2 | 12.23% | 16.71% | 7.76% | 12.23% | 6.33% |
| 1997 | 2 | 17.90% | 18.29% | 17.50% | 17.90% | 0.56% |
| 1998 | 5 | 14.13% | 39.60% | −4.18% | 6.09% | 18.54% |
| 1999 | 6 | 38.89% | 74.30% | 5.07% | 40.11% | 23.41% |
| 2000 | 9 | −1.54% | 15.47% | −24.08% | 0.58% | 12.95% |
| 2001 | 14 | −13.68% | −5.53% | −19.03% | −13.38% | 3.80% |
| 2002 | 23 | −33.73% | −27.08% | −51.75% | −33.63% | 5.14% |
| 2003 | 33 | 8.05% | 19.76% | −0.97% | 8.58% | 4.61% |
| 2004 | 34 | 4.61% | 18.34% | −0.41% | 3.93% | 4.23% |
| 2005 | 36 | 21.17% | 27.08% | 8.08% | 22.83% | 4.99% |
| 2006 | 38 | 8.51% | 22.06% | −1.40% | 7.83% | 5.23% |
| 2007 | 42 | 1.11% | 28.26% | −9.03% | −1.49% | 8.11% |
aPanel A shows the number of Italian conventional global equity funds that make up the sample for each of the years 1994–2007 covered by our research. It also reports the mean, the maximum, the minimum and the median, as well as the standard deviation of the annual returns. Panel B shows the same information as Panel A but for ethical Italian GE funds. Panel B does not include information regarding 1994 as there was only one fund in existence.
We can see very similar patterns of behavior in the return on both ethical and conventional funds in Italy and the UK. In fact, in both markets and for both types of mutual funds, it is worth comparing average returns for 1999 (around 50%) for 2005 (around 20%) and for 2002 (return of around 30%, although negative). In 2000, 2006, and 2007, ethical fund performance outperformed conventional funds in terms of average return, both in Italy and in Britain. In fact, ethical funds outperformed conventional funds in average return in 6 out of the 14 years we examined in the UK and 5 out of 14 in Italy. In general, a greater difference between the average return of ethical and conventional funds was detected in the case of Italy, although such variations were not of much significance.
Using these monthly returns as a basis, we calculate the position that a fund we shall call i occupies in the ranking at the end of the first part of year t (the first part corresponds to the first 7 months, as we will explain later). These rankings have been drawn up for each of the geographical regions we have studied.
A fund ranking (Rit) is computed by comparing the total return obtained by the fund i at the end of the first part of the year relative to the total returns of the competing funds in its segment. Funds are ordered from greatest to least total return and assigned a number in descending order. For example, if we have a group of 10 funds, that in the first position (the highest return) will be given number 10 and that with the lowest return is assigned number 1. In order to be able to compare the results and given that the number of funds varies between years and countries, we seek to normalize the rankings in such a way that the numbers assigned to the funds are evenly distributed between 0 and 1. The funds which have shown the best performance will be given a Rit closer to 1, while those that performed the worst will receive a Rit closer to zero.
4MethodologyIn this section, we measure the influence of prior performance on the manager's risk exposure. Then, we introduce compensation and employment incentives into the model.
4.1The influence of prior performance on assumed riskIn order to measure the influence of performance over the first part of the year on the risk-taking behavior of mutual fund managers in the second part, we use a parametric approach model in which we include dummy variables in order to differentiate between conventional and ethical fund behavior. Starting with the proposal put forward by Kempf and Ruenzi (2008) for tournament measurement within a group of funds, we suggest the following pooled regression (1), which includes dummy variables in order to make the aforementioned distinction:
where Δσit represents the variations in risk experienced by fund i, between the second and the first part of the year in the given year t. σit(2) (σit(1)) represent the risk assumed by fund i in the second (first) part of year t. Risk is measured based on the annualized standard deviation of monthly returns on a fund. The first (second) part of the year, according to financial literature, includes the first 7 months (5 last months) of the year (see, for example, Brown et al., 1996; Kempf and Ruenzi, 2008).
β1 and β2 are the coefficients on the ranking obtained by fund i by the end of the first part of the year (Rit). A significant (β1,β2) value would indicate that prior performance has an influence on the fund manager's risk-taking behavior. If (β1,β2) is negative, this will mean tournament behavior, in which the interim losers – the fund managers with the worst ranking at the end of the first part of the year – increase the levels of risk exposure to a greater extent than interim winners. On the other hand, a positive (β1,β2) implies the existence of strategic tournament behavior whereby it is the interim winners who proportionally increase risk exposure the most.
Rit is the ranking obtained by fund i by the end of the first part of year t, meaning that the nearer to 1, the better the performance, with values closer to 0 meaning worse results. DC (DE) is a dummy on Rit, which takes the value of 1 (0) if fund i is a conventional fund or 0 (1) if it is an ethical fund.
Δσit(m) is the variation in the volatility of all the funds analyzed over period t. It is introduced as a control variable and is calculated as the difference between σit(m2) and σit(m1), in other words, the median standard deviation in the second and the first part of the year, respectively.
In line with other financial analyses of the matter (Daniel and Wermers, 2000), σit(1) is also introduced as a control variable that represents the average reversion of fund volatility. In other words, the fund managers set objective risk levels; when these are exceeded in the first part of the year, they tend to be reduced in the second. Then the funds that assumed lower risk in the first part of the year (below the target risk level) take on greater levels in the second part.
Finally, the regression (1) includes a dummy variable for each year of the sample to control for year-specific effects.
4.2Compensation and employment incentivesRegression (1) allows the influence of fund prior performance on the risk-taking behavior of ethical and conventional fund managers to be determined. However, these results may be biased, as compensation incentives are only implicitly included through their ranking, without taking into account other aspects that fund managers bear in mind when taking their final decision as to their level of risk exposure, such as termination risk or employment incentives. We modify regression model (1) for this reason, so that employment incentives can also be considered. We also seek to look further into this matter, providing comparative empirical evidence for both ethical and conventional mutual funds. The specific objective is to analyze whether or not ethical and conventional mutual fund managers are affected in different ways by compensation and employment incentives. The general objective is to put forward empirical evidence of this fact, not previously considered by the financial literature.
In order to determine which incentives dominate in each year, according to Kempf et al. (2009) and bearing in mind that the database is comprised of global funds that are able to invest without restriction anywhere they choose, we take as our benchmark the annual returns on the MSCI World over the years covered by our research (1994–2007). In order to identify in what years the markets were bearish or bullish, we determine that employment incentives are dominant in 4 years (2000, 2001, 2002 and 2004), while compensation incentives are dominant in the remaining years examined.
Following the proposal put forward by Kempf et al. (2009), the regression model (1) is modified to include new dummy variables in order to be able to differentiate the predominance of the different incentive types, obtaining the following regression model (4):
where DCI (DEI), is a dummy variable that takes on a value of 1 whenever compensation (employment) incentives dominate and 0 otherwise.5Empirical results
In this section we discuss the results from the regression model (1) and that from Eq. (4).
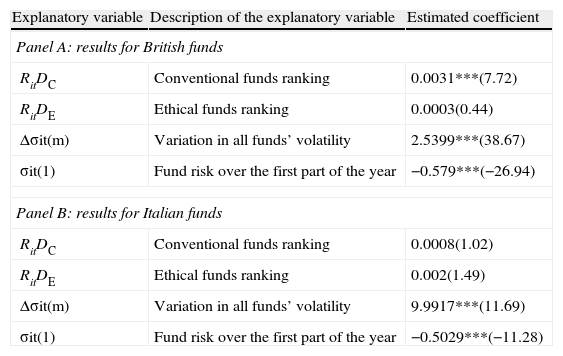
5.1Preliminary resultsThe results from the regression model (1) are shown in Table 3, which is comprised of panels A and B. Panel A shows the results from the pooled regression estimate (1) as applied to the British market, where the estimated coefficients are shown for the conventional fund ranking, the ethical fund ranking, the fund volatility variations and the fund risk over the first part of the year independent variables. The t-statistics associated with these coefficients are also shown. Panel B shows the same information for the Italian market. The empirical evidence varies depending on the market analyzed.
Risk taking in ethical and conventional mutual fundsa,b.
| Explanatory variable | Description of the explanatory variable | Estimated coefficient |
| Panel A: results for British funds | ||
| RitDC | Conventional funds ranking | 0.0031***(7.72) |
| RitDE | Ethical funds ranking | 0.0003(0.44) |
| Δσit(m) | Variation in all funds’ volatility | 2.5399***(38.67) |
| σit(1) | Fund risk over the first part of the year | −0.579***(−26.94) |
| Panel B: results for Italian funds | ||
| RitDC | Conventional funds ranking | 0.0008(1.02) |
| RitDE | Ethical funds ranking | 0.002(1.49) |
| Δσit(m) | Variation in all funds’ volatility | 9.9917***(11.69) |
| σit(1) | Fund risk over the first part of the year | −0.5029***(−11.28) |
aPanel A reports the results from the estimated pooled regression (1), as applied to British funds. The results shown are the estimated coefficients on the following explanatory variables: conventional funds ranking, ethical funds ranking, variation in all funds’ volatility and fund risk over the first part of the year. In brackets, next the estimated coefficients, is the associated t-ratio. Panel B sets out the same information for the Italian market.
b *,**,***Indicate that the coefficient is significant at 10%, 5% and 1% level, respectively.
For the British market, we detect the existence of strategic tournament behavior among conventional mutual fund managers. In other words, those managers with the highest ranking at the end of the first part of the year increased levels of risk in the second five months to a greater extent than fund managers occupying positions at the bottom of the table, given that the coefficient on the ranking variable with respect to conventional funds is positive and significant at a level of 1%, indicating a direct relationship between ranking and changes in risk exposure. These results broadly support those obtained by Chevalier and Ellison (1997) and Qiu (2003) and provide contrary evidence to that shown by Brown et al. (1996). However, analysis of the size of the coefficient shows that although positive, it is in fact very close to zero, indicating that any differences in risk behavior between conventional interim winners and losers are not of great significance.
For ethical funds, we obtain a ranking variable coefficient that, again, is positive but not significant, suggesting that the ethical fund managers are not overly influenced by prior performance when making risk-related decisions. Coefficients on the control variables are both, however, significant. The signs are as expected and reflect findings in previous research (see, for example, Kempf and Ruenzi, 2008).
The coefficient on the all funds’ volatility variation variable is positive, thus indicating that changes in fund volatility are positively influenced by the changes in volatility occurring in competing funds. The coefficient on the variable representing the fund's risk in the first part of the year is negative, indicating that fund managers are establishing objective levels of risk (see Daniel and Wermers, 2000), where the funds with risk levels above the objective over the first part of the year tend to reduce them during the second period and vice versa – the funds with risk levels below the objective during the first part of the year usually raise them in the second.
With respect to the Italian market, we see that neither conventional nor ethical fund managers take the prior performance into consideration when taking risk-orientated decisions. Thus, the ranking from the first part of the year does not affect risk variations in the second part of the year, given that coefficients on the ranking variable are not significant. Coefficients on the control variables are significant and show the expected sign.
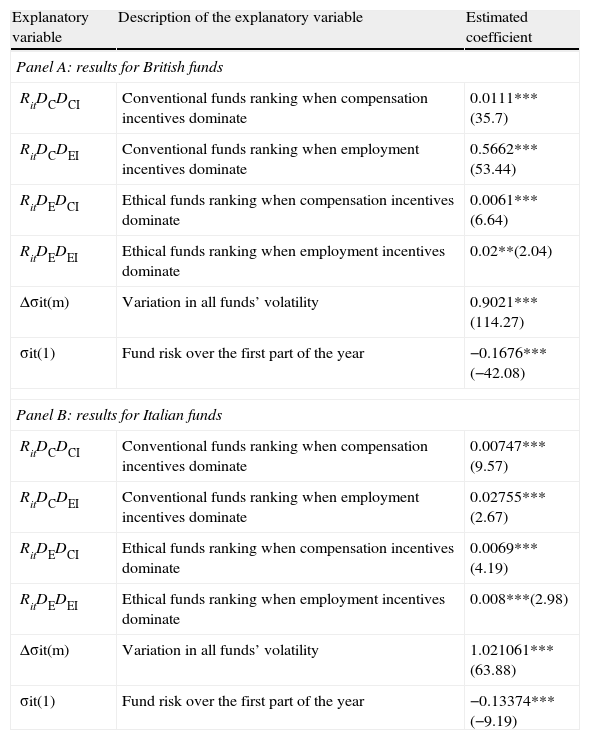
5.2Compensation and employment incentivesThe results from this second analysis on the influence that compensation and employment incentives have on fund manager behavior when dealing with risk can be seen in Table 42 which is comprised of Panel A and Panel B. Panel A shows the results of the regression model (4) for the UK, reporting the coefficients on the ranking of conventional funds when compensation incentives are dominant, the conventional fund ranking when employment incentives dominate, the ethical fund ranking when compensation incentives dominate, the ethical fund ranking when employment incentives dominate, the variations in the return volatility of the funds as a whole, and the fund risk over the first part of the year independent variables. The t-ratios associated with these coefficients are also shown. Panel B shows the same results for Italy.
Influence of compensation and employment incentives on the fund managers’ risk-taking behaviora,b.
| Explanatory variable | Description of the explanatory variable | Estimated coefficient |
| Panel A: results for British funds | ||
| RitDCDCI | Conventional funds ranking when compensation incentives dominate | 0.0111***(35.7) |
| RitDCDEI | Conventional funds ranking when employment incentives dominate | 0.5662***(53.44) |
| RitDEDCI | Ethical funds ranking when compensation incentives dominate | 0.0061***(6.64) |
| RitDEDEI | Ethical funds ranking when employment incentives dominate | 0.02**(2.04) |
| Δσit(m) | Variation in all funds’ volatility | 0.9021***(114.27) |
| σit(1) | Fund risk over the first part of the year | −0.1676***(−42.08) |
| Panel B: results for Italian funds | ||
| RitDCDCI | Conventional funds ranking when compensation incentives dominate | 0.00747***(9.57) |
| RitDCDEI | Conventional funds ranking when employment incentives dominate | 0.02755***(2.67) |
| RitDEDCI | Ethical funds ranking when compensation incentives dominate | 0.0069***(4.19) |
| RitDEDEI | Ethical funds ranking when employment incentives dominate | 0.008***(2.98) |
| Δσit(m) | Variation in all funds’ volatility | 1.021061***(63.88) |
| σit(1) | Fund risk over the first part of the year | −0.13374***(−9.19) |
aPanel A reports the results from the estimated pooled regression (4), as applied to British funds. The results shown are the estimated coefficients on the following independent variables: conventional funds ranking when compensation or employment incentives dominate, ethical funds ranking when compensation or employment incentives dominate, variation in all funds’ volatility and fund risk over the first part of the year. In brackets, next the estimated coefficients is the associated t-ratio. Panel B sets out the same information for the Italian market.
b *,**,***Indicate that the coefficient is significant at 10%, 5% and 1% level, respectively.
For British funds, the positive and significant coefficients obtained indicate the existence of strategic tournament behavior when both compensation and employment incentives are foremost, and regardless of whether ethical or conventional funds are under examination. Nevertheless, the most interesting results are obtained when comparing the size of the coefficients. For conventional funds, we noted a positive coefficient, although with a value which was very close to zero when compensation incentives dominated, and when employment incentives are dominant, the coefficient is high.
This indicates that when compensation incentives dominate, the behavior of interim winners and losers is similar. Nonetheless, when employment incentives are at the forefront, the fund managers with the best positions in the ranking during the first part of the year increase their levels of risk exposure in the second part of the year to a greater extent than interim losers. These results can be explained by the effect that employment incentives have on interim losers. In other words, they do not increase their risk exposure as much as interim winners due to their fear of losing their jobs. The same phenomenon can be observed, albeit to a lesser extent, in the case of ethical mutual funds.
Another interesting result is seen by comparing the size of coefficients from conventional and ethical funds. First, we compare the coefficient obtained when compensation incentives dominate. We see that in the case of conventional funds, despite being close to zero, the coefficient is larger than is the case with ethical funds, thus indicating greater similarity of behavior between ethical fund interim winners and losers than with conventional funds.
This would suggest that the ethical fund interim losers enjoy greater freedom to modify their levels of risk exposure compared to conventional fund interim losers. The explanation for this phenomenon lies in the more asymmetric structure of the performance-flow relationship in the case of ethical funds (Bollen, 2007), which tends to make investors more sensitive to prior positive returns yet less sensitive to negative prior returns when making decisions regarding asset allocation.
By comparing the coefficient obtained by conventional and ethical fund managers when employment incentives are dominant, we can see that it reaches higher values with conventional funds than with ethical funds. This would suggest that employment incentives have a greater effect on conventional fund interim losers than ethical fund interim losers. Once again, this result tells us that ethical fund interim losers enjoy greater freedom to modify the levels of risk exposure than their conventional counterparts. The coefficients on the control variables are significant, and show the expected signs.
For Italian funds, while the same behavior pattern as in the UK market is observed, the differences in the size of the coefficients are not as relevant.
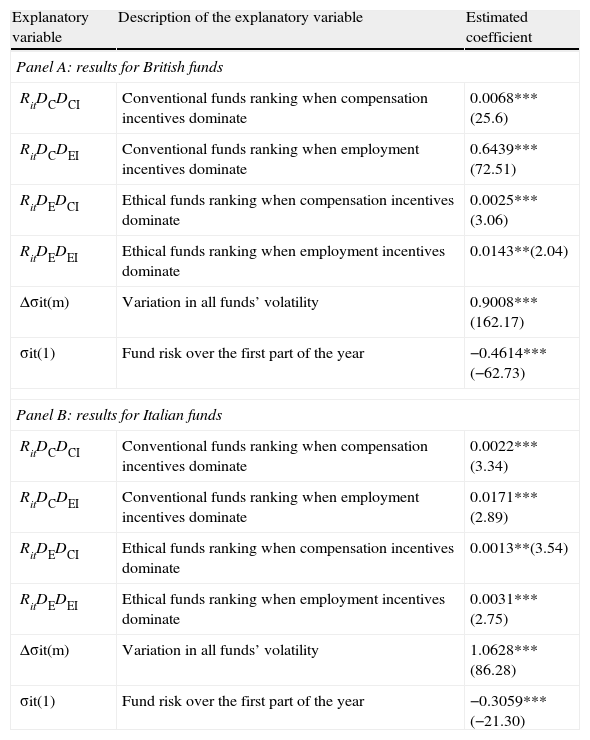
6Robustness analysisIn this section we conduct two tests in order to determine the robustness of the results obtained in the previous section. In the first one we use panel data with random effects and in the second one we apply a temporal sub-samples analysis.
6.1Empirical evidence from panel data with random effectsIn order to evaluate the robustness of the results set out in Table 4, another econometric method is applied that allows us to verify whether or not the results hold. We therefore create a regression model within the context of panel data with random effects. The results can be seen in Table 5.
Influence of compensation and employment incentives – panel data with random effectsa,b.
| Explanatory variable | Description of the explanatory variable | Estimated coefficient |
| Panel A: results for British funds | ||
| RitDCDCI | Conventional funds ranking when compensation incentives dominate | 0.0068***(25.6) |
| RitDCDEI | Conventional funds ranking when employment incentives dominate | 0.6439***(72.51) |
| RitDEDCI | Ethical funds ranking when compensation incentives dominate | 0.0025***(3.06) |
| RitDEDEI | Ethical funds ranking when employment incentives dominate | 0.0143**(2.04) |
| Δσit(m) | Variation in all funds’ volatility | 0.9008***(162.17) |
| σit(1) | Fund risk over the first part of the year | −0.4614***(−62.73) |
| Panel B: results for Italian funds | ||
| RitDCDCI | Conventional funds ranking when compensation incentives dominate | 0.0022***(3.34) |
| RitDCDEI | Conventional funds ranking when employment incentives dominate | 0.0171***(2.89) |
| RitDEDCI | Ethical funds ranking when compensation incentives dominate | 0.0013**(3.54) |
| RitDEDEI | Ethical funds ranking when employment incentives dominate | 0.0031***(2.75) |
| Δσit(m) | Variation in all funds’ volatility | 1.0628***(86.28) |
| σit(1) | Fund risk over the first part of the year | −0.3059***(−21.30) |
aPanel A reports the results from the estimated pooled regression (4), using panel data with random effects applied to a sample of British funds. The results shown are the estimated coefficients on the following explanatory variables: conventional funds ranking when compensation or employment incentives dominate, ethical funds ranking when compensation or employment incentives dominate, variation in all funds’ volatility and fund risk over the first part of the year. In brackets, next the estimated coefficients is the associated t-ratio. Panel B sets out the same information for the Italian market.
b *,**,***Indicate that the coefficient is significant at 10%, 5% and 1% level, respectively.
Table 5 is comprised of panels A and B. Panel A shows the results from estimating regression (4), using panel data with random effects as applied to a sample of funds from the British market. Reported are the estimated coefficients for: the ranking for conventional funds when compensation or employment incentives dominate; the ethical fund ranking when compensation or employment incentives dominate; the all funds’ volatility variations; and the fund risk over the first part of the year variables. Panel B shows the same information for the Italian market. We see that the results obtained are consistent with the analysis undertaken in the context of the pooled regression.
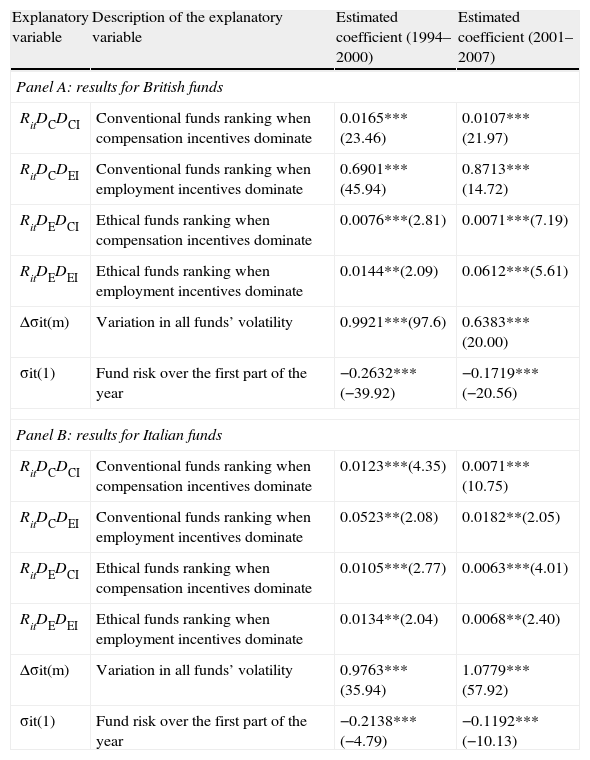
6.2Empirical evidence for temporal sub-samples analysisAs an additional robustness test of the influence of compensation and employment incentives on fund manager behavior with respect to risk, we seek to determine whether or not the results set out in Table 4 can be considered to be stable throughout the time horizon of our research (1994–2007). To this end, we carry out the same analysis on two temporal sub-samples of equal length: 1994–2000 and 2001–2007. The results can be seen in Table 6.
Influence of compensation and employment incentives – temporal sub-samplesa,b.
| Explanatory variable | Description of the explanatory variable | Estimated coefficient (1994–2000) | Estimated coefficient (2001–2007) |
| Panel A: results for British funds | |||
| RitDCDCI | Conventional funds ranking when compensation incentives dominate | 0.0165***(23.46) | 0.0107***(21.97) |
| RitDCDEI | Conventional funds ranking when employment incentives dominate | 0.6901***(45.94) | 0.8713***(14.72) |
| RitDEDCI | Ethical funds ranking when compensation incentives dominate | 0.0076***(2.81) | 0.0071***(7.19) |
| RitDEDEI | Ethical funds ranking when employment incentives dominate | 0.0144**(2.09) | 0.0612***(5.61) |
| Δσit(m) | Variation in all funds’ volatility | 0.9921***(97.6) | 0.6383***(20.00) |
| σit(1) | Fund risk over the first part of the year | −0.2632***(−39.92) | −0.1719***(−20.56) |
| Panel B: results for Italian funds | |||
| RitDCDCI | Conventional funds ranking when compensation incentives dominate | 0.0123***(4.35) | 0.0071***(10.75) |
| RitDCDEI | Conventional funds ranking when employment incentives dominate | 0.0523**(2.08) | 0.0182**(2.05) |
| RitDEDCI | Ethical funds ranking when compensation incentives dominate | 0.0105***(2.77) | 0.0063***(4.01) |
| RitDEDEI | Ethical funds ranking when employment incentives dominate | 0.0134**(2.04) | 0.0068**(2.40) |
| Δσit(m) | Variation in all funds’ volatility | 0.9763***(35.94) | 1.0779***(57.92) |
| σit(1) | Fund risk over the first part of the year | −0.2138***(−4.79) | −0.1192***(−10.13) |
aPanel A shows the results from the estimated pooled regression (4), as applied to a sample of British funds. Data has been divided into two time-based sub-samples – 1994–2000 and 2001–2007 – upon which analysis has been carried out. The results shown are the estimated coefficients on the following explanatory variables: conventional funds ranking when compensation or employment incentives dominate, ethical funds ranking when compensation or employment incentives dominate, variation in all funds’ volatility and fund risk over the first part of the year. In brackets, next the estimated coefficients is the associated t-ratio. Panel B sets out the same information for the Italian market.
b *,**,***Indicate that the coefficient is significant at 10%, 5% and 1% level, respectively.
Table 6 is comprised of panels A and B. Panel A shows the results obtained from the pooled regression (4) as applied to the sample of funds from the British market. The estimate is applied to sub-samples of two time periods, 1994–2000 and 2001–2007. Results are shown for the two sub-samples: the coefficients on the conventional funds ranking when compensation or employment incentives dominate; the ethical funds ranking when compensation or employment incentives dominate; the all funds’ volatility variations; and the fund risk over the first part of the year explanatory variables. Panel B sets out the same information for the Italian market. We see that the results obtained are consistent with those obtained from examination of the full time sample, for both markets and for the two temporal sub-samples, further confirming our conclusions.
7ConclusionsIn this paper, we analyzed the risk-taking behavior of mutual fund managers in response to prior performance. This is an area that has been widely studied, with extensive published research on fund manager and investor behavior. Nevertheless, to the best of our knowledge, a comparison has never been conducted between the behavior of ethical and conventional fund managers, the cornerstone of this study, which focused on funds operating in British and Italian markets. We also examined how compensation and employment incentives affect conventional and ethical fund managers. Our results allowed us to confirm the importance of this comparative study between the two types of mutual fund managers, as widely differing conclusions have been reached on the behavior observed between them.
The incentives that determine the level of risk exposure and that arise from the asymmetric structure of the performance–flow relationship are more intense in the case of ethical funds, which suggest that ethical fund managers are influenced by the prior performance of funds when taking risk-related decisions in a different way to the managers of conventional funds. In fact, ethical fund investors tend to be more sensitive to prior positive returns, yet less sensitive to negative returns when making decisions regarding asset allocation.
In our preliminary analysis, we saw weak evidence of strategic tournament behavior for British conventional global equity funds and the absence of prior performance having any influence on risk-taking behavior in various aspects of our study (British ethical global equity funds and Italian conventional and ethical global equity funds). However, by explicitly considering employment incentives, we observed strategic tournament behavior for both conventional and ethical mutual funds and for both the Italian and British markets.
Nonetheless, the comparison of the size of the coefficients provided us with empirical evidence that suggested a difference in the behavior depending on whether compensation or employment incentives dominate and whether the fund is conventional or ethical. Strategic tournament behavior of far greater significance is observed when employment incentives are foremost, which can be explained by the fear that interim losers have of losing their jobs.
In the case of the British market, we should highlight the effect that employment incentives have on interim losers, who do not increase their risk exposure as much as interim winners due to their fear to loss their jobs. This effect is not as noteworthy in the case of ethical fund managers. An analysis of the periods in which compensation incentives dominate indicates that ethical interim losers enjoy greater freedom to modify the levels of risk exposure than their conventional counterparts, a fact demonstrated by the existence of a positive coefficient, although less than that found for conventional fund managers and close to zero. This same pattern of behavior can also be seen for the Italian market, although to a lesser extent. The robustness tests we carried out confirmed the consistency of our results.

