


Stock market crashes are hazardous for financial stability and usually modeled via Poisson processes having a predetermined fixed intensity. This study uses a more general framework by allowing the intensity to be random in order to model rare events called the “unpredictable unknowns”. Three stock indices, namely Japan Nikkei 225, US Dow Jones Industrial Average and Turkish BIST 100 are analyzed. Simulation results indicate that in stable markets, we encounter fewer unpredictable unknowns compared to unstable ones. However, it is also shown that stable markets are more prone to severe financial crises.
Although there is no precise and universally accepted definition for the term “financial stability”, it is usually used in reference to steady growth, reasonable inflation and low unemployment. In the absence of financial stability, high fluctuations will be observed in asset prices. This type of environment leads banks and financial institutions to act in a more prudent manner. There will be credit crunches from banks, shares of risky assets will significantly diminish from portfolios and the volatility of stock prices increase considerably. Hence, movements of stock indices are generally regarded as key indicators of financial stability. A persistent rise in stock prices together with a moderate volatility can be regarded as stable. In case of sudden, unpredictable and sharp breaks, stability deteriorates. Thus, not surprisingly many models have been proposed for detection of breaks throughout the literature (for example Estrella and Mishkin, 1998; Davis and Karima, 2008; Hartmanna et al., 2008; Chen, 2009; Nyberg, 2013).
Peters (1994) proposes the Fractal Market Hypothesis (FMH) by taking the pioneering study of Mandelbrot (1982) as benchmark. His critique is mainly focused on the well-known Efficient Market Hypothesis (EMH) where its basic assumption states that frequency of price changes should well be represented by normal distribution. On the contrary, FMH, which allows heavy tailed distributions says that the market consists of many investors with different investment horizons, and the information set that is important to each investment horizon is different as well. As long as the market maintains this fractal structure, with no characteristic time scale, the market remains stable. When the market's investment horizon becomes uniform, the market becomes unstable. In addition, Mandelbrot and Hudson (2004) introduce the idea of “mild” and “wild” randomness and claim that price changes are neither continuous nor follow a Brownian motion. By the help of fractals they come up with the idea that markets are turbulent and highly risky, have flexible time, contain inevitable bubbles and are deceptive to technical analysis. As stated in Cont and Tankov (2004), Poisson process is a fundamental example of a stochastic process with discontinuous trajectories. They give many examples why Poisson processes are good candidates for modeling financial breaks. In these models, although the exact timing and magnitude of the event is uncertain, the expected number of jumps for an interval is taken to be constant. Moreover, the jump size is either fixed (e.g., Sweeting, 2011) or tied to a specific distribution (for instance Merton, 1976; Kou, 2002). Hence, although random, the average number and the size of the crisis are still known. However, financial markets are less predictable. It is therefore sensible to propose a more general framework for modeling breaks. So, in order to address this unpredictability, the intensity and the jump size should be generalized. Thus, this study aims to consider this need by introducing a Poisson process whose intensity is random. Moreover, the jump size is also taken as a function of this new random intensity parameter.
Other than this new mathematical model, this study also aims to introduce a new definition namely the “unpredictable unknowns” (UUs). Unpredictability of an event is a key issue in the sense that its impact is inversely proportional to its predictability. Since this study considers the times where financial stability is severely broken, it is important to distinguish between predictable and unpredictable unknowns.
Bazerman and Watkins (2004) define “predictable surprise” as problems that at least some people are aware of, getting worse over time and likely to explode into a crisis eventually, but are not prioritized by key decision makers or have not elicited a response fast enough to prevent severe damage. For September 11 terrorist attacks they say the following: “When fanatics commandeered jetliners on September 11, 2001, and steered them into buildings full of people, it came as a horrifying shock to most of the world. But however difficult it might have been to imagine individuals carrying out such an act, it shouldn’t have been a surprise. Portents had been building up for years. It was well known that Islamic militants were willing to become martyrs for their cause and that their hatred and aggression toward the United States had been mounting throughout the 1990s.” They similarly regard the 2008 subprime meltdown as “predictable”. Numerous studies are available regarding causality and the predictability of unpredictable events. They are all considered after the occurrence of the event in question. However, if an UU becomes predictable, then it will not be an UU anymore. A critique to Bazerman and Watkins (2004) is the “Black Swan Theory” by Taleb (2007) which is developed to explain surprises beyond the realm of normal expectations in history, science, finance, and technology whose probability is too low thus hard to compute. According to Taleb, an event is deemed to be a black swan if it is a surprise (to the observer), has a major effect and after the first recorded instance, it is rationalized by hindsight, as if it could have been expected; that is, the relevant data available but unaccounted in risk mitigation problems. Contrary to the assertions of Bazerman and Watkins (2004), this study follows the ideas of Taleb (2007) and regard the September 11 attacks or 2008 financial crisis as unpredictable events.
Following the arguments of Taleb (2001, 2007), the following new definition is introduced for a stock market:Definition 1.1 An event is said to be “unpredictable unknown” if it could not be predicted apriorily, caused a historically significant major daily collapse and reversion to the level just before the crisis, that is, the recovery period is too long. Moreover, if the stock market shuts down after the occurrence of this particular event, without taking into consideration of recovery period, it will be deemed as an UU.
The rest of the study is as follows: Section 2 explains some break identification tests. Section 3 provides a literature survey for stochastic processes with jumps. Section 4 analyses three stock indices, namely Japan Nikkei 225, US Dow Jones Industrial Average and Turkish BIST 100. Section 5 describes the theoretical model for the UU events. Section 6 is devoted to simulation results. Finally, Section 7 compares the stock indices mentioned in Section 4 in terms of their financial stability and concludes.
2Identification of breaksNumerous identification methods are proposed for the determination of breaks in time series.1 Thus, it would be beneficial to review some of the well-known tests.
Chow (1960) uses a testing procedure to determine whether the coefficients in two linear regressions on different data sets are equal or not. In order to apply Chow test, the suspected break point should priorly be known. Andrews (1993, 2003) extended the Chow test by proposing tests for parameter instability and structural breaks with unknown change points. Bai and Perron (2003) defined a recursive algorithm in which multiple structural breaks can be automatically detected from data. The modulus of continuity notion catches points beyond the possible paths of Brownian motion and regards them as jumps. Hayfavi and Talaslı (2013) use this approach for the identification of breaks where in such a case a constant variance should be stated. Hence one can infer that there is not a single and universally accepted method for jump detection.
3Stochastic processes with jumpsModeling financial data in continuous time including uncertainty is a major issue. The corresponding driving process is usually assumed to follow a particular pattern. Mean reverting processes drew substantial attention in the literature in which benchmark for these models is the OU process proposed by Ornstein and Uhlenbeck (1930)
where θ,μ,σ∈ℝ+ and Bt is the standard Brownian motion. Vasicek (1977) is the first mathematician to use (3.1) for modeling interest rates. Here, the process is assumed to revert back to a constant long term mean μ with a speed of reversion θ. The major drawback of Vasicek Model is argued to be the possibility of negative interest rates (which is quite common nowadays). In order to fix this shortcoming, Dothan (1978), assumes the short term interest rate to be log normally distributed and Cox et al. (1985) take the square root of the interest rates.
Ho and Lee (1986) propose a model where the prices of bonds revert back to the yield curve. Black et al. (1990) and Black and Karasinski (1991) are some alternative models for short term interest rates. In Hull and White (1990), mean is assumed to be an arbitrary function of time. However, mean reverting models cannot explain financial crisis (breaks) since they are continuous. For modeling the jump discontinuities, usually a pure or compound Poisson process is added to (3.1) (for instance Heston, 1993; Bates, 1996; Nielsen and Shephard, 2001). Besides, various mixtures have also been studied. For example, Hayfavi and Talaslı (2013) model the spot electricity prices with an OU process conjoined by a Poisson process for pure jumps and two mean reverting Le¿vy driven OU processes with different mean reversion rates for spike and semi spikes. Estimating the parameters can sometimes be very problematic. Fitting a model to a certain data becomes difficult when the generality of model increases. Moreover, for models including Le¿vy processes, other than the parameters, a distribution for explaining the jump structure should also be estimated. Thus, a jump size distribution is usually imposed by statistical methods in an intuitive manner which can be considered as another drawback. In that sense, it can be argued that there is no universally accepted methodology.
4Historical survey of some major stock indicesIn this section, the UUs occurred in three stock indices are analyzed.
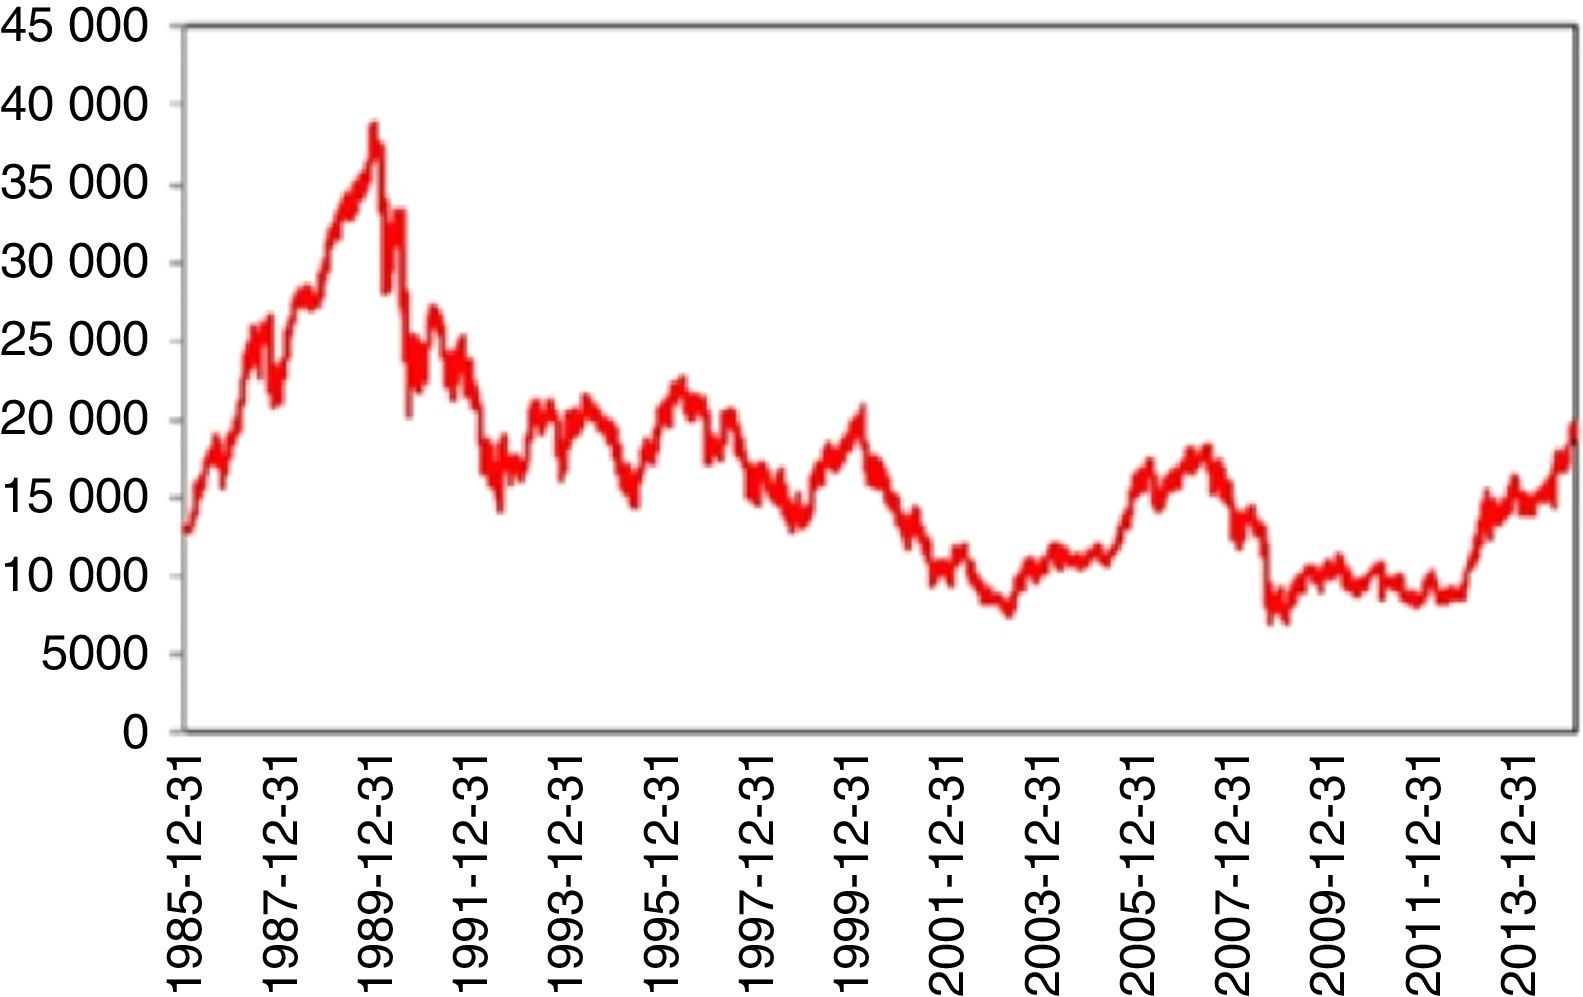
4.1Nikkei 225 indexFrom 1914 to 1989 (around 77 years), Nikkei 225 index showed a persistent stability. Even the Black Monday on October 1987 could not be able trigger a crisis. Thus, Nikkei 225 was regarded as the most stable index throughout the world.
On December 29, 1989 however, something totally unpredictable had happened and stock prices began to fall dramatically. Limmack and Ward (1990) raise interesting questions about the financial models for explaining and predicting the price movements of the 1989 crash period and warn future researchers to be careful when data from this period is to be used. Schiller et al. (1996) find a relation between the crash and the changes in Japanese price expectations and speculative strategies. Nevertheless, they mention the difficulty of finding a concrete causality of this event. The decline of 65% continued till August 18, 1992. Today, we are still far away from the price levels of 1989. Thus, for almost 25 years, a full recovery has not been achieved yet (Fig. 1).
4.2Dow Jones Industrial Average.")
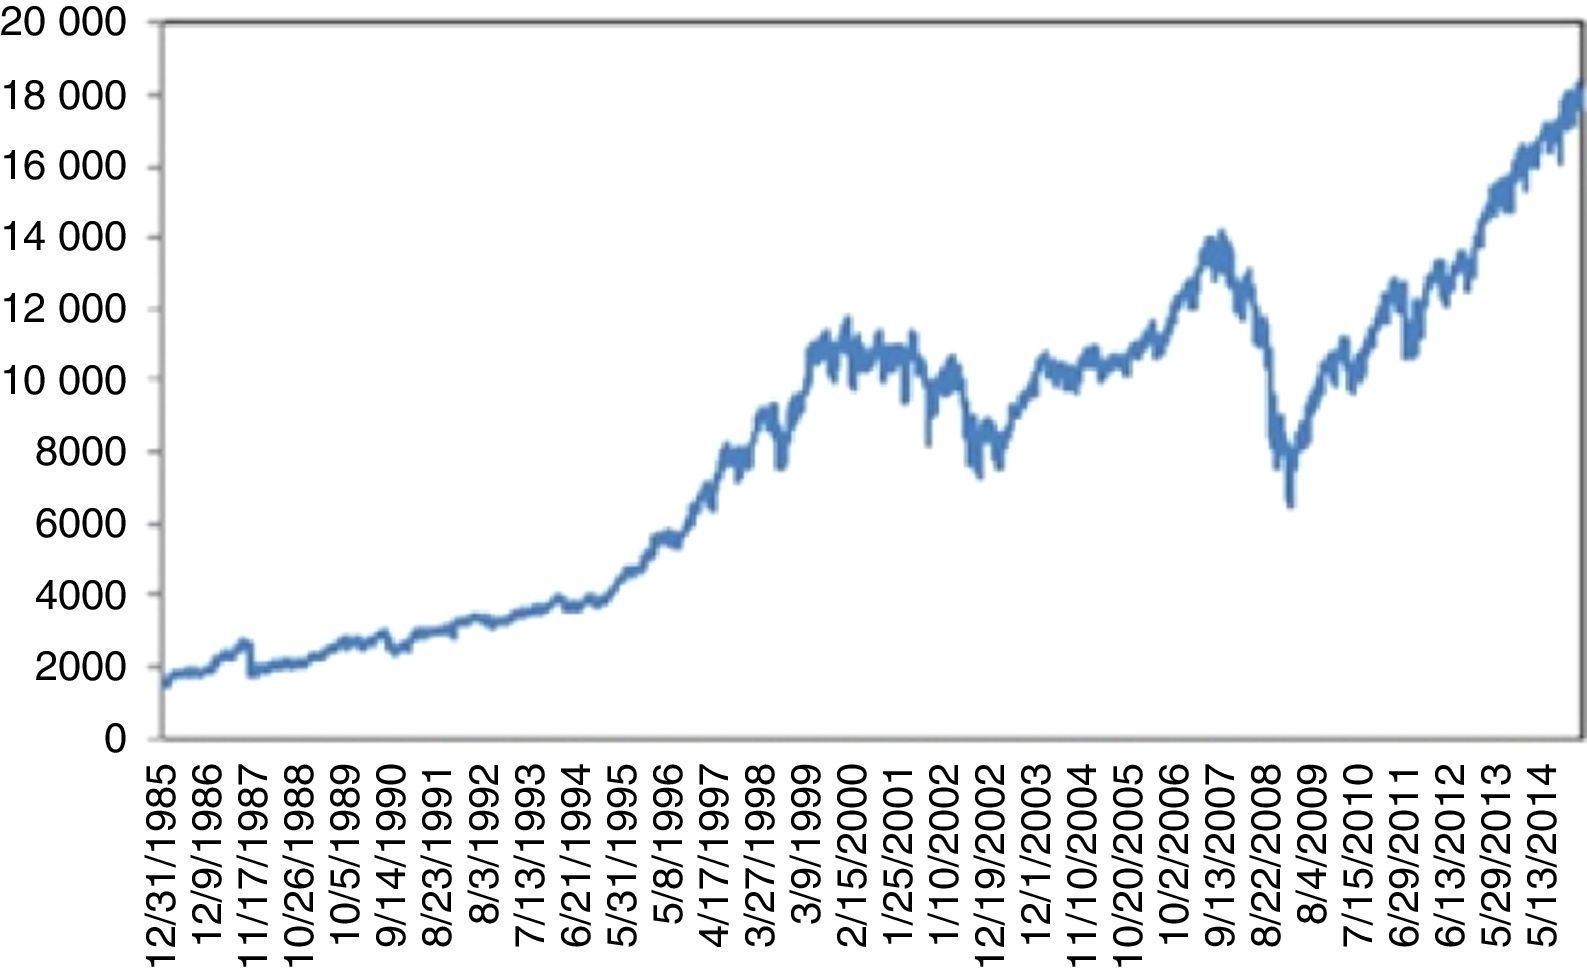
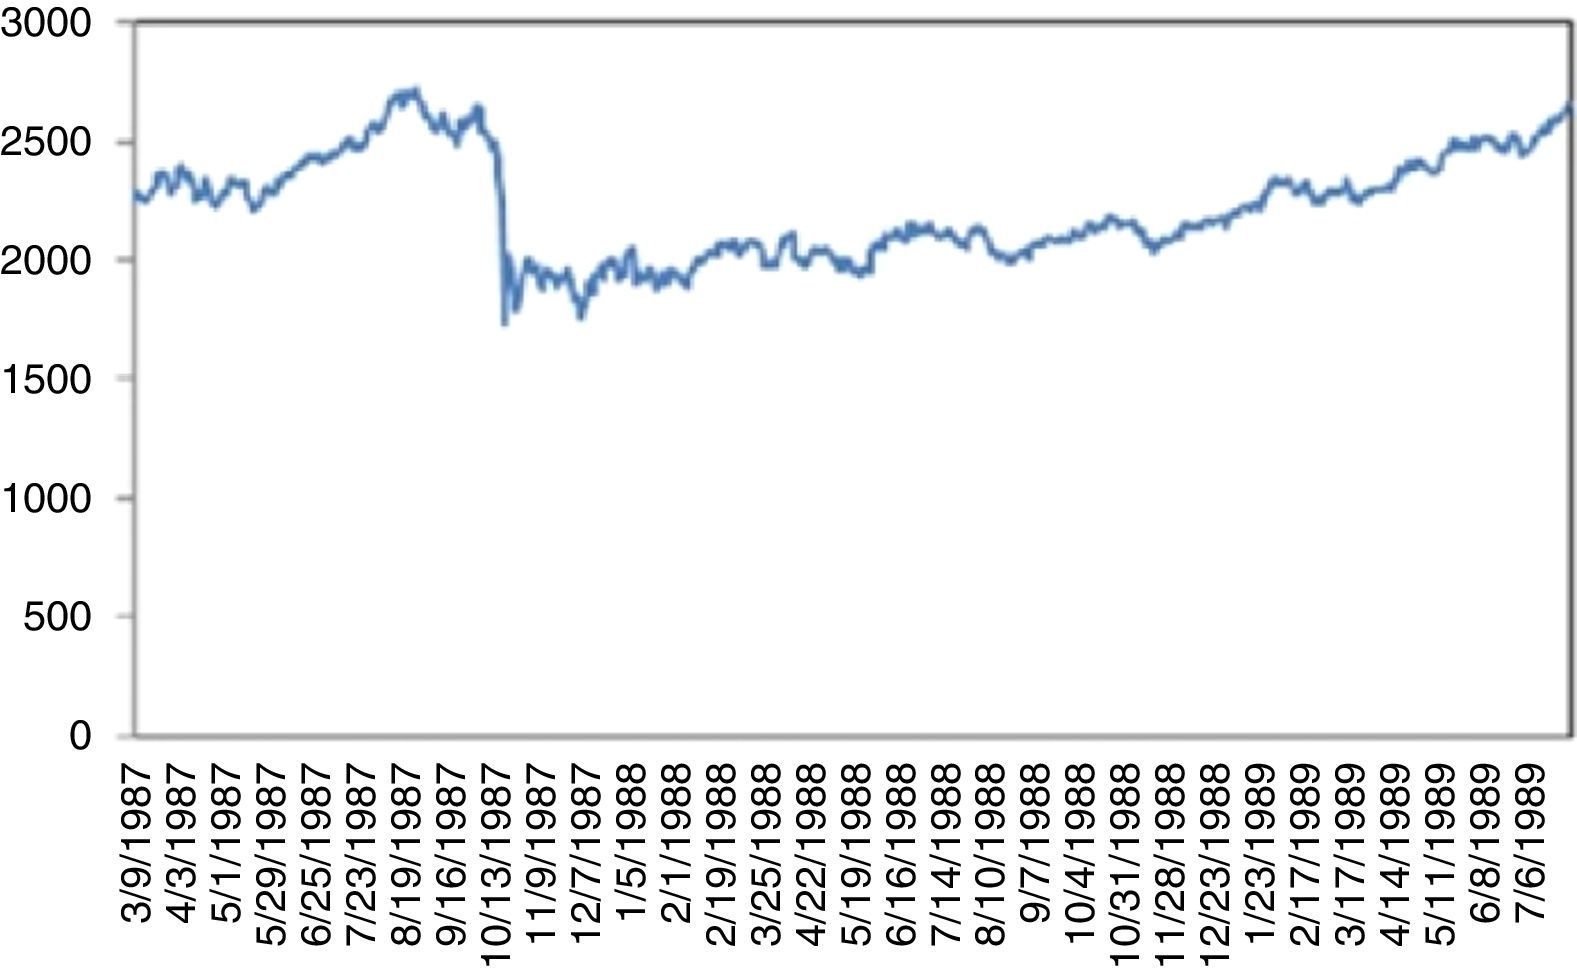
Fig. 2 plots the prices of Dow Jones Industrial Average Index (DJIA) between 1986 and 2015. An increasing trend is clearly visible with three exceptions that come from UUs. First is the “Black Monday”. On September 19, 1987 Dow Jones dropped by 22.6% corresponding to the largest daily historical percentage loss. This triggered a crash in world stock markets. Its cause is still unknown and there were no indicators of it. Bates (1991) examines the prices of certain options before the crisis. However, his approaches indicate no strong crash fears during two months immediately preceding the crash. Malliaris and Urrutia (1992) suggest that the October 1987 market crash probably was an international crisis of the equity markets and might have begun simultaneously in all of the national stock markets. Contrary to Malliaris and Urrutia (1992), Najand (1996) finds out that, Japan's stock market played an important role among the Asian stock markets during and after the crash. In some other studies, it is regarded as a psychological phenomenon. Some analysists argue that the market was overvalued thus a correction was inevitable. Anyway, it took almost two years to reach back to the level attained on the day of the crisis (Fig. 3)
.")
.")
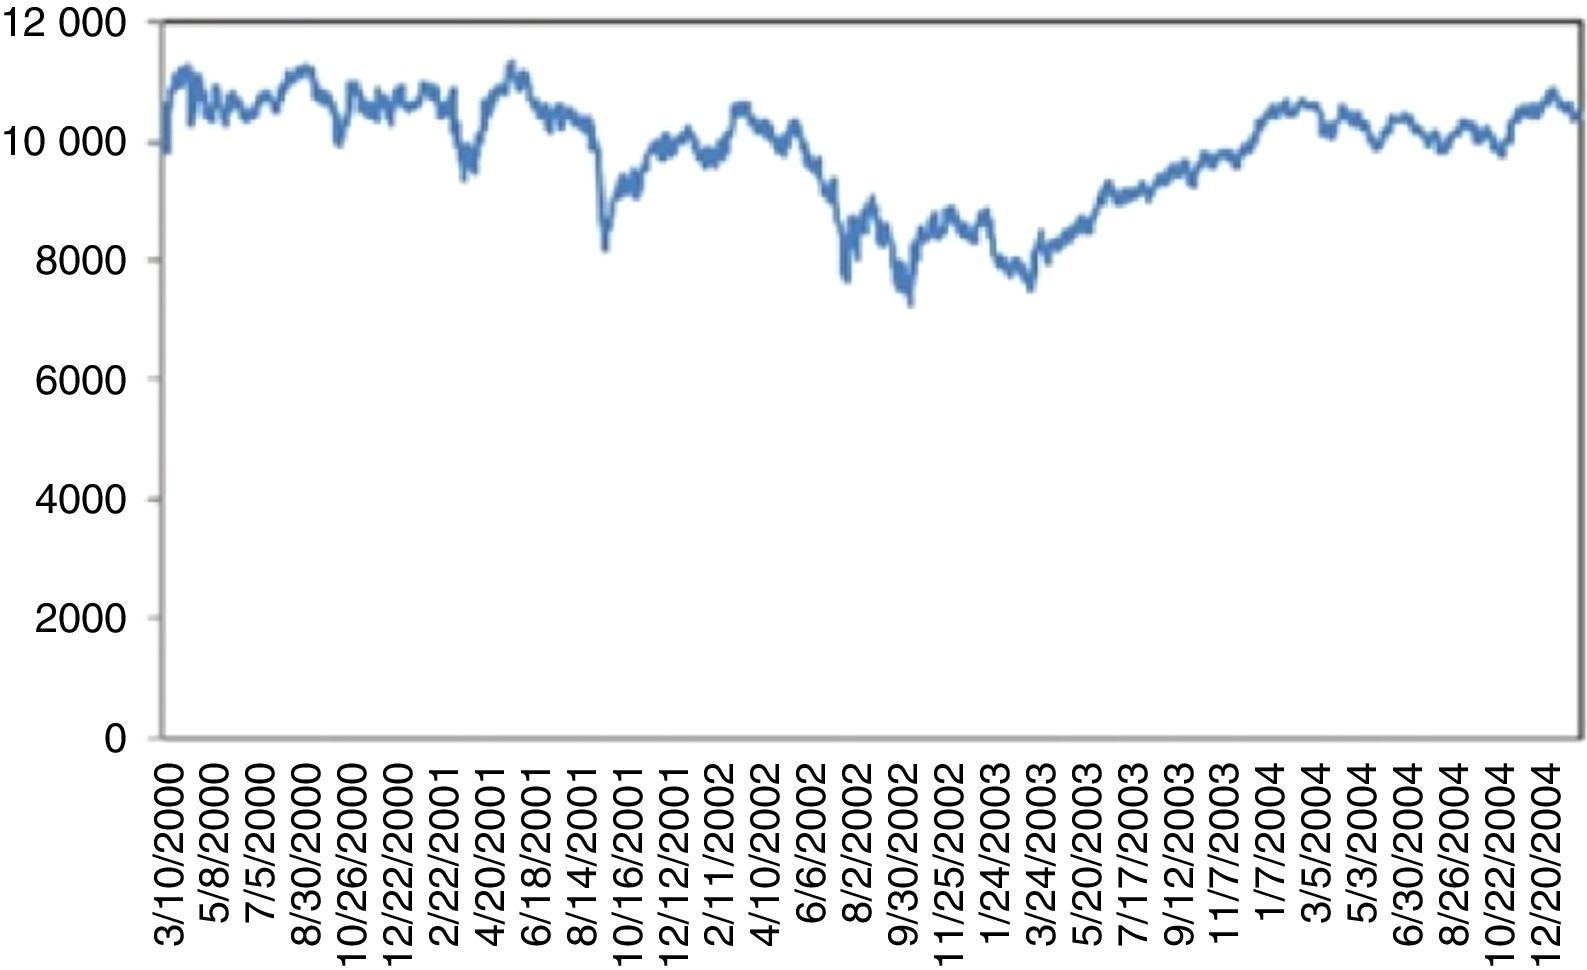
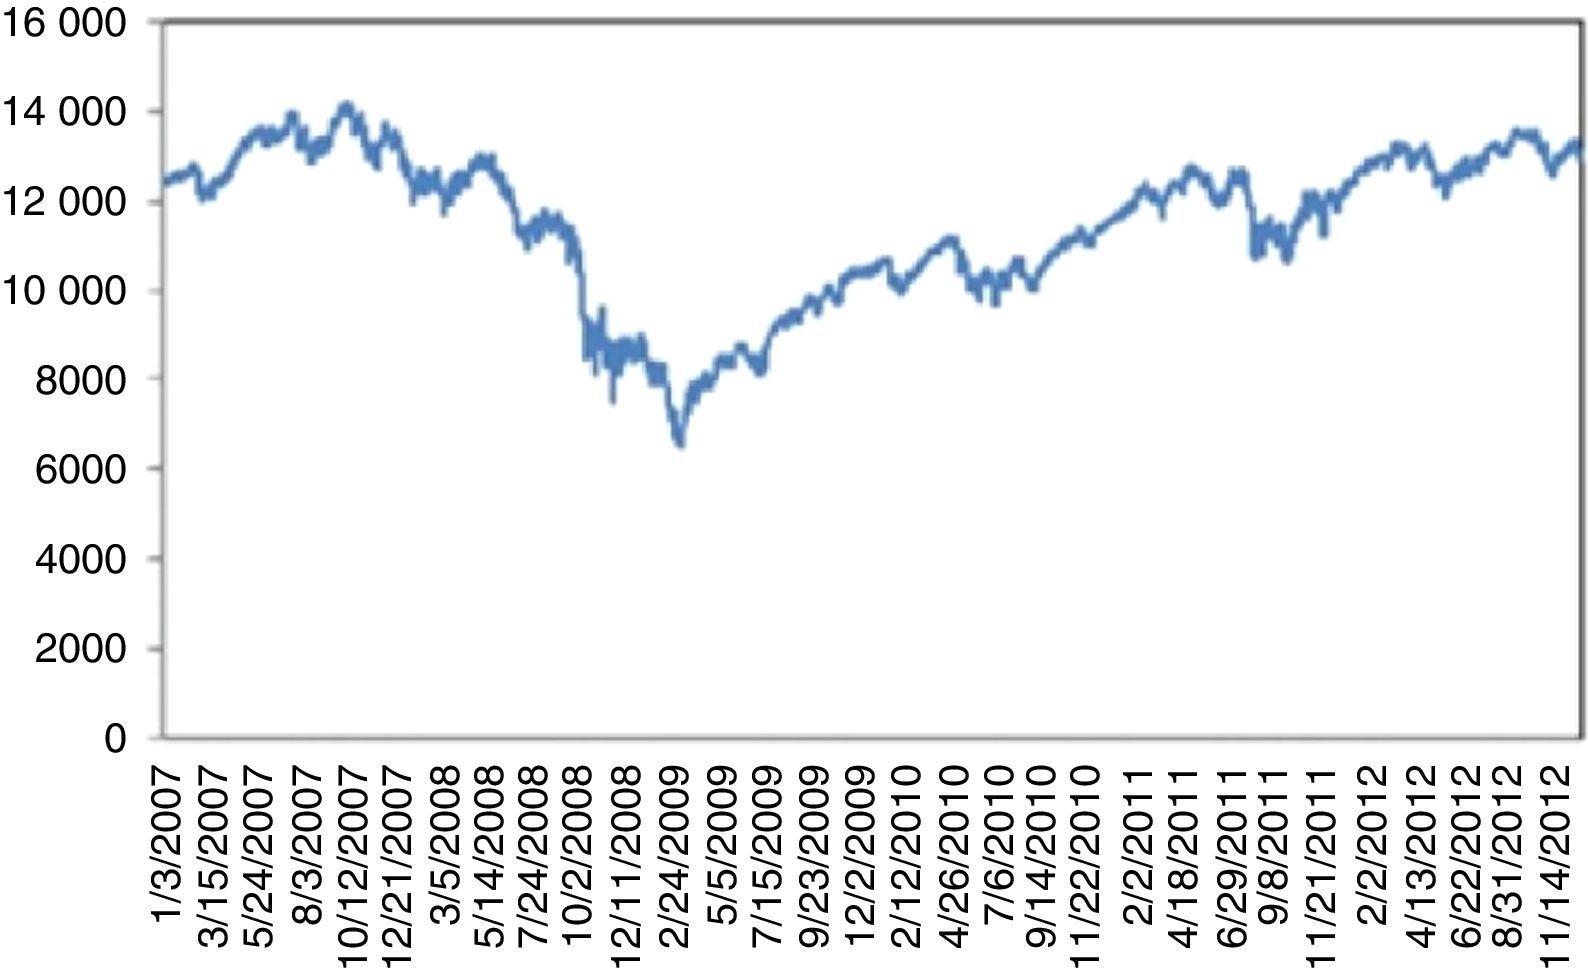
After September 11, 2001 terrorist attacks, the stock exchange was shut down till September 17, 2001. Dow Jones incurred a 7.1% loss on the day of reopening. By the end of the week, Dow Jones had fallen 1369.7 points corresponding to 14.3%, the largest one week point drop in history. This UU severely damaged the financial stability and recovery took more than three years (Fig. 4).
.")
For 2008 crisis, although, as claimed, there were significant indicators regarding the overvaluation of complex derivatives backed by mortgages as collateralized debt obligations (CDO); these were not taken too seriously by the investors. On the other hand, confiscation of Lehman Brothers was totally unexpected. This UU on 09.15.2008 caused a 7.87% daily loss, followed by a series of severe losses. Recovery took almost three years (Fig. 5).
.")
Demyanyk and Hasan (2010) make a survey of studies that attempt to explain, predict, or suggest remedies for financial crises or banking defaults. They mainly concentrate on US subprime mortgage crisis and the global financial turmoil that has led to severe crises in many countries. There were some studies regarding the deterioration of US economy before 2008 crisis. However, after the meltdown numerous studies come to surface claiming its predictability. Ackermann (2008) mentions the background and possible improvements for prevention of the subprime meltdown. Although these studies definitely shed light to the formation of the crash, the unpredictability problem still remains unsolved.
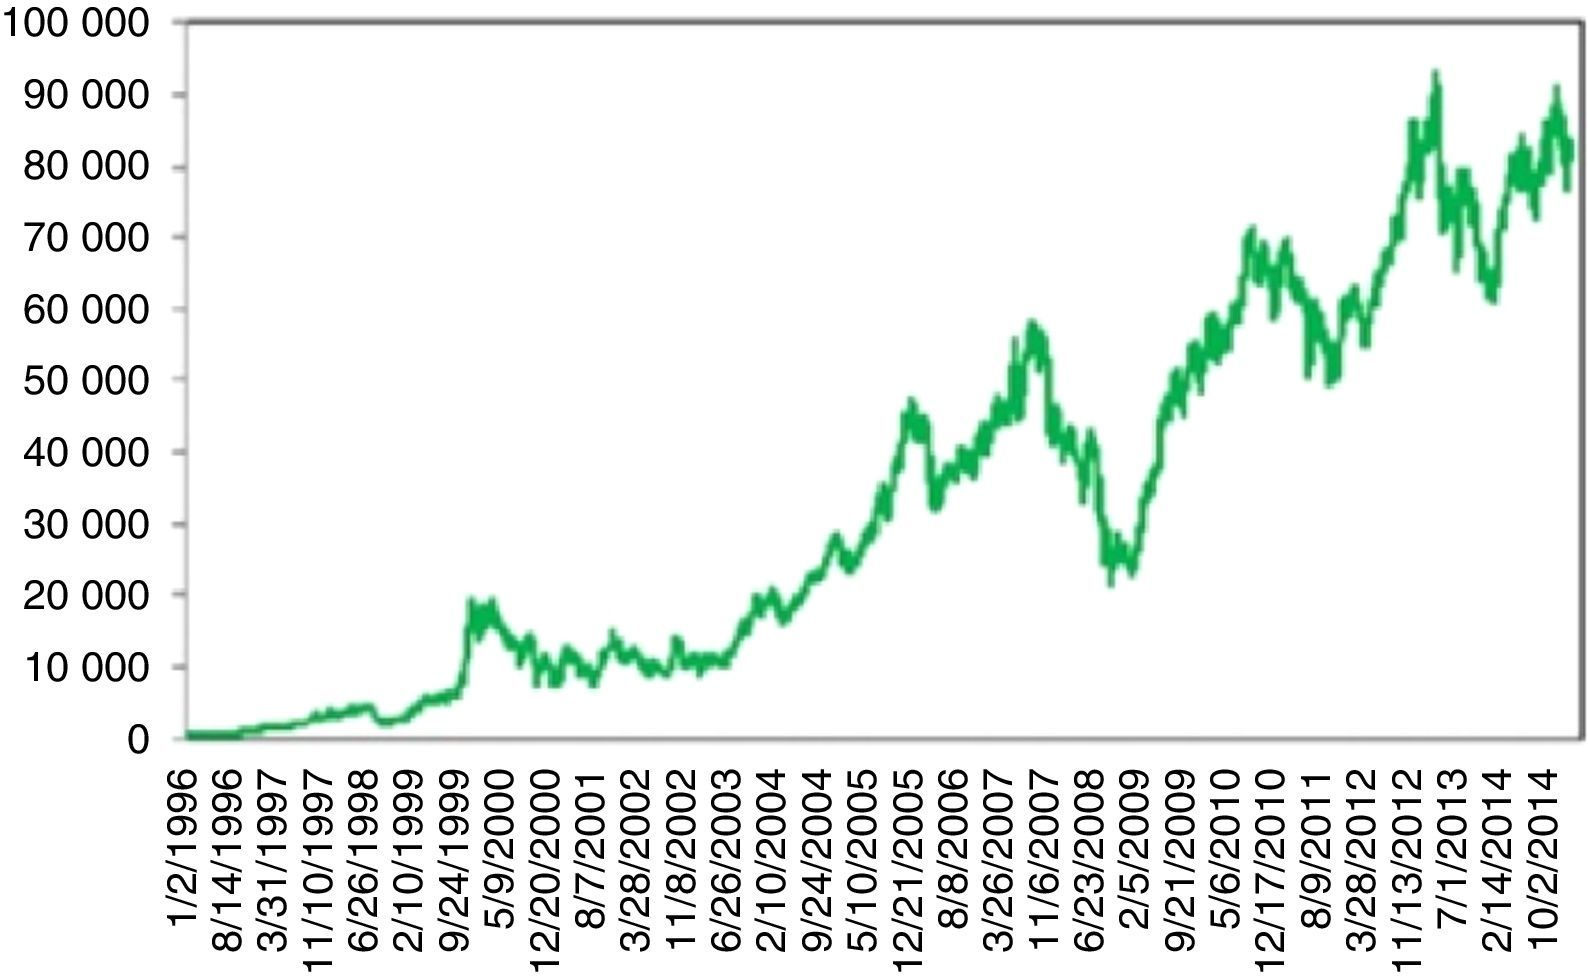
4.3BIST 100 indexTurkey's stock market made its debut on 12.06.1985 as IMKB. Its name changed to BIST on 04.05.2012. Fig. 6 depicts the Turkish stock market index BIST 100 (formerly IMKB 100) between 1996 and 2015. Although its opening goes back to the end of 1985, there were no daily trading at that times. Tradings were on weekly basis with a very low volume till 1996. 1987 global crisis and 1991 Persian Gulf War almost had no effect due to its shallowness. For this reason the analysis of Turkish stock market is started from 1996 (Fig. 6).
.")
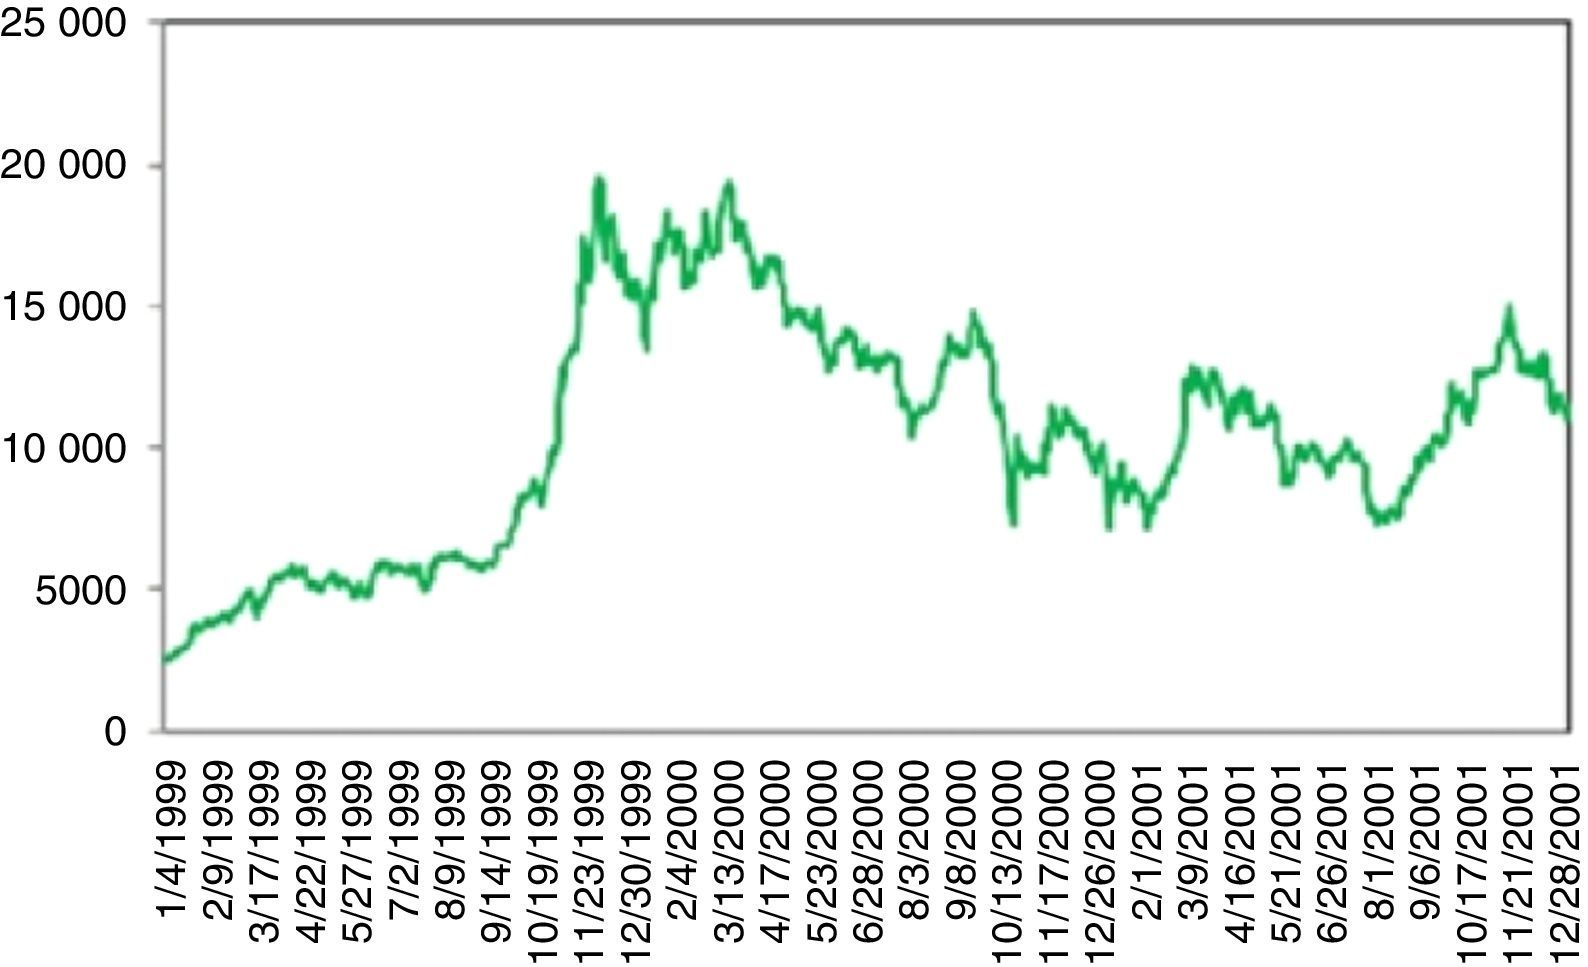
Fig. 7 is the period between years 1999 and 2012. Three events can be regarded as UUs. The first one coincides with the 17 August 1999 earthquake. Stock market was shut down till 08.26.1999. On the day of re-opening the loss was more than 10%.
.")
On November 2000, banks start closing their interbank credit lines to vulnerable Turkish banks, as the concerns about health of the banking sector have increased sharply. This is followed by substantial withdrawals from domestic and foreign investors. On 11.20.2000 for a mid-size bank, namely Demirbank, all credit lines are cut by other major banks which caused a panic environment and severely raised the interest rates. On December 6th, Demirbank failed and is taken over by the Savings Deposit Insurance Fund (SDIF), a government body which is responsible for insuring savings deposits and strengthening and restructuring banks if necessary. BIST 100 index plummeted from 14000 to 9000 within 2 months. The turmoil in November is followed by a political crisis in early 2001. On February 21, the prime minister and the president had a severe dispute. Once again, trust in the sustainability of the stability program is lost. BIST 100 fell by 14% and interbank O/N rates skyrocketed, rising from 50% to 8000%. Meanwhile, foreign exchange reserves again declined rapidly. On February 22, the government allowed Lira to float freely. As a result, the Turkish Lira lost about one-third of its value against the dollar (see Ozatay and Sak, 2003). The recovery process continued till the end of 2001.
Ozkan (2005) argues that three factors are accounted for the source of these twin crises. First, the weak external position caused by excessive debt burden combined with the loss of competitiveness; second, the weak fiscal position resulting from the record levels of interest payments on domestic borrowing; and most importantly, third, weaknesses in the financial and banking sector. Hence, the success of the financial sector reform is instrumental for not only putting the economy on a sustainable recovery path but also reducing the likelihood of similar crises in the future.
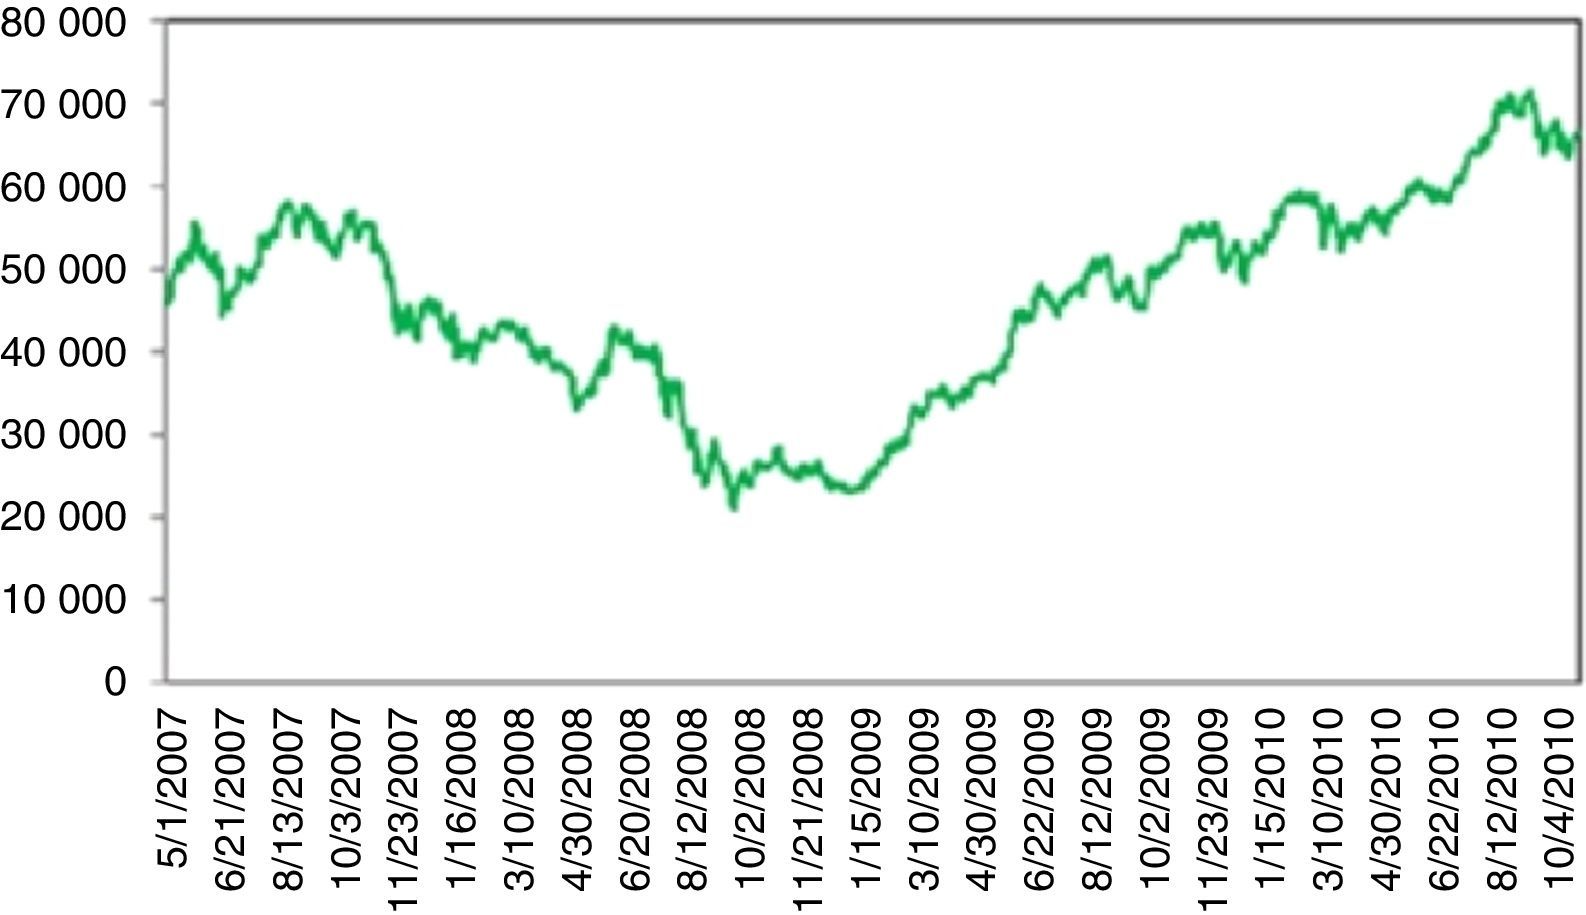
The global 2008 crisis also affected BIST 100 (Fig. 8). However, contrary to US index, the recovery took around one year since complex derivatives were not traded in Turkey and the Quantitative Easing (QE) after the crisis caused a flow of money to emerging markets.
.")
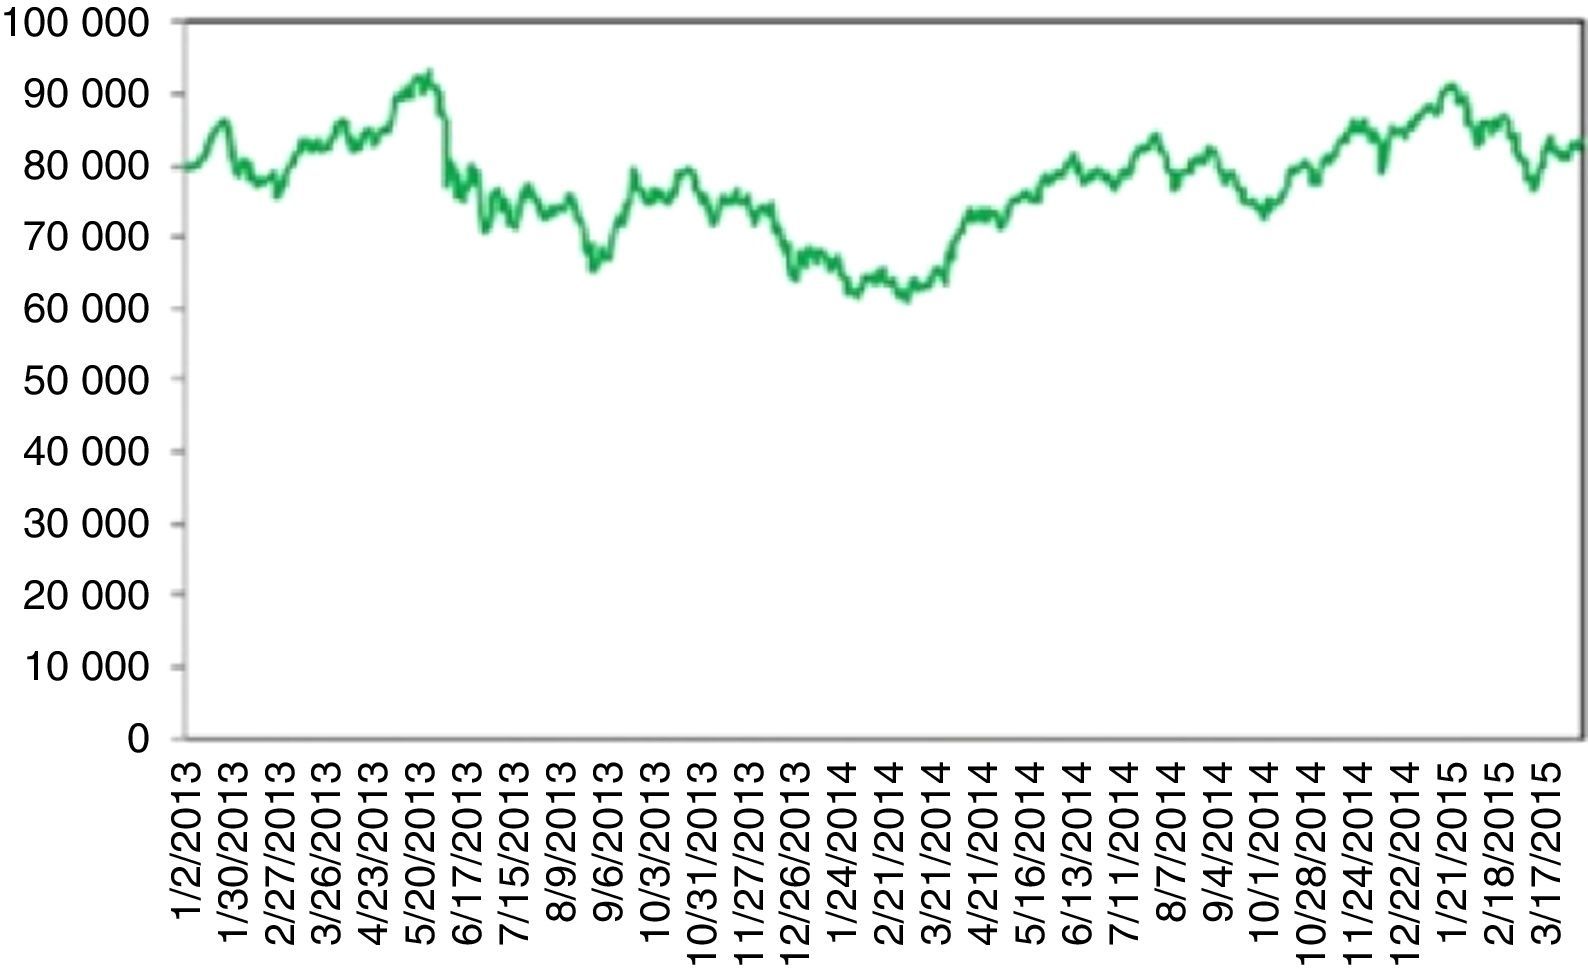
Turkey's stock index between 2013 and 2015 (Fig. 9) is worth mentioning. Turkey witnessed a financially stable environment beginning around May 2012. BIST 100 index entered an upward trend which continued for more than a year. On 05.16.2013, Moody's raised the credit rating of Turkey from Ba1 to Baa3 investable level. The stock exchange rose to its historical summit of 93178 points. On 05.22.2013, Ben Bernanke made his famous speech about the ending of the huge bond buying program. Although, the tapering was conditioned to sustained economic growth, this message changed the optimistic view from the investors’ side from all over the world. BIST 100 index gradually fell to 90.000 points due to this tapering signal, conjoined with some profit realizations. A wave of protests and civil unrest in Turkey began on 05.28.2013 in a totally unexpected manner. Initially it started as a contest to the urban development plan for Istanbul's Taksim Gezi Park but the riots spread to every part of Turkey and drew a lot of attention worldwide. BIST 100 rapidly fell from 90000 to 76000. Although some counter movements happen, the once broken stability rendered the index to continue to fall drastically. It continued about 10 months and the stock index plummeted to 60000.
.")
After Gezi Park protests lots of people and investors expected similar riots, just like the expectation of more airline strikes after September 11. However, none of them had happened. UUs typically have the character of being unique. There will definitely be riots in the future. However, its timing, occurrence, impact and most of all, unpredictability makes these particular events unique. In the future we will most probably witness UUs, on national or on global scale but in different forms.
5Description of the modelThis study tries to model the above mentioned UUs. The intensity of this event should be very low. If it is expected to occur more than its actual probability, then its impact will significantly diminish. Rareness can be thought as a measure of unpredictability. When rareness increases, the investors will be less aware of its probability and therefore will position themselves as if it would never happen. This ignorance is in fact the key to its highly detrimental impact to financial stability.
The homogeneous Poisson process counts events that occur at a fixed rate λ called the intensity. The process is characterized by:
where N(t+τ)−N(t)=k is the number of events in time interval (t, t+τ], λ being the expected number of jumps that occur per unit time. The mean and variance of the Poisson process given in (5.1) is E(x)=Var(x)=λt. When a specific portion of τ is considered, then mean will be less than λt. Thus if a very rare event is considered for a specific part of the time domain we must have 0<λ<1.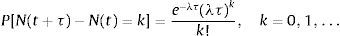
Contrary to the existing literature, this study takes into account a Poisson process which has a random intensity. This is quite different from non-homogeneous Poisson process with an intensity parameter λ(t) where the rate is assumed to be time dependent. Massey et al. (1996) consider the arrival rate function as of the form λ(t)=a+bt, a,b∈ℝ within the interval [0,T] where 0≤t≤T and estimate the parameters a and b. They concentrate on telecommunication applications where ordinary Poisson process is widely used for modeling. Cox (1955) proposes a model where λ(t) is itself a stochastic process.
In this study the intensity parameter is neither fixed nor time dependent. It also does not follow a stochastic process. Here, the parameter is drawn from an exponential distribution with probability density function of the form:
with a rate parameter λ which is very close to zero. λ is taken infinitesimally small in order to model the rareness and unpredictability of UUs as discussed before. Moreover, if λ is taken to be fixed or follow a particular pattern this will again lead to a different kind of predictability which will contradict the nature of UUs.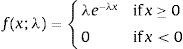
In bull markets, the stock index tends to increase in a persistent but relatively slower manner compared to bear markets due to profit sales or prudent short sellers. Also for a stock index to be attractive, it has to promise a return considerably higher than the T-bill rate. Moreover, as short selling requires collateral small investors can only go long with stocks. Therefore, stock indices in the long run tend to have an upward trend. In a bear market, the situation is different. When huge sales begin, this will trigger more sales and stop orders become market orders. If a bear market starts with an UU, this usually hits the index on first day of its occurrence, together with a series of downfalls.
Following the aforementioned arguments this paper concentrates on rare events by the help of a randomly drawn intensity from an exponential distribution. Since this is usually close to zero, its probability of occurrence is very close to zero as well. However if it occurs, the magnitude of its impact is drawn from an exponential distribution where λ becomes the rate parameter. Its mean E[X] and variance Var[X] can be computed as follows:
and since Var[X]=E[X2]−E[X]2 we have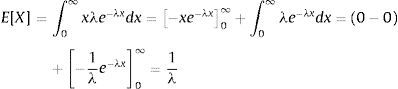
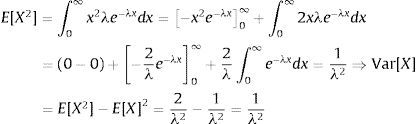
It is clear that the magnitude of the crash has a mean and a variance which tend to infinity when λ approaches to zero. Thus, although the probability of encountering an UU is very low, if it happens, a severe deterioration in financial stability becomes very high. On the other hand, although a high impact is highly probable, it is not certain. Therefore, the model respects the unpredictable nature of these rare events in every possible way. Due to its memorylessness property exponential distribution has been chosen.
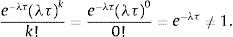
As a summary, this new model takes into account a compound Poisson process, to predict structural breaks. The compound Poisson process has a random intensity drawn from an exponential distribution whose λ is very close to zero for modeling the rareness of UUs. On the other hand if a UU happens, this UU it will hit the stock market with a magnitude which is drawn from an exponential distribution with a rate parameter λ. Hence, the more rare this event, the more its expected impact will be. The probability of occurrence of an UU can never be zero as the following proposition asserts:Proposition 5.1 The probability of the occurrence of an UU can never be zero. Consider the probability mass function of the Poisson process stated in (5.1). No matter how small λ and τ (length of the interval) are, for k=0 (no UU) we have
This model, as could be inferred, is not data specific. Such anomalies can be observed in any stock index.
6Simulation and comparison resultsThe OU process stated in (3.1) as
can be transformed to the following AR(1) process:via discretization. Since

Wti+1−Wti=εtti+1−ti (where ¿t is standard normally distributed) and
which is Euler–Maryuama discretization of the above OU Process at times ti+1−ti, i∈ℝ
Hence, it is sensible to compare AR(1) process (since it is a proxy of OU process) with the new model. The aim is to detect the probability and magnitude of an UU for 100 days ahead. This period can be extended or shortened as preferred. With the incentive to express the change in the prices of stocks, the starting value for each simulated index is taken to be 100. Simulation is done via Mat Lab.2 First the intensity is generated from an exponential distribution with a very low rate parameter. Then a compound Poisson process is formed by taking this randomly chosen intensity. In case of a break, the magnitude is drawn from an exponential distribution whose rate parameter is the intensity of the Poisson distribution. Whenever the probability of UU tends to zero, it is highly probable that its impact tends to infinity. However, this is also not certain since the magnitude of the impact is also random.
An AR(1) process typically has the following possible trajectories as depicted in Figs. 10 and 11.
6.1Simulation of BIST 100 index process.")
 process.")
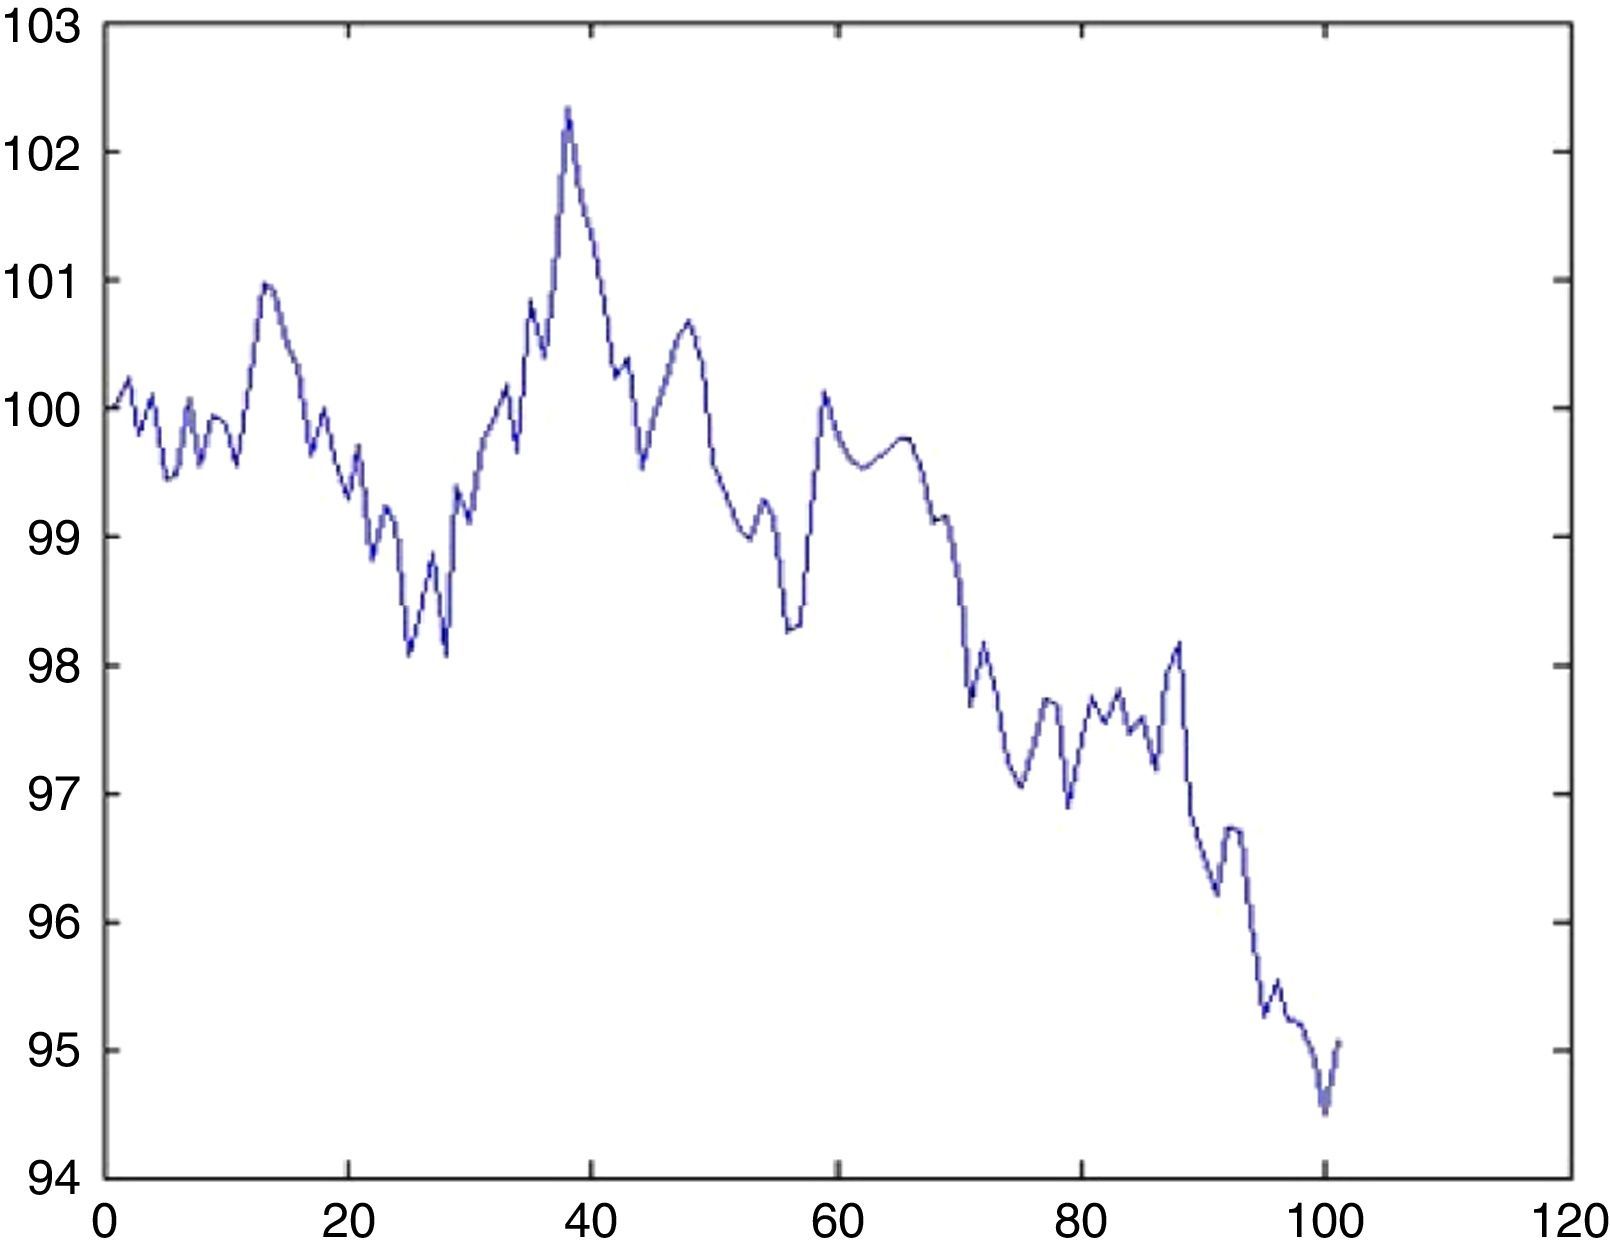
From the discussion in Section 4.3, we detected 5 UUs for approximately 5000 days. Since, in order to foresee 100 days ahead λ=0.1. The probability that there will be an UU within this period can be computed from (5.1) by setting k=1 which is 9%. Now the impact will be drawn from an exponential distribution with a rate parameter of λ=0.1. With a probability of 9% we may witness a sharp decline of 6.5% (day 34, from 100.32 to 93.55) as depicted in Fig. 12.

One natural question is the probability of having more than one UU, which is found to be too low (0.5%).
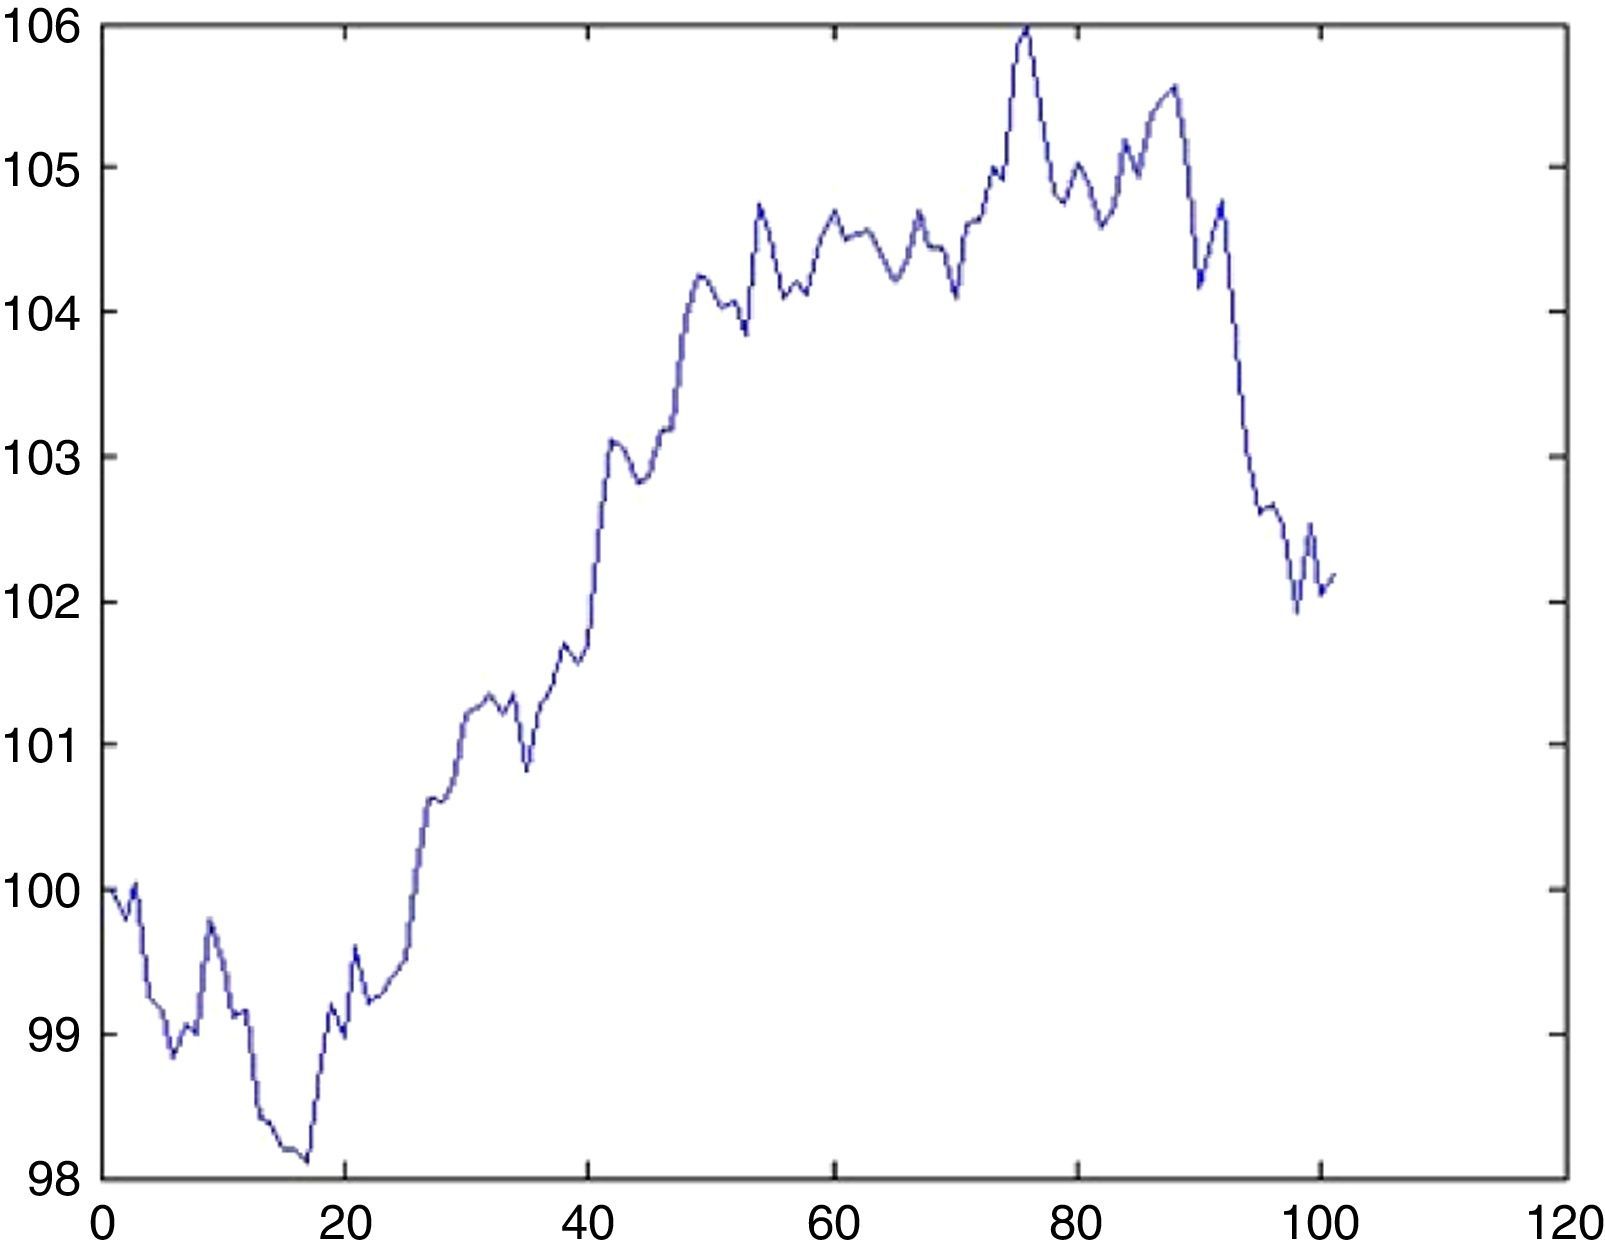
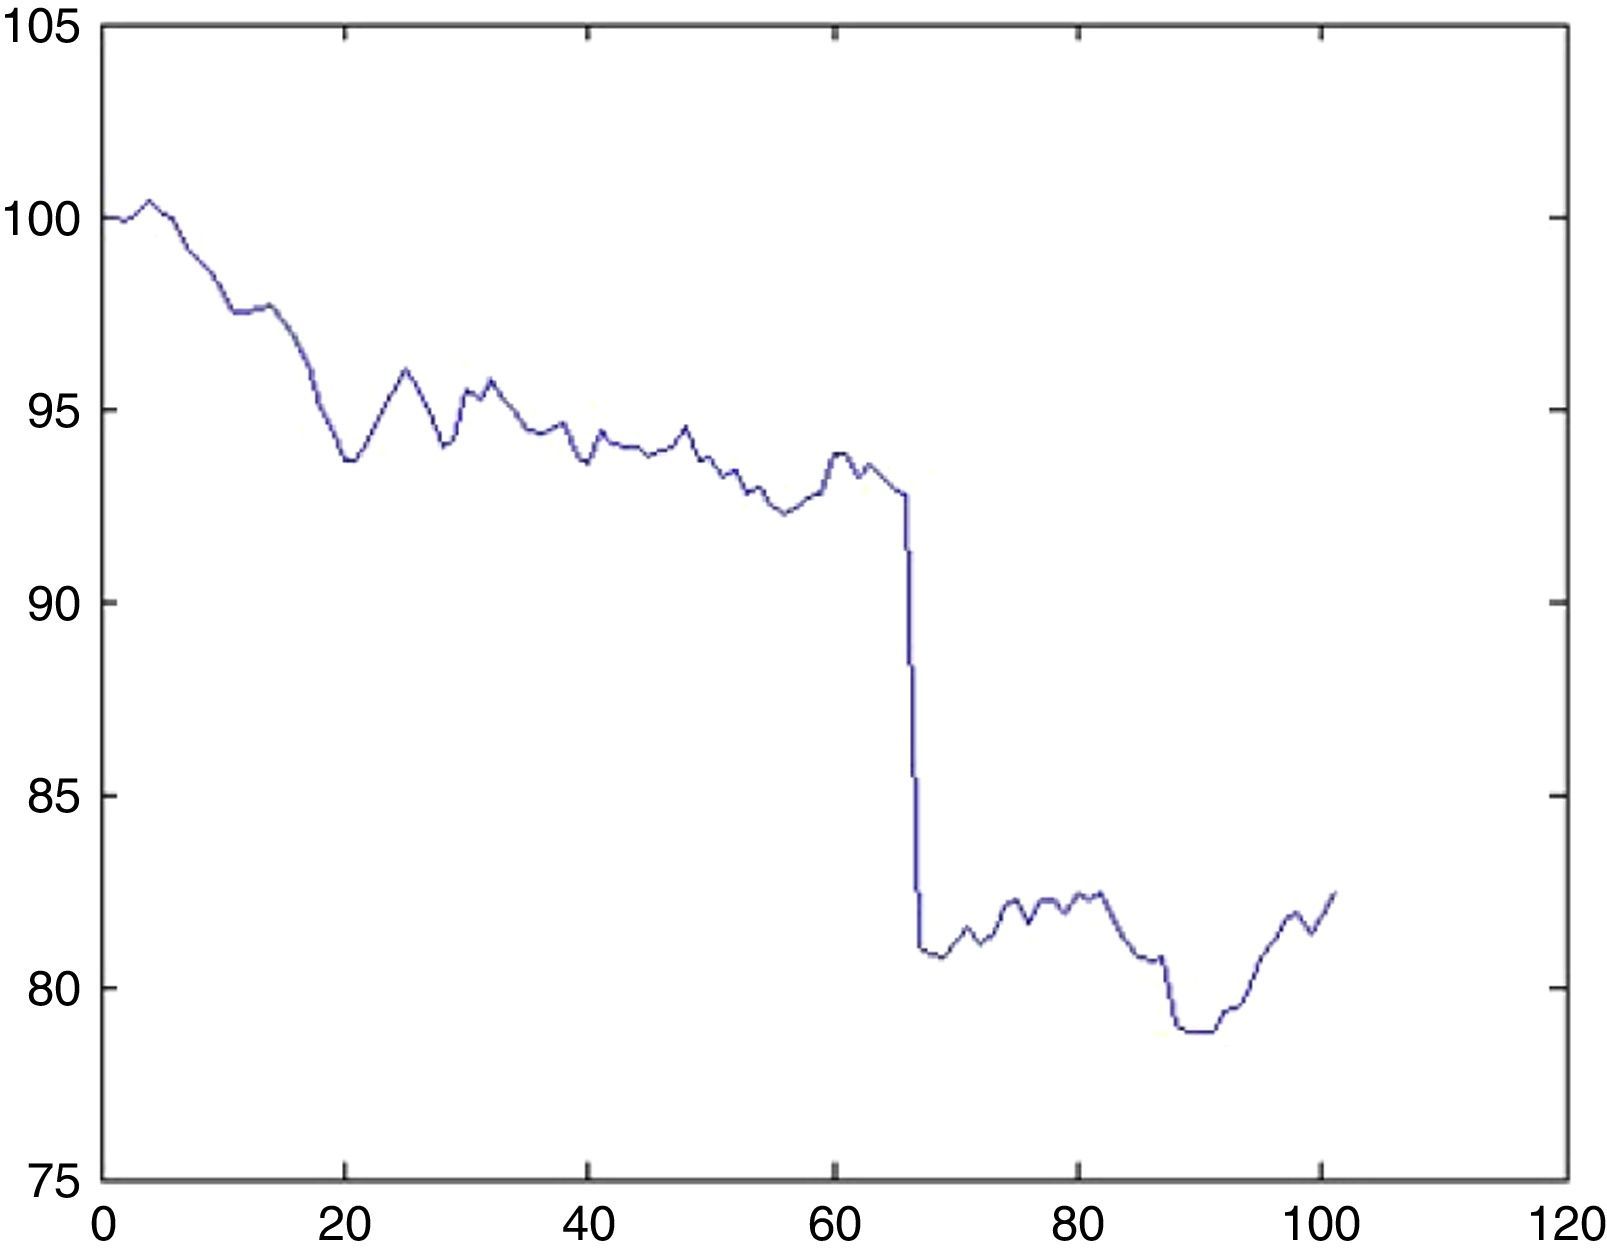
6.2Simulation of DJIA indexFor DJIA we detected 3 UUs for approximately 8000 days, therefore λ=0.0375. The probability that there will be an UU within this period can be computed from (5.1) by setting k=1 as 3.6%. Now the impact will be drawn from an exponential distribution with a rate parameter of λ=0.0375. With a probability of 3.6% we may witness a sharp decline of 12.7% (day 66, from 92.77 to 80.97) as depicted in Fig. 13.

Probability of having more than one UU is now 0.07%.
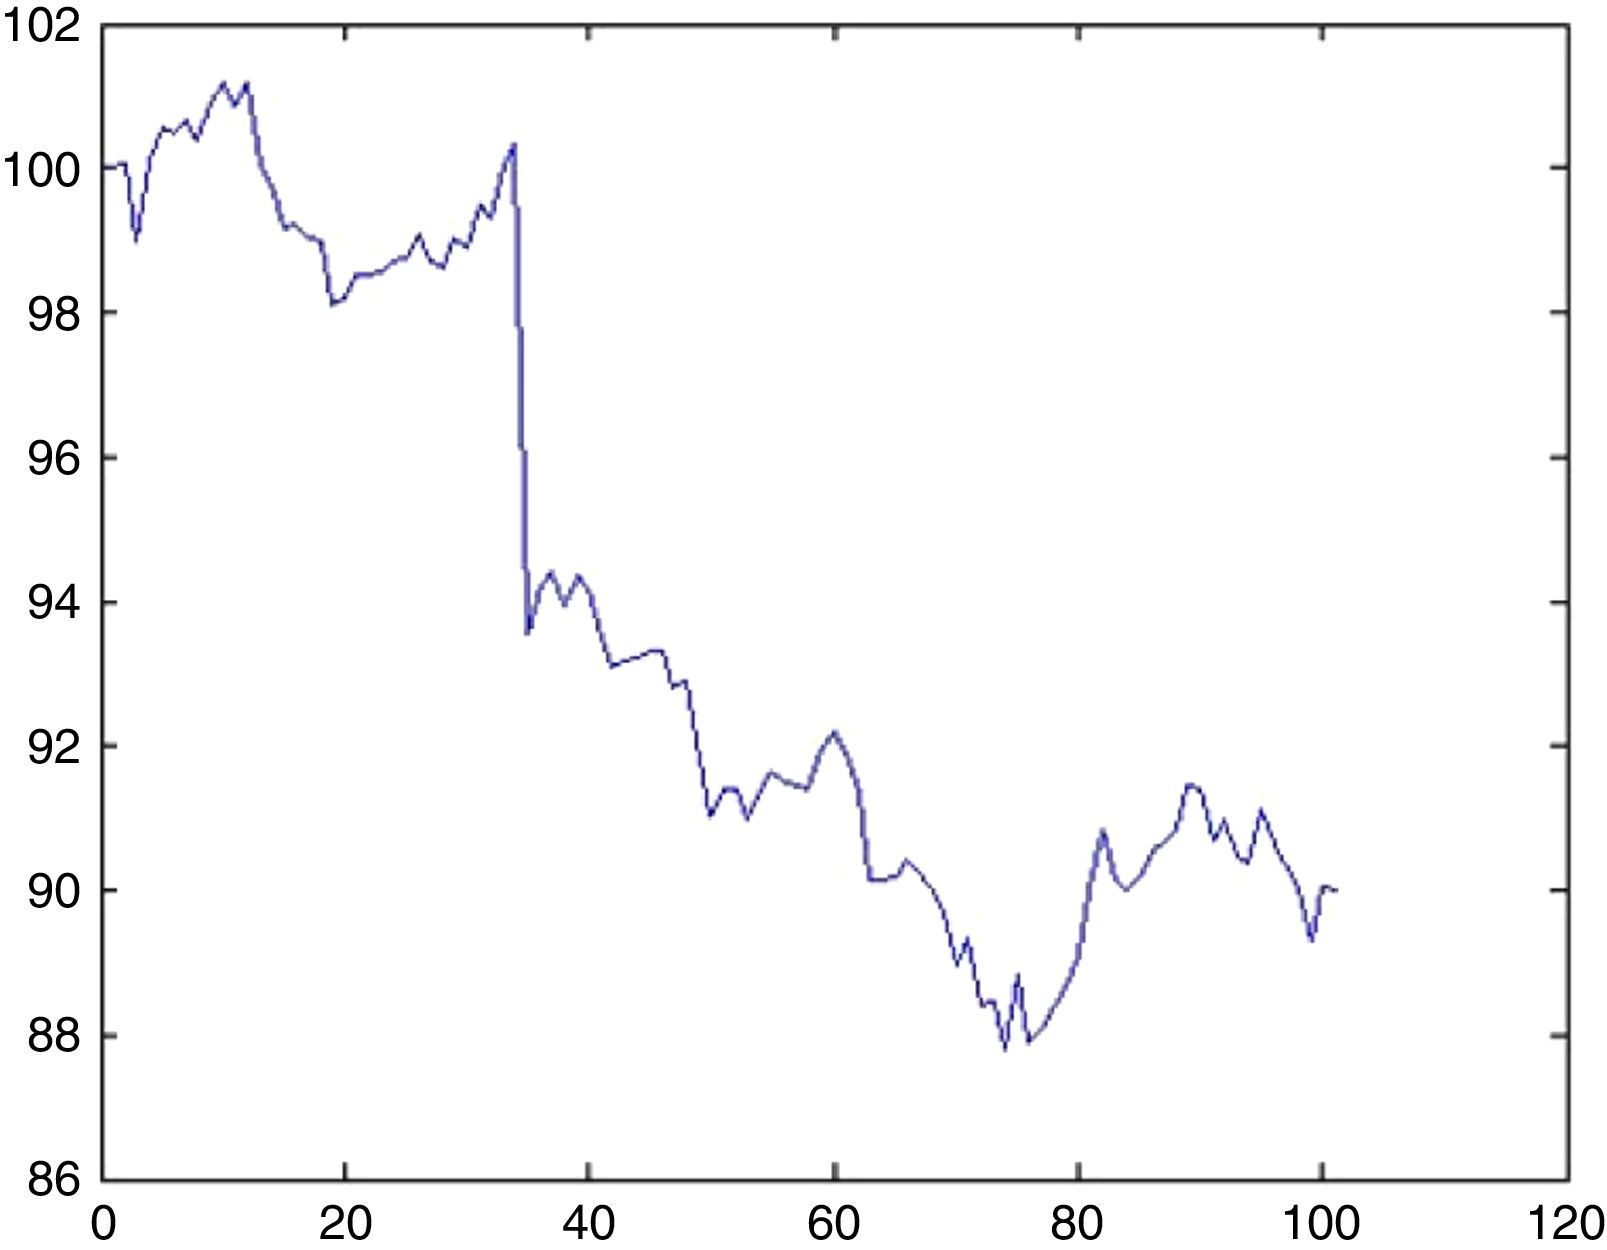
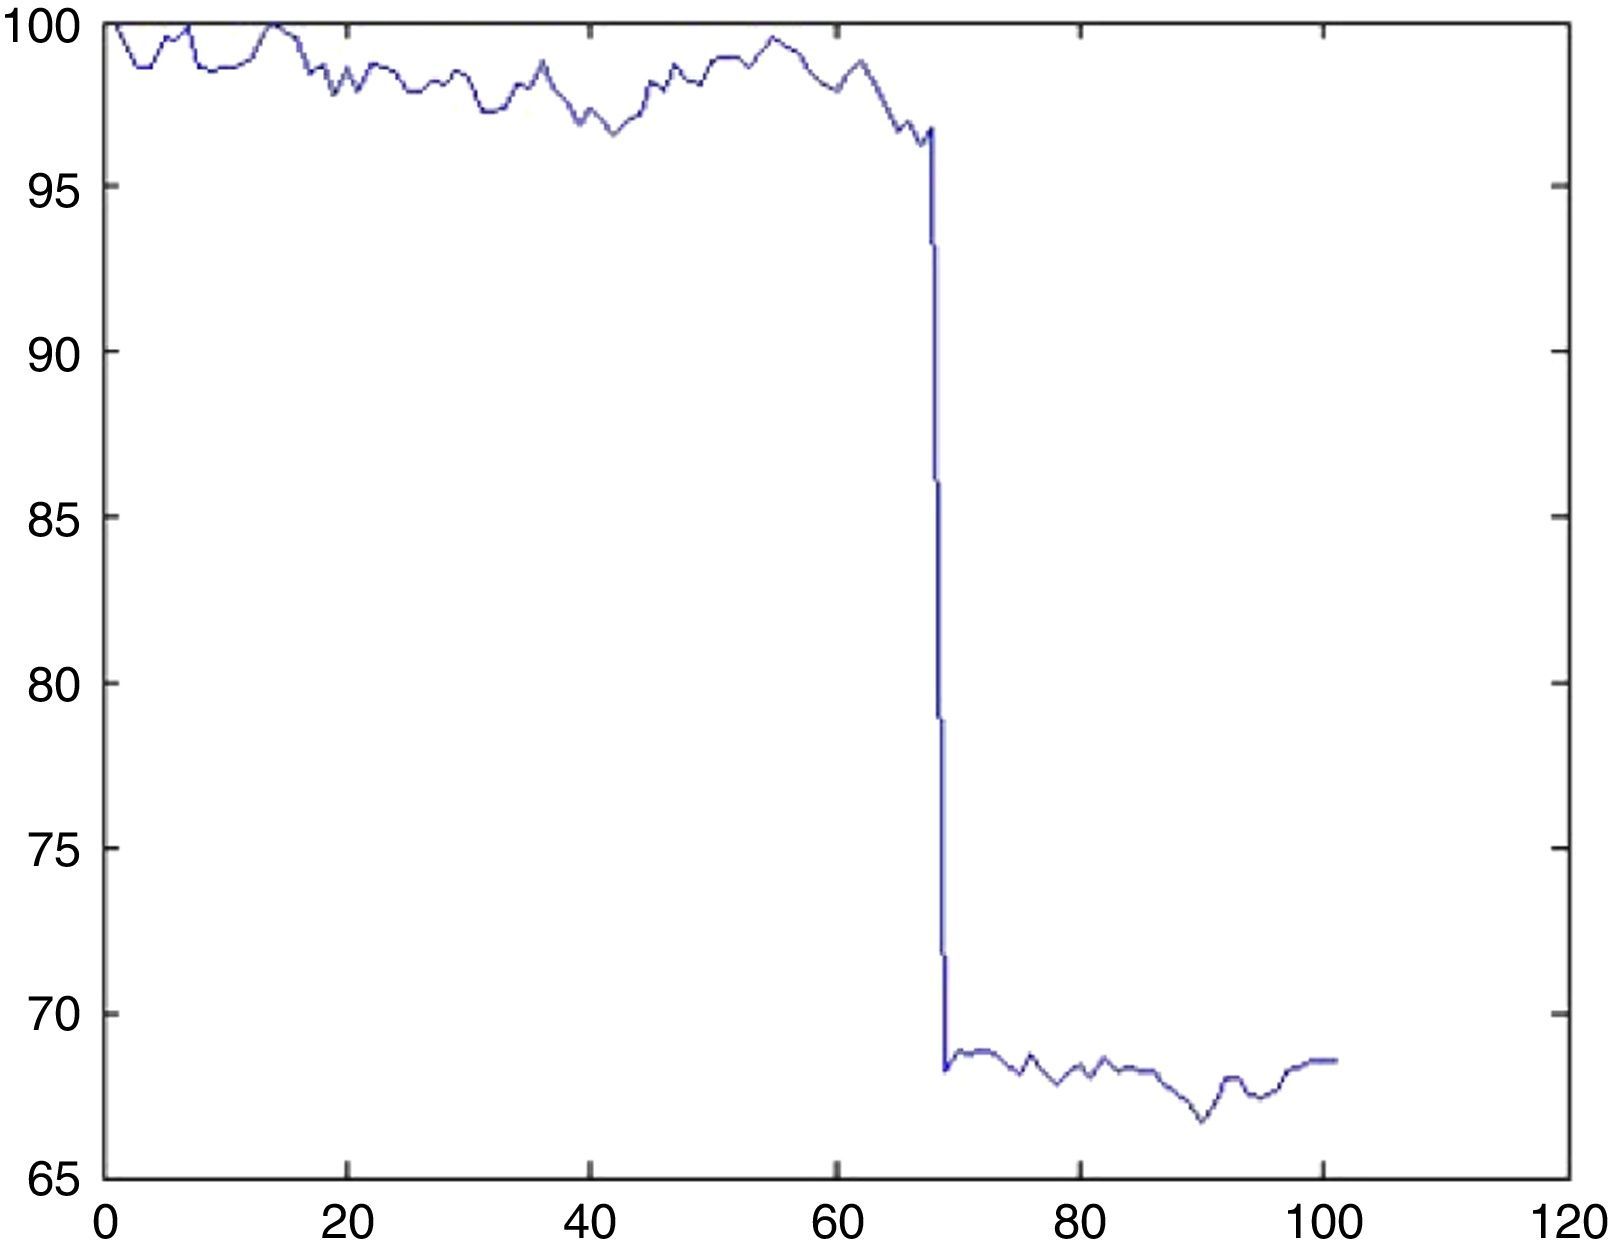
6.3Simulation of Nikkei 225 indexFor Nikkei 225 only 1 UU is observed for approximately 8000 days, therefore λ=0.0125. The probability that there will be an UU within this period can be computed from (5.1) by setting k=1 as 1.2%. Now the impact will be drawn from an exponential distribution with a rate parameter of λ=0.0125. With a probability of 1.2% we may witness a sharp decline of 29.7% (day 68, from 96.78 to 68.24) as depicted in Fig. 14.

Probability of having more than one UU now becomes 0.008%.
7ConclusionThis study considers rare events that have serious destructive effects to financial stability. In order to model these UUs, a compound Poisson process is proposed in which its intensity is taken to be random, drawn from an exponential distribution with a very low positive parameter. When this parameter gets closer to zero, in case of occurrence, its impact now becomes the reciprocal of the discussed parameter. Here the aim is to stress the fact that whenever the unknown event is more unpredictable its impact is expected to be much stronger. Also, the magnitude of this impact is randomly drawn.
The model is simulated with Mat Lab and applied it to three stock indices, namely Japan Nikkei 225, US Dow Jones Industrial Average and Turkish BIST 100. It is found that whenever the stock market becomes more stable, the probability of an UU significantly diminishes. However, the possible impact is negatively correlated with rareness. Thus if such a rare event happens, it is highly probable that its impact will be very high.

