

The aim of this study is to find out if the dependent variable, audit report with respect to the Portuguese public hospitals, is related/correlated to the independent variables (assets, liabilities, equity capitals, turnover or the number of workers). The research was carried out for a specific type of entity, and is based on the empirical analysis of the audit reports, detailed for years, issued between 2003 and 2008, to which we applied the methodology of box plots, complemented by a variance analysis (ANOVA to a factor). The results allow us to conclude that the dimension of the audited companies, measured according to the criteria mentioned above, does not have an influence on the type of audit report. The research is innovative at an international level and has been implemented for the first time in Portugal as it tackles the specific universe of public hospitals.
The Law 27/2002, of the 8th November, improved and applied by the Decree-Laws n° 233/2005, of the 29th December, and 244/2012, of the 9th November, establish the legal framework for the management of the large Portuguese public hospitals which were transformed into public establishments of a business nature, as limited liability companies (SA) and, later, as corporate public entities (EPE). This change in paradigm had an underlying liberal philosophy, as a general principal, based on the freedom of choice of health establishment, a service in real time and the rigorous compliance of the professional, ethical and deontological norms. This new philosophy is equally based on adequate provisional management instruments: plans of annual and multiannual activity and budgets. In addition, to accompany and control this new management strategy, all hospitals were part of a rigorous accountability process based on an evaluation founded on indicators measuring their performance and efficiency, despite the management of a public hospital being different from the management of a private hospital.
Alongside with this supervision of the management activity, a statutory auditor (ROC) controls the accountability process where the internal auditor proceeds to the internal control in the financial, operational, IT and human resources accounting areas. The auditors’ fees in the Portuguese public hospitals, in the form of a public corporate entity, are not defined in terms of public procurement, with the lowest price criterion. The auditors are appointed by the Ministry of Finance and currently their fees represent 22.5% of the salary of the Chairman of the Board of Directors, which amounts to a little more than €1000 (Article 15 of Decree Law 18/2017 of February 10). The appointment is made by the Ministry of Finance, which holds 100% of the shareholder control of EPE Hospitals. The reasons multinational auditors have not been appointed are unknown to us, however, it is understood that this measure avoids further strengthening the existing audit oligopolies.
It is important to note that the public hospitals SA/EPE are not a homogeneous reality. In effect, the first wave of transformation of the hospitals into SA comprises 31 hospitals belonging to the administrative public sector, with different sizes, when evaluated according to the assets, the liability, the equity capital, the business turnover and the number of workers.
From the analysis of the reports issued by the statutory auditors between 2003 and 2008, we noticed that the great majority of the audit reports were qualified with various reserves, and also comprised emphases on the most varied aspects of hospital management.
Given that the entities mentioned above were audited for the first time following the statutory auditor's model, we wanted to know if it was possible to establish correlations between the audit reports that express an auditor's opinion or judgement on the patrimony, finances of the hospital sector, and the dimension of the hospitals considered in the light of the indicators mentioned above: this is the theme of the study.
The theme is innovative in Portugal and, as far as we know, at an international level. Indeed, as far as we are aware, the relationships between the quantities reflected in the financial statements (DF) and the type of audit report have not been globally researched. This important particularity is the subject of research: public hospitals legally considered EPE/SA.
To carry out our research, we have reviewed in the second section the existing bibliography directly or indirectly related to this subject. In the third section, we present the methodology used in the approach, to then, in the fourth part analyse it. In the fifth section, we discuss the results. Finally, in the sixth section, we present the conclusions, the limitations of the study and the proposals for further research.
2Literature reviewThe quality of an audit is fundamental for all the stakeholders interested in the company. This attribute is based on numerous judgments made by auditors during an audit, which are considered determinant elements in the type of opinion released. As referred by Maijoor and Vanstraelen (2012), the quality of an audit and the public trust are the two sides of the same coin, and, without this, an audit has no value. These attributes – quality of an audit, judgement and report of opinion – are strictly connected and are based on a professional scepticism attitude, considered to be a fundamental anchor in the development of the whole audit process. In fact, this posture allows for the permanent adjustment of the nature, the time and the extension of the auditing procedures (Popova, 2013). Indeed, Carmichael and Craig (1996) consider that one of the main reasons for the failures in audits is the fact that the auditor does not keep the procedure of permanent doubt when gathering essential evidence for the adequate type of report. This attitude is also pointed out as fundamental by the regulators (PCAOB, 2008), Gunny and Zhang (2013) and by Bluhm and Cowperthwaite (2013) who supervise the quality of the work carried out by auditors – in which the report of opinion is included –, and they concluded that there is a lack of scepticism and objectivity in the performance of an audit. In turn, Nelson (2009) considers that the professional suspicion is related to the auditor's personal traits, and with the specific experience of dealing with a certain type of clients. Thus, the most incredulous auditors evaluate with more depth the evidence related to fraud than the less suspicious auditors (Chen, Trotman, & Zhou, 2015; Popova, 2013).
Consequently, the behavioural factor is fundamental to ascertain the quality of the type of audit report, as referred by Quadackers (2007), Rose (2007) and Shaub and Lawrence (1996). This preoccupation was also recently voiced by Bhattacharjee and Moreno (2013). These authors examined the implications of emotions and moods in the quality of the auditors’ judgments and confirmed Akers and Porter's (2003) research that suggests, as a criticism, the emotional intelligence for the success of judgments.
Along with the analysis of the qualitative component, expressed in the psychological component, as a determining factor of the final quality of the audit report, the institutional aspect approach is also considered important, both in the regulator's perspective (Gunny & Zhang, 2013), and in the view of the governance system of the auditing company itself: when we observe the transparency reports and their relevance in the quality of an audit (Deumes, Schelleman, Bauwhede, & Vanstraelen, 2012).
In the first focus, the authors suggest that there is a change in the paradigm when the supervision carried out by AICPA (American Institute of Certified Public Accountants) was transferred to PCAOB (Public Company Accounting Oversight Board), an institution that develops four essential programmes: subject, inspection, issue of norms and enforcement (Brown, 2017; Defond, 2010). In this sense, Carcello, Neal, Palmrose, and Shohz (2011) and Lenox and Pittman (2010) concluded that the PCAOB's supervision encourages the auditors to carry out high quality audits. The supervision carried out by the auditing committee is also referred to as an instrument that can raise the quality of the audit report and of the disclosed financial information (Bruynseels & Cardinaels, 2014; Cohen, Hoitash, Krishnamoorthy, & Wright, 2014).
In turn, Deumes et al. (2012) examined the transparency reports of some auditing firms and found a weak relationship between the audit report and the efficiency of internal control system (Boyle, DeZoort, & Hermanson, 2015). Indeed, the transparency reports, containing information about the corporate governance system implemented in the auditing company, may be used as a differentiating strategy and as a sign of the quality of the audit or are simply disclosed to comply with the minimum legal requirements. However, IOSCO (2009) suggests that there is a positive correlation between the practices of the auditing firms and the quality of the audits: the procedure policies related with continuous training, the supervision of the independence and the internal control define the quality of the audit as a variable dependent on them, and their disclosure in the transparency report provides valuable information on the quality of the audit (Bruynseels & Cardinaels, 2014; Gold, Gronewold, & Salterio, 2014; Martinez-Blasco, Garcia-Blandon, & Vivas-Crisol, 2016).
The quality of the audit report is also a determining factor of the expectation gap, and the successive revisions of ISA 700, which rule the audit report, have been developed to strengthen it to reduce the difference of expectations. The successive changes in the standard report are made to provide the users with a comprehension more aligned with their expectations regarding the auditors’ responsibilities, the company's management and the reliability of the financial statements, which are pointed out by Gold, Groneworld, and Pott (2012). However, the same researchers continue to refer that despite the successive alignments of ISA 700, there still is a expectation gap, as it is also suggested by Best, Bucky, and Tan (2001), Monroe and Woodliff (1993) and Porter (1993).
Another line of studies (Blankley, Hurtt, & MacGregor, 2015; Cao, Kubick, & Masli, 2017; Habib, 2015; Jacka, 2017; Mitra, Song, & Yang, 2015) refers to the audit report lag, also known as auditing lag, and refers to the occurrence of time lapse between the date of the closing of accounts and the date of the audit report. The research in this area aims to demonstrate that a long auditing lag puts the quality of the audit report at risk by depriving the users of the audited financial information enabling them to take decisions in good time (Blankley, Hurtt, & Macgregor, 2014; Rehuel, Caneghem, & Verbruggen, 2013). Thus, the information value of the audit report decreases when the auditing lag increases, in the sense that the investors can obtain information from other sources (Knechel & Payne, 2001; Martinez-Blasco et al., 2016). The previous dimensions of the quality of the audit report are essentially qualitative and are based on elements such as psychological, institutional, and the reaction of the users in relation to the expectation gap and the audit report lag. We must also refer in the international bibliography the determining quantitative literature of the audit reports. These studies give us evidence regarding the modified or non modified reports, correlated with a financial structure of the audited companies and with capital markets indicators. The results suggest that the quantitative models can be useful to auditors in the sense that their judgments are systematically related to the variables given (Dopuch, Holthausen, & Leftwich, 1987). They also allow identifying the clients with the probability of receiving modified audit reports or reports to be used as a mechanism to support the recruitment of potential clients. They may also serve as a benchmark to compare the level of consensus in this profession, as well as the probability of a typical auditor issuing a report under identical circumstances and environment. They also facilitate the overcoming of debates related to the opinion shopping, with the control of quality and the evaluation of the auditor's conduct in court. Ireland (2003) studied, in the United Kingdom, the association between the disclosed audit reports and the observable characteristics of the companies, including the dimension of the auditing company. These studies refer essentially to modified reports to encompass the issue of going concern versus non-going concern, based on disagreements or limitations of scope. We are dealing with predictive techniques of company bankruptcies that provide the auditors with operative and subsidiary criteria to direct their professional performance. They are considered to be an objective tool on which the auditor relies to give an opinion regarding the continuity of the company, reducing therefore the risks of issuing an opinion and avoiding the possible consequences of making mistakes (Enguídanos, 1995). Beaver (1966) presents an analysis with only one variant as a technique to predict the suspension of payment, to which he associated other financial indicators: cash-flow, assets, liabilities, sales, net income, and so on, and concluded that the predictive quality of the indicators is not the same, as it attributes greater forecasting capacity to the cash flow/total liability indicator. Altman and McGough (1974), with their Z-score, present a set of financial indicators: reserves, total assets, EBITDA, total liability, total sales, value of the company, connected to each other in a general and discriminating model, with the potential to quickly identify the companies with continued management problem.
3Methodology3.1Characterisation of the sample and formalisation of hypothesesThe data used to carry out this study were obtained on the site http://www.hospitaisepe.min-saude.pt on the 31st December 2013, where the financial statements and reports of the EPE hospitals are published. Indeed, the Health Ministry, from 2003 to 2008, followed the evaluation of the management instruments previously mentioned. However, after the last search, there were no additional data published. The analysis focused on the whole of the SA/EPE that disclosed their financial statements on the site mentioned above.
The list of hospitals that were progressively transformed in a SA/EPE between 2003 and 2008 are presented in Appendixes 1, 2 and 3, complemented by the chosen variables. The Francisco Gentil Oncology Portuguese Public Hospitals are, as of now, identified by the abbreviations IPOFG, followed by the city where they are domiciled.
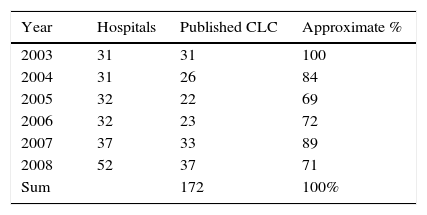
The published CLC in Table 1 were also collected (Appendix 5).
We proceed to the analysis of the content of the audit reports (RA) or (CLC) issues to classify them and to break down by type of opinion: not modified (without reserves and without emphasis), or modified (with reserves and with emphasis), aiming at classifying and determining the incidence of the most frequent reserves or emphases.
To find out if the independent variables that define the balance sheet (assets, equity capital and liability), as well as the dimension (turnover) and the human resources (number of workers) of the hospitals, will condition the audit report dependent variable, we carried out a study on the values these variables took during the period of 2003 to 2008.
The RA/CLC permit to congregate the hospitals into 4 groups in accordance with the reserves and/or the emphases that reflect the auditor's evaluation; the following groups were subsequently formed:
- •
without reserves and without emphases;
- •
without reserves and with emphases;
- •
with reserves and without emphases;
- •
with reserves and with emphases.
We intend to find out if some independent variables: assets, equity capital, liability, turnover and number of workers can be considered a source of variability of the RA/CLC dependent variable, considering the following reasons:
- –
The assets, as a measure of the dimension of the hospitals, are an indicator that may reflect the existence or the absence of formal internal control systems that are more developed in bigger hospitals. The possibility of having more improved systems in these institutions would have, as a consequence, less probability of receiving a modified CLC. Dopuch et al. (1987), Ireland (2003) and Keasey, Watson, and Wynarzcyk (1988) used singly a ratio the value of the assets.
- –
The liability comprises the set of liabilities of the hospitals, short term and long term. The excessive indebtedness of the hospitals is greatly scrutinised by the taxpayers and all the suppliers and, in this context, not taking into account the indebtedness in the audit report would result in reputation damage and a possible legal action against the auditor. We could not, however, detect in the literature authors who have used this indicator solely.
- –
The equity capital, as a differential greatness between the total of the assets and the liabilities, reflects the hospital's capacity of solvency at medium and long term. However, the excessive indebtedness, the occurrence of negative results, and the sequential deterioration of the working capital reveal situations of unbalance that the auditor cannot disregard, and, that, by law, imply modified audit reports, especially, when there is a loss of more than half of the capital. In these cases, the auditor always qualifies the report. This indicator was not found on its own in the studied literature. However, part of the equity capital – net profit or reserves or freed funds – are used, among other indicators, by Altman and McGough (1974) and Beaver (1966) to qualify the going concern.
- –
The turnover and the number of workers are indicators which must be sustained by a good level of internal control related to the recognition of gains and the cut-off of the closing of accounts, to which is added the complexity of the remunerations in the hospital system. These situations jointly or separately reflect the dimension of the hospitals and the probability of having modified audit reports. The turnover does not appear on its own but is related to the total assets, and is used by Altman and McGough (1974) to show the efficiency of the sales through assets turnover.
For the statistical analysis of the data, we used the variance analysis, ANOVA to 1 factor. This choice was based on the fact that this is an analysis of the influence of 1 factor on the groups of data.
The hypotheses defined were as follows:
H0: The assets were similar in the 4 groups
H0: The equity capital is similar in the 4 groups
H0: The level of indebtedness is similar in the 4 groups
H0: The dimension of the hospitals (Turnover) is similar in the 4 groups
H0: The human resources (N° of workers) are similar in the 4 groups
The alternative hypothesis would be:
H1: There are significant differences in the 4 groups
To analyse the data we used the Statistical Package for the Social Sciences (SPSS). The unit used for the monetary variables was the million of Euros (M).
We began the exploratory analysis of the data by building the boxplots for the different variables under study and for all the years. Through these graphs we can evaluate the empirical distribution of the data, namely the dispersion, the symmetry and the existence of outliers and also choose the most adequate statistical tests.
4.1Analysis of year 2003In Fig. 1 we can see the number of reserves and emphases given to each hospital under study.

In 2003, there are no data for the group “with reserves and without emphases” and for the group “without reserves and without emphases” there is only one occurrence and therefore we can only compare the two other groups.
In relation to the assets, according to Fig. 2, we notice a negative asymmetry in the group “with reserves and with emphases”.
, 2003.")
We can also see an outlier in the group “without reserves and with emphases”. In this group with 7 occurrences where the assets vary between 27 and 80M, Hospital Garcia da Orta, EPE presents assets of about 123M.
The equity capital the distribution of the 2 groups, according to Fig. 3, is closer to the normal distribution and we recognise an outlier in the group “with reserves and with emphases”, Centro Hospitalar do Médio Tejo, EPE. In this group the mean and the median are close, about 25M, and the hospital out of the limits has an equity capital of 88M.
, 2003.")
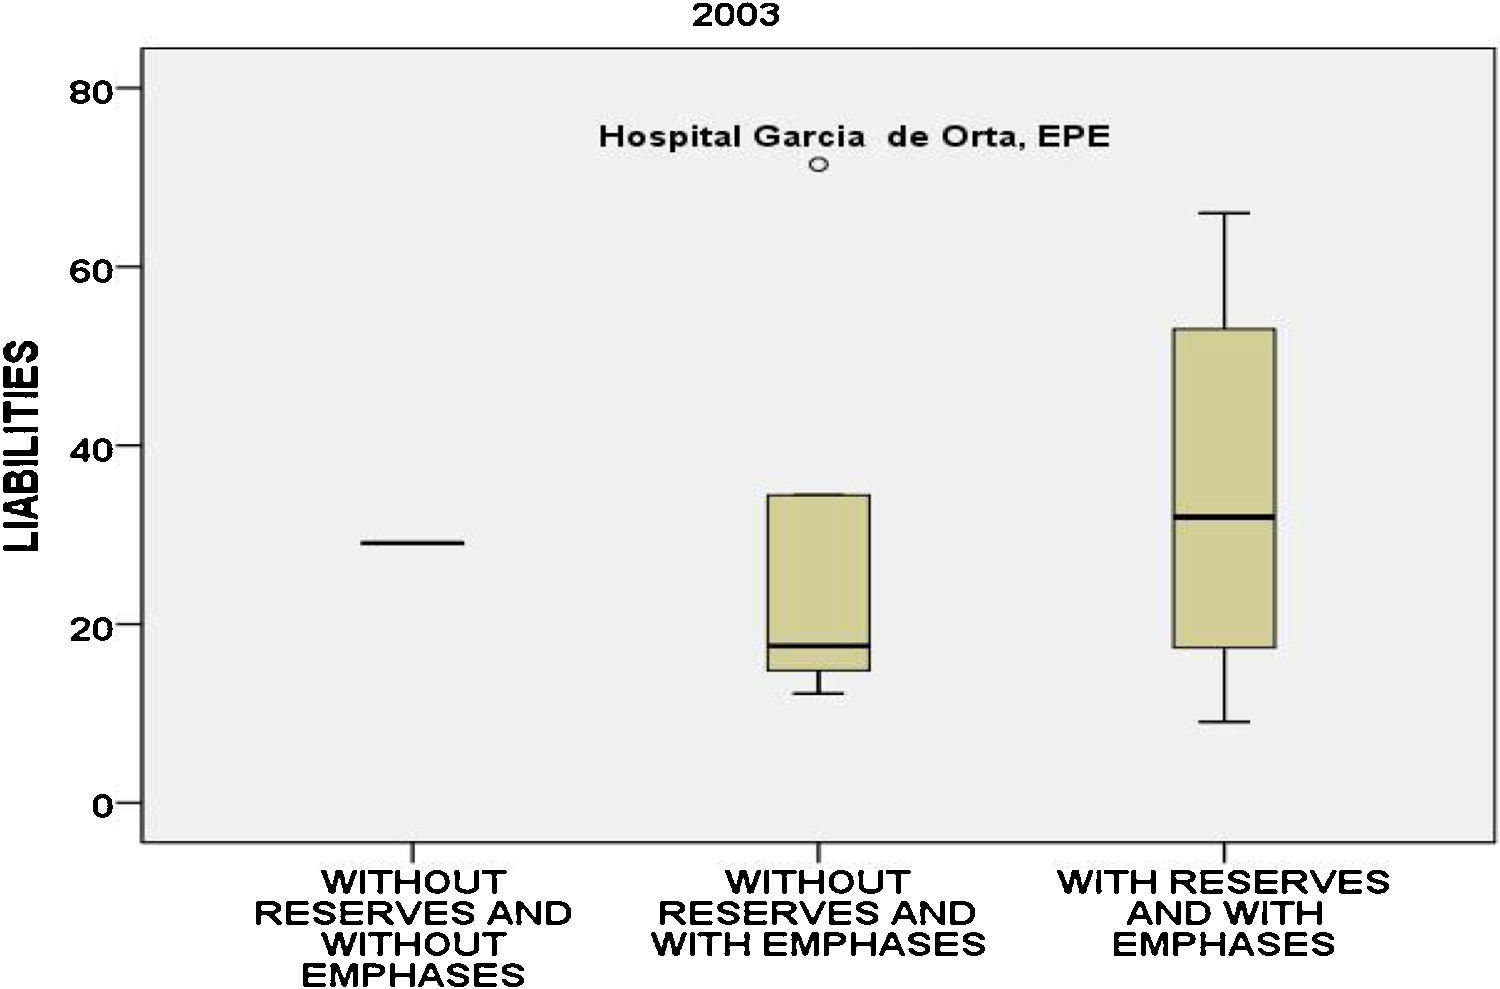
In relation to the liability (Fig. 4), in the group “without reserves and with emphases”, we can see that it varies between 12 and 34M and the Hospital Garcia da Orta, EPE stands out once more from the others with a liability of about 71M.
, 2003.")
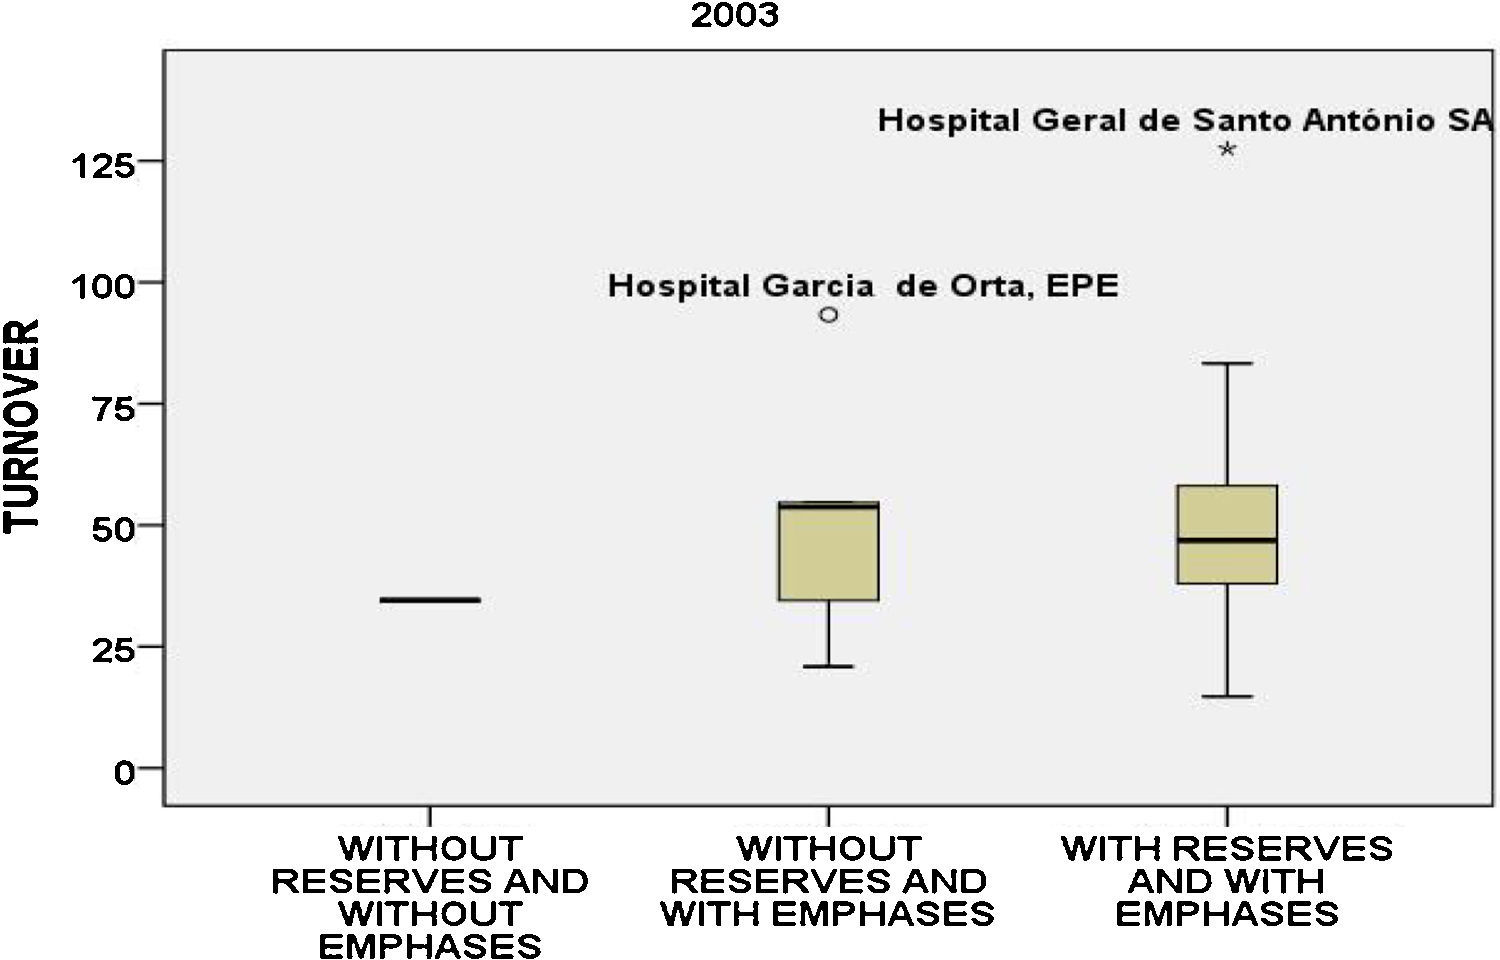
Also in the turnover (Fig. 5), the Hospital Garcia da Orta, EPE shows a value above the others of its group and its mean is around 52M.
, 2003.")
In the group “with reserves and with emphases” where there is a normal distribution with a mean equal to the median, round 50M, the Hospital Geral de Santo António SA is an outlier with 127M turnover.
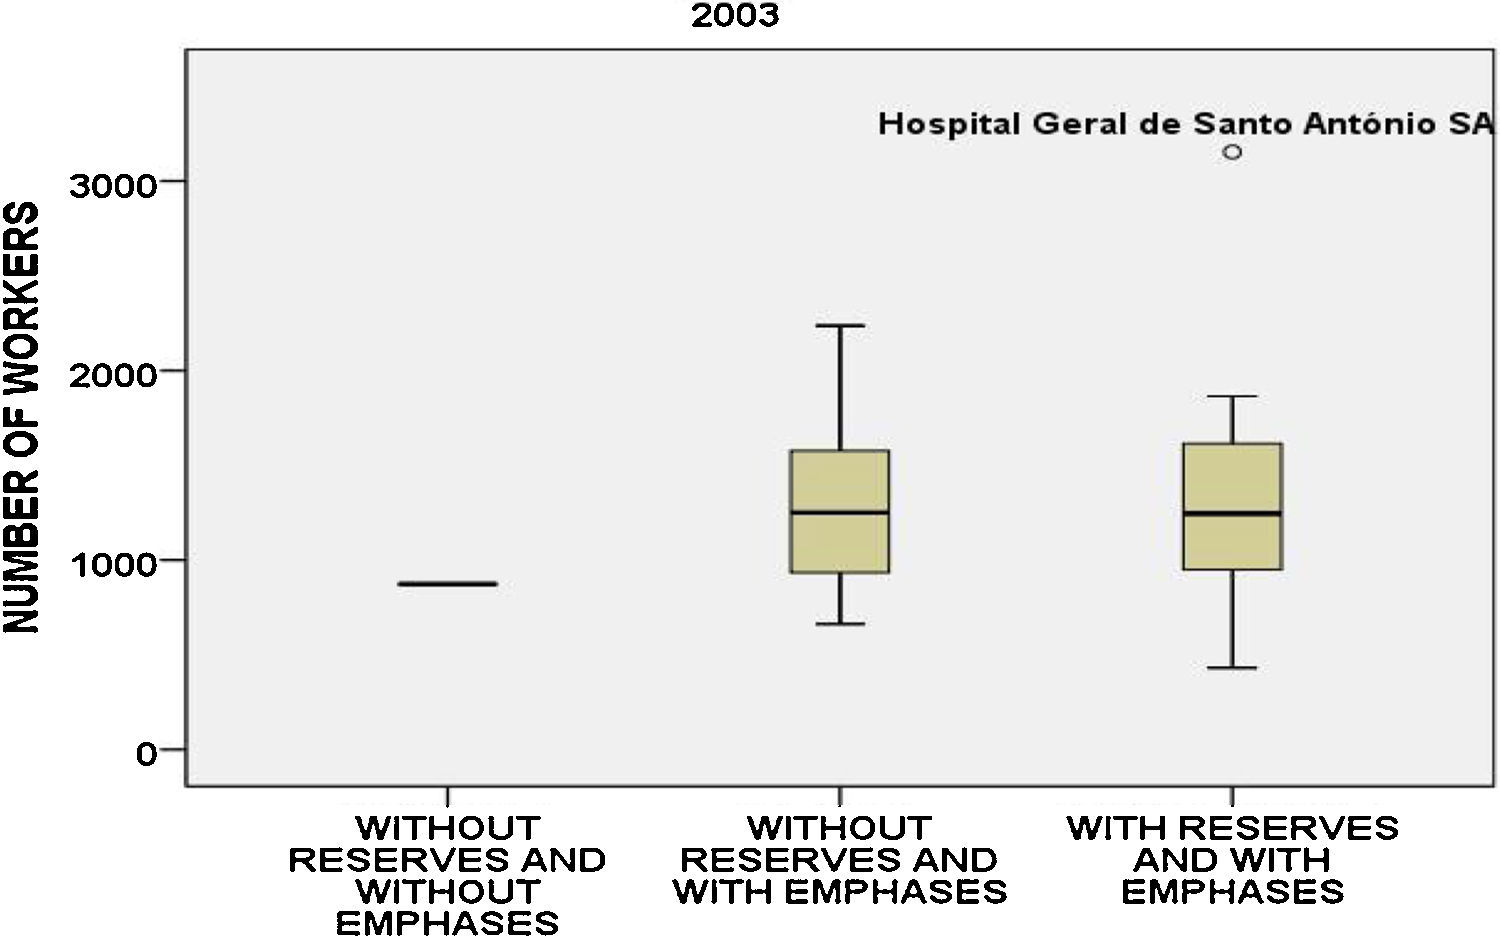
Regarding the number of workers (Fig. 6), we can clearly see that there are differences between the 2 groups but the Hospital Geral de Santo António SA has nearly tripled the mean of the other hospitals with 1280 workers.
, 2003.")
The boxplots can compare the various groups without knowing anything about the subjacent statistical distributions. By observing the graphs we quickly notice that there are no great differences between the groups. However, to confirm this evaluation we carried out a variance analysis, ANOVA, to be able to accept or reject the hypothesis through statistical indicators. We obtained the following results (Table 2).
ANOVA results, 2003.
| Sum of squares | Df | Mean square | F | Sig. | |
|---|---|---|---|---|---|
| Assets | |||||
| Between groups | 25,477 | 2 | 12,738 | 0.011 | 0.989 |
| Within groups | 31,854,571 | 28 | 1,137,663 | ||
| Total | 31,880,048 | 30 | |||
| Equity capital | |||||
| Between groups | 151,652 | 2 | 75,826 | 0.147 | 0.864 |
| Within groups | 14,452,673 | 28 | 516,167 | ||
| Total | 14,604,325 | 30 | |||
| Liability | |||||
| Between groups | 230,348 | 2 | 115,174 | 0.305 | 0.739 |
| Within groups | 10,557,251 | 28 | 377,045 | ||
| Total | 10,787,599 | 30 | |||
| Turnover | |||||
| Between groups | 259,070 | 2 | 129,535 | 0.225 | 0.800 |
| Within groups | 16,125,905 | 28 | 575,925 | ||
| Total | 16,384,975 | 30 | |||
| N° of workers | |||||
| Between groups | 175,828,807 | 2 | 87,914,404 | 0.273 | 0.763 |
| Within groups | 8,705,806,659 | 27 | 322,437,284 | ||
| Total | 8,881,635,467 | 29 | |||
Source: SPSS.
ANOVA basically divides the variability into variability between groups and variability within the groups and compares both. As we can see in the table obtained from SPSS, the variability within the groups is much greater than the variability between the groups.
The statistic of the test is F, whose value is compared with the degrees of freedom to obtain the p-value, the probability of significance.
In this specific case, the probability of significance is very high, between 0.739 and 0.989 and therefore we cannot reject a null hypothesis H0. We may conclude that there are no statistically significant differences between the 2 groups.
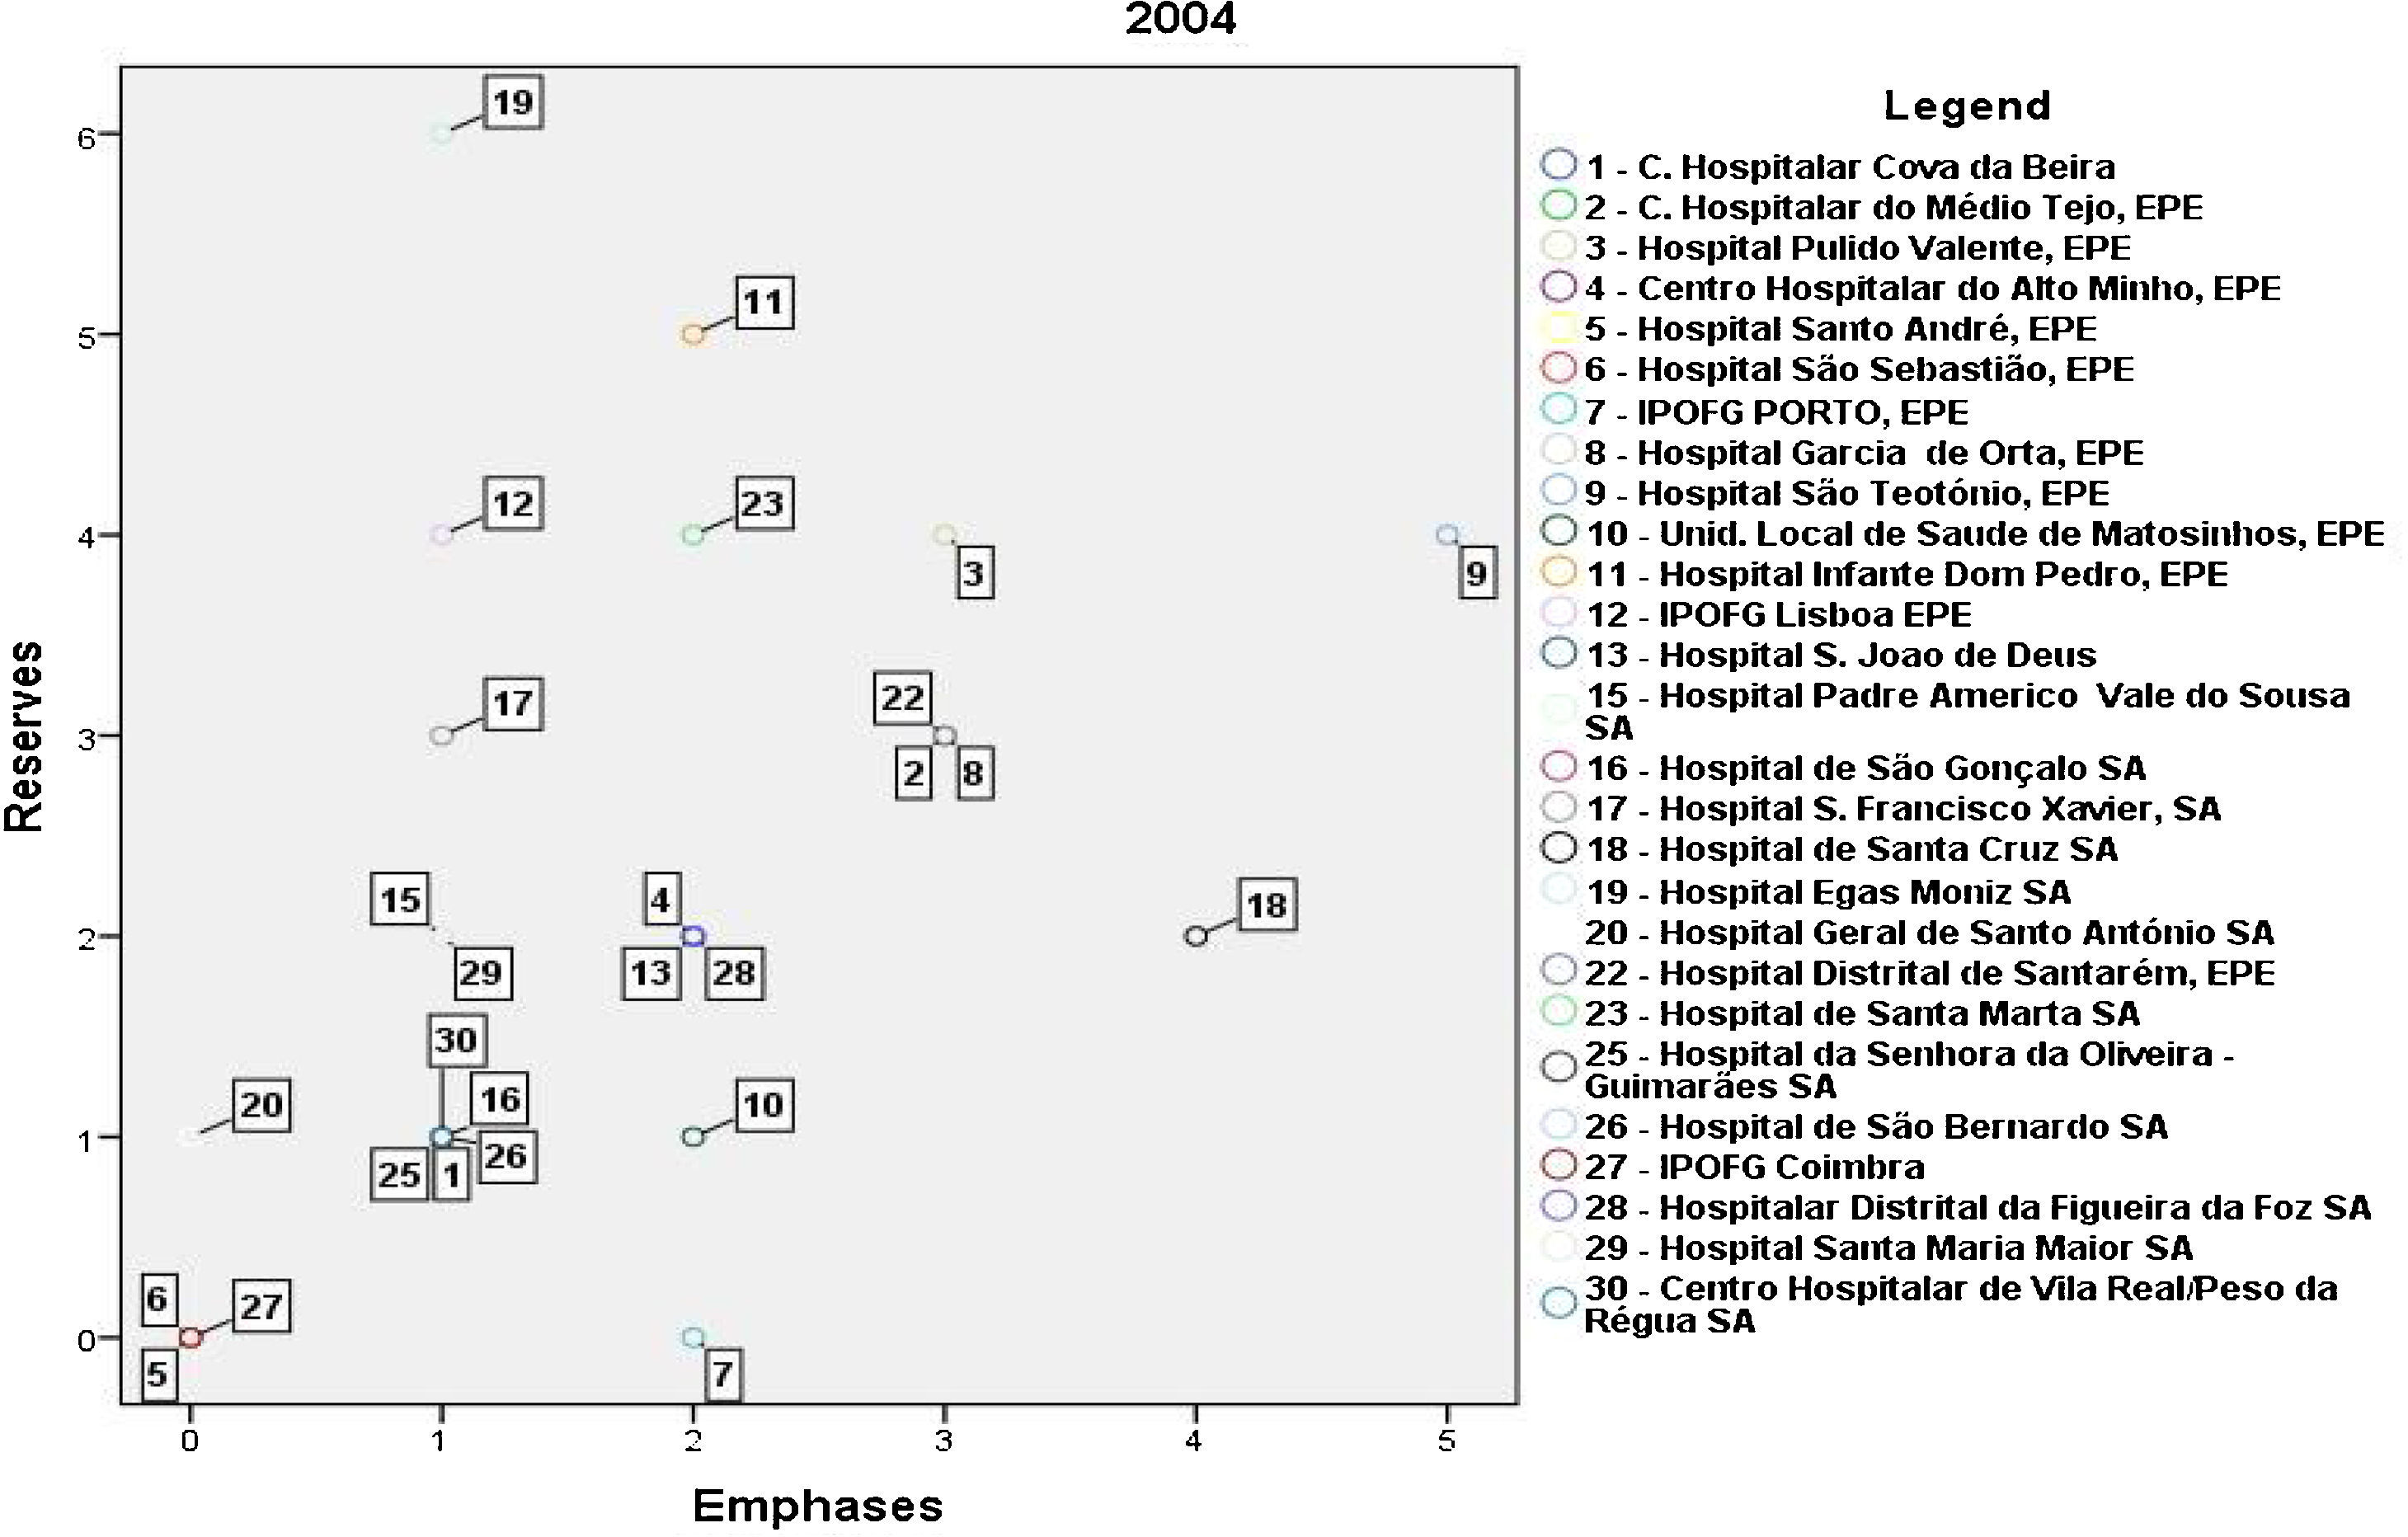
4.2Analysis of the year 2004The reports issued by the auditors for the 30 hospitals are provided in Fig. 7.

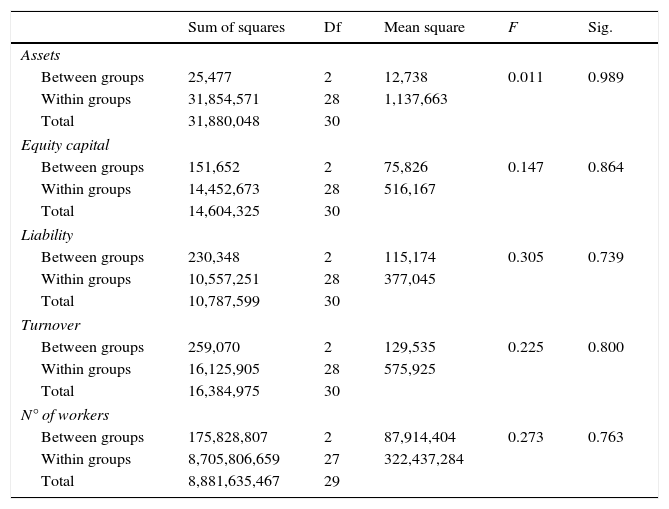
According to Fig. 7, in 2004, the number of cases is not sufficient to do a variance analysis since there is only one occurrence in 2 groups. The distribution in the 4 defined groups is the following in millions of euros (Table 3):
ANOVA results, 2004.
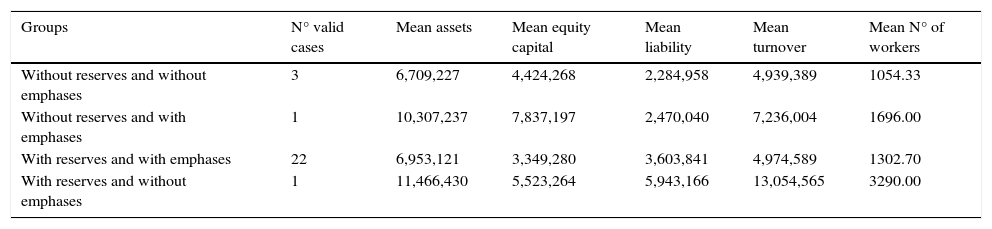
| Groups | N° valid cases | Mean assets | Mean equity capital | Mean liability | Mean turnover | Mean N° of workers |
|---|---|---|---|---|---|---|
| Without reserves and without emphases | 3 | 6,709,227 | 4,424,268 | 2,284,958 | 4,939,389 | 1054.33 |
| Without reserves and with emphases | 1 | 10,307,237 | 7,837,197 | 2,470,040 | 7,236,004 | 1696.00 |
| With reserves and with emphases | 22 | 6,953,121 | 3,349,280 | 3,603,841 | 4,974,589 | 1302.70 |
| With reserves and without emphases | 1 | 11,466,430 | 5,523,264 | 5,943,166 | 13,054,565 | 3290.00 |
Source: SPSS.
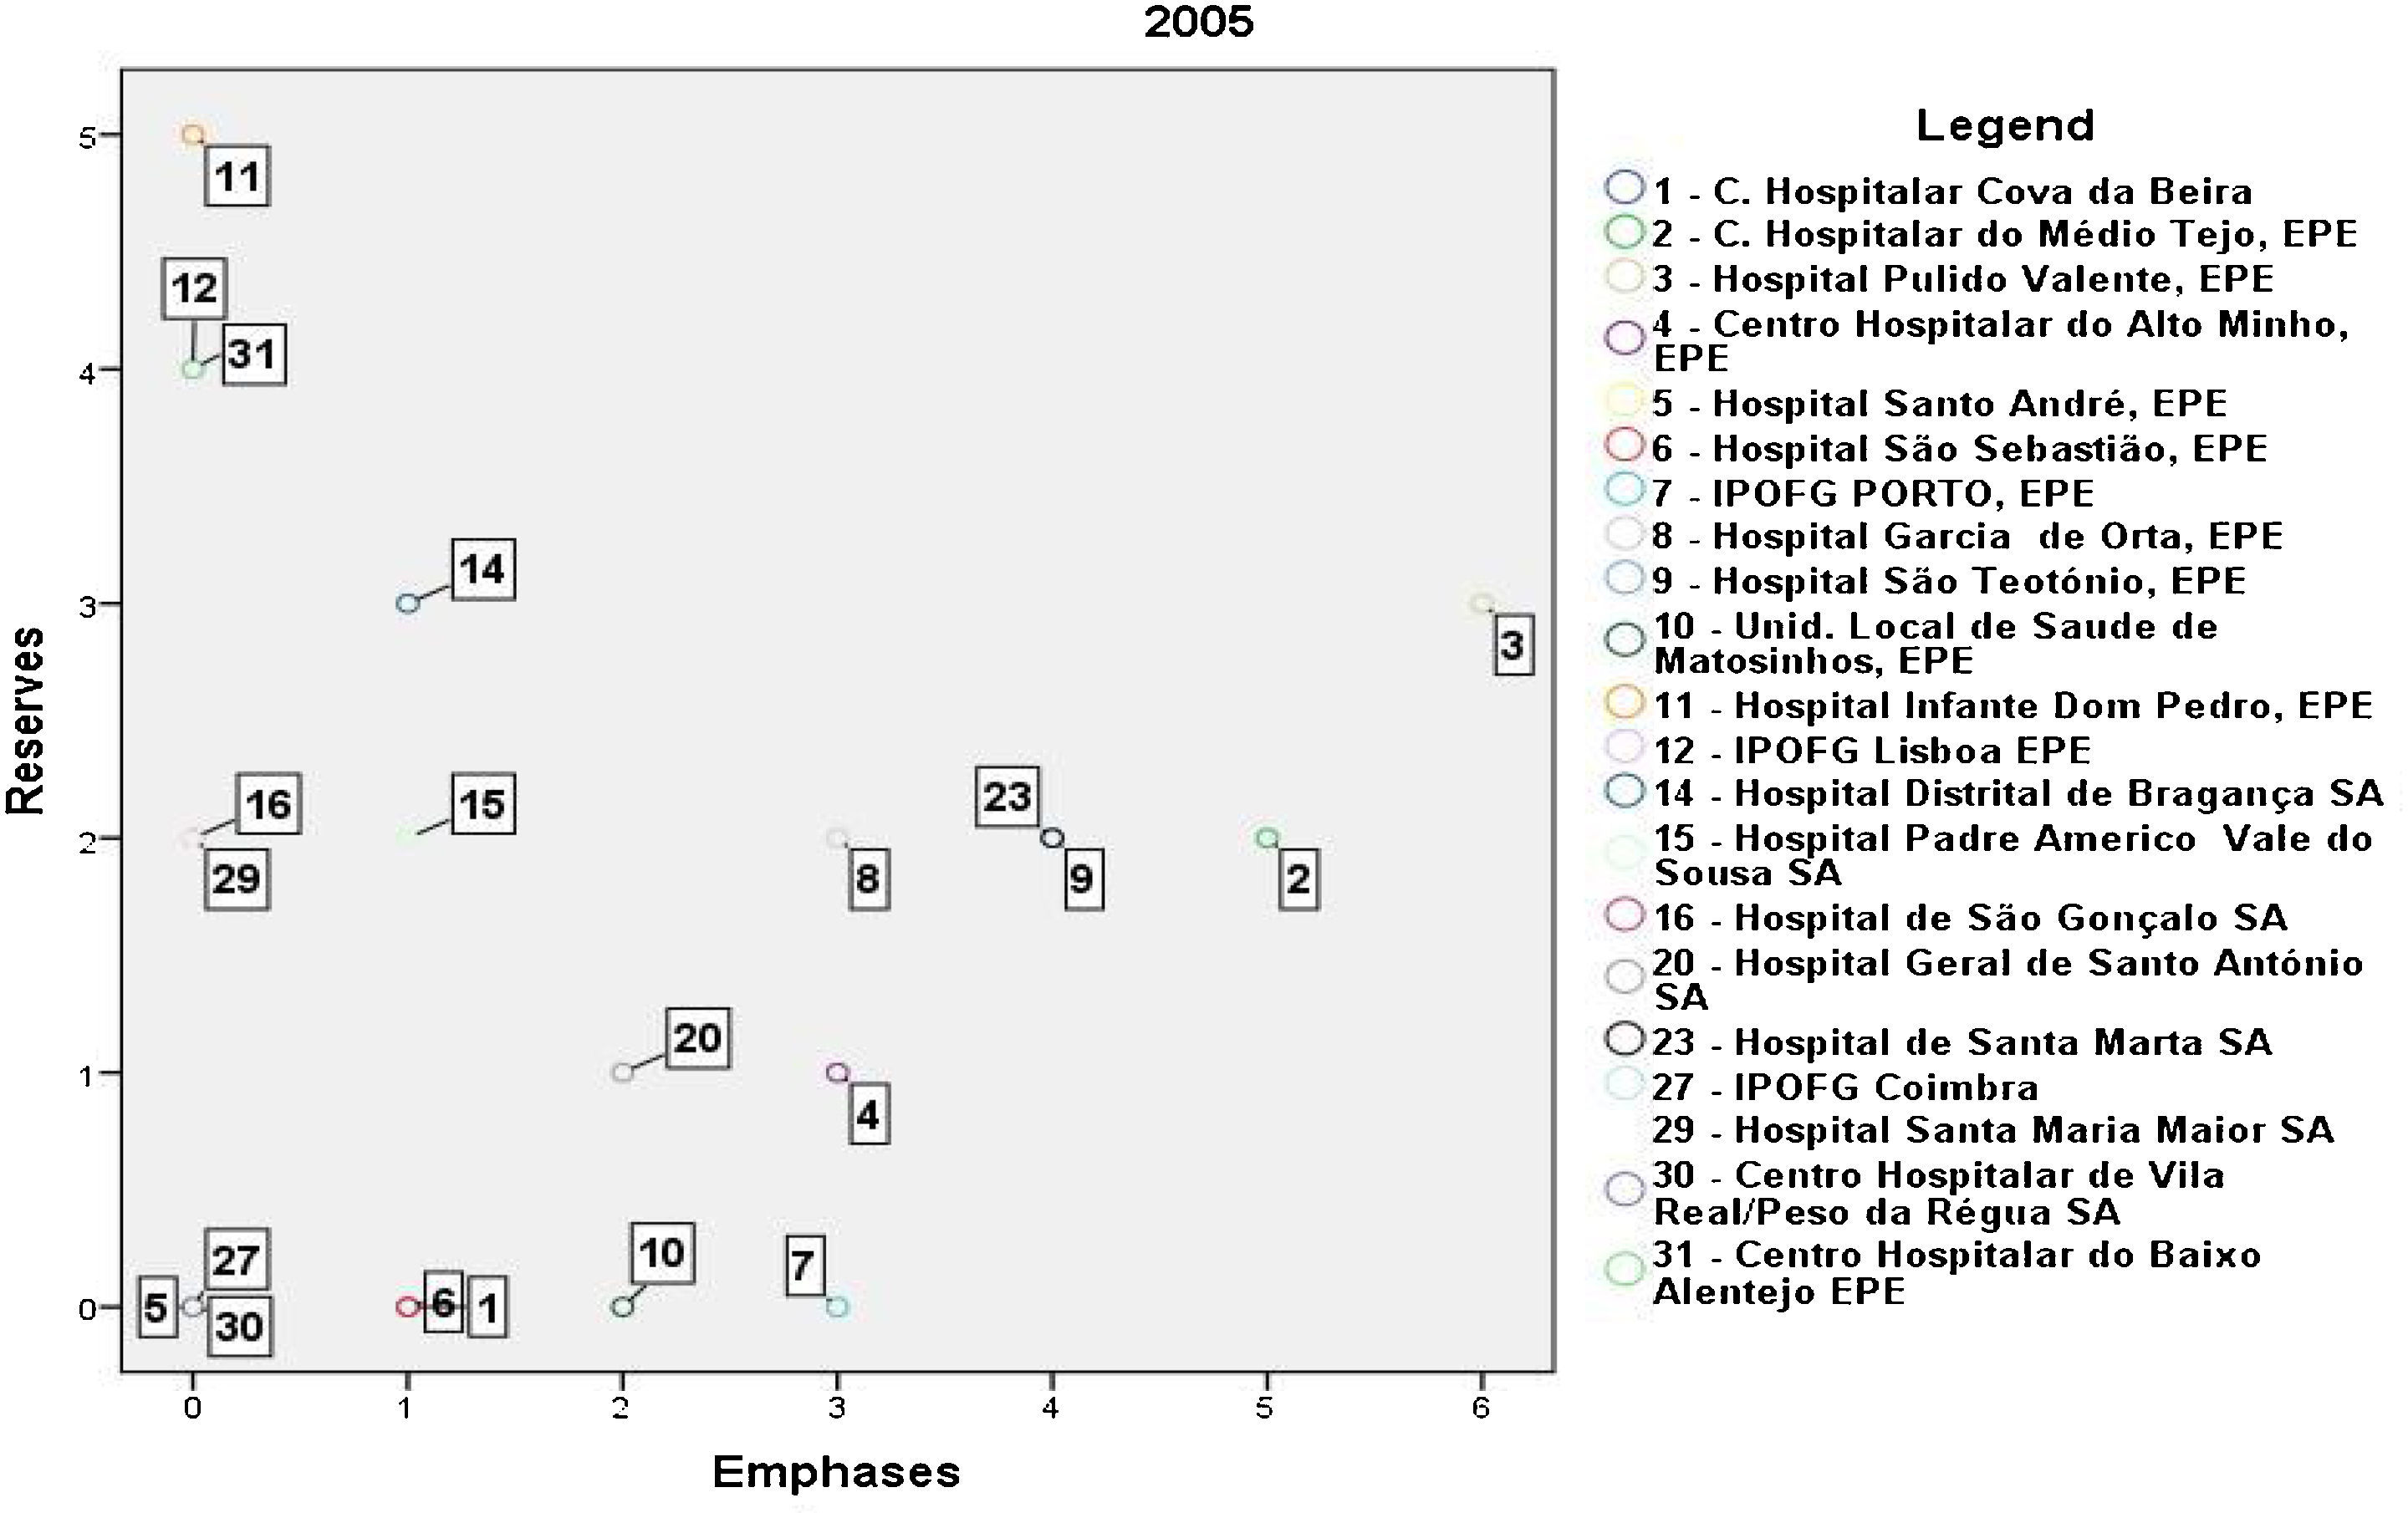
Fig. 8 presents the reports issued by the auditors for the 31 hospitals.

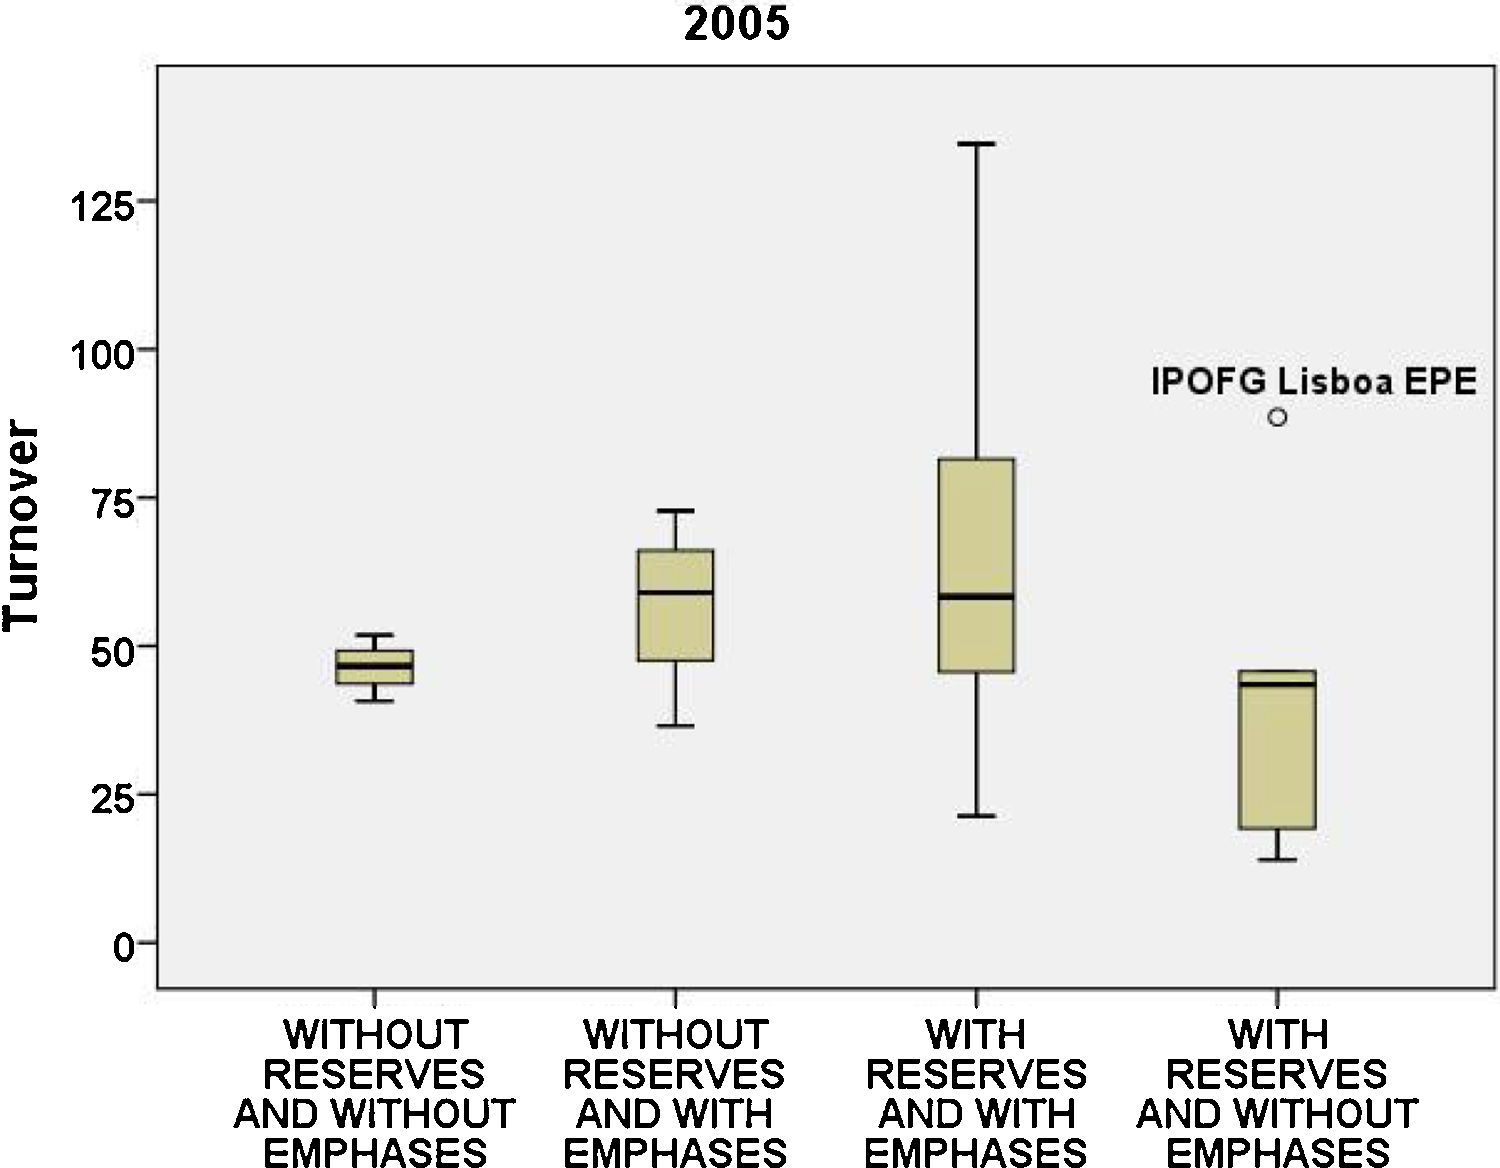
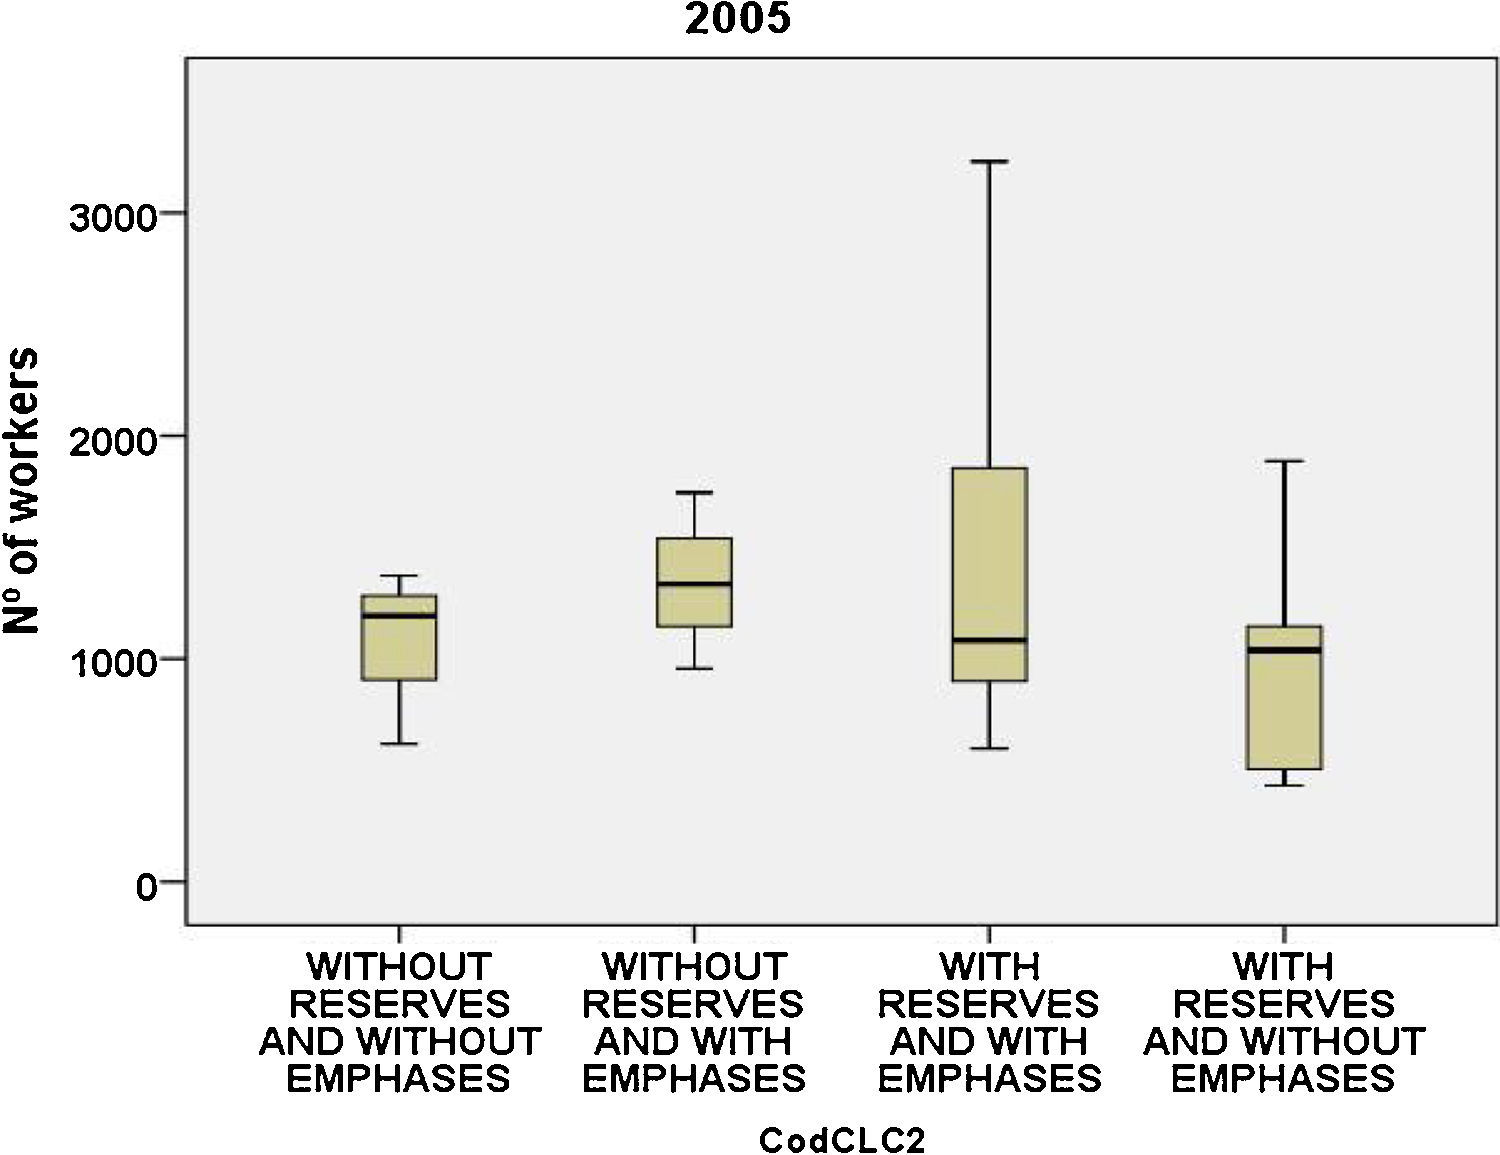
In 2005, according to Fig. 8, we have a more balanced distribution in terms of number of cases in each group.
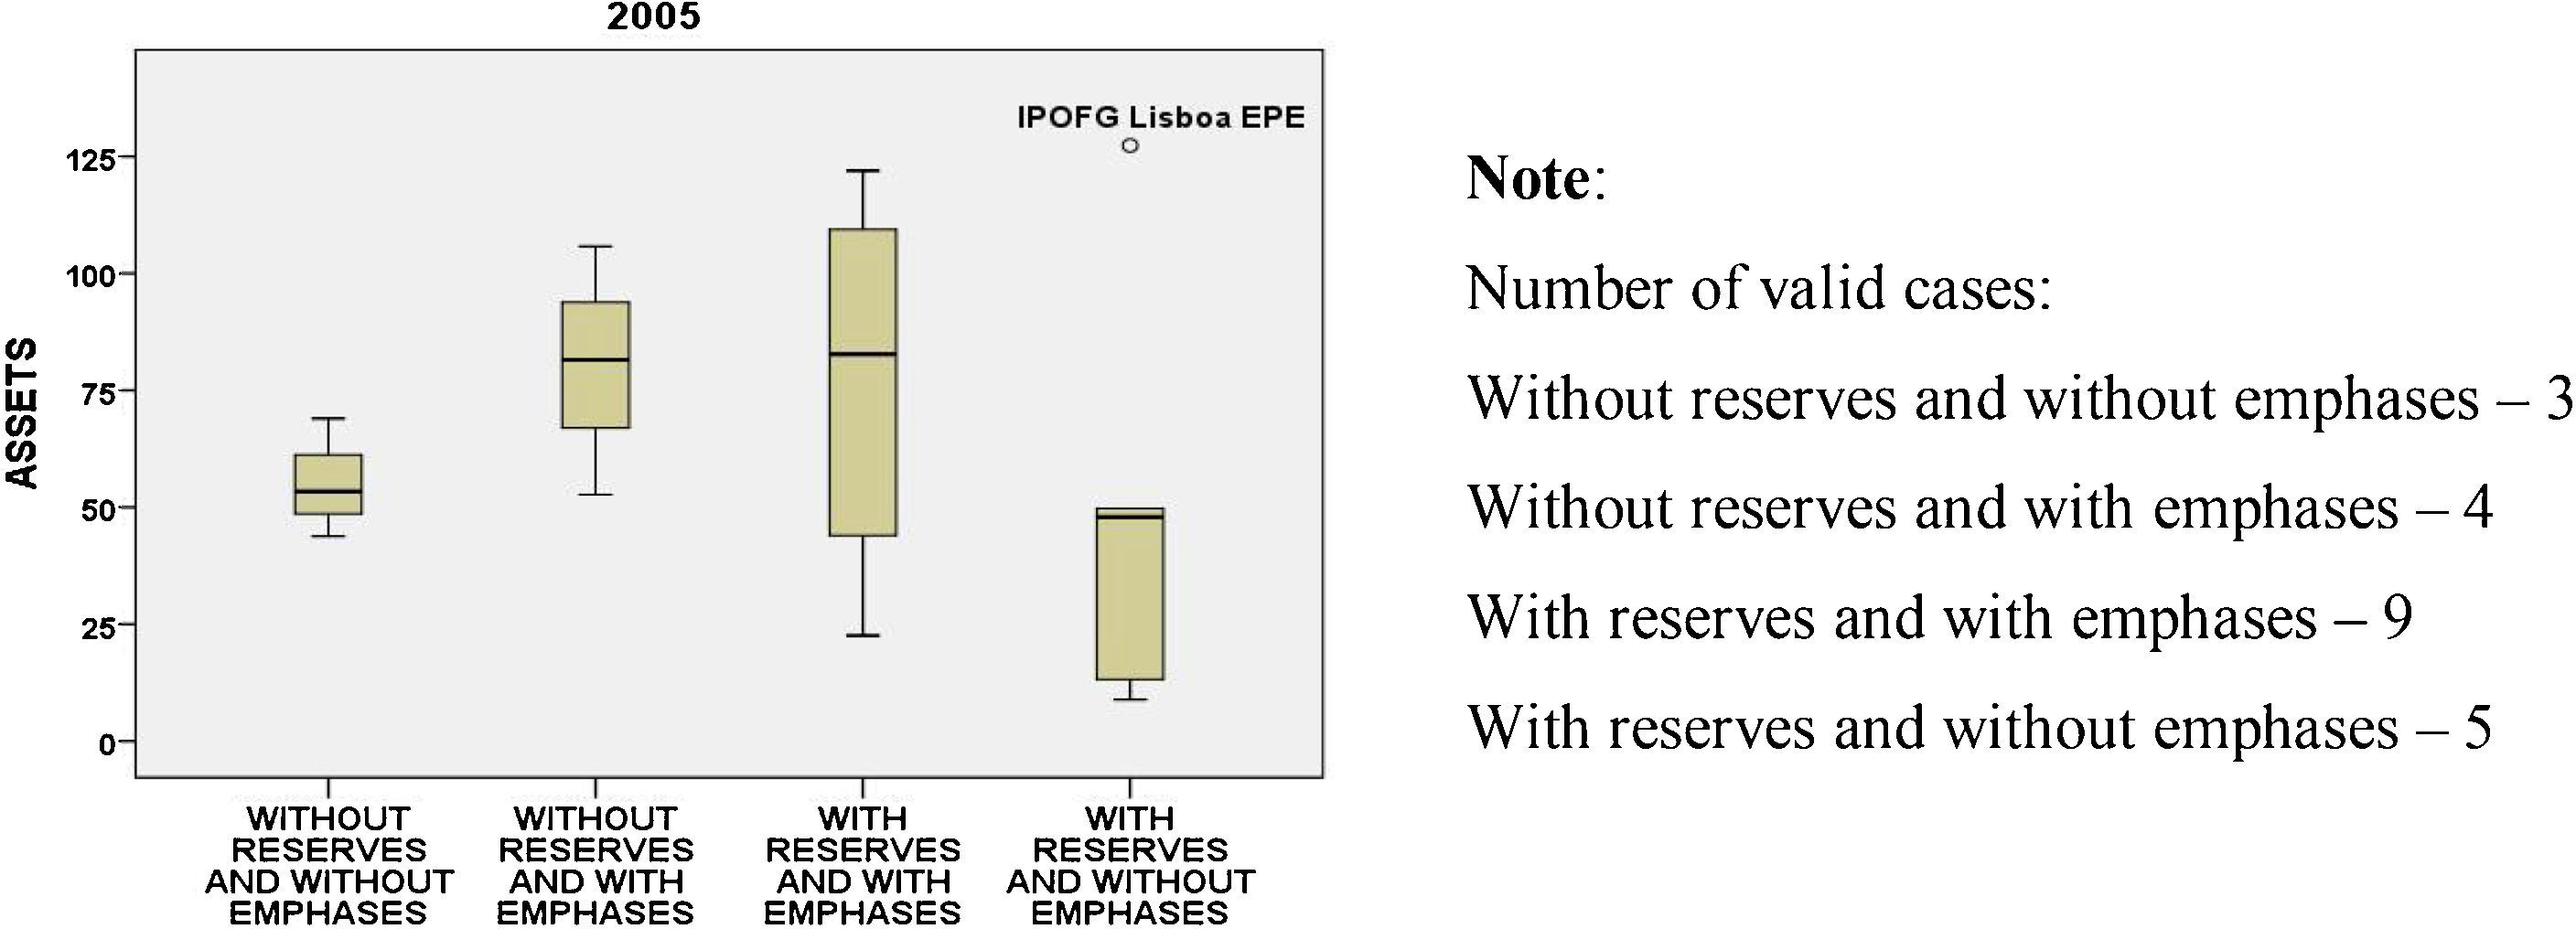
The mean of the assets (Fig. 9) varies between 49 and 80M and the IPOFG Lisbon EPE presents, in this year, the maximum value of all hospitals with 127M.
, 2005.")
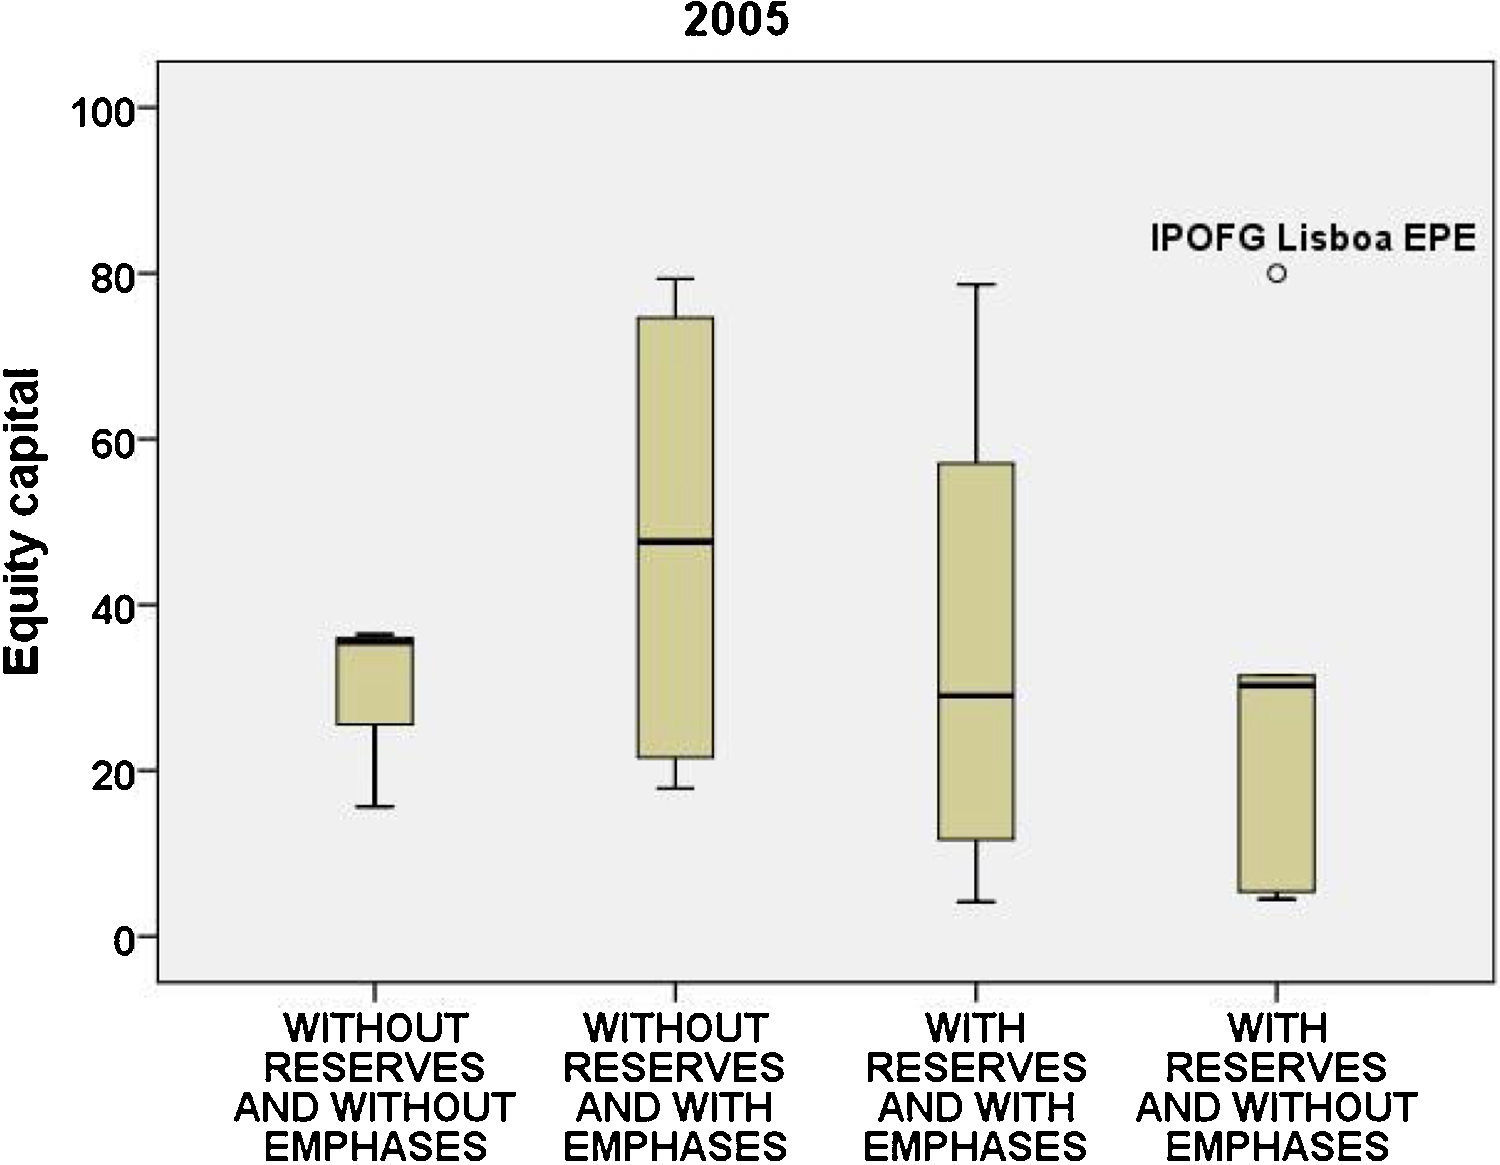
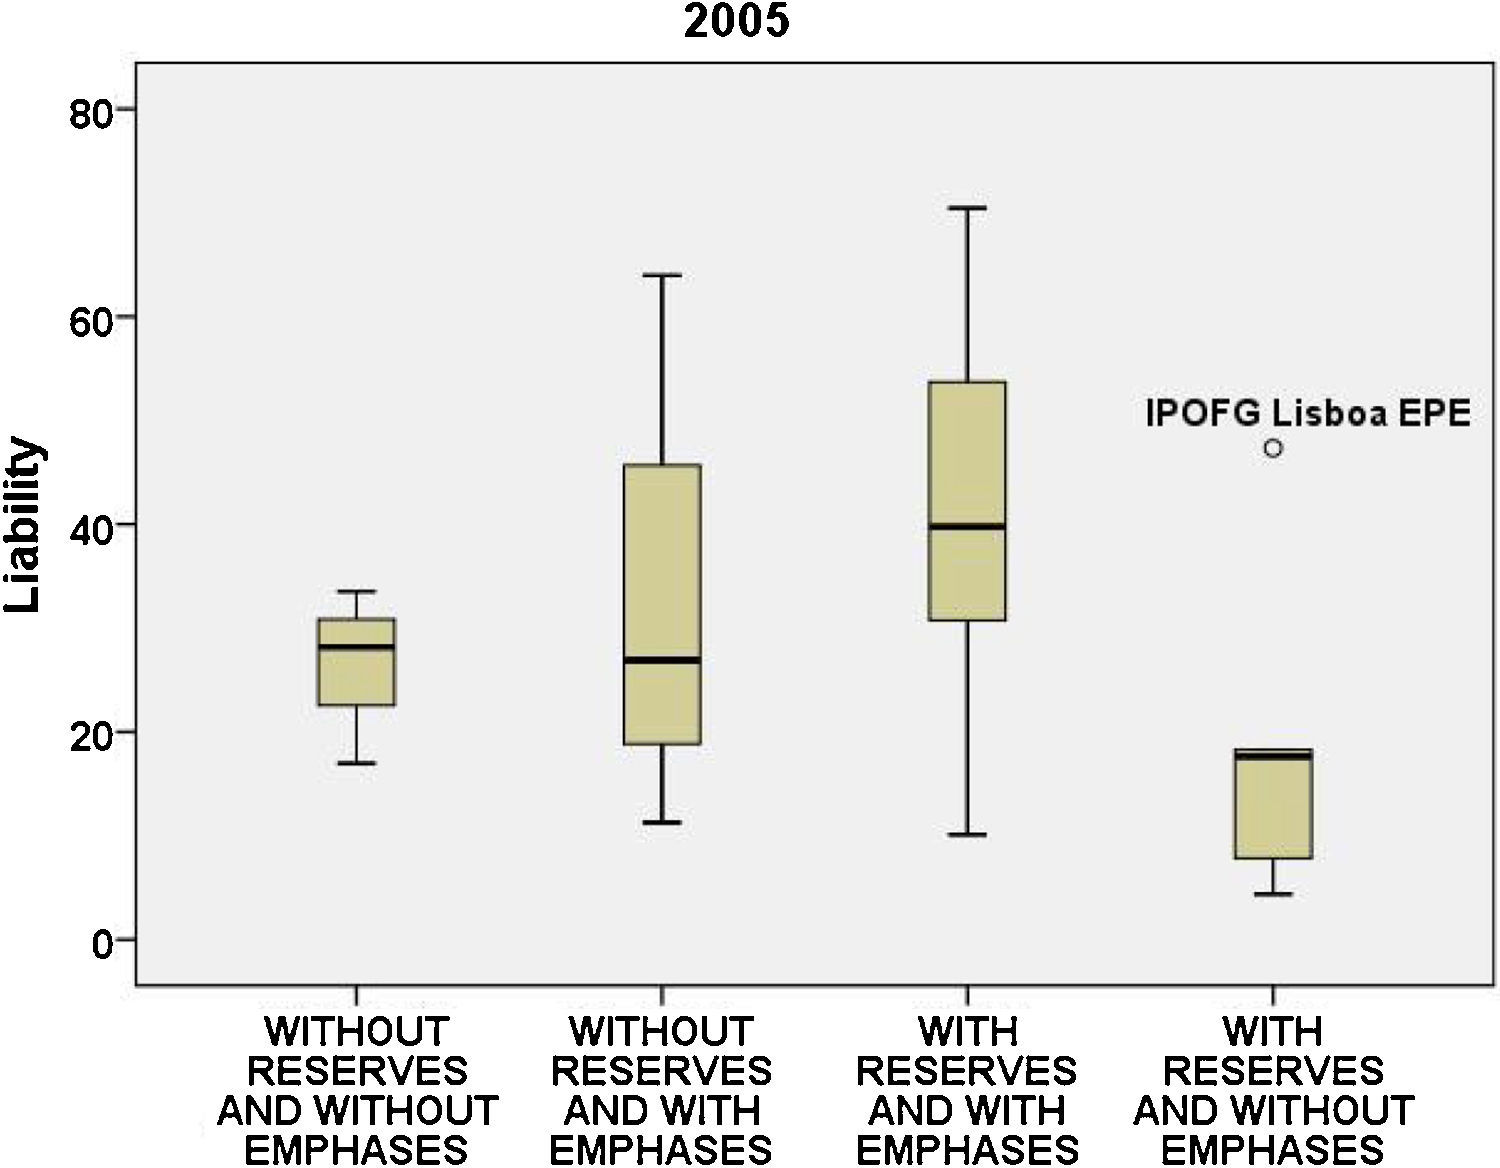
In the equity capital (Fig. 10), with means between 29 and 40M, the IPOFG Lisbon EPE is already closer to the maximum of the previous groups, with about 80M, and in the liability (Fig. 11), as well as the turnover, it presents a value far from the maximum value although, within its group, it continues to be an outlier.
, 2005.")
, 2005.")
Regarding the group “without reserves and with emphases” we notice that in the assets, the equity capital (Fig. 12), and also the number of workers (Fig. 13) there is a perfectly symmetric distribution where a median is located at the centre of the triangle and the two lines that start at the extremities have approximately the same length.
, 2005.")
, 2005.")
On the contrary, in the group “with reserves and with emphases” there is a slight asymmetry, negative in the assets and positive in the equity capital, the turnover, and the number of workers.
In the group “with reserves and without emphases”, in all variables except in the number of workers, there is a concentration of values in the second quartile and one hospital with a divergent value in these variables – the IPOFG Lisbon EPE.
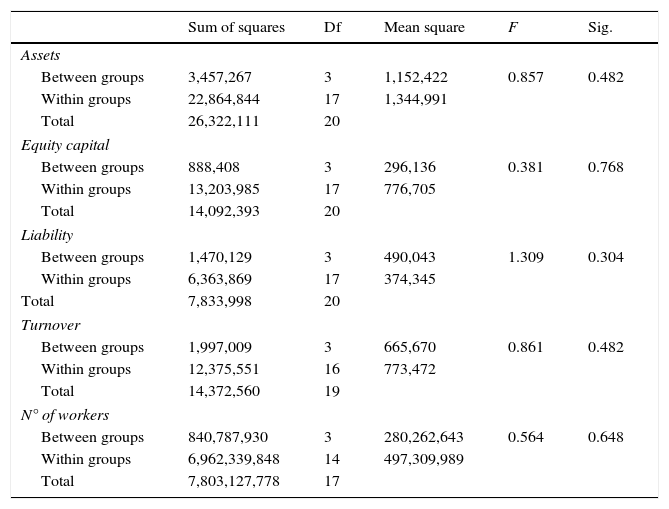
As the behaviours are repeated in the groups we can deduct that there will not be great differences in the 4 groups, which was confirmed when the variance analysis was done.
The same hypotheses are listed for the year 2005. Thus, we can also conclude that we do not reject the initial hypothesis “similarity in the four groups”, as we can see from the results obtained, that is, the variables under study do not have a significant effect on the existence of reserves and/or emphases, according to Table 4.
ANOVA results, 2005.
| Sum of squares | Df | Mean square | F | Sig. | |
|---|---|---|---|---|---|
| Assets | |||||
| Between groups | 3,457,267 | 3 | 1,152,422 | 0.857 | 0.482 |
| Within groups | 22,864,844 | 17 | 1,344,991 | ||
| Total | 26,322,111 | 20 | |||
| Equity capital | |||||
| Between groups | 888,408 | 3 | 296,136 | 0.381 | 0.768 |
| Within groups | 13,203,985 | 17 | 776,705 | ||
| Total | 14,092,393 | 20 | |||
| Liability | |||||
| Between groups | 1,470,129 | 3 | 490,043 | 1.309 | 0.304 |
| Within groups | 6,363,869 | 17 | 374,345 | ||
| Total | 7,833,998 | 20 | |||
| Turnover | |||||
| Between groups | 1,997,009 | 3 | 665,670 | 0.861 | 0.482 |
| Within groups | 12,375,551 | 16 | 773,472 | ||
| Total | 14,372,560 | 19 | |||
| N° of workers | |||||
| Between groups | 840,787,930 | 3 | 280,262,643 | 0.564 | 0.648 |
| Within groups | 6,962,339,848 | 14 | 497,309,989 | ||
| Total | 7,803,127,778 | 17 | |||
Source: SPSS.
In 2005, the total variability – resulting from the variability due to the variability between the groups and the variability within each group – is superior to the one obtained in the year 2003, which is reflected in the values of the p-value but still, insufficient to be able to reject the null hypothesis H0.
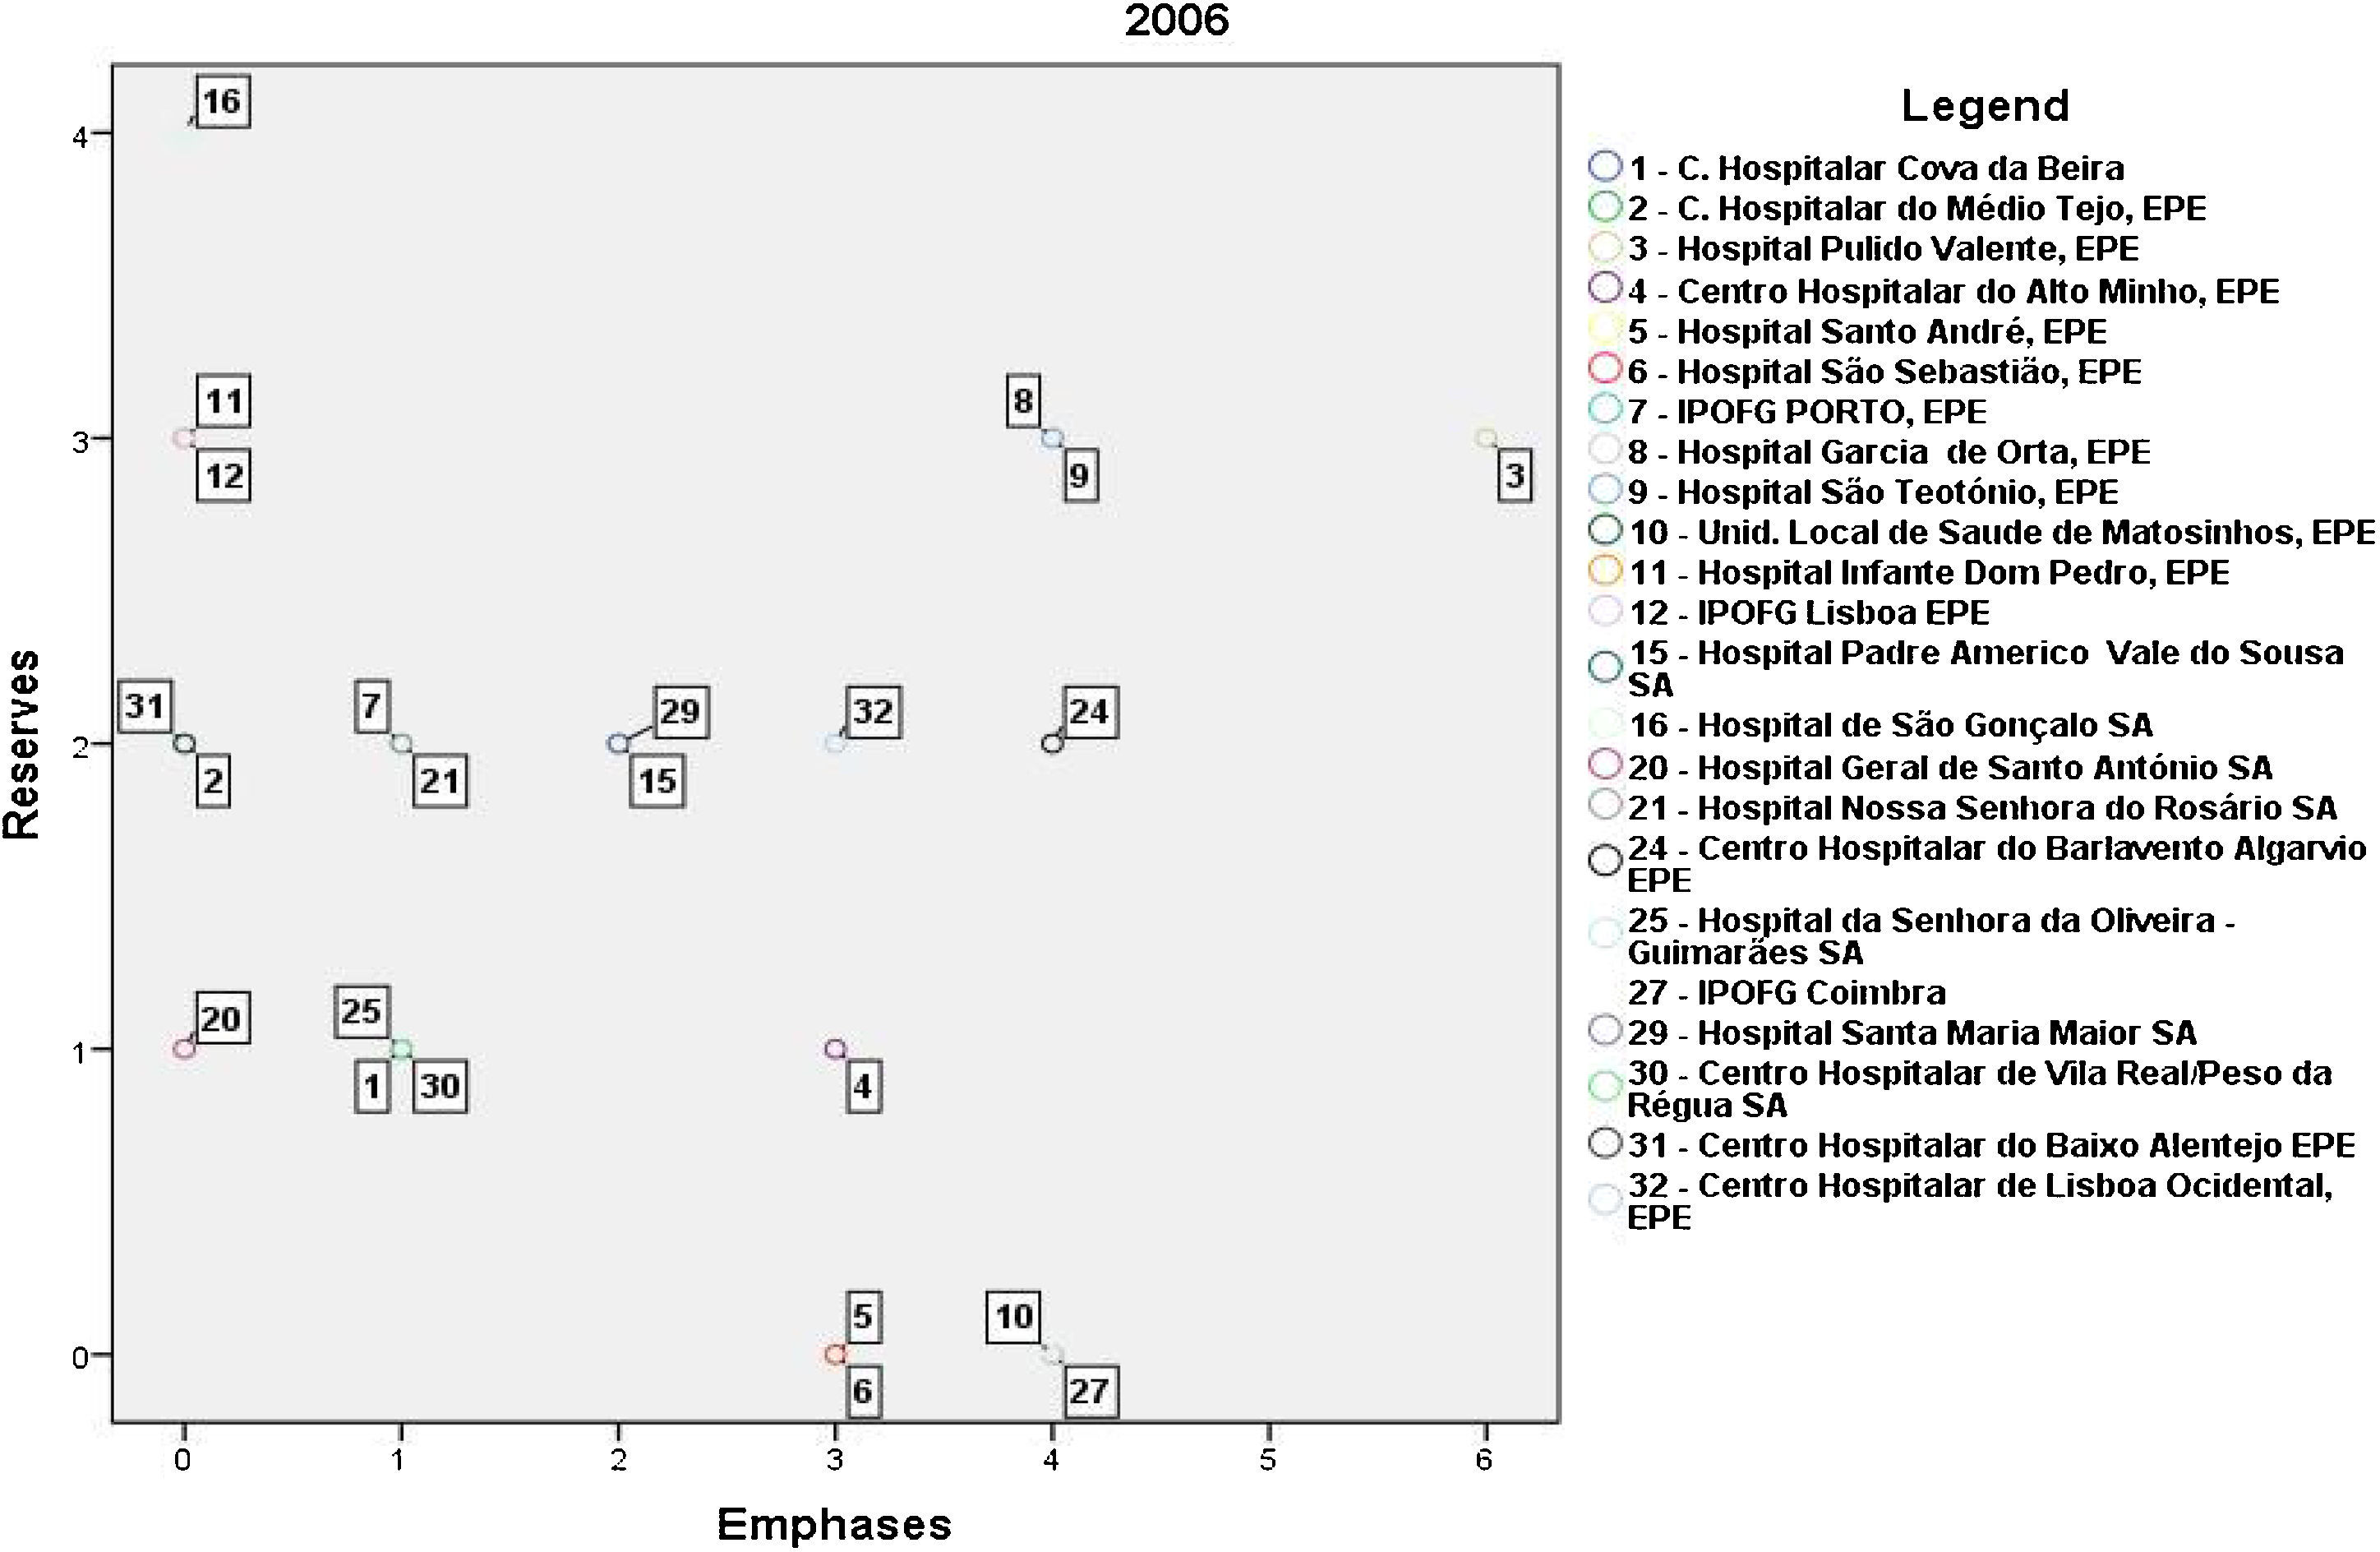
4.4Analysis of the year 2006The reports issued by the auditors for the 32 hospitals are provided in Fig. 14.

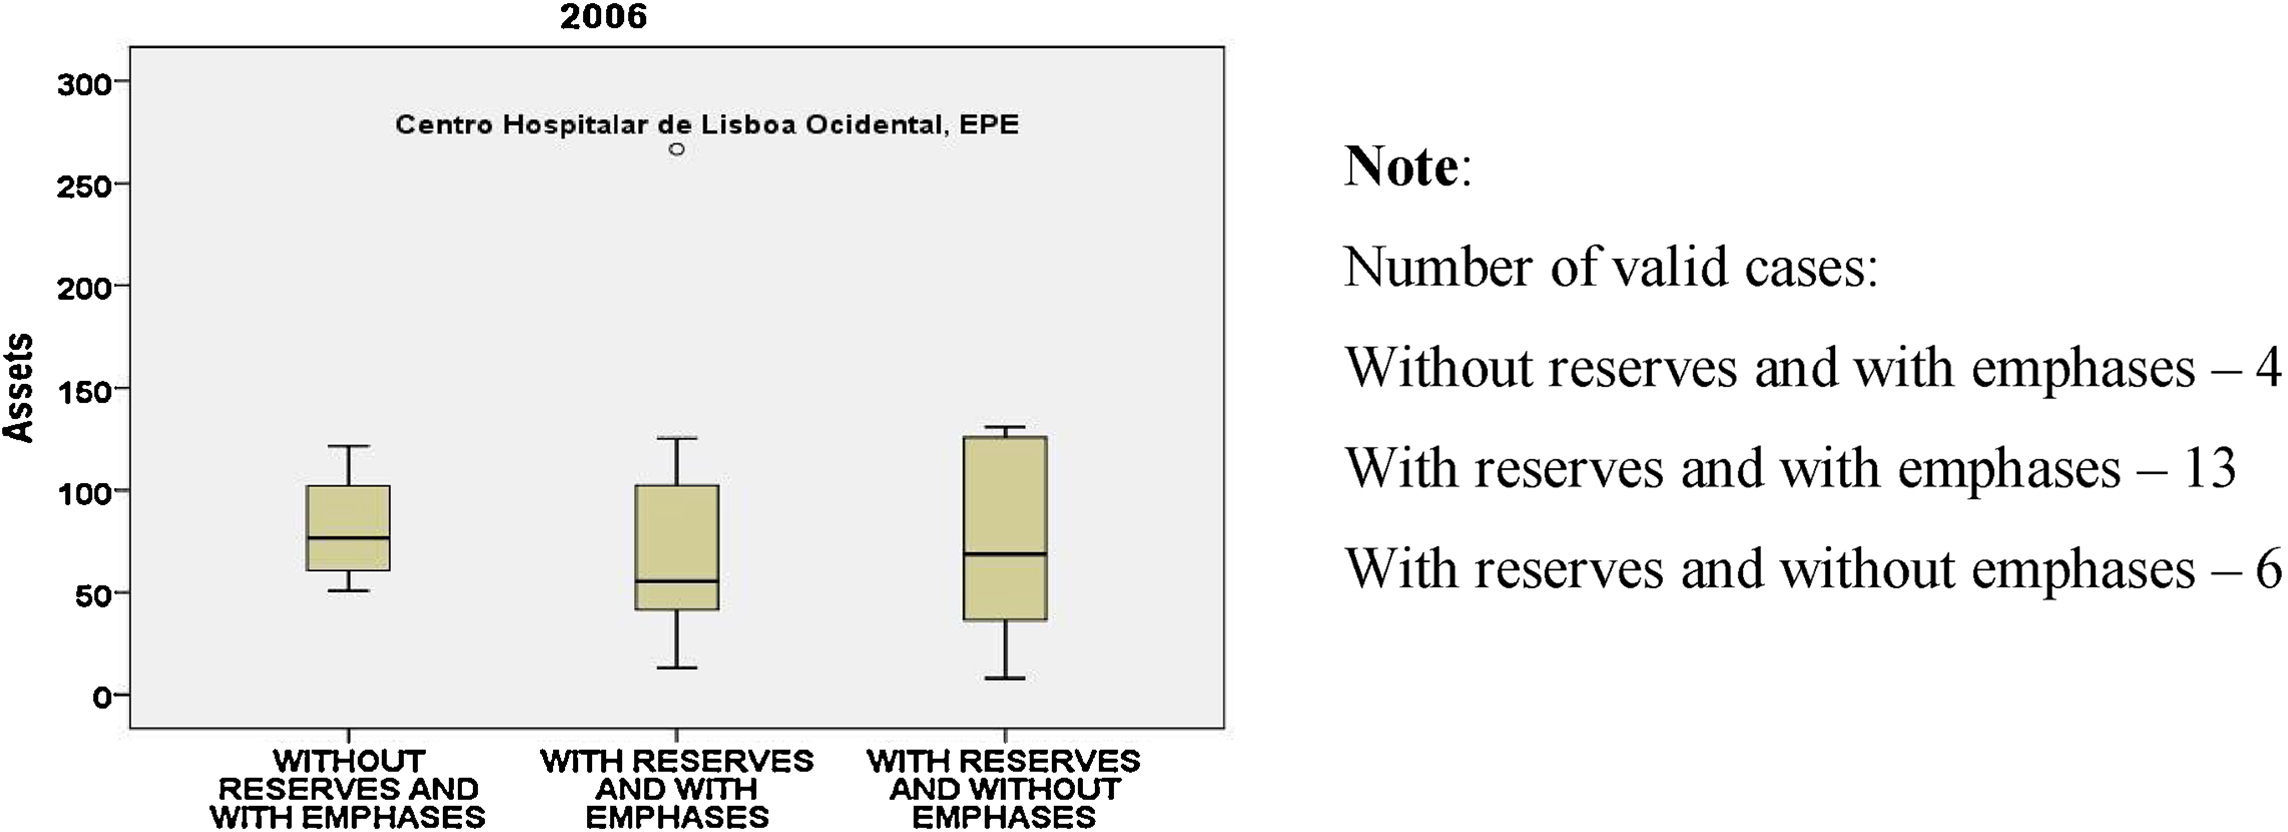
In 2006, there is no occurrence in the group “without reserves and without emphases” and the majority, that is, 56%, of the hospitals has reserves and emphases. In all the variables, Centro Hospitalar de Lisboa Ocidental, EPE, stands out with values well above the other hospitals. In this year, we have no indication of the number of reserves and emphases for Hospital Santa Maria, EPE.
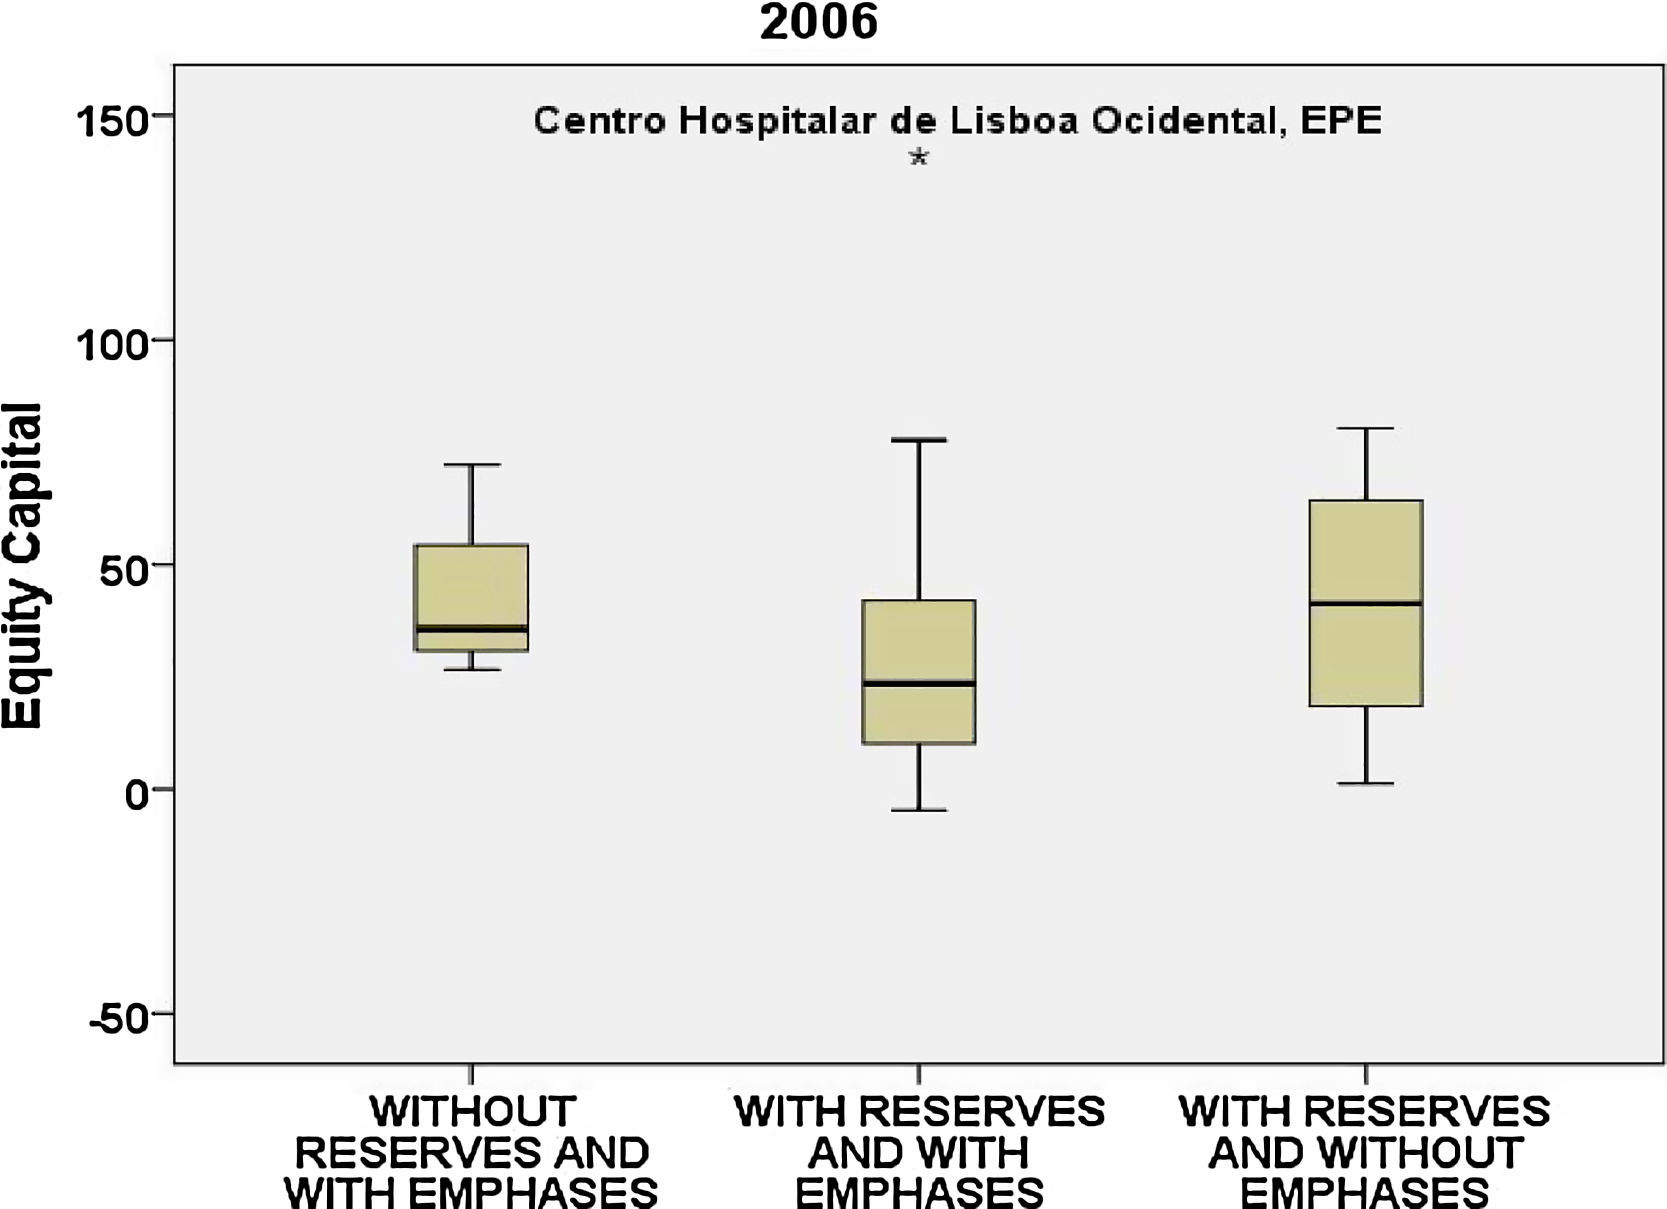
Regarding the assets (Fig. 15) and the equity capital (Fig. 16), a similar distribution is evident in the 3 groups.
, 2006.")
, 2006.")
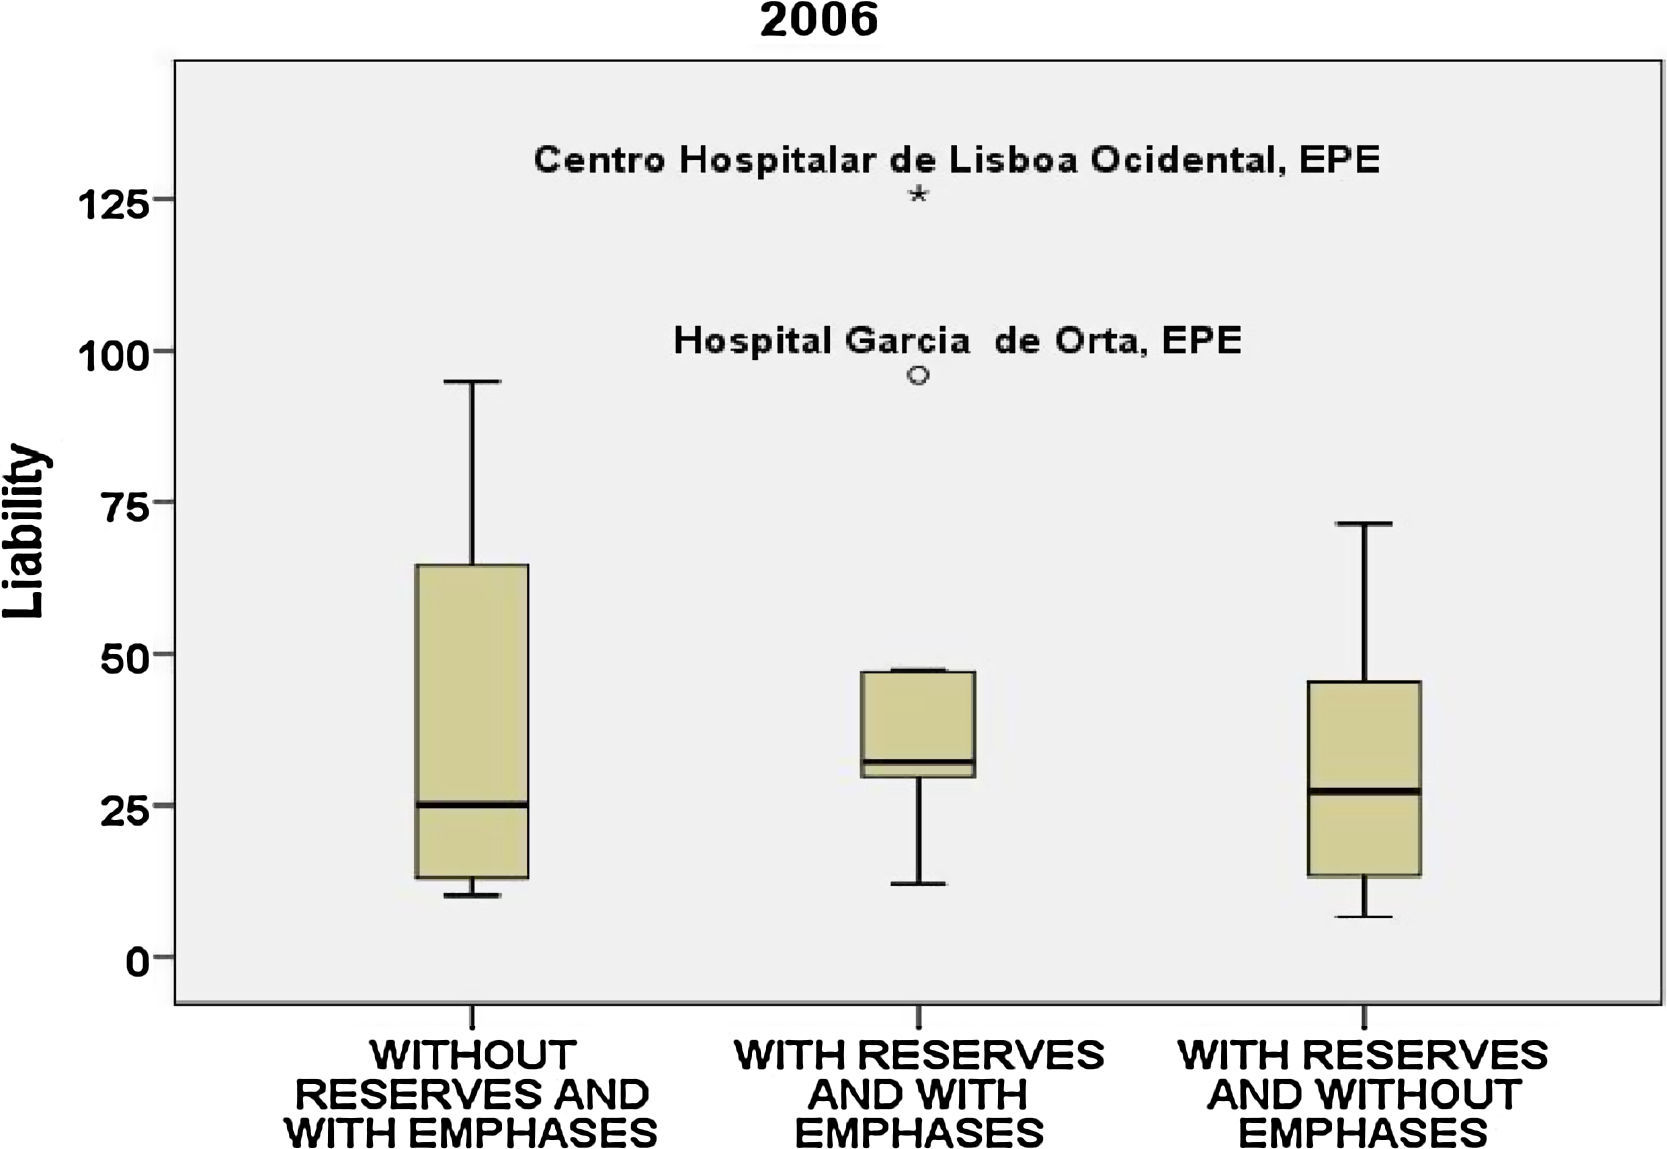
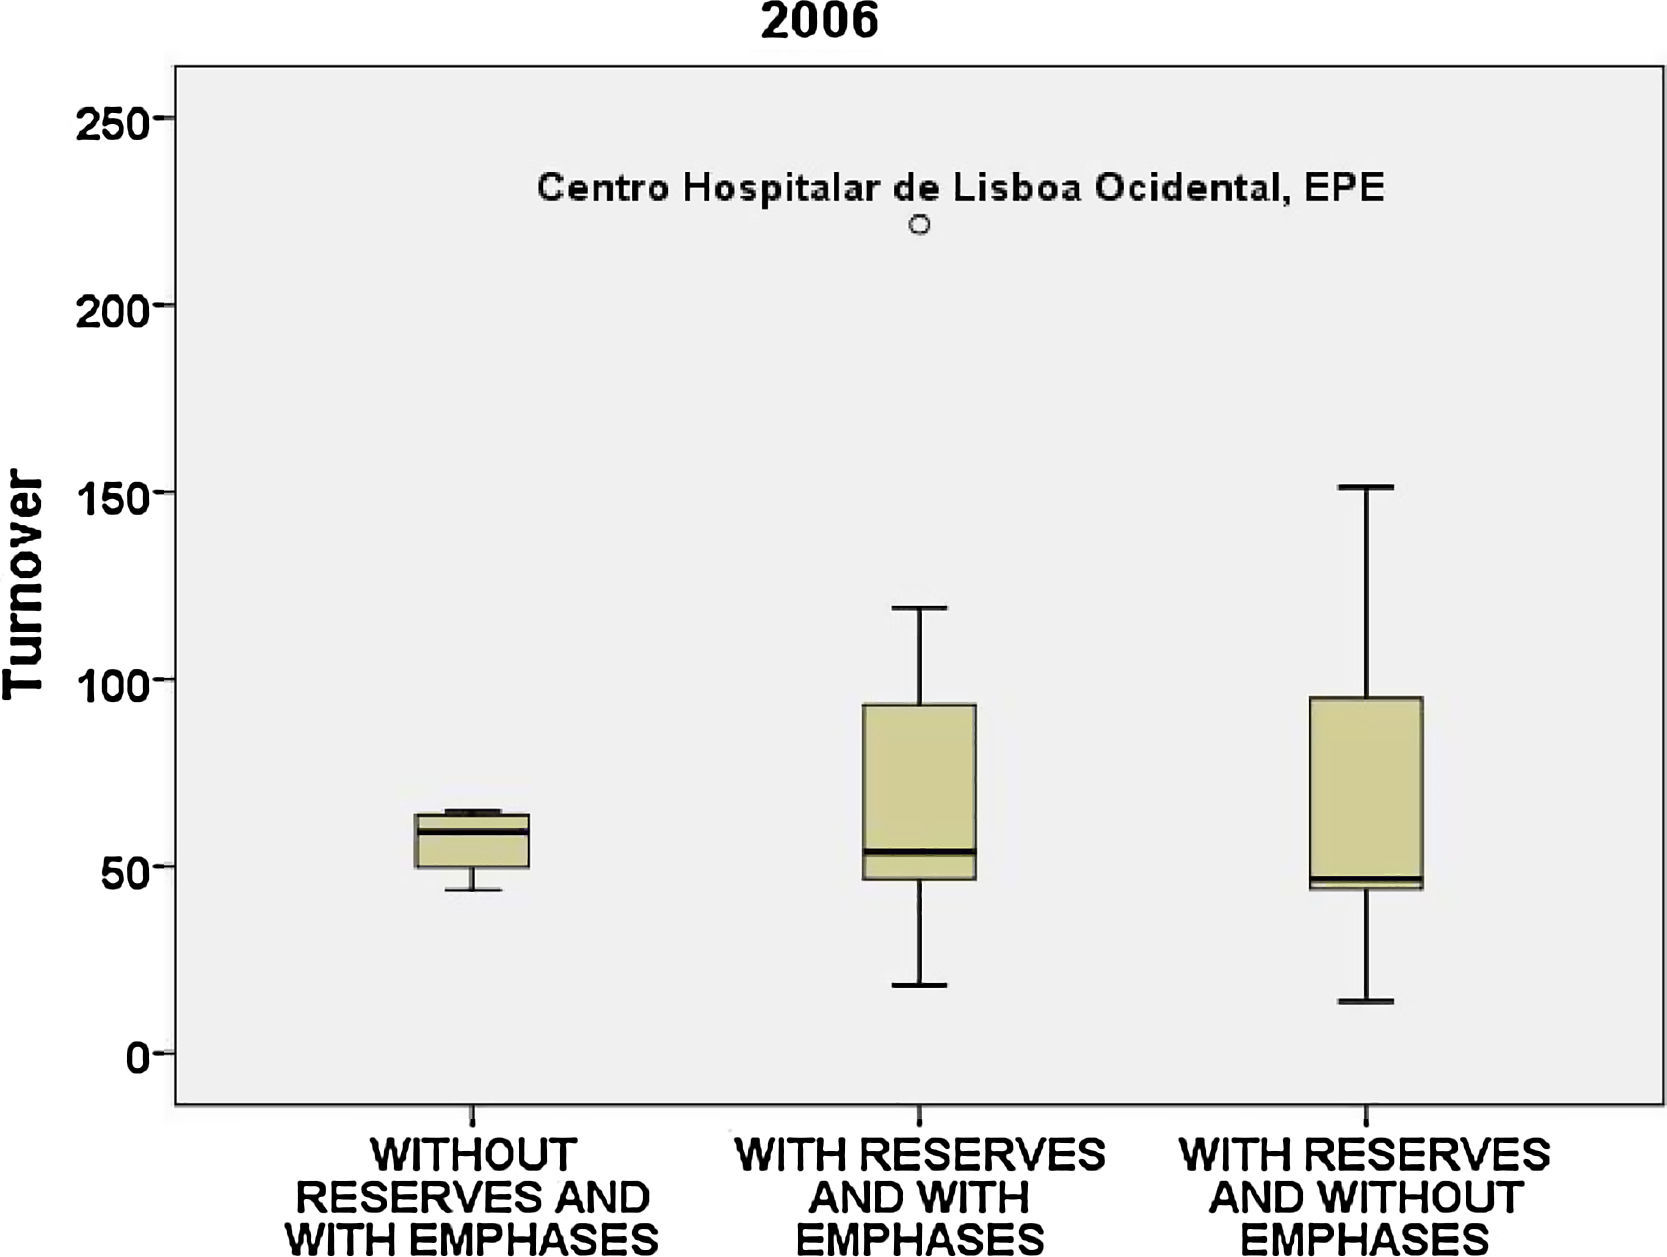
For the liability (Fig. 17), Hospital Garcia de Orta, EPE continues with values well above the mean without a correspondence in the turnover that was visible in 2003. Although the dispersion is not homogeneous in the 3 groups the mean is around the same values (Fig. 18).
, 2006.")
, 2006.")
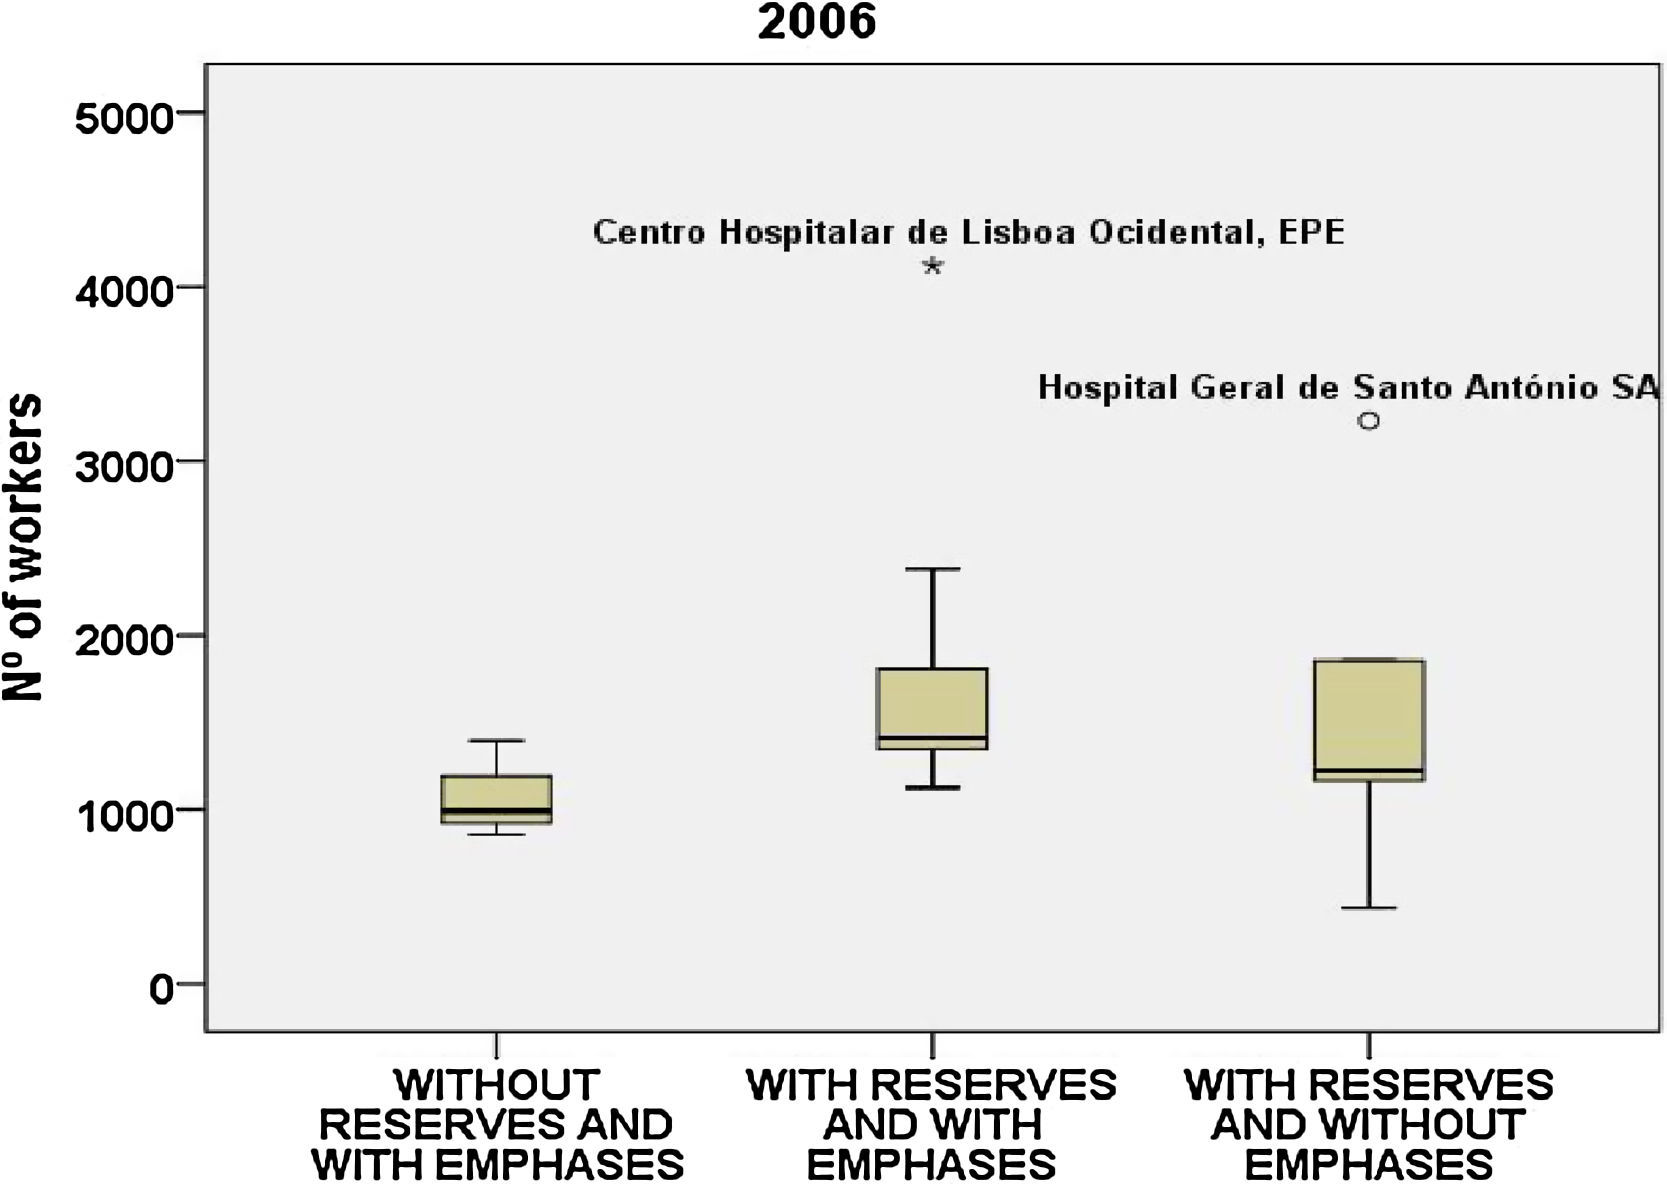
Concerning the number of workers (Fig. 19), the Hospital Geral de Santo António SA also stands out in its group.
, 2006.")
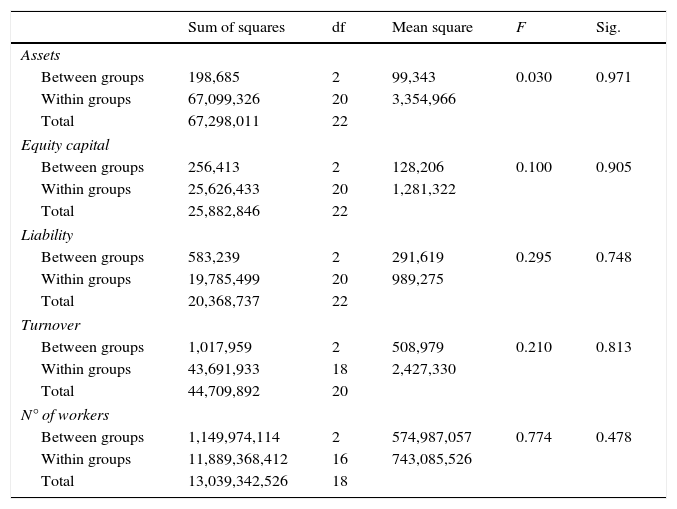
Equally, in 2006 (Table 5) we can see that the variability within the groups is superior to the variability between the groups, therefore confirming that the null hypothesis H0, about the similarity of the means of the variables under analysis in the 3 groups, cannot be rejected.
ANOVA results, 2006.
| Sum of squares | df | Mean square | F | Sig. | |
|---|---|---|---|---|---|
| Assets | |||||
| Between groups | 198,685 | 2 | 99,343 | 0.030 | 0.971 |
| Within groups | 67,099,326 | 20 | 3,354,966 | ||
| Total | 67,298,011 | 22 | |||
| Equity capital | |||||
| Between groups | 256,413 | 2 | 128,206 | 0.100 | 0.905 |
| Within groups | 25,626,433 | 20 | 1,281,322 | ||
| Total | 25,882,846 | 22 | |||
| Liability | |||||
| Between groups | 583,239 | 2 | 291,619 | 0.295 | 0.748 |
| Within groups | 19,785,499 | 20 | 989,275 | ||
| Total | 20,368,737 | 22 | |||
| Turnover | |||||
| Between groups | 1,017,959 | 2 | 508,979 | 0.210 | 0.813 |
| Within groups | 43,691,933 | 18 | 2,427,330 | ||
| Total | 44,709,892 | 20 | |||
| N° of workers | |||||
| Between groups | 1,149,974,114 | 2 | 574,987,057 | 0.774 | 0.478 |
| Within groups | 11,889,368,412 | 16 | 743,085,526 | ||
| Total | 13,039,342,526 | 18 | |||
Source: SPSS.
In the year under review, new hospitals acquired the legal status of EPE, allowing the scope of analysis to be extended, as shown in Fig. 20.

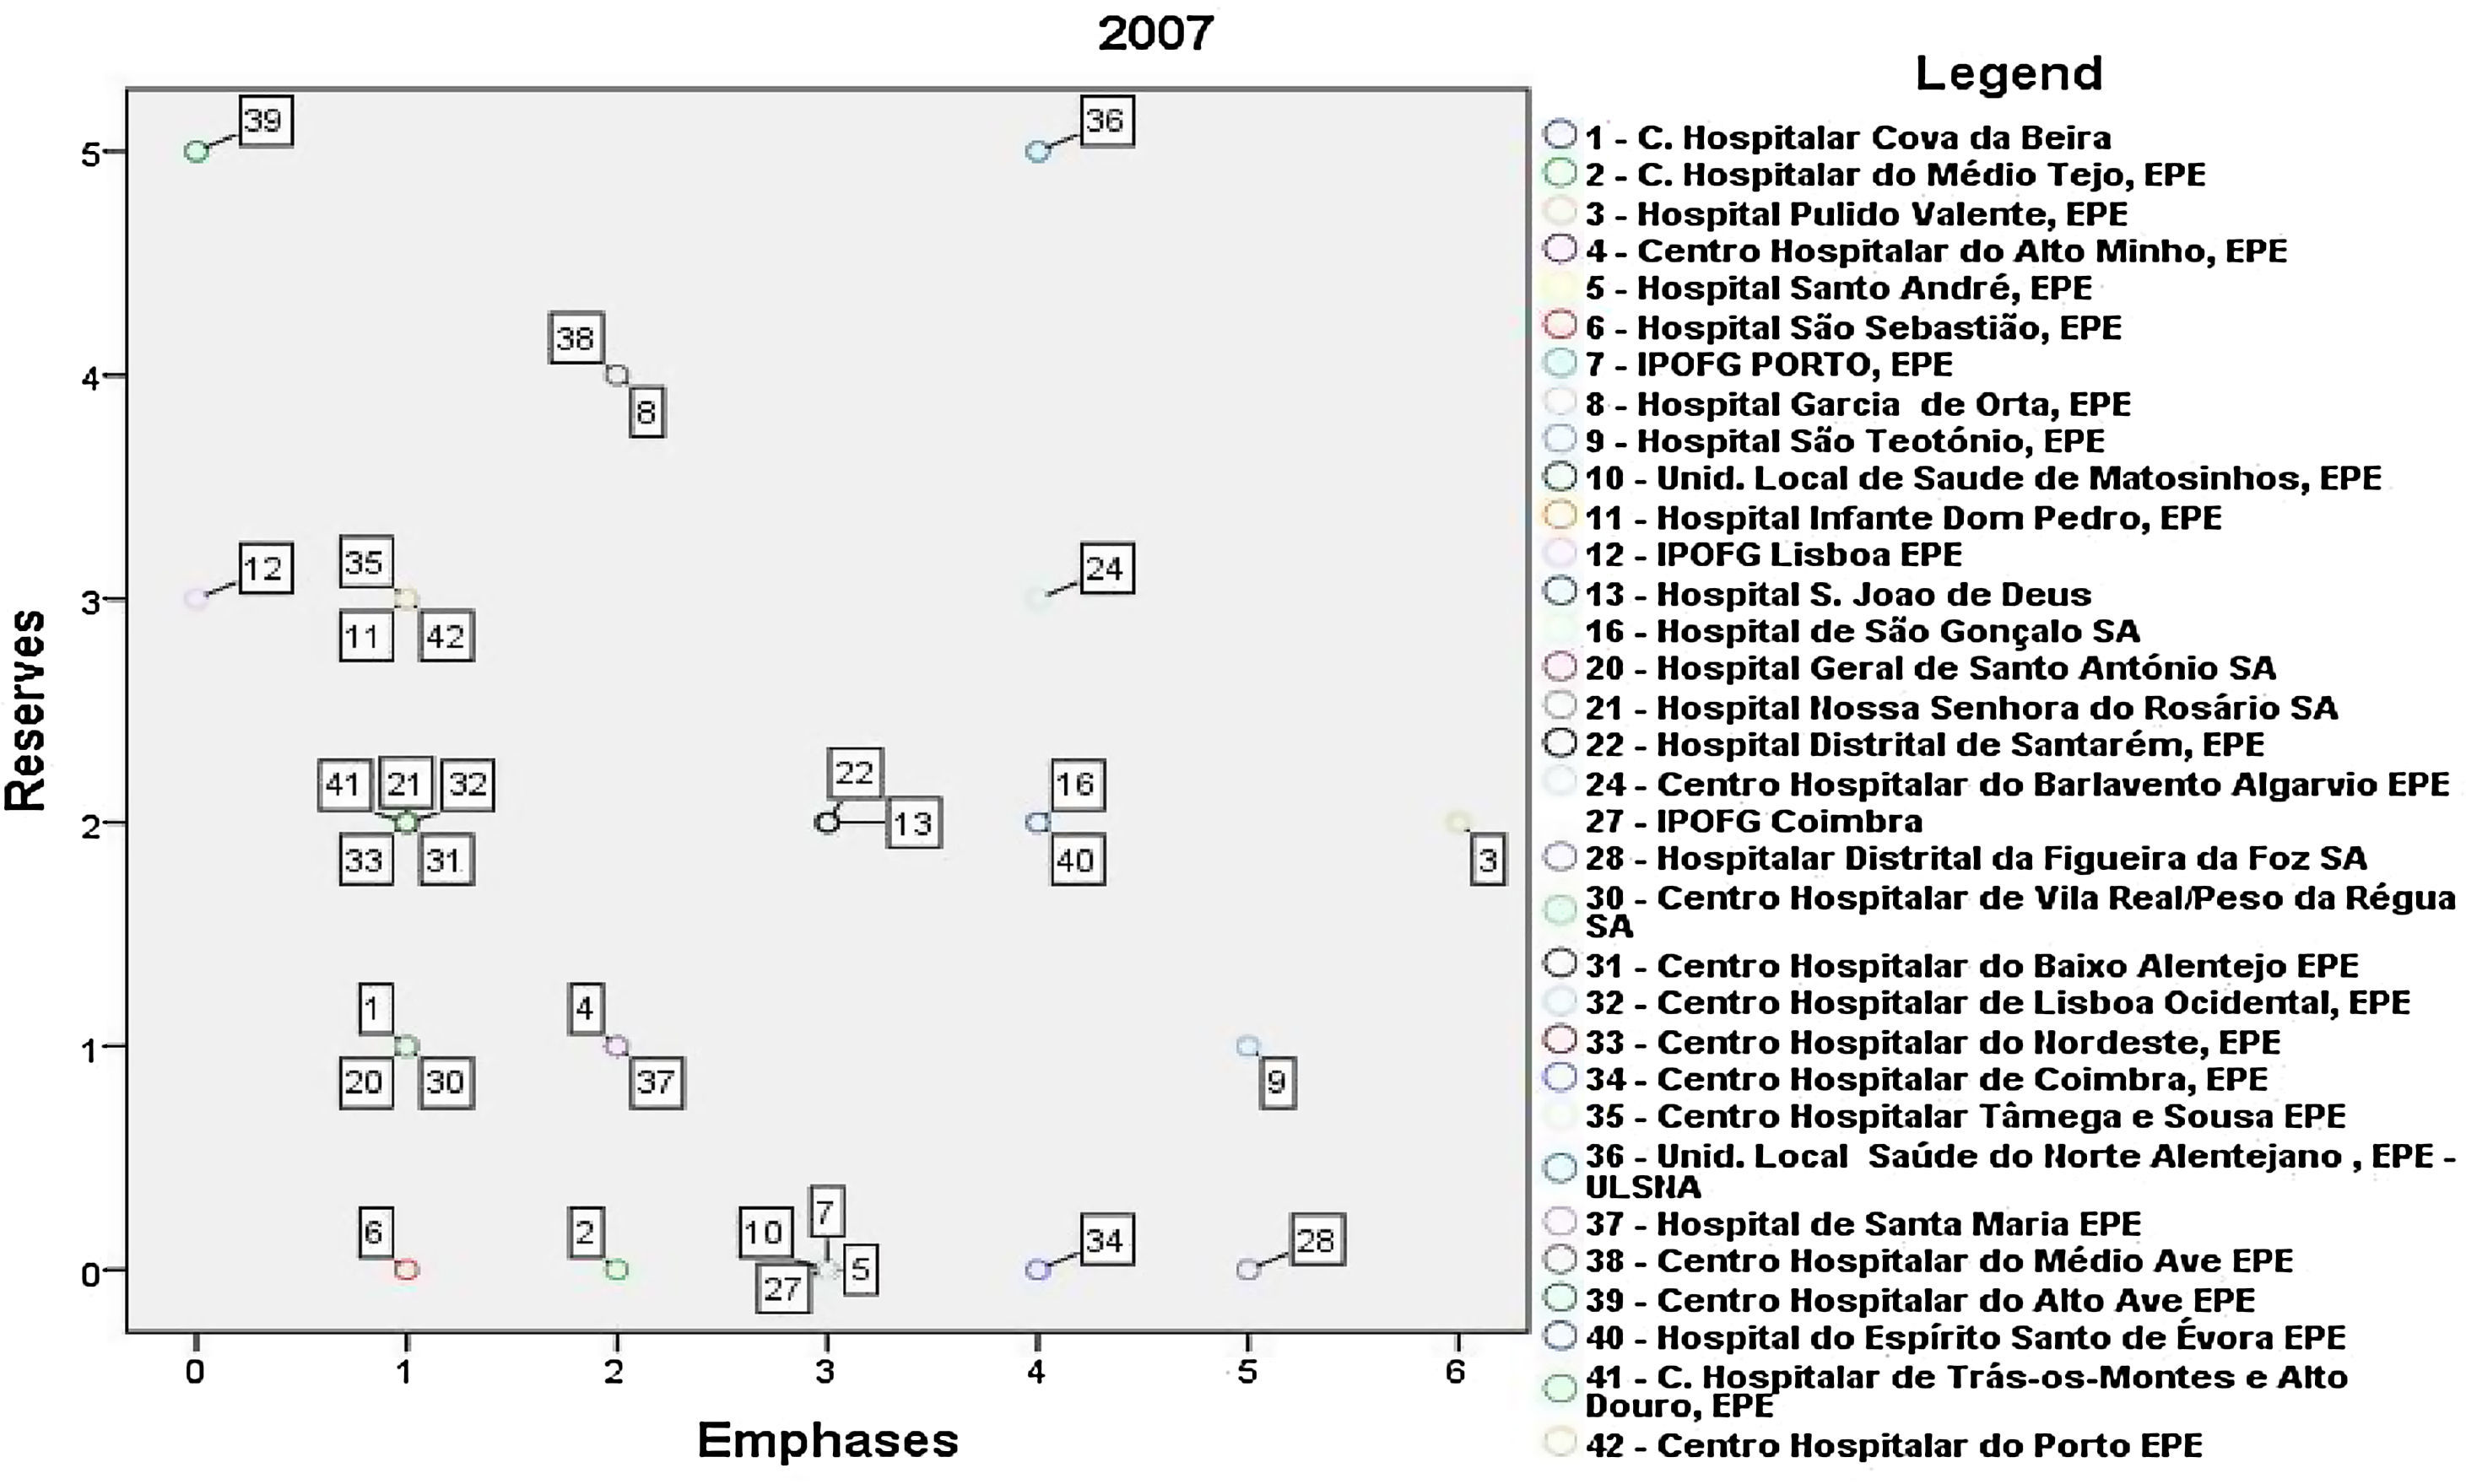
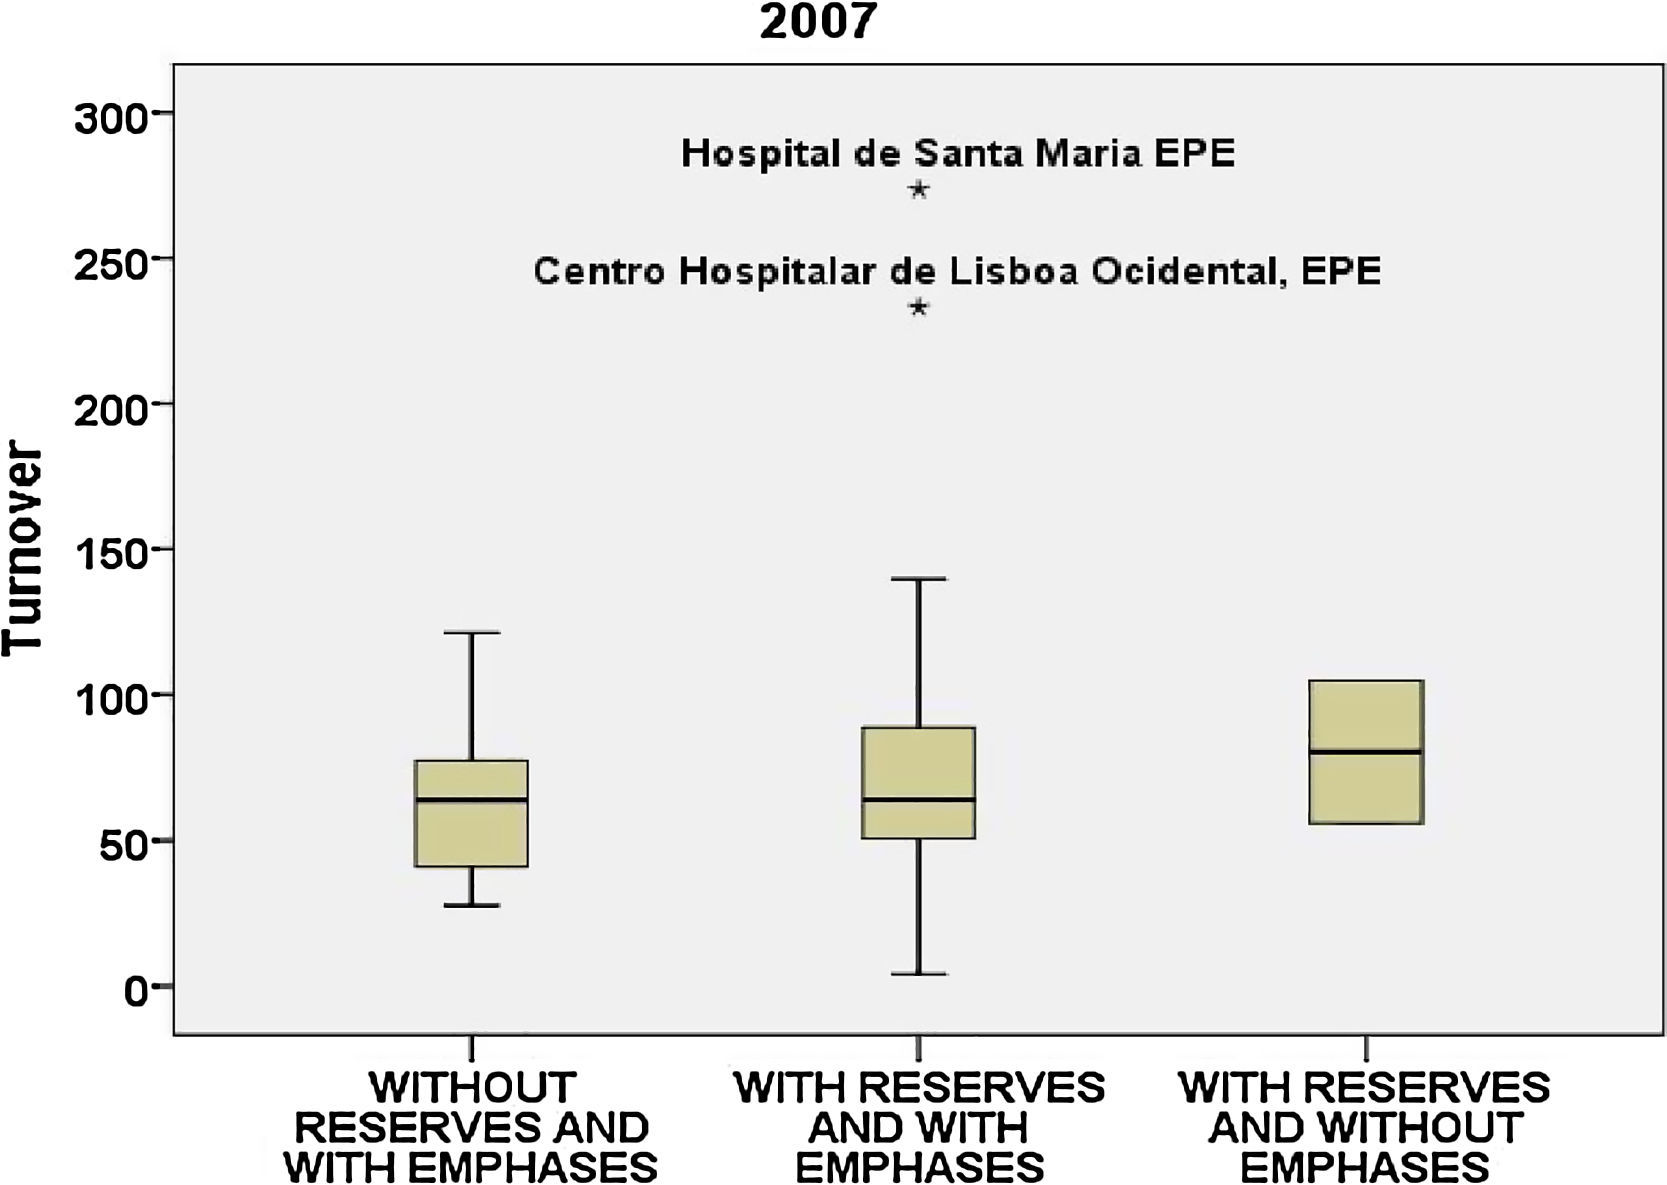
Similarly, according to Fig. 20, in 2007 there is no occurrence in the group “without reserves and without emphases” and 70% of the hospitals have reserves and emphases, with an increase of percentage of hospitals in this group.
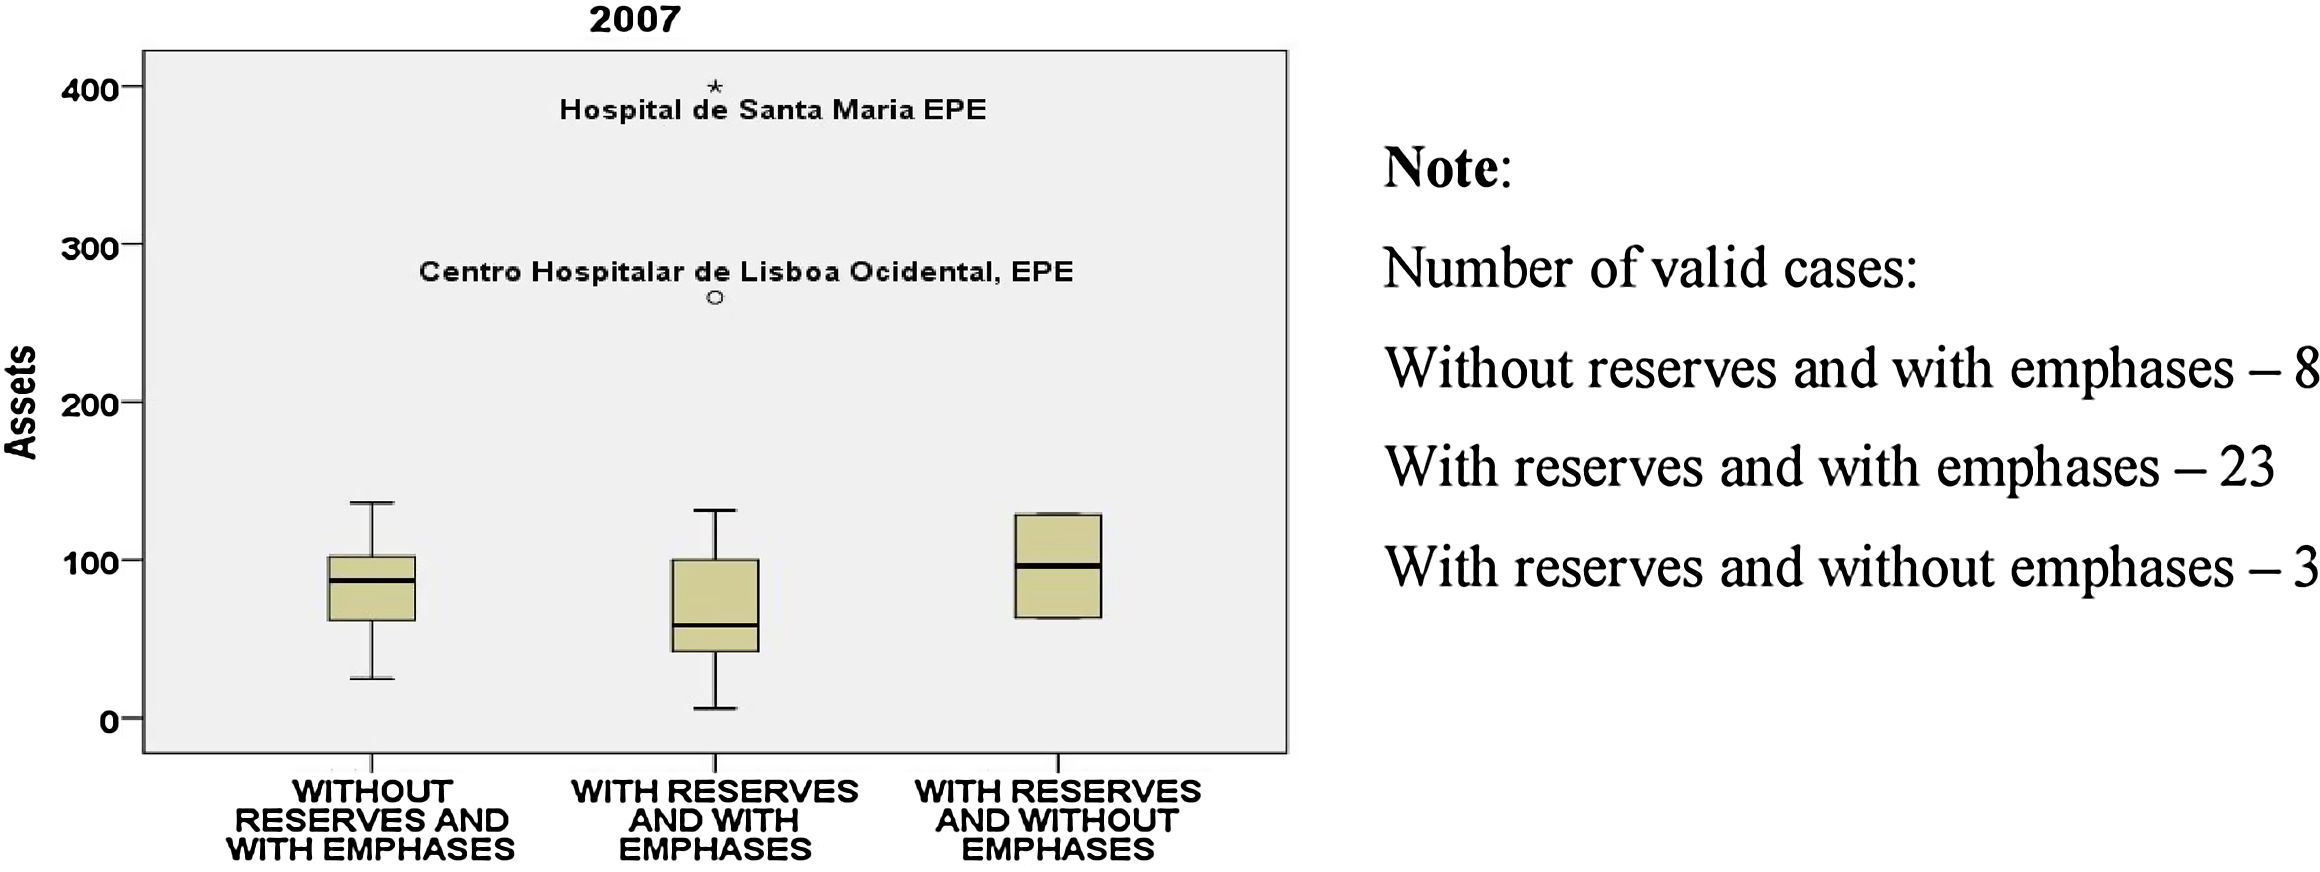
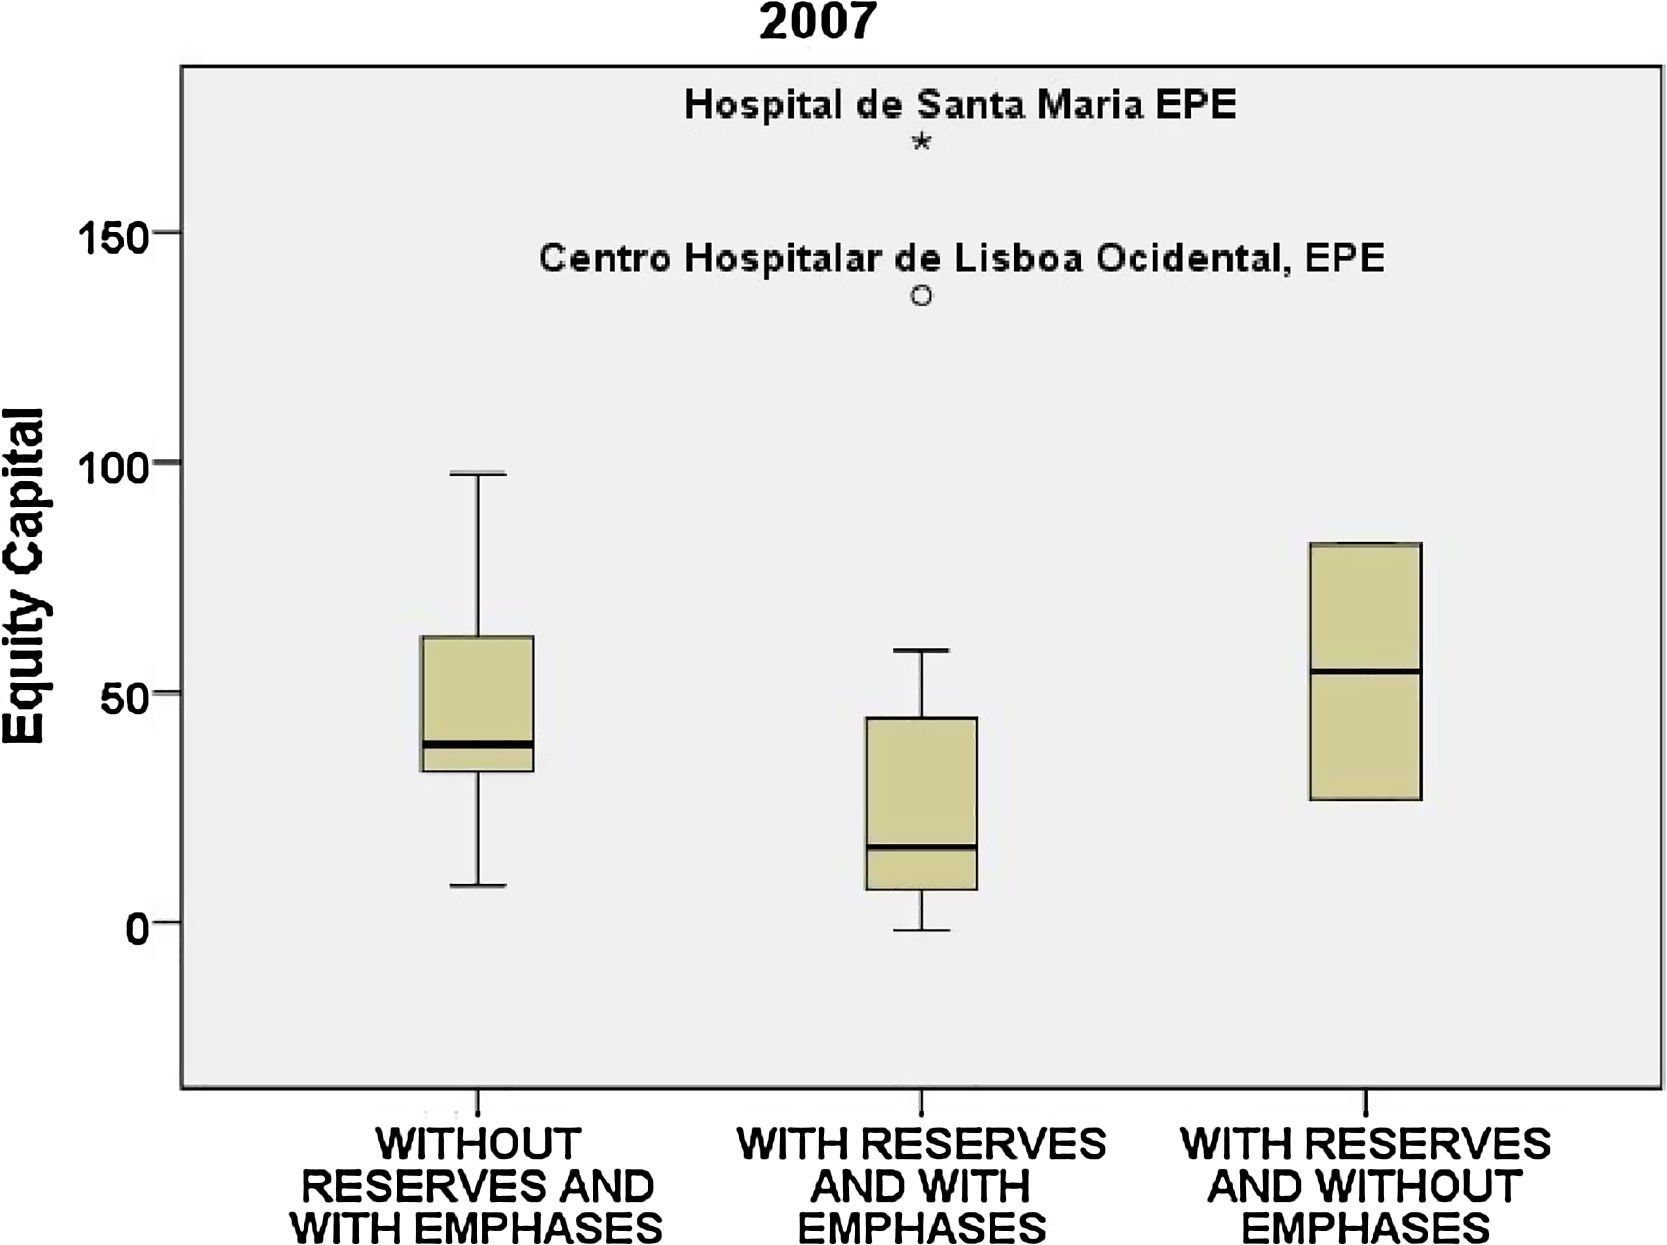
In all the variables we notice how far the 2 bigger Portuguese hospitals, located in Lisbon (Hospital de Santa Maria EPE and Centro Hospitalar de Lisboa Ocidental, EPE) are in relation to the mean and median of the others (Figs. 21 and 22).
, 2007.")
, 2007.")
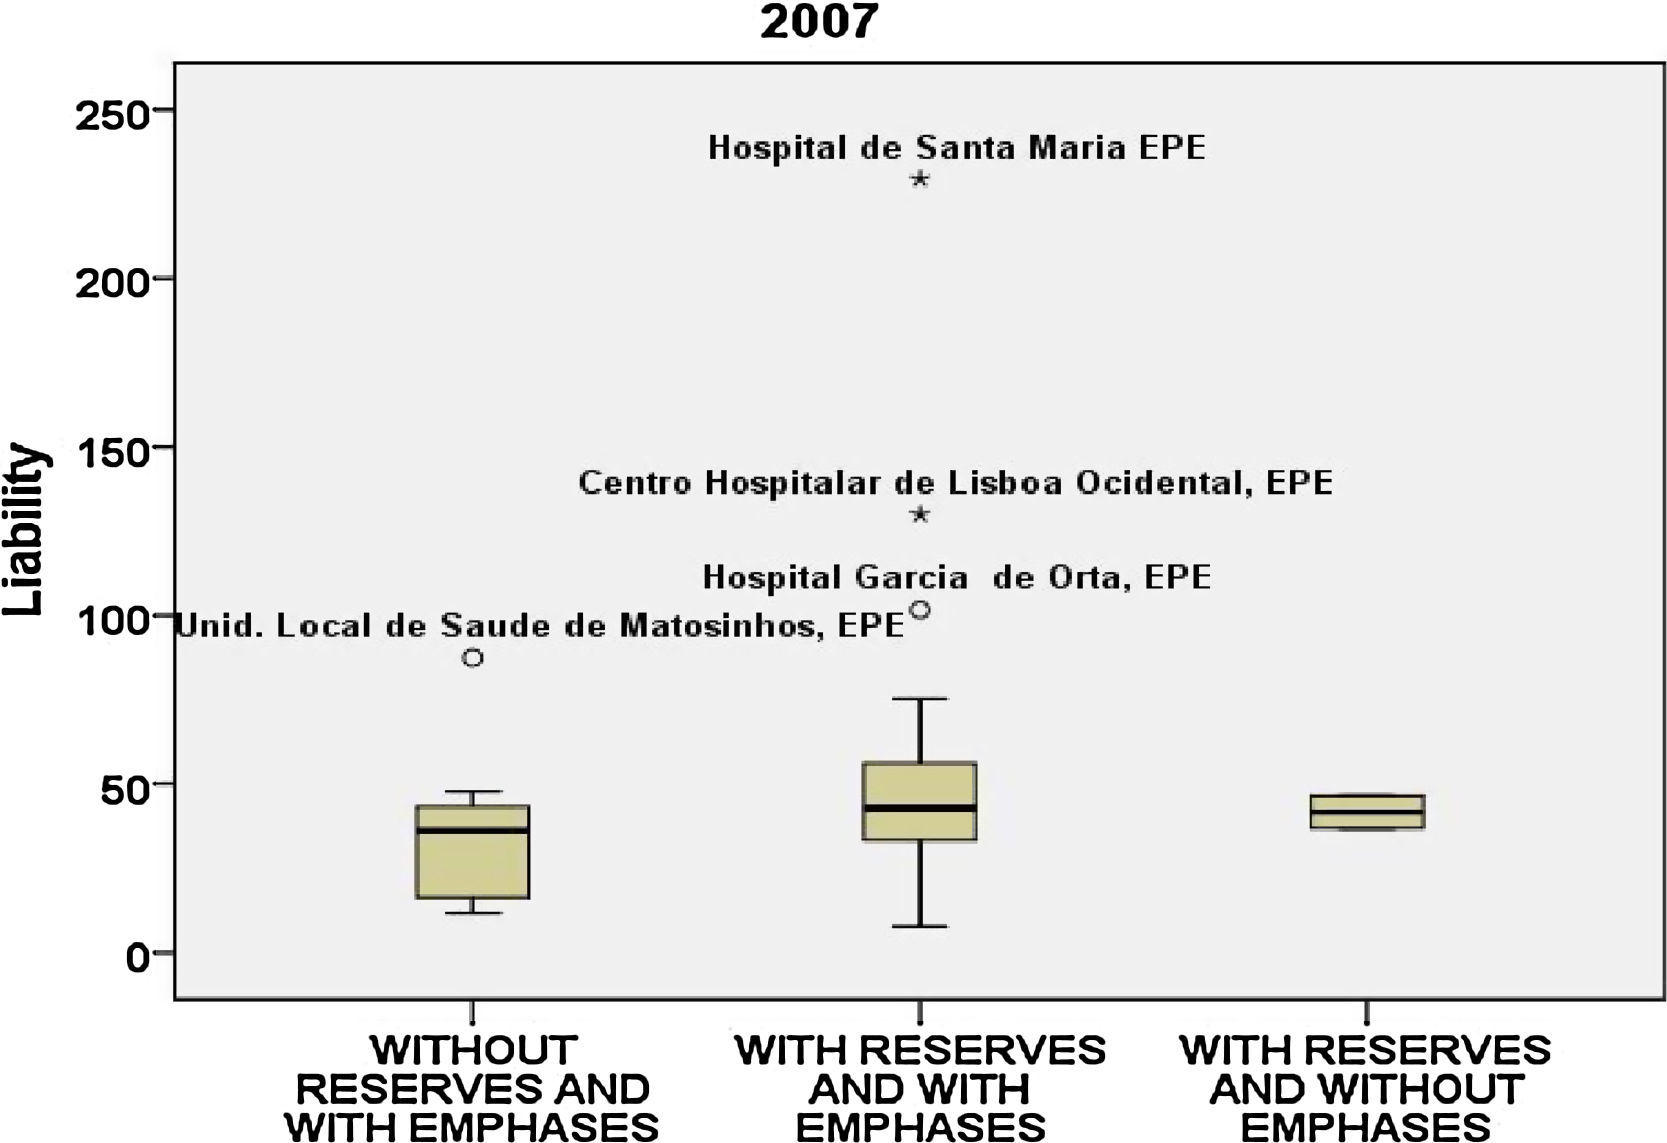
Concerning the liability (Fig. 23) and the turnover (Fig. 24) in 2007, the 2 bigger hospitals counterbalance a high liability with a great turnover, but Hospital Garcia de Orta, EPE and Unid. Local de Saúde de Matosinhos, EPE only stand out in the values of the liability. Concerning equity capital a similar distribution is evident in the 3 groups.
, 2007.")
, 2007.")
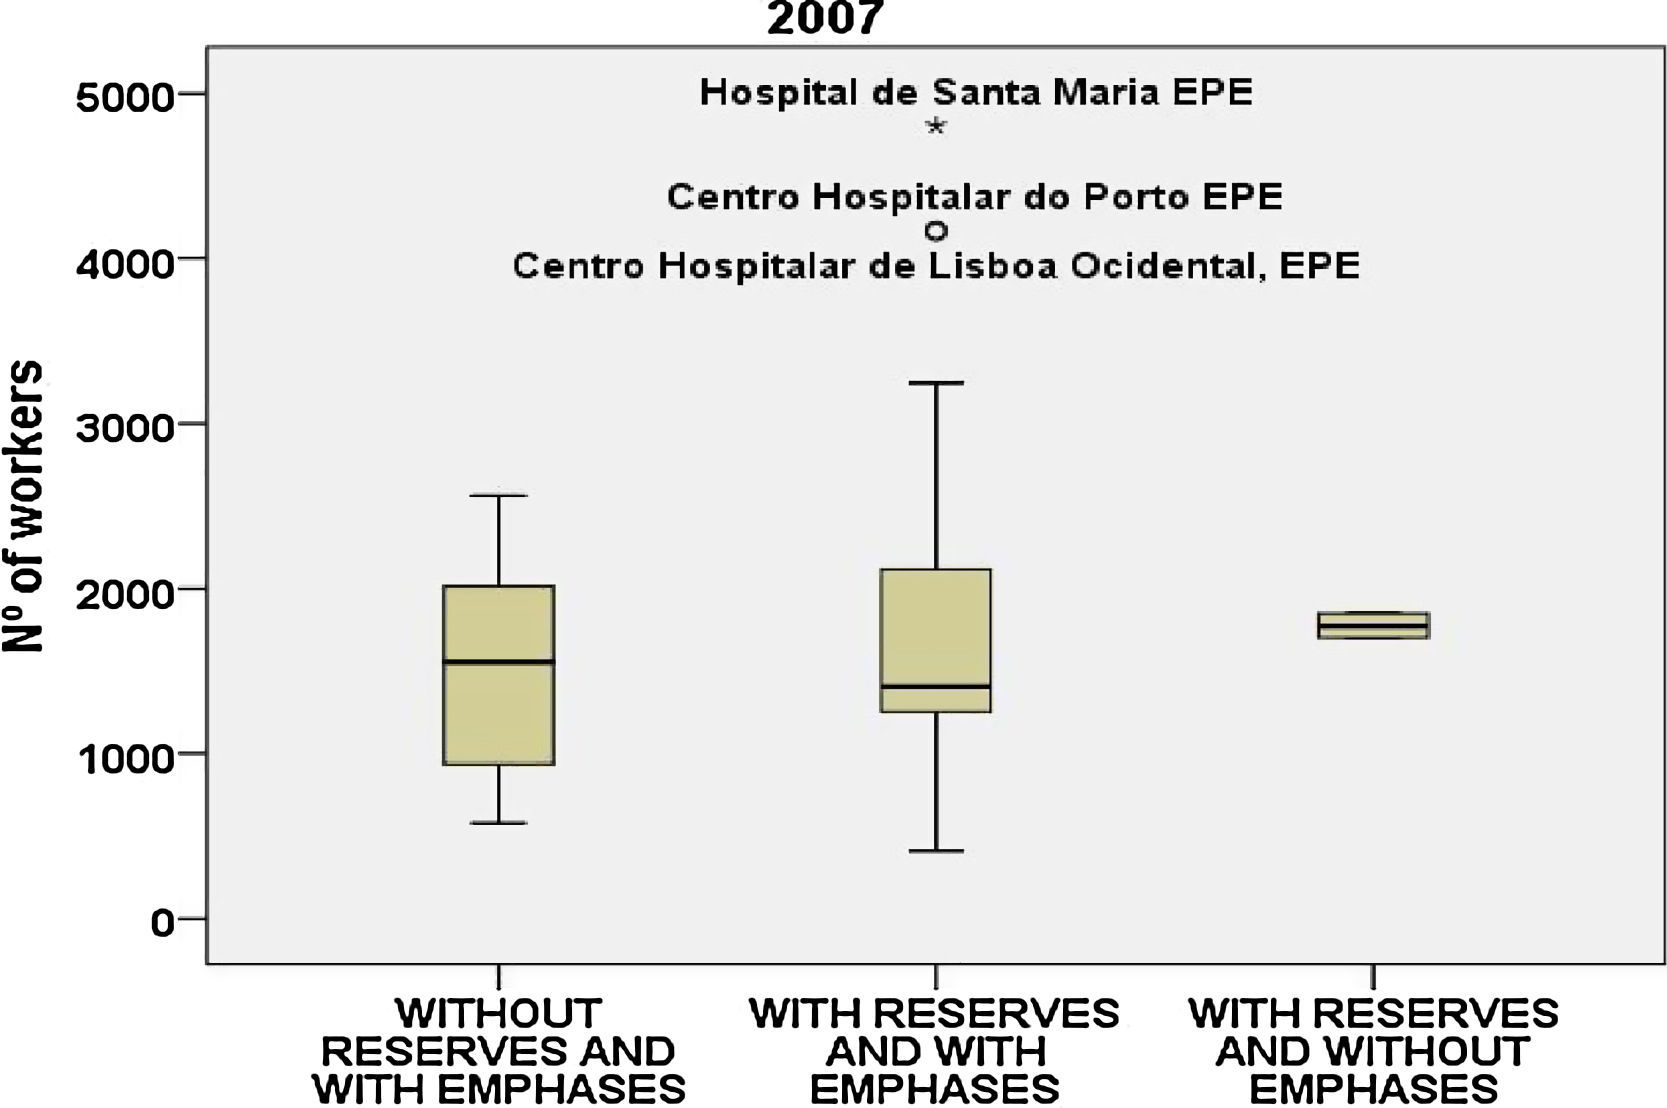
As for the number of workers (Fig. 25), they are out of the limits of the 2 hospitals mentioned and Centro Hospitalar do Porto EPE.
, 2007.")
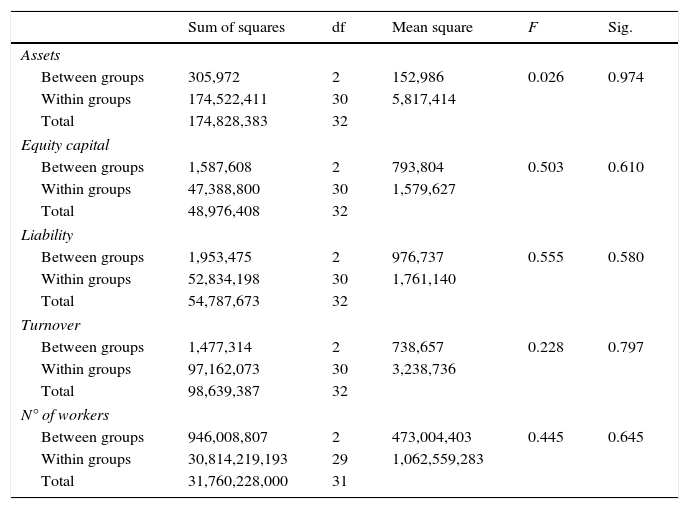
As in the previous years, it is possible to detect a similarity in the various groups in relation to the mean and the median (Table 6). ANOVA confirms this similarity and we cannot reject the null hypothesis since the p-value is very high.
ANOVA results, 2007.
| Sum of squares | df | Mean square | F | Sig. | |
|---|---|---|---|---|---|
| Assets | |||||
| Between groups | 305,972 | 2 | 152,986 | 0.026 | 0.974 |
| Within groups | 174,522,411 | 30 | 5,817,414 | ||
| Total | 174,828,383 | 32 | |||
| Equity capital | |||||
| Between groups | 1,587,608 | 2 | 793,804 | 0.503 | 0.610 |
| Within groups | 47,388,800 | 30 | 1,579,627 | ||
| Total | 48,976,408 | 32 | |||
| Liability | |||||
| Between groups | 1,953,475 | 2 | 976,737 | 0.555 | 0.580 |
| Within groups | 52,834,198 | 30 | 1,761,140 | ||
| Total | 54,787,673 | 32 | |||
| Turnover | |||||
| Between groups | 1,477,314 | 2 | 738,657 | 0.228 | 0.797 |
| Within groups | 97,162,073 | 30 | 3,238,736 | ||
| Total | 98,639,387 | 32 | |||
| N° of workers | |||||
| Between groups | 946,008,807 | 2 | 473,004,403 | 0.445 | 0.645 |
| Within groups | 30,814,219,193 | 29 | 1,062,559,283 | ||
| Total | 31,760,228,000 | 31 | |||
Source: SPSS.
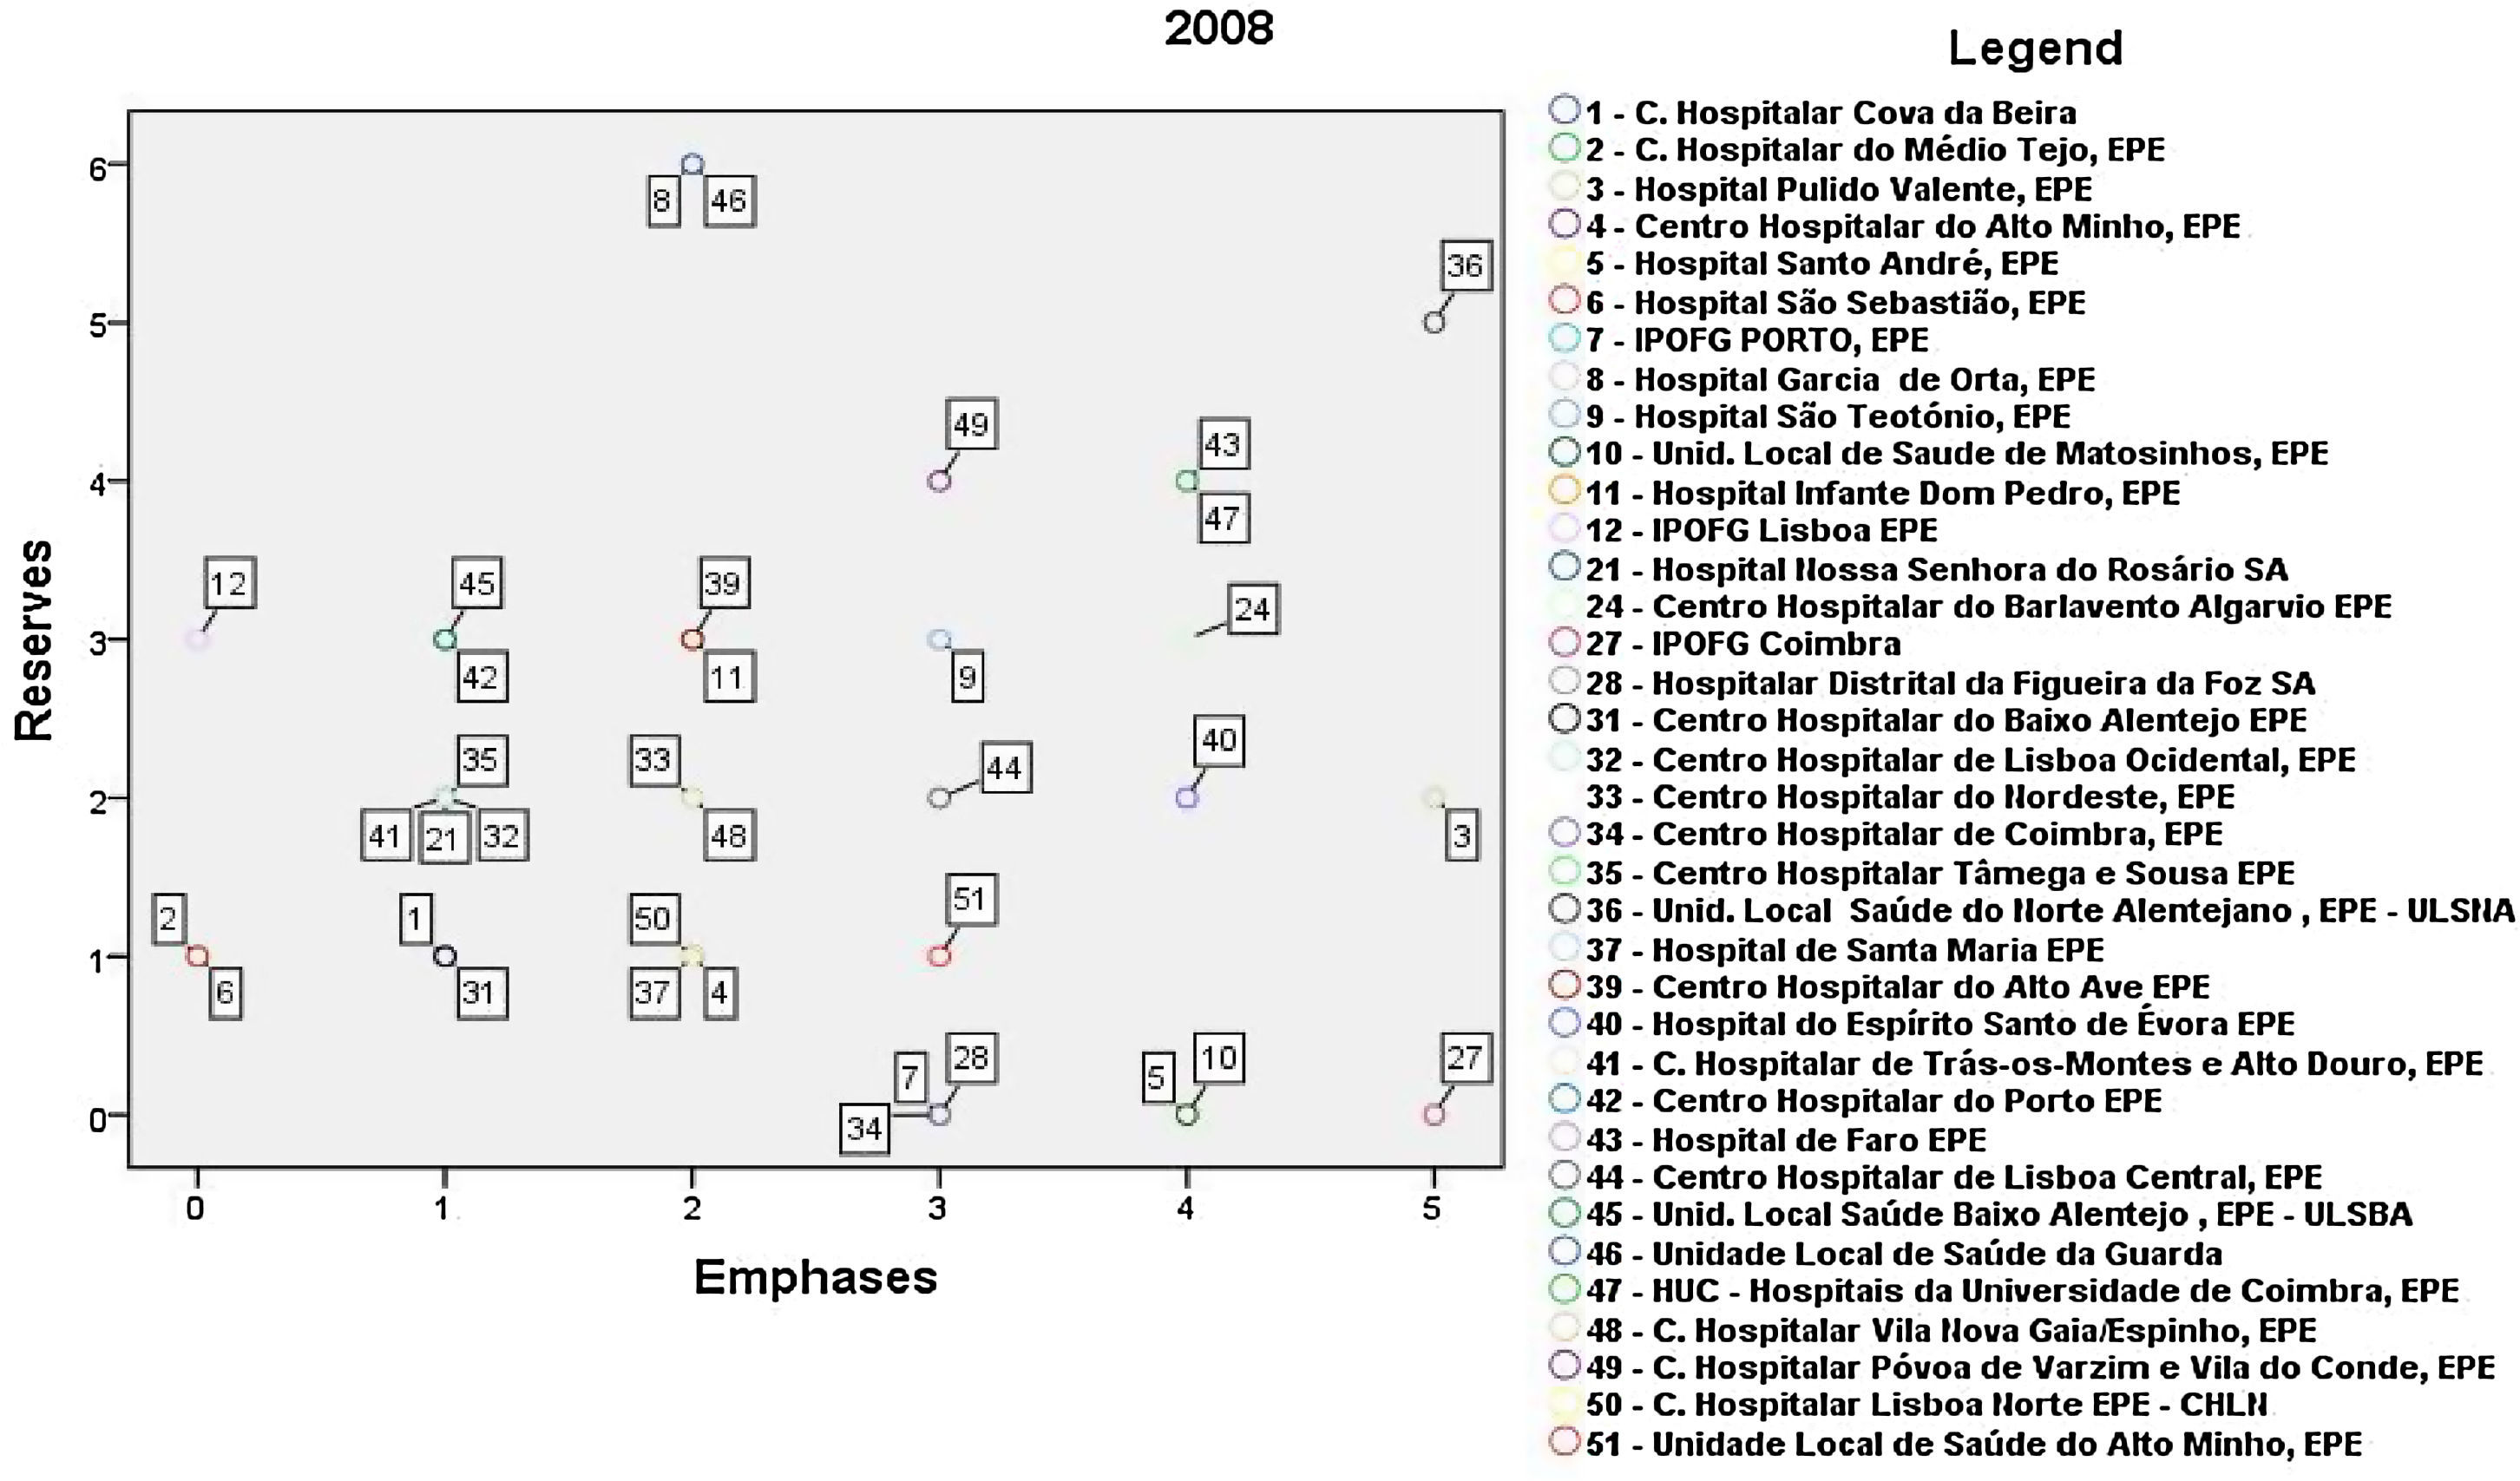
Following the increase in public hospitals, with the EPE figure, Fig. 26 acquires the following configuration.

As we can see in Fig. 26, similarly, in 2008 there are no occurrences in the group “without reserves and without emphases”, and therefore the number of hospitals “with reserves and with emphases” increasing 75%. In 2008, in comparison to the previous years, there are few cases in the groups without reserves and without emphases.
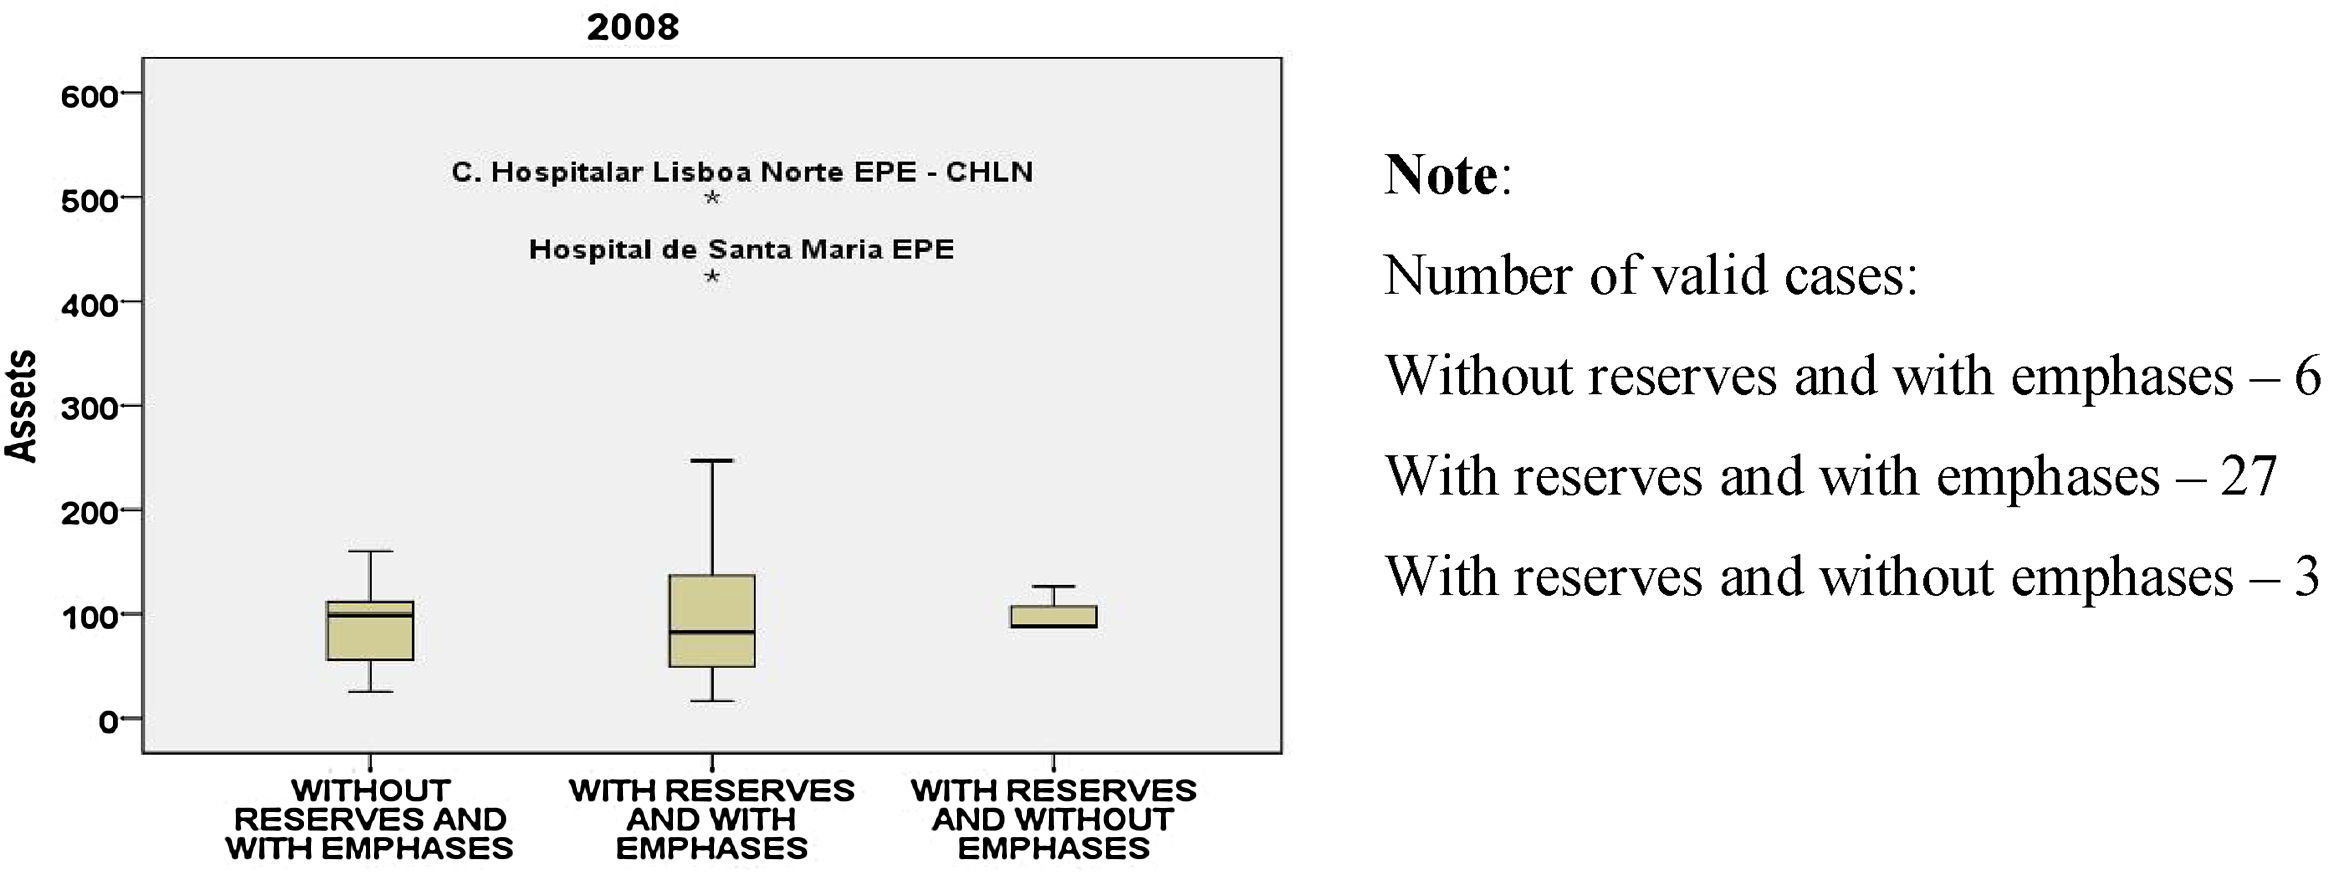
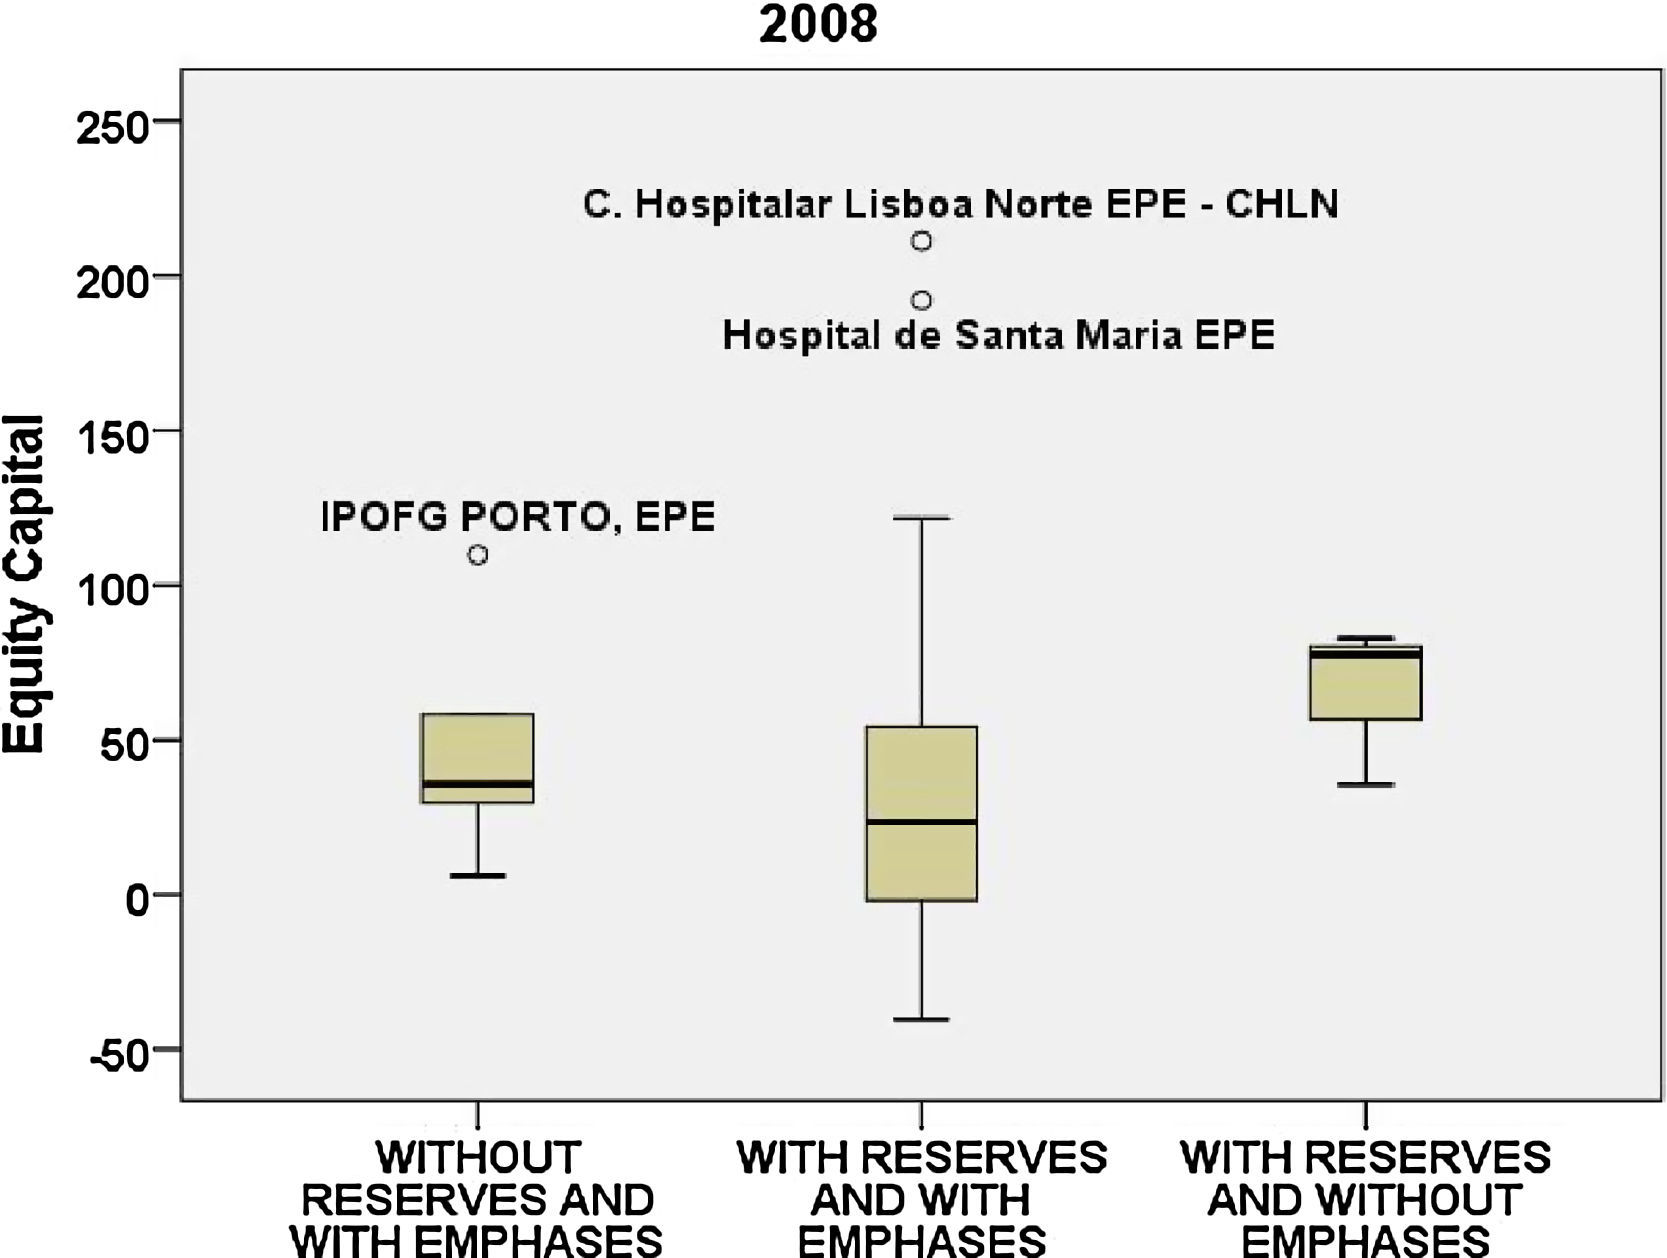
The mean of the assets (Fig. 27) ranges between 91 and 119M. The hospitals of Lisbon continue to stand out in all the variables in comparison to the other hospitals under analysis.
, 2008.")
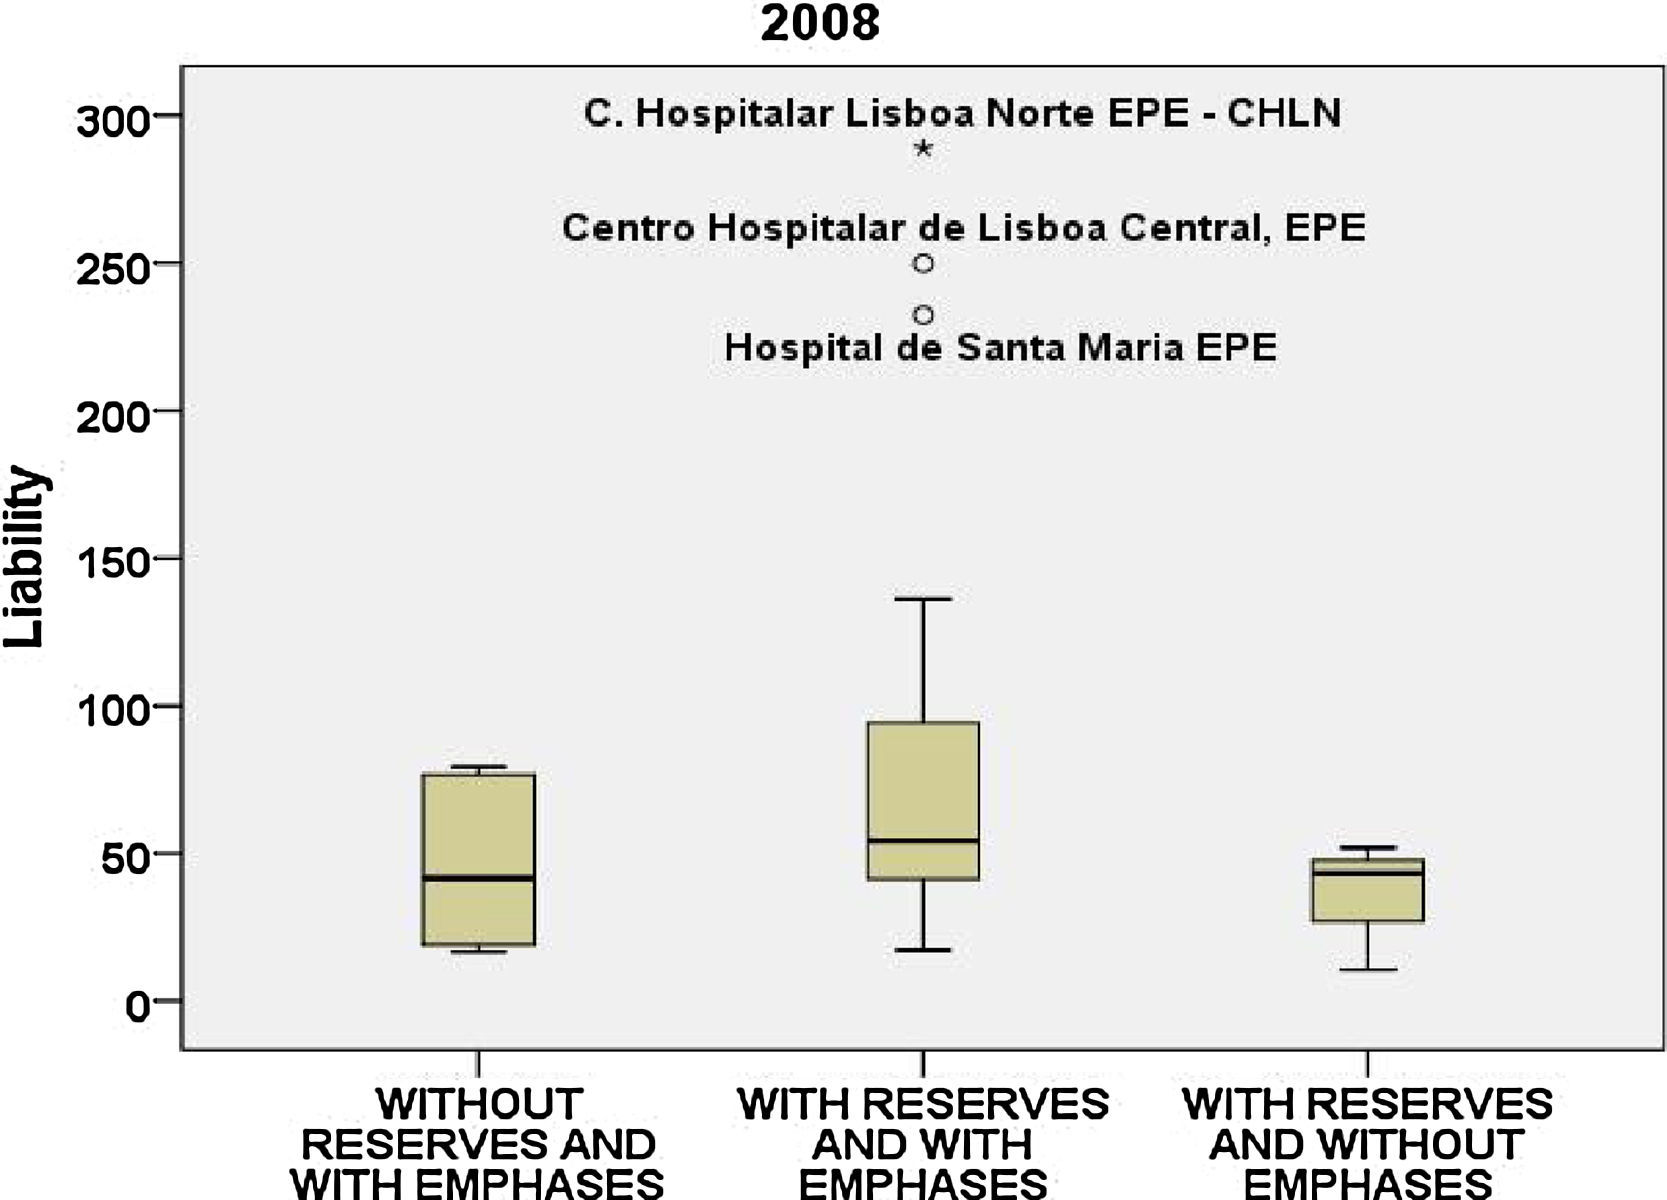
The mean of the equity capital (Fig. 28) varies between 38 and 65M and the mean of the liability (Fig. 29) between 35 and 82M. As the scales are similar we can see that the liability is slightly above the equity capital.
, 2008.")
, 2008.")
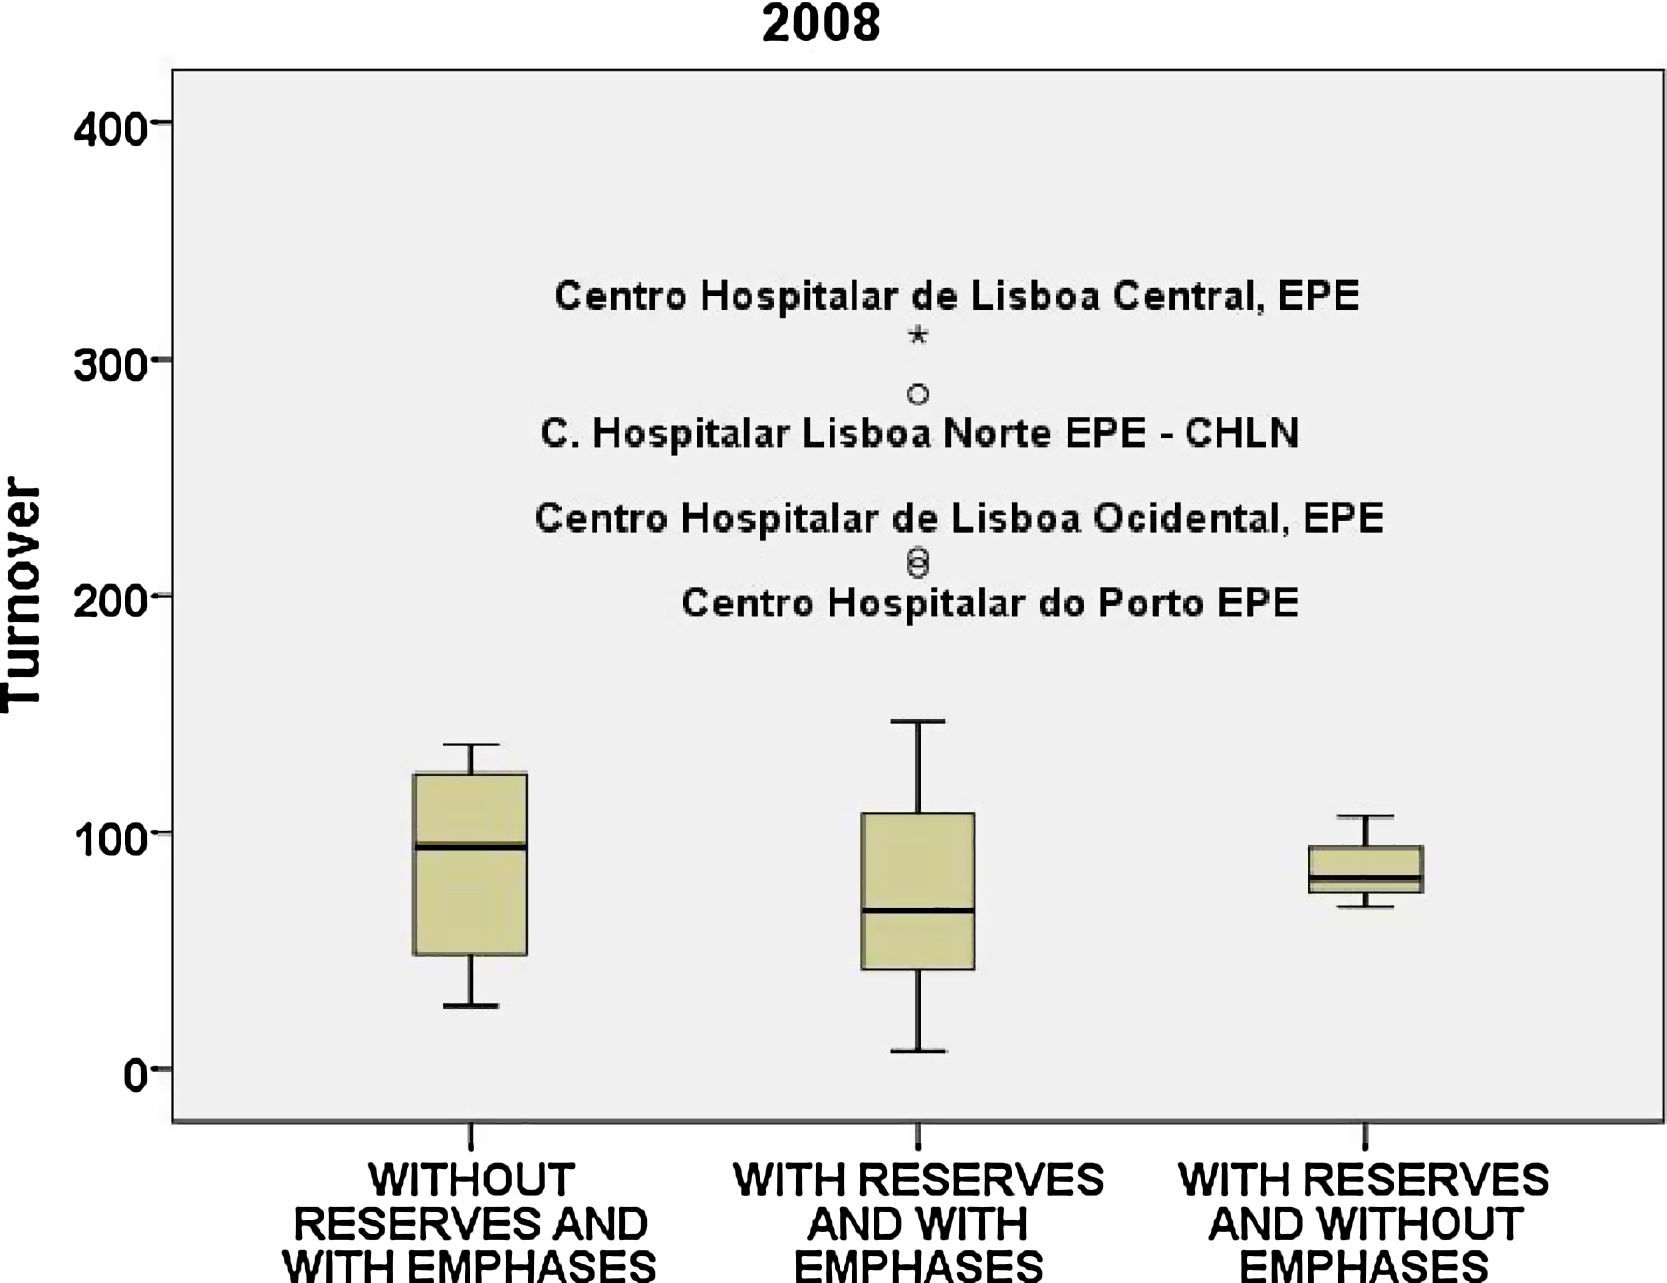
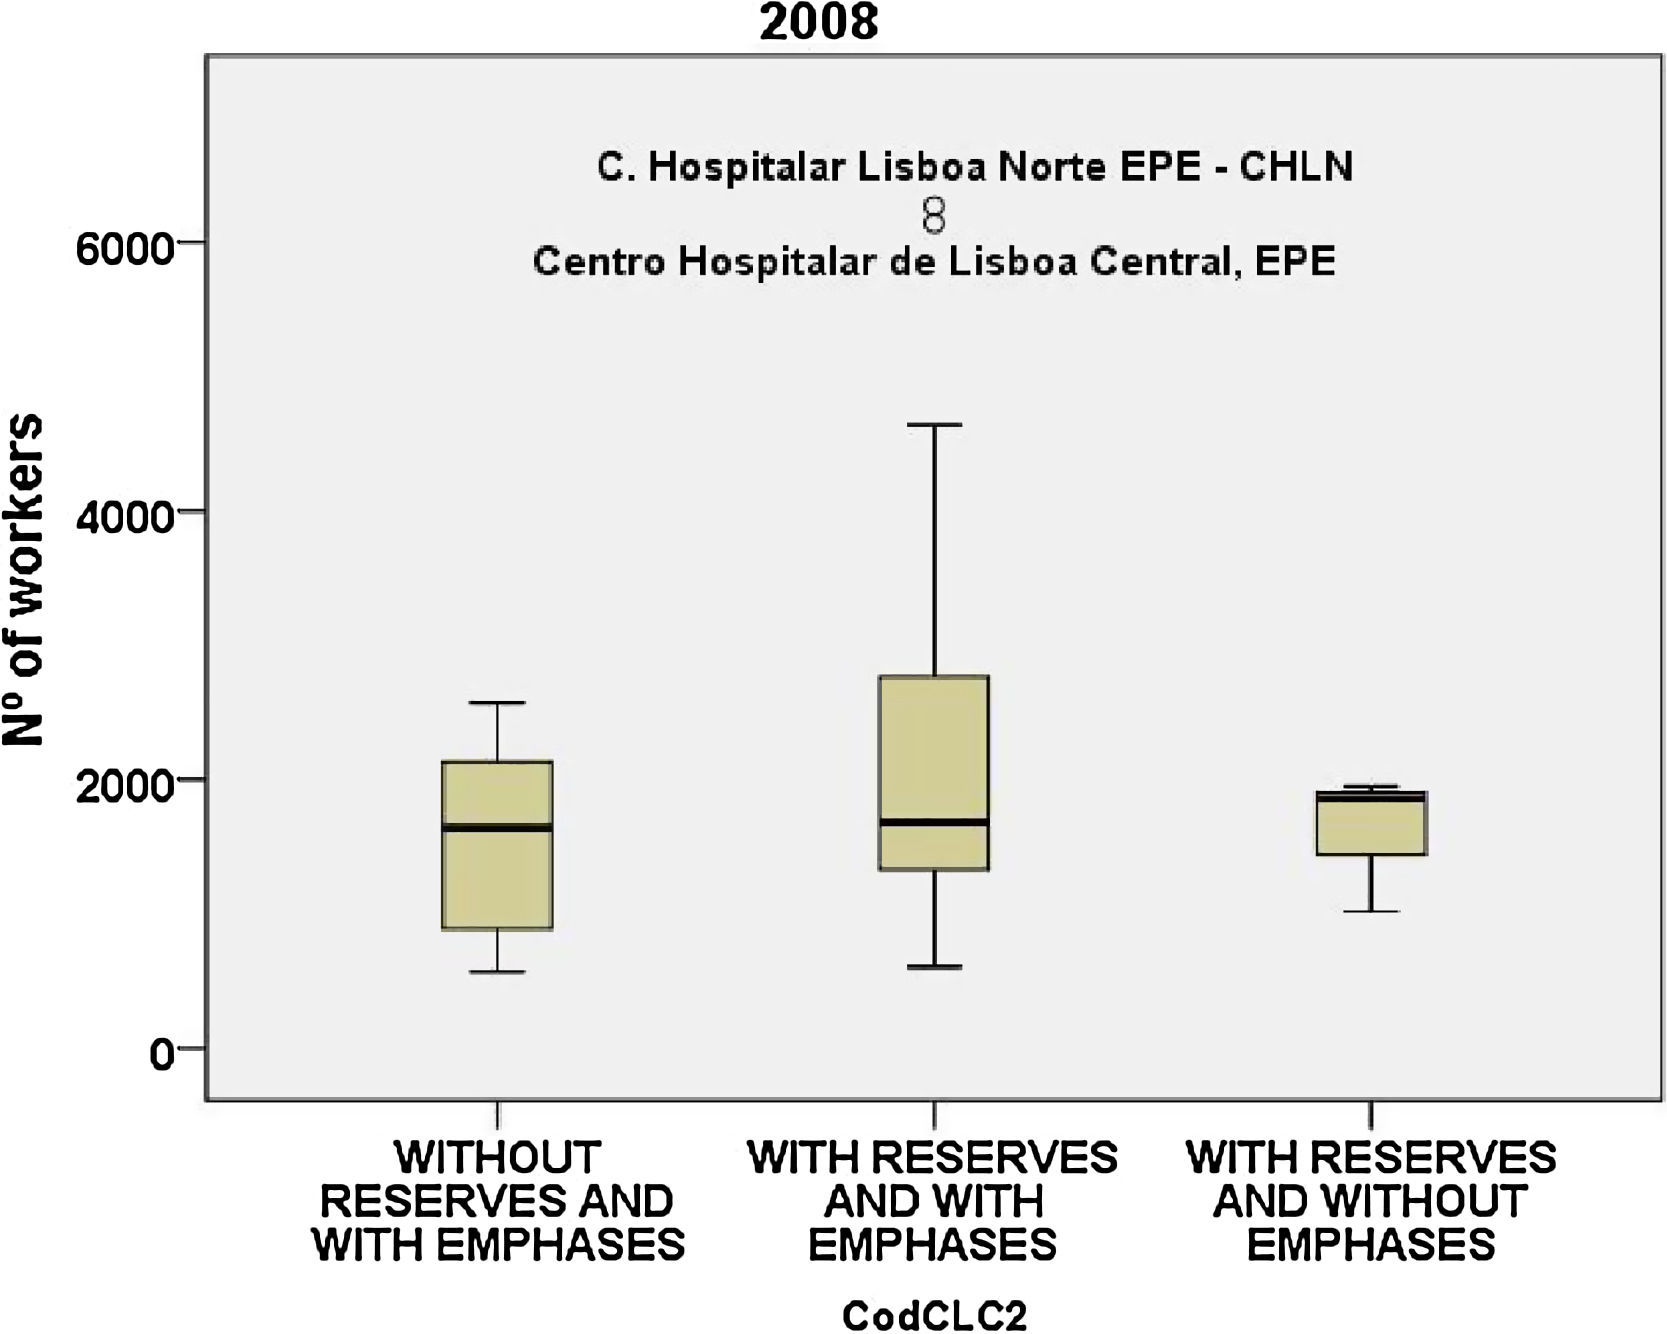
In the turnover (Fig. 30) the hospitals of Lisbon and Centro Hospitalar do Porto EPE show abnormal values comparing to the other hospitals. The number of workers (Fig. 31) with a mean around 2 thousand workers reaches a maximum at C. Hospitalar Lisboa Norte EPE – CHLN with 6.268 workers.
, 2008.")
, 2008.")
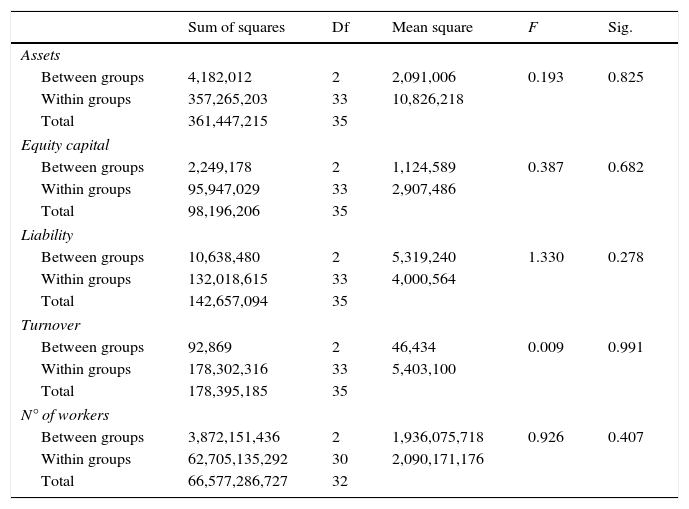
Also in 2008, according to Table 7, the variance analysis confirms that we cannot reject the null hypothesis.
ANOVA results, 2008.
| Sum of squares | Df | Mean square | F | Sig. | |
|---|---|---|---|---|---|
| Assets | |||||
| Between groups | 4,182,012 | 2 | 2,091,006 | 0.193 | 0.825 |
| Within groups | 357,265,203 | 33 | 10,826,218 | ||
| Total | 361,447,215 | 35 | |||
| Equity capital | |||||
| Between groups | 2,249,178 | 2 | 1,124,589 | 0.387 | 0.682 |
| Within groups | 95,947,029 | 33 | 2,907,486 | ||
| Total | 98,196,206 | 35 | |||
| Liability | |||||
| Between groups | 10,638,480 | 2 | 5,319,240 | 1.330 | 0.278 |
| Within groups | 132,018,615 | 33 | 4,000,564 | ||
| Total | 142,657,094 | 35 | |||
| Turnover | |||||
| Between groups | 92,869 | 2 | 46,434 | 0.009 | 0.991 |
| Within groups | 178,302,316 | 33 | 5,403,100 | ||
| Total | 178,395,185 | 35 | |||
| N° of workers | |||||
| Between groups | 3,872,151,436 | 2 | 1,936,075,718 | 0.926 | 0.407 |
| Within groups | 62,705,135,292 | 30 | 2,090,171,176 | ||
| Total | 66,577,286,727 | 32 | |||
Source: SPSS.
This study intends to provide evidence of the correlation between the various financial variables included in the financial statements of the Portuguese public hospitals with the legal form of SA/EPE and the type of audit report. In general, the developed studies have mostly deepened the issue of the going concern and the adjustments it introduces to the changes of the report. However, this reason is not the only one that introduces changes to the audit report as there may be disagreements between the auditor and the audited entity regarding the accounting measurement problem, the accounting policies and the way the financial information is disclosed, as well as the limitations related to the issue of the search for evidence. Consequently, the components of the various types of audit reports are very different (Ireland, 2003). In the entities under study – public hospitals – we can observe a total separation between the property – the totality belongs to the Portuguese State – and its control, and there also is a diverse regulatory framework to comply to.
The external audit is compulsory for the hospitals and therefore the audit report is important for the holder of the total capital: all the Portuguese taxpayers. Thus, the extension of the reserves and the emphases, included in the audit reports in the period of time under study, reflects the auditors’/statutory auditors’ effort to report their decisions. In effect, the characteristics of the audited entities tend to influence the audit report and, in this particular case, the modified reports, with the underlying problem of the going concern, should not be applicable. Indeed, the changes of the audit report, regarding the problem of the continuous management, are issued when the auditor thinks that there is a high probability of the companies stopping their activity in the near future, which, in general, does not happen in the business reality under study. Therefore, the modifications of the audit reports refer mainly to the issue of creating assets, recognising earnings, re-evaluating the fixed assets, the contingent liabilities involved in the payment of pensions, as well as other less important disclosures.
The scope of the reserves and emphases is very diverse which suggests a total independence and objectivity of the auditors who do not feel any threat regarding their reappointment for another mandate (the nominated auditors can only do two consecutive mandates in the same public hospital). This situation contradicts the conclusions in Chow and Rice (1982), Citron and Taffler (1992) and Craswell (1988) that suggest that the possible change of auditor may influence the type of not modified audit report. Subsequently, Farmer, Rittenberg, and Trompeter (1987) suggest that there is a propensity on the auditors’ part to accept less orthodox accounting treatments when the possibility of losing the client is high and the risk of litigation is low.
Concerning the nomination of the auditors, during the period of time under study, we noticed two particularities: Deloitte was the only Big Four nominated, between 2003 and 2005, for a big public hospital, situated in Lisbon (Santa Maria), and an auditor as an individual was nominated for the Hospital of Figueira da Foz. However, the mandates were not renewed and currently no Big Four works in this type of hospitals, which are audited by small and medium size auditing companies whose mandates have been renewed by the Ministry of Finance. We also notice that, there is at the end of their mandates a rotation of the auditing companies in the various hospitals. Their nomination by the Portuguese Ministry of Finance reinforces their independence and as the hospitals are under the scrutiny of the public, it increases the risk of legal action against the auditors and it may affect their reputation, and as a result there is a large set of modified reports. Consequently, the auditors of these organisations have adopted a very conservative behaviour when issuing the report. The analysis of the reserves and emphases suggests that these professionals have deepened the analysis of the evidence collected in the auditing process, which has contributed to the disclosure of modified reports. From the analysis of Appendix 5, we see the persistence of the modified audit reports during the period of time under study, to the detriment of non-modified reports. The latter simply suggest that the hospitals correctly report and do not stress fundamental uncertainties. Nonetheless, this type of reports can persist, although there is the problem of the financial statements, due to the auditor's behaviour: negligence, strong threats or emergence of potential growth problems. In this last case, the difficulty is identified in its initial path, but its impact on the financial statements is still considered insufficient for the auditor to express a modified opinion. As the issue reaches more significant levels and the auditor continues to ignore the situation, we may be faced with a no return situation: the more time the auditor takes to report the situation the greater is the difficulty to make a timely decision. On the other hand, the persistence of non-modified reports may also be explained by the fact that there is reluctance on the auditor's part to modify his initial judgement.
The financial variables associated to the audit reports have been studied by Dopuch et al. (1987) and by Ireland (2003), who have adopted a probit model to connect the dependent variable – audit reports – involving situations of uncertainty or contingencies, with financial and market variables with presumed predictive capacity to determine the decisions to modify the audit report.
In general, the previous terms construct economical and financial indicators, whose predictive capacity is not equal. Beaver (1966) admits that the ability to predict the issue of an audit report putting into question the going concern of the entity is upheld when we associate the cash flow with the total of the liability. The second indicator with greater capacity of decision is the net result related to the total assets and both are correlated. The third indicator relates the total assets with the liabilities. Finally, the liquidity ratios reveal less predictive capacity. On the other hand, in Altman's and MacGough (1982)Z-score we use the annual sales volume related to the total assets. The indicators have been used to diagnose only problems of continued management, however, on their own, the value of the assets, the liabilities, the turnover, the sales volume and the number of workers have not been used to forecast the type of audit report and measure the respective correlation. We concluded therefore that the independent variables do not have a significant effect on the reserves or emphases, in so far as the level of significance or its probability is less than 0.05. This statistical evidence allows us to reject the null hypothesis (H0). Thus, we concluded that no independent variable influences the CLC.
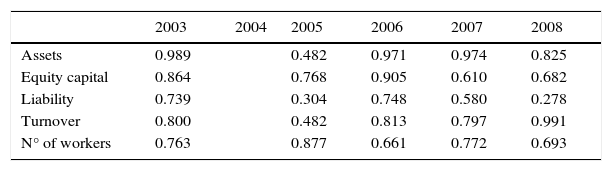
We confirmed the visual observation with the results of the variance analysis (ANOVA) and we were able to conclude that the null hypothesis (H0) stated, regarding the similarity of the groups, cannot be rejected taking into consideration the level of significance obtained, that is, the independent variables do not have a significant effect on the existence of reserves and/or emphases. In Table 8 we summarise the level of significance or the probability of significance (p-value).
ANOVA results.
| 2003 | 2004 | 2005 | 2006 | 2007 | 2008 | |
|---|---|---|---|---|---|---|
| Assets | 0.989 | 0.482 | 0.971 | 0.974 | 0.825 | |
| Equity capital | 0.864 | 0.768 | 0.905 | 0.610 | 0.682 | |
| Liability | 0.739 | 0.304 | 0.748 | 0.580 | 0.278 | |
| Turnover | 0.800 | 0.482 | 0.813 | 0.797 | 0.991 | |
| N° of workers | 0.763 | 0.877 | 0.661 | 0.772 | 0.693 |
Note: In 2004 the number of cases in each group is insufficient to perform a variance analysis.
None of the p-value is inferior to “0.05”, which is the necessary statistical evidence to reject the null hypothesis (H0). On the contrary, as p-value is very high, the possibility of error associated to the assumption that the result assumed in the null hypothesis is not representative of the theoretical population is the bigger. We may conclude that none of the independent variables influences the audit report.
6ConclusionsThe main goal of the investigation is to know if the independent variables related to assets, equity, liabilities, turnover and number of workers affect the dependent variable – audit report. The ANOVA results for the years under review, except for the year 2004, whose number of cases in each group is insufficient to perform a variance analysis, allows us to conclude that according to the statistical analysis performed, none of the independent variables influence the type of audit report. Therefore, the explanations for the existence of reserves and emphases must be investigated, not in terms of the size of the hospitals, but taking into account other explanatory factors to be developed in future investigations.
Limitations of the studyThe particularity of the study focuses on the Portuguese public hospitals, with the legal form of EPE, referring to the 2003 to 2008 period, which requires moderation in the extrapolation of the results.
Suggestions for further researchTo update the data until 2014, available in the meantime for some hospitals on the site http://www.acss.min-saude.pt, and contrast them with the results obtained between 2003 and 2008.
The following are the supplementary data to this article:
