


Metallic cellular materials are characterized by a low specific weight and a high energy absorption capability, which make them promising for application in devices of the transportation industry in order to meet the requirements of a reduced fuel consumption and carbon dioxide output. This intention necessitates the evaluation of material performance under several load conditions. Investigations have shown that the out-of-plane properties with regard to specific energy absorption (SEA) capability of high-density steel honeycomb structures with square-celled profile are outstanding while the potential under in-plane conditions is distinctly lower. Therefore, FEM-based numerical analyses are conducted by the use of ABAQUS-software to investigate the influence of cell geometry. The results reveal an enhancement of absorbable energy in in-plane direction by applying an ordered sequence of hexagons and triangles, the so-called Kagome geometry. Comparative quasi-static compression tests serve to verify the FE-analysis. The obtained results are discussed with respect to strength level and achieved SEA capability in dependence of the cell geometry and load condition.
Recent studies showed that the out-of-plane compressive stress–strain behavior of high-density square-celled honeycomb structures made out of TRIP-steel is distinguishable in four characteristic sections. Initially, a linear-elastic region is formed, followed by a pre-buckling stage before buckling and structural collapse initiates. At elevated strain levels structural densification connects to the post-buckling stage [1,2]. The achieved high strength level, entailing a great energy absorption capability in this load direction, is traced back to the deformation caused predominantly by normal stresses along the loading direction [3,4]. In dependence of relative density, local or torsional buckling and global “Euler-type” buckling occurred, which lead to folding collapse and symmetric extensional collapse mode with plastic kink formation, respectively [1].
Contrary, a distinct decrease of strength can be measured if the axial force is applied perpendicular to the channel axis (in-plane). Under consideration of stress–strain progress, an absence of the pre-buckling stage has to be recorded so that the loss of stiffness and structural failure is directly connected to the mainly linear elastic region. Principally, the vertical struts are also subjected to axial stresses at the beginning of deformation. However, inhomogeneities caused by manufacturing like curved cell walls, pores or impurities lead to the onset of instable deformation. Bending moments are initiated in the cell nodes, which are adjacent to the imperfections, involving bending and rotation of cell walls. Thus, macroscopic failure is characterized by sequential shear of the several cell rows [4]. In literature, row by row destabilization was also observed for aluminum honeycombs with hexagonal cells [5] and square-celled profiles made out of maraging steel [6].
Basically, the stiffness and the strength of periodic cellular structures depend on the dominating deformation mechanism namely cell wall stretching or bending. Which kind of mechanism occurs, is influenced by the cell geometry. For equilateral triangular cells, Kagome cells and diamond cells (transverse stiffened) with rigid joints preferable cell wall stretching was identified in in-plane mode. As a result, the collapse load depends mainly on the axial strength of the struts. Contrarily, honeycombs with hexagonal cells and rigid joints are occupied by the bending-dominated mechanism leading to a higher compliance and lower collapse strength as compared to stretch-dominated structures [7,8].
It cannot be assumed that cell walls of honeycomb structures with square cells, processed by a powder metallurgical extrusion process, are exactly aligned and consequently that bending-dominated deformation is avoidable in in-plane mode. Nevertheless, the replacement of square cells by cell geometries entailing a more stretch-dominated deformation mechanism seems to be promising in order to increase the strength and hence the energy absorption capability, which is essential for potential application in devices of the transformation industry.
In this study, FEM-based numerical analyses are conducted in first instance to identify a cell geometry with increased strength at different load conditions. Subsequently, a die for the extrusion process is manufactured according to the geometry with promising properties. The sintered honeycombs are investigated in quasi-static out-of-plane and in-plane compression tests in comparison to the structures with 14×14 square cells.
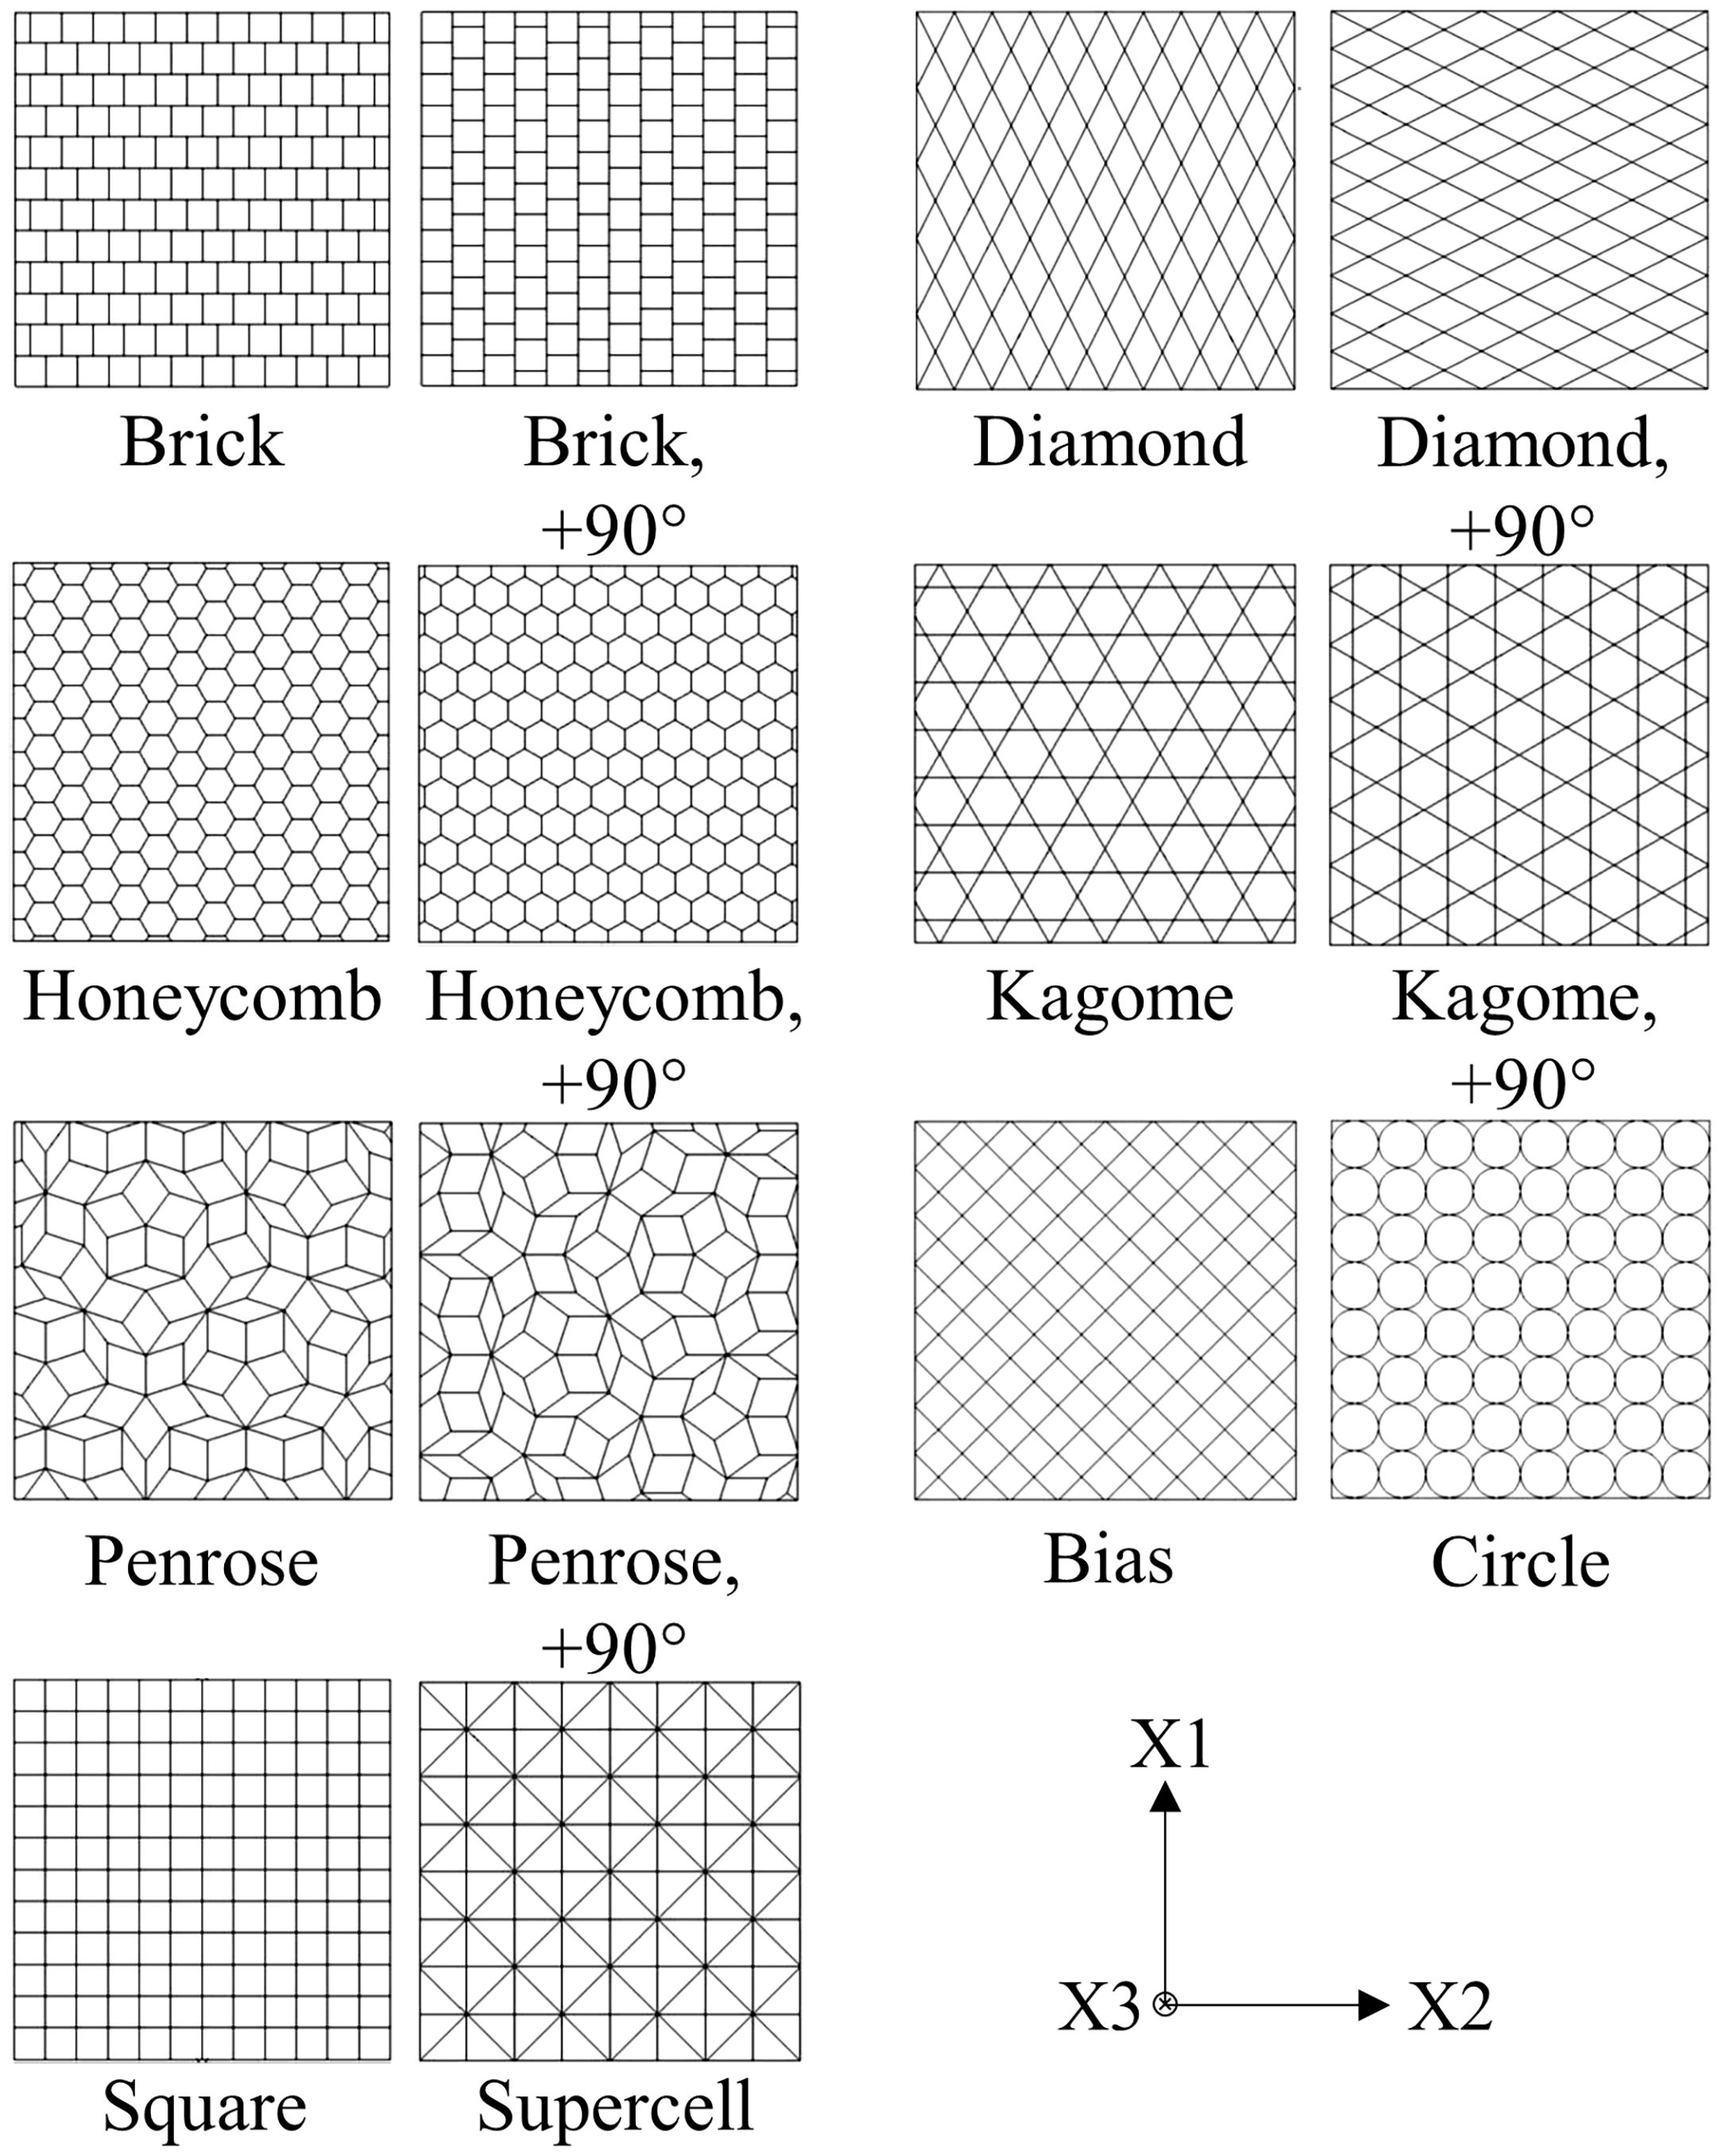
2Finite element analysisThe FEM-based numerical analysis considers the load conditions of in-plane and out-of-plane compression. Final aim of the study is the identification of the cell geometry which provides the highest SEA capability at dynamic strain rates. A limiting factor for the selection of new cell geometries arises by the manufacturability via powder metallurgical extrusion process, requiring a cell wall thickness of at least 250μm and preferable straight contours. Fig. 1 contains an overview of the nine investigated base profiles. Additionally, five of those profiles are analyzed by 90°-rotation due to their strong axial anisotropy.

Numerical simulations are done by the use of an explicit solver of ABAQUS-software and models developed in a detached C++ routine. Thereby, true stress–strain curves of compression tests, conducted at a temperature of 20°C and strain rates between 10−3s−1 and 2.5×10³s−1 on cylindrical compact samples out of steel 1.4301, are utilized for isotropic, strain rate dependent and isothermal material definition in ABAQUS. The influence of manufacturing caused microporosity, which leads to a difference of 5% in density between compact material and honeycomb structures, is taken into account by decreasing the flow stress by 10%. This assumption was done by comparing the true compression stresses of the compact material and the former investigated honeycombs in the pre-buckling stage where the cell wall deformation is describable with the uniaxial response of the compact material. Additionally, modified material parameters namely a density of 6.68gcm−3, an elastic modulus of E=129GPa and a Poisson's ratio of υ=0.238 are applied [1,9,10].
In principle, dynamic strain rates and high deformation degrees result in a significant sample heating. In the current material model this influence of temperature is exclusively considered via the progression of the static and dynamic flow curves due to the absence of data from hot compression tests. An implementation of a damage model is not taken into account because of the non-availability of suitable characteristics. However, it can be assumed that a high damage tolerance proven by high fracture strains of 38–40% (static strain rate) will restrict crack initiation and bifurcation up to the densification stage where the influence on the force-displacement curve and hence the energy absorption capability is relatively low.
As a result of the complexity of the new cell geometries, generation of ABAQUS input scripts is accomplished by a semi-automatic C++ routine. Thus, models of the 14 honeycomb structures (Fig. 1) for out-of-plane and in-plane load condition can be developed separately. In preparation for this, model specifications like boundary conditions, load and amplitude determination, step time, possible mass scaling factors, contact definitions, choice of element type/size and specification of output measures have to be defined as well as structural features like the honeycombs cell number and the cell wall thickness. Subsequently, a 2D profile is generated according to the described input data which is extended by a defined element size to build up an Orphan-Mesh-Structure (OMS). Finally, the coordinates of the structure OMS along with those of punch and bearing are entered into the input file.
2.1Structure specific parametersCommon for the investigated honeycombs is the determination of relative density to 0.3. Hence, the cell wall thickness of every profile depends on the selected cell number. In order to get reliable values for shell-elements in the FE system, a subroutine is developed. Purpose of the routine is the measurement of lengths between different nodes of the 2D profile. Therefore, the cell wall thickness can be iteratively determined in combination with the relative density and the fixed outer dimension of 21.5mm×21.5mm.
2.2Model specific parametersBoth, honeycomb structures and non-deformable rigid bodies like the punch and the bearing, consist of linear 4-node shell elements with an accuracy of first degree and reduced integration as well as five integration points over the element thickness according to Simpson. The application of shell-elements instead of solid-elements is preferred due to the thin cell walls as shown by previous investigations [11–16].
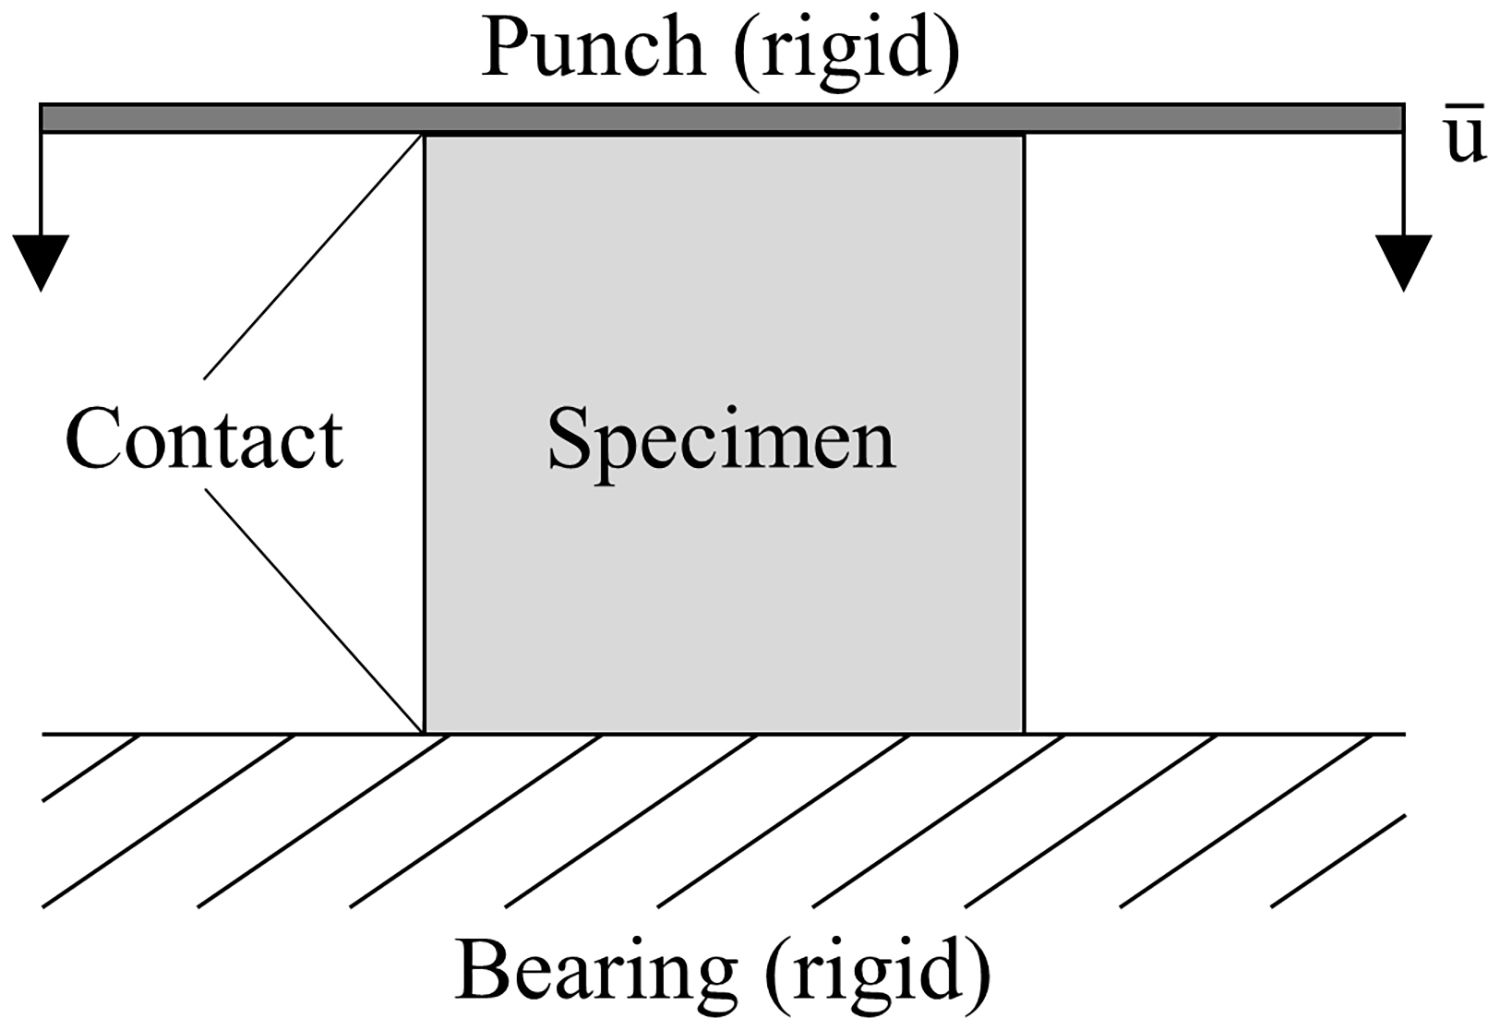
For high degrees of deformation a clash of cell walls is expected, necessitating the definition of contact surfaces for all outer planes. Internal contacts are described by the general contact option, which utilizes a tangential behavior of the contact partners with an isotropic, penalty-based friction character and a friction coefficient of 0.15. Additionally, surface-to-surface contacts between the punch and the bearing, respectively, and the honeycomb structures are used as penalty-contact with a finite-sliding expression according to the Master–Slave principle. The utilized numerical model setup with the boundary conditions is displayed in Fig. 2.

The problem definition is strongly non-linear because of large plastic deformations and the complex contact state. For this reason a dynamic, explicit analysis is conducted by the use of ABAQUS/Explicit entailing an increase of computation time especially in case of static load conditions. The strain rate dependent material behavior excludes the artificial acceleration of simulation by decreasing the natural step time (“Speed up”) in order to reduce computation time. However, since the discrete mass matrix is not essential for the central finite-difference-time integration and hence the temporal effectiveness and the precision of the solution, a “Mass Scaling” is applied for static load conditions as described in the ABAQUS manual or in literature [17,18]. Therefore, the mass of the model is increased artificially, causing also an increase of target time increment and thus a reduction of computation time without altering the actual step time. The implementation in ABAQUS is carried out by a forced application of a defined target time increment size at the beginning of the step for the whole model. The size of the target time increment was determined in a previous parameter study in order to avoid manipulation of simulation results. While applying this approach, attention was payed to the kinetic energy, which remained negligibly small compared to the internal energy. The main results presented in this article refer to the dynamic, explicit analysis without “Mass scaling” due to the study aim of determining the cell geometry with the highest SEA capability at dynamic strain rates.
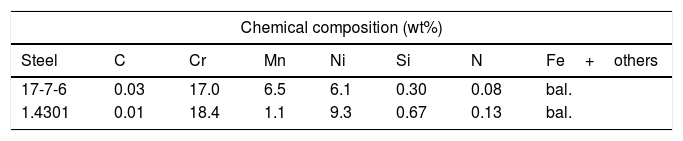
3Manufacturing and mechanical testingBase material for the FEM-analysis is a widely used austenitic stainless steel with reference 1.4301, which consists of the main alloying elements chrome and nickel, as Table 1 shows [19]. In addition to the improvement of structure geometry, an overall aim of the research project is an accelerated development of steels, which show the TRansformation Induced Plasticity (TRIP)-effect during plastic deformation. Connected with the TRIP-effect occurrence is an increase of strength and ductility at the same time, leading to an additional enhancement of absorbable energy [20,21]. For this reason, a newly developed 17Cr7Mn6Ni-steel (cf. Table 1) [22] is selected for comparative investigations of structure performance in order to exploit both the structure and material progression.
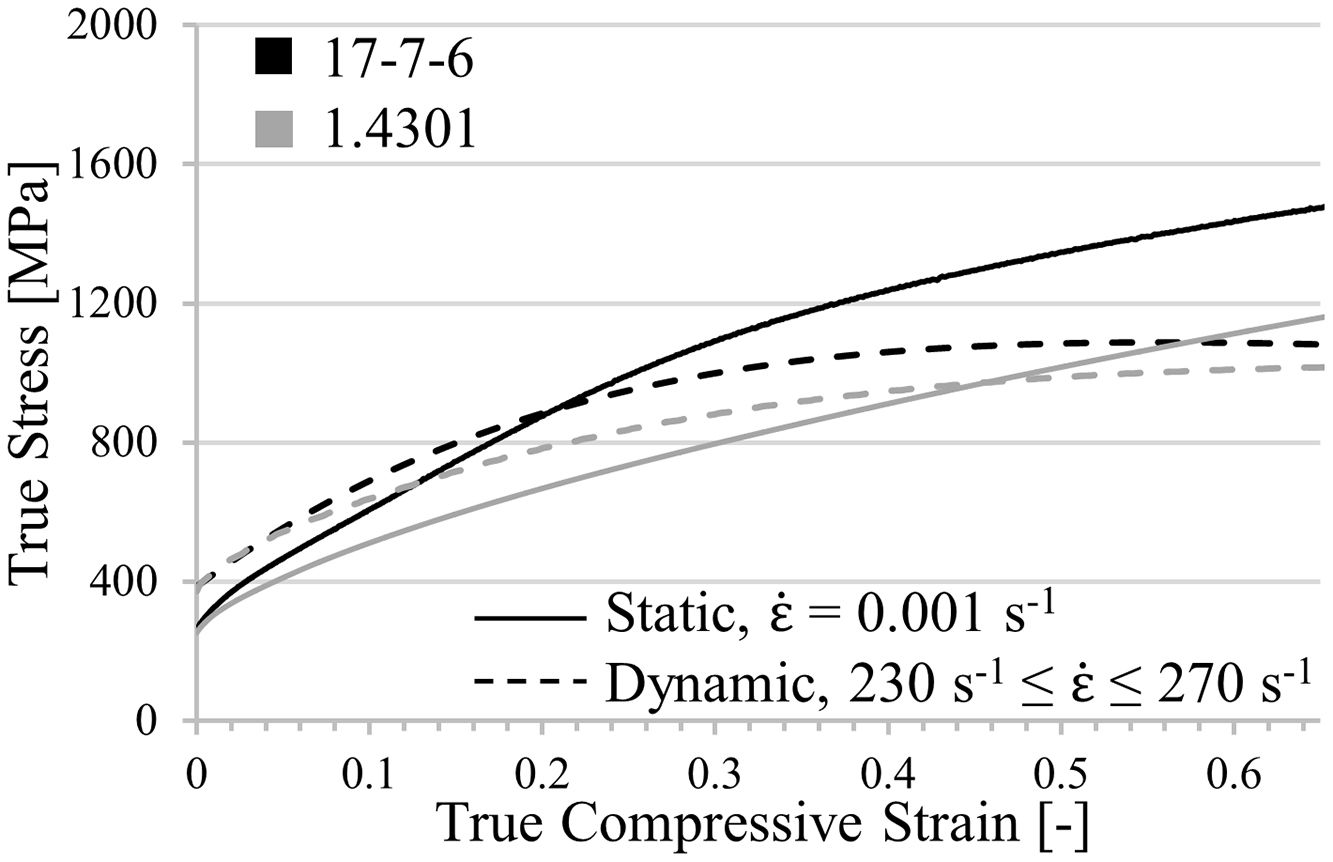
By comparing the true stress–strain curves in Fig. 3, it becomes obvious that the static and dynamic compressive yield strength of both steels are equivalent. With increasing strain the strength level of the CrMnNi-steel increases stronger for both strain rates. However, at elevated deformation degrees the stress–strain curves have a comparable slope shifted by a certain strain rate dependent amount of strength. Common for the two steel systems is the intersection of dynamic and static flow curves due to quasi-adiabatic heating, generated by the increased deformation velocity. Although there are small differences in the work-hardening behavior for low deformation degrees, it is assumed that the key results of the simulation concerning the identification of the cell profile with the highest SEA capability are transferable; exclusively the absolute values will differ.

Manufacturing of the honeycomb-like structures is realized by a powder metallurgical processing route connected with a cold extrusion process, which can be divided in three main steps. Initially, the steel powder is mixed together with additives and deionized water. In a second step, the received shapeable mass is pressed through a rigid die by a single-screw extruder. Finally, the extruded strands are cut into sample-near dimensions prior to debinding at 450°C for 30min in air and sintering at 1350°C for 2h in argon atmosphere. In preparation for mechanical testing, the specimens are machined at the front surfaces in order to ensure perpendicularity and a test height of 22mm for out-of-plane and in-plane compression tests.
The verification of simulation results requires a consistent cell wall material in order to get comparable mechanical properties and hence SEA values. For this reason, the so far investigated square-celled structure is repeatedly prepared out of the batch used for the new geometry according to the described process.
The compression tests are conducted at a servo-hydraulic testing machine of brand MTS equipped with a 250kN load cell and an extensometer, whereby a punch velocity of 0.022mm/s is adjusted inducing a static strain rate of 0.001s−1 in the samples. Static testing seems most suitable for evaluating the characteristics of structure behavior for different deformation stages. In following studies dynamic strain rates will be included in the experimental program, which were used in the simulation.
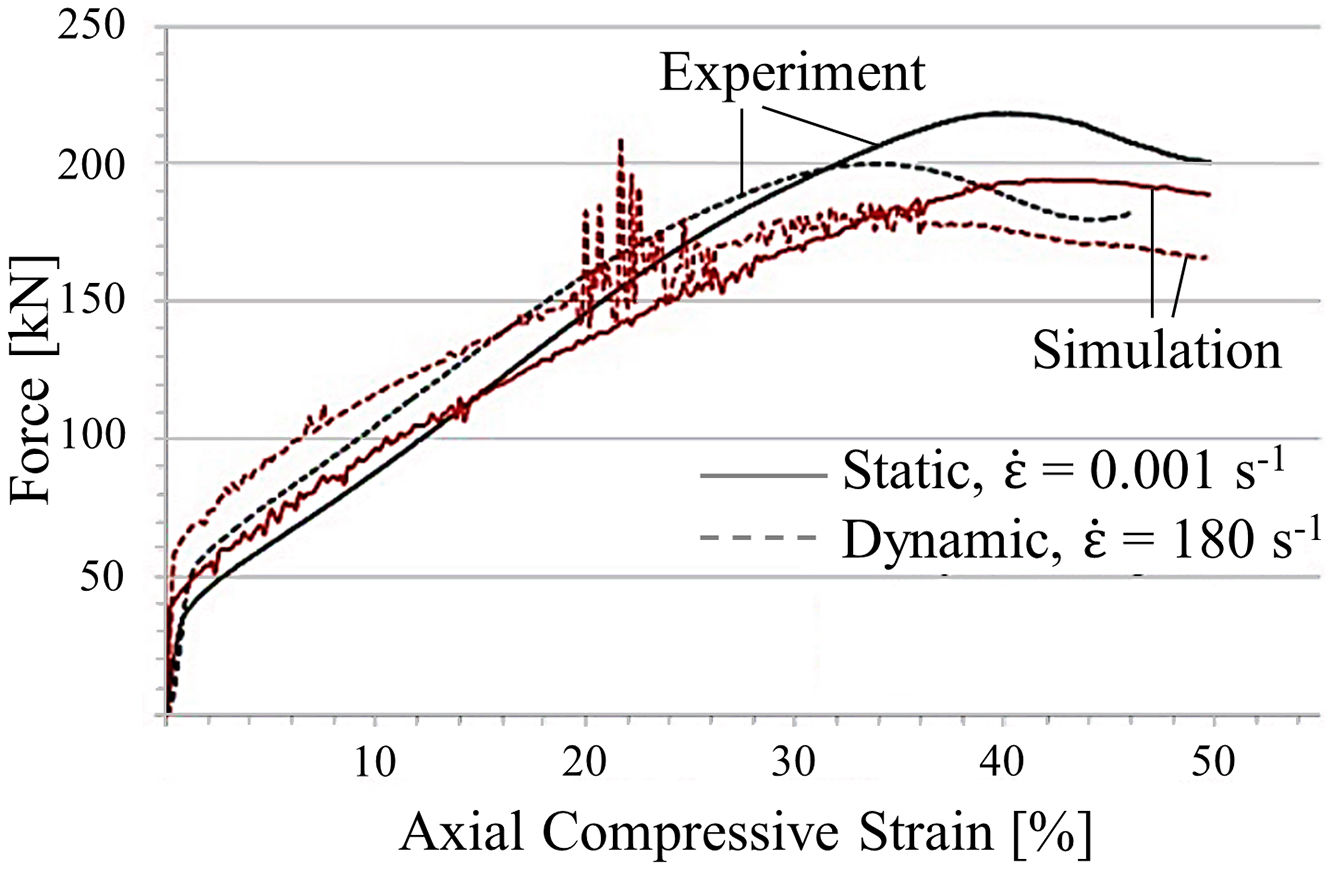
4Results and discussionIn the first instance, a model validation was conducted by comparing the simulation results of the square-celled structure with former experimentally determined data [4]. Fig. 4 demonstrates exemplary that the computed force–strain curves of static and dynamic out-of-plane compression tests reflect the general progression and the distinct pre-buckling stage very well. Nevertheless, yield strengths are slightly overestimated and the structure stiffness at higher deformation degrees is characterized by lower values. In case of in-plane compression, a good correlation of predicted and measured peak force initiating the structural collapse can be obtained even though the plateau stress is underestimated. Essentially, the model is able to properly describe the tendencies although the simplified assumption of an isothermal material model and the usage of an idealized geometry model without any defects leads to deviations between numerical and experimental results. However, a legitimation of model usage is given for the computation of structure identification providing the greatest SEA capability.

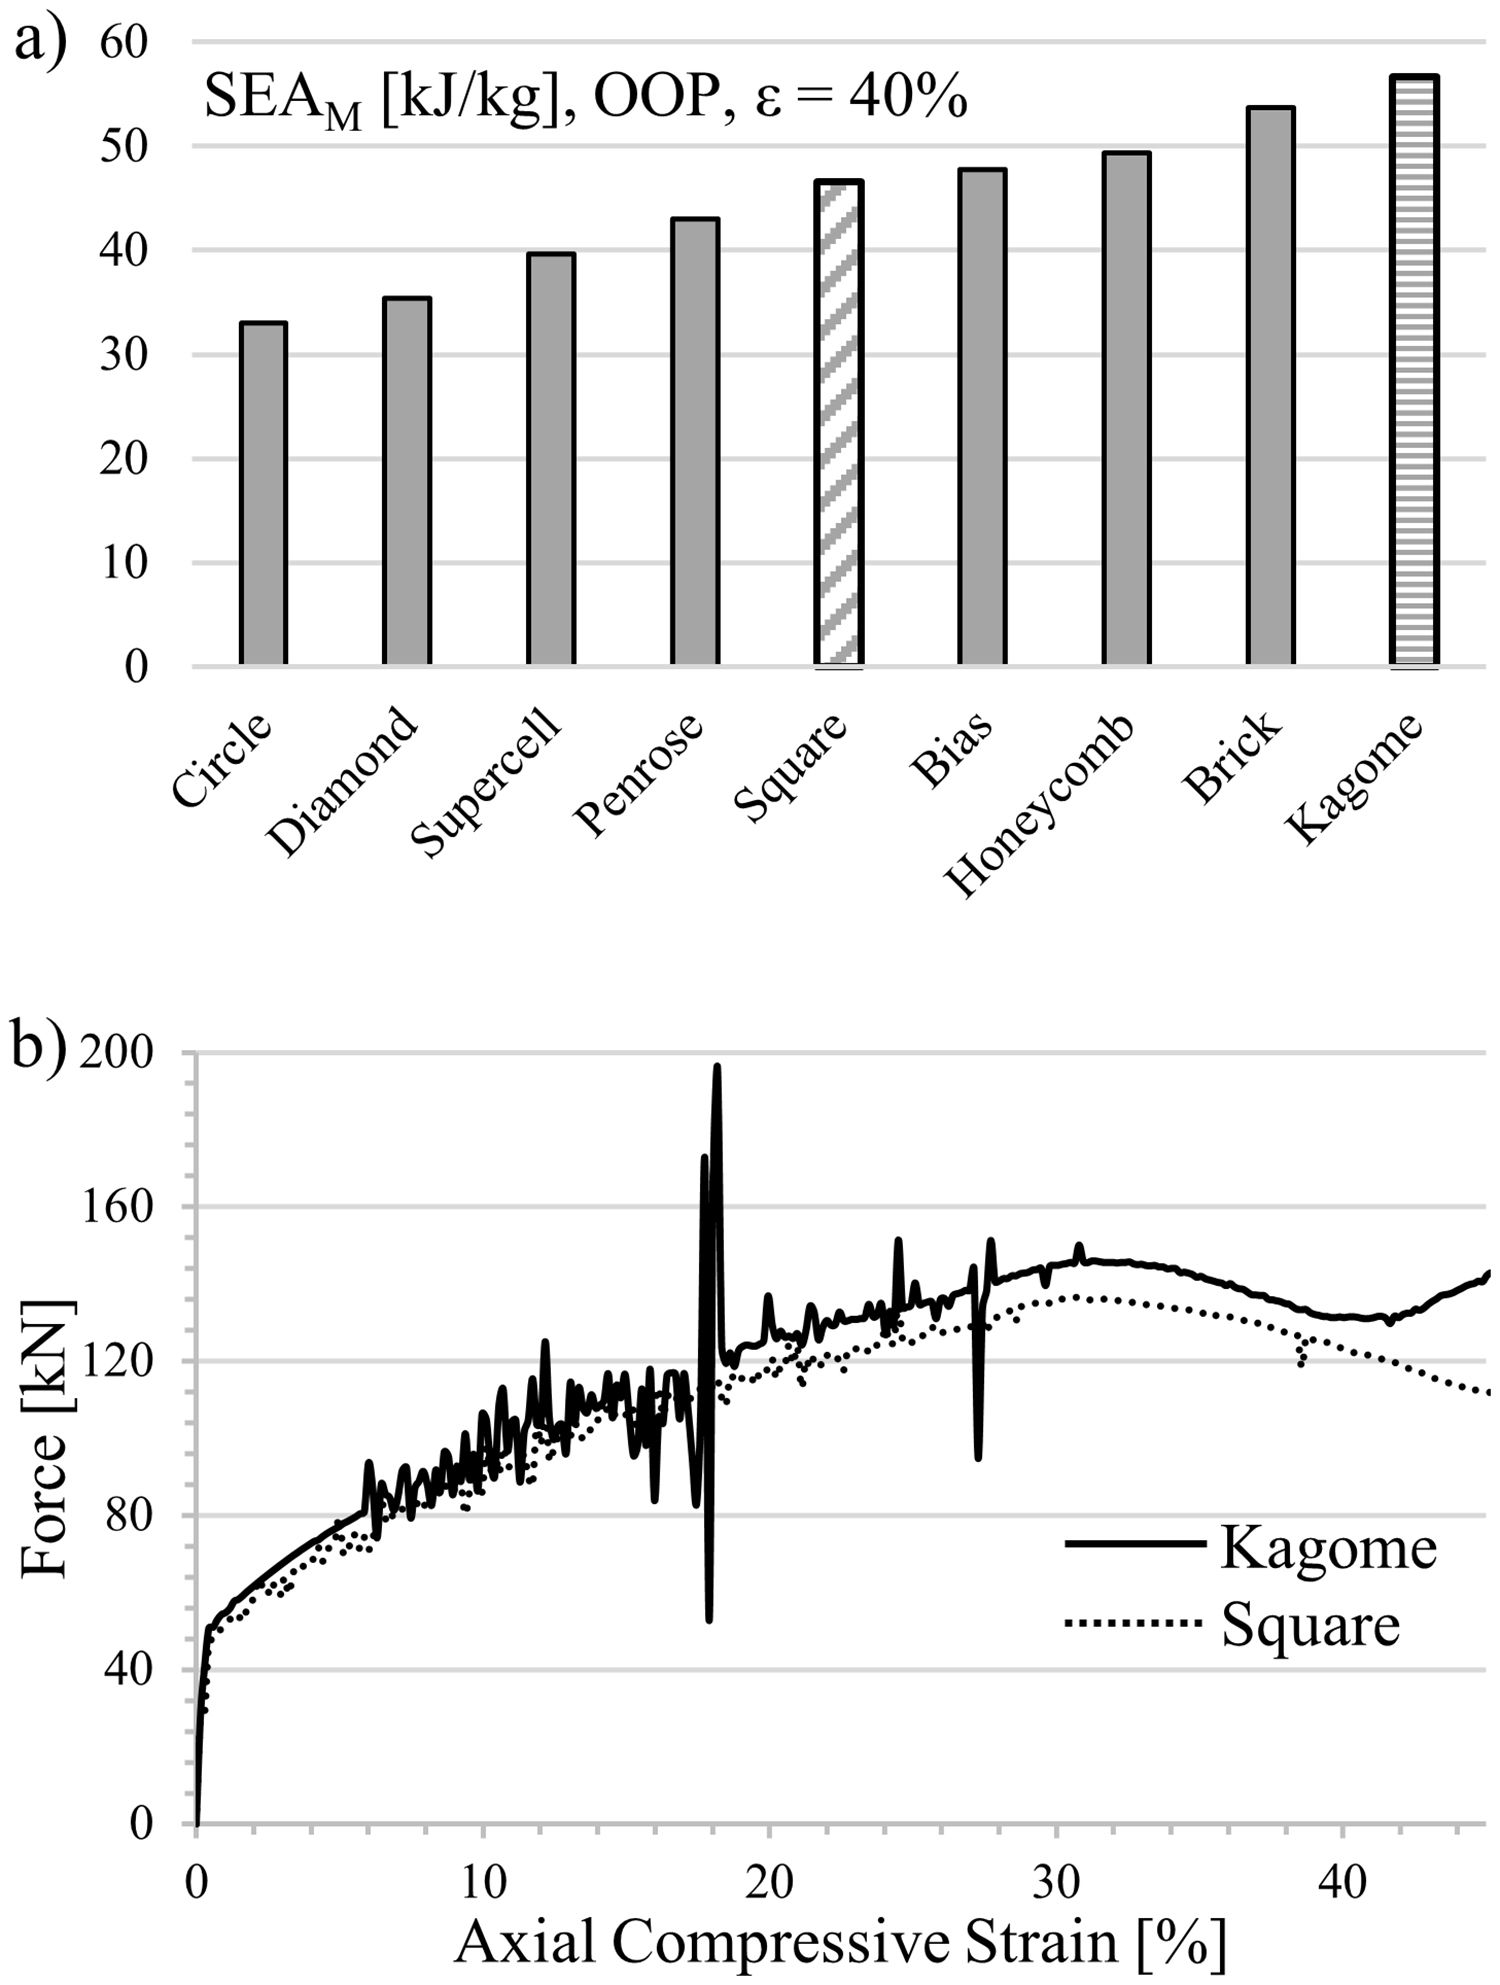
While applying the load parallel to the channel axis (X3), a 90°-rotation of the structures with axial anisotropy becomes redundant. Therefore, computation of force–strain curves is limited to the nine base profiles. The simulated curve progression of all structures exhibit the characteristic features previously found for the square-celled structure. Nevertheless, the strength level of the various profiles differs, which is reflected in the achieved SEA capability, cf. Fig. 5a.
 mass-specific energy absorption capability of considered cell profiles and (b) force–strain curve of Kagome and square-celled profiles.")
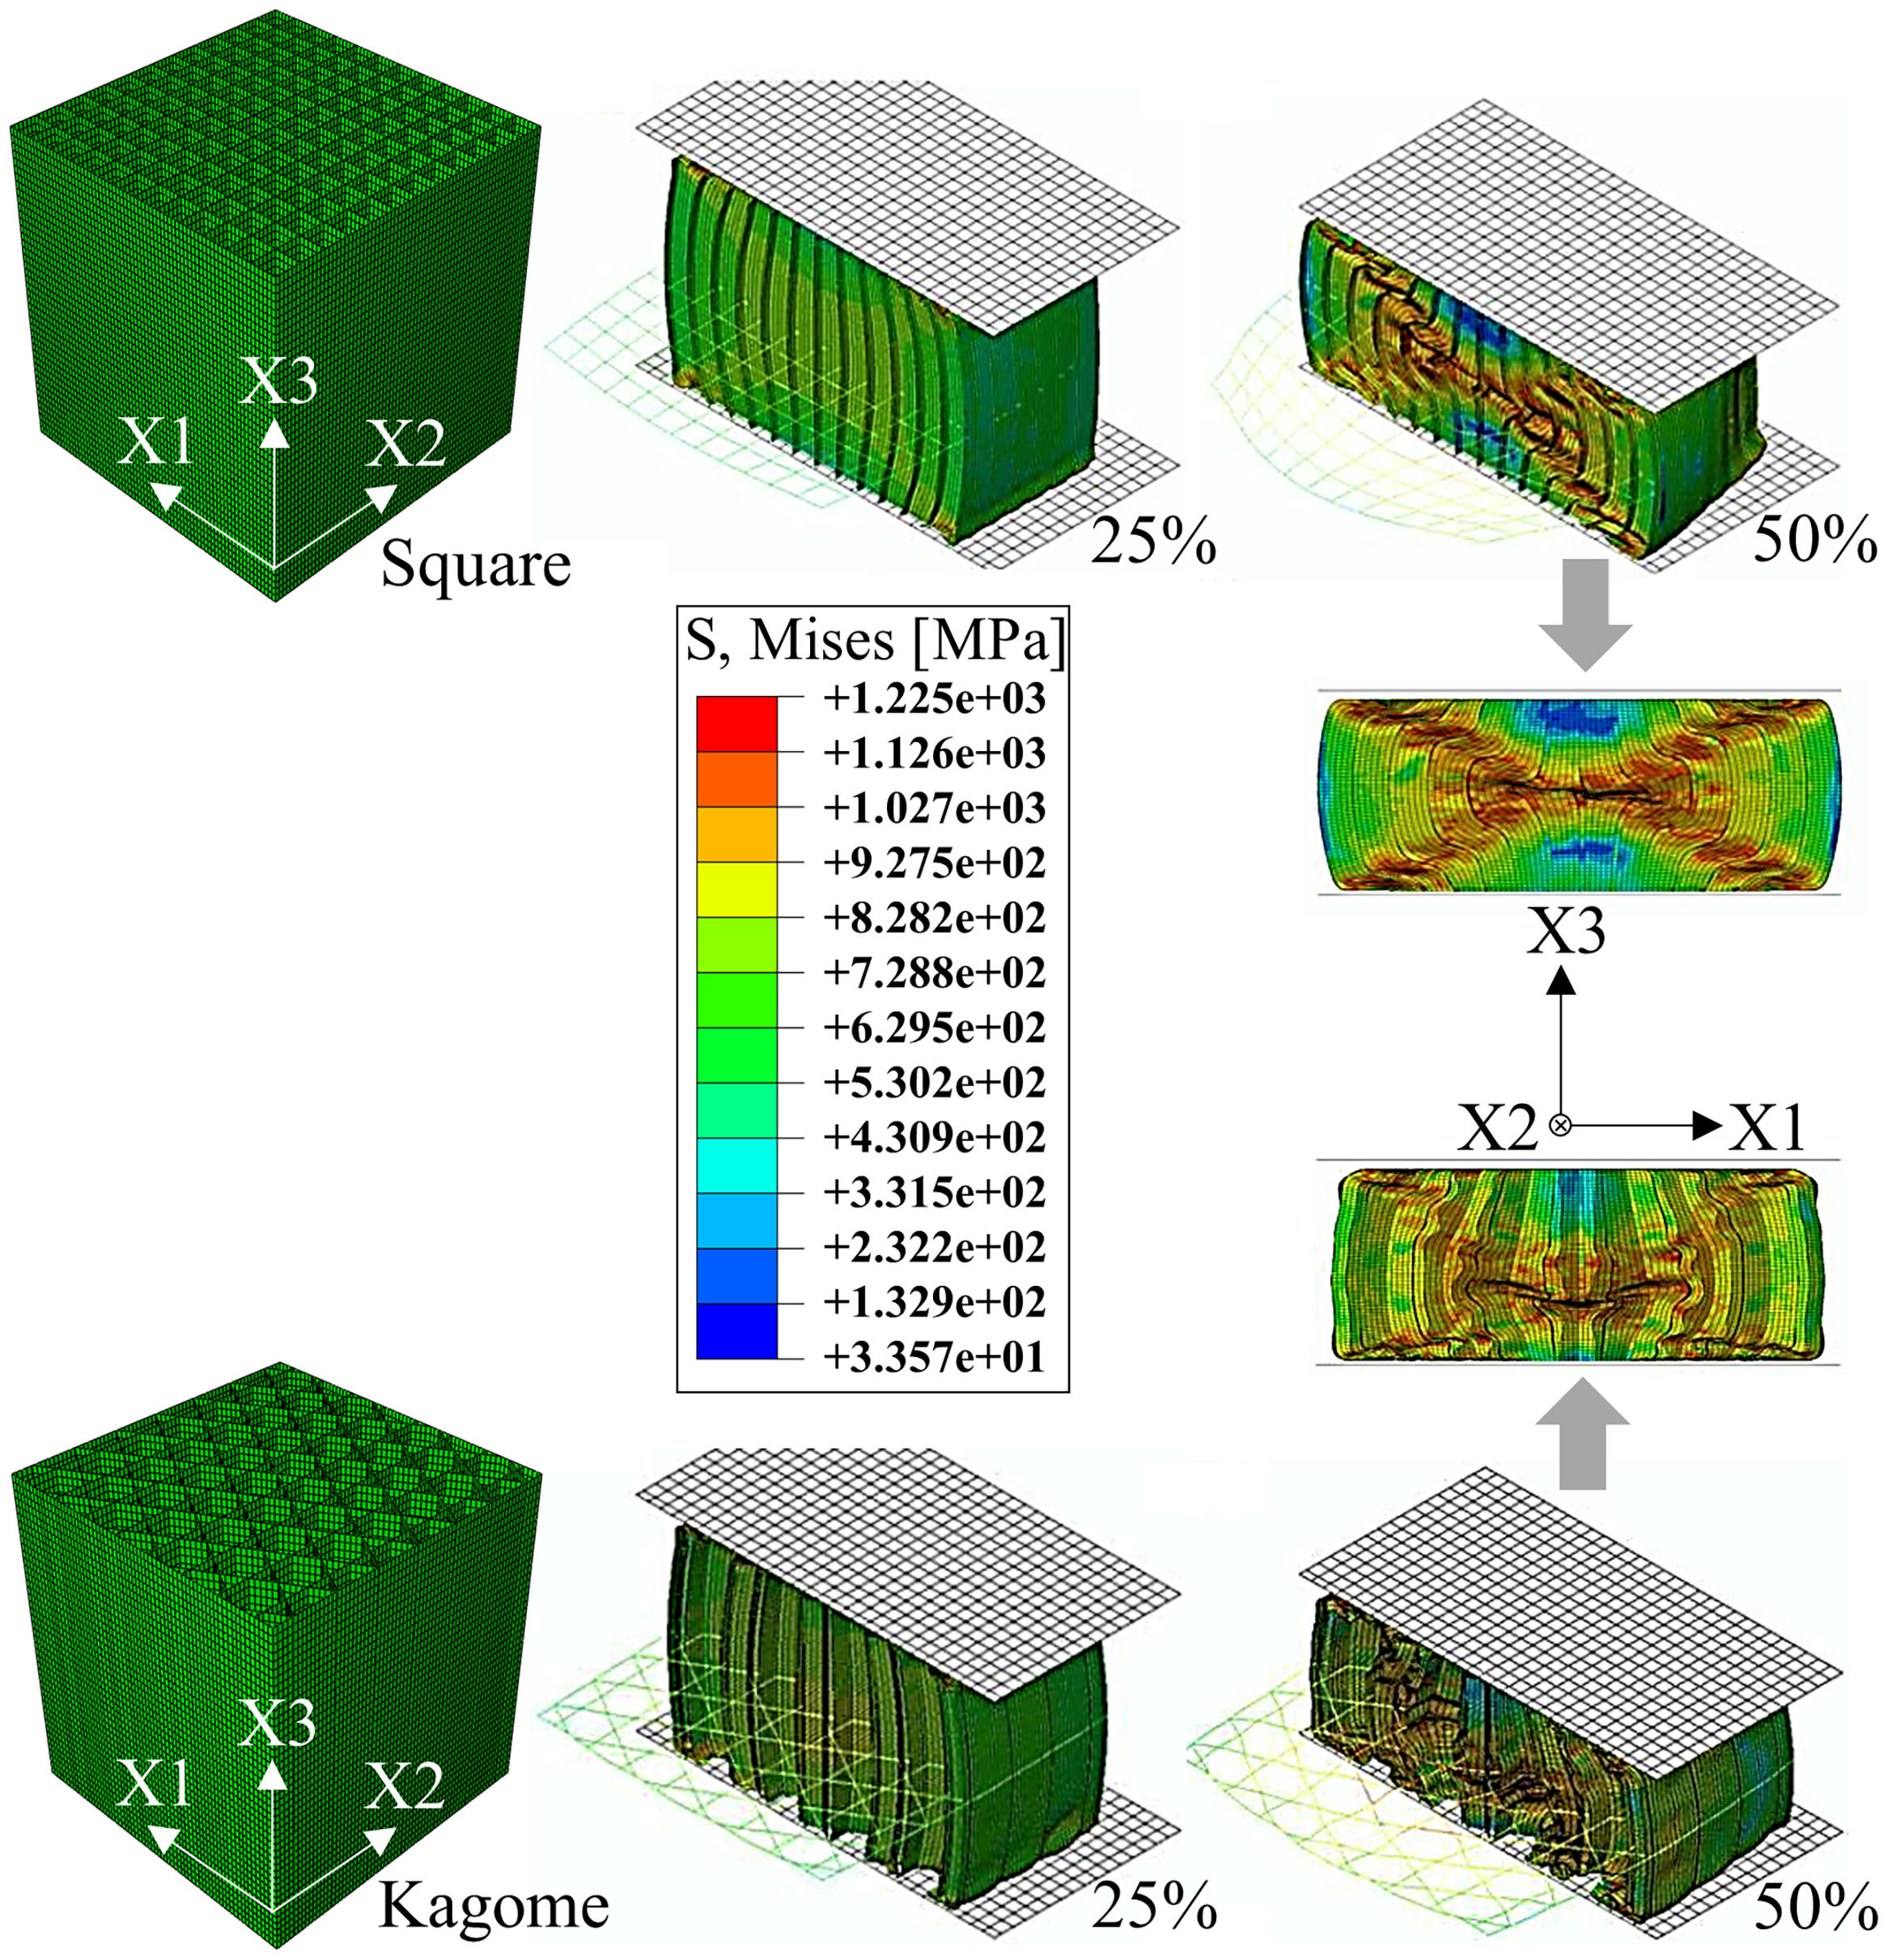
Significant reasons are the different failure mechanisms. The profiles with a low SEA-value exhibit a local or torsional, multiple cell wall buckling starting at the front surfaces, whereas the high energy absorbing profiles deform mainly by a one-time global fold of cell walls in terms of a plastic “Euler buckling” along the X3-axis. According to this, a localized plastic deformation, running cross-shaped from the outer cell walls into the middle of the samples, is recordable. Cell walls in the center of the honeycomb are restricted to deform. Consequently, the axial orientation remains and mostly homogenous axial strains are applied resulting in a cell wall failure at elevated deformation degrees. Starting from the high stressed honeycomb center (Fig. 6), the cells are pressed to the outer sides and deform consequently in the X1–X2-plane. However, profiles with a strong anisotropy exhibit an irregular buckling like in the case of the Diamond geometry. An exception of all investigated structures represents the Kagome geometry by deformation in local folds and the formation of a cross-shaped stress concentration (Fig. 6), which constitutes a superposition of both previously described mechanisms. Further analytic modeling and theoretical investigations are necessary to identify the profile properties leading to a global or local cell wall buckling.

Finally, the key result of the simulations is the finding that the Kagome structure provides the highest SEA capability. The increase amounts to 22% in comparison to the honeycomb structure with square cells. A die was manufactured according to the computed geometry and applied to the extrusion process to verify the results experimentally. During the first extrusion experiments it emerged that the cell wall thickness of .286μm, causing a relative density of approx. 0.3, was not wide enough to provide a sufficient stability of the Kagome structure while encountering the conveyor belt from the outlet of the extruder. As a result, the structures revealed an altered aspect ratio and wavy cell walls at the bottom of the geometry. In order to provide a higher stability of the extruded material, the wall thickness was enhanced to 400μm. Hence, the relative density increased up to the level of the former investigated square-celled honeycomb structures with 14×14 cells.
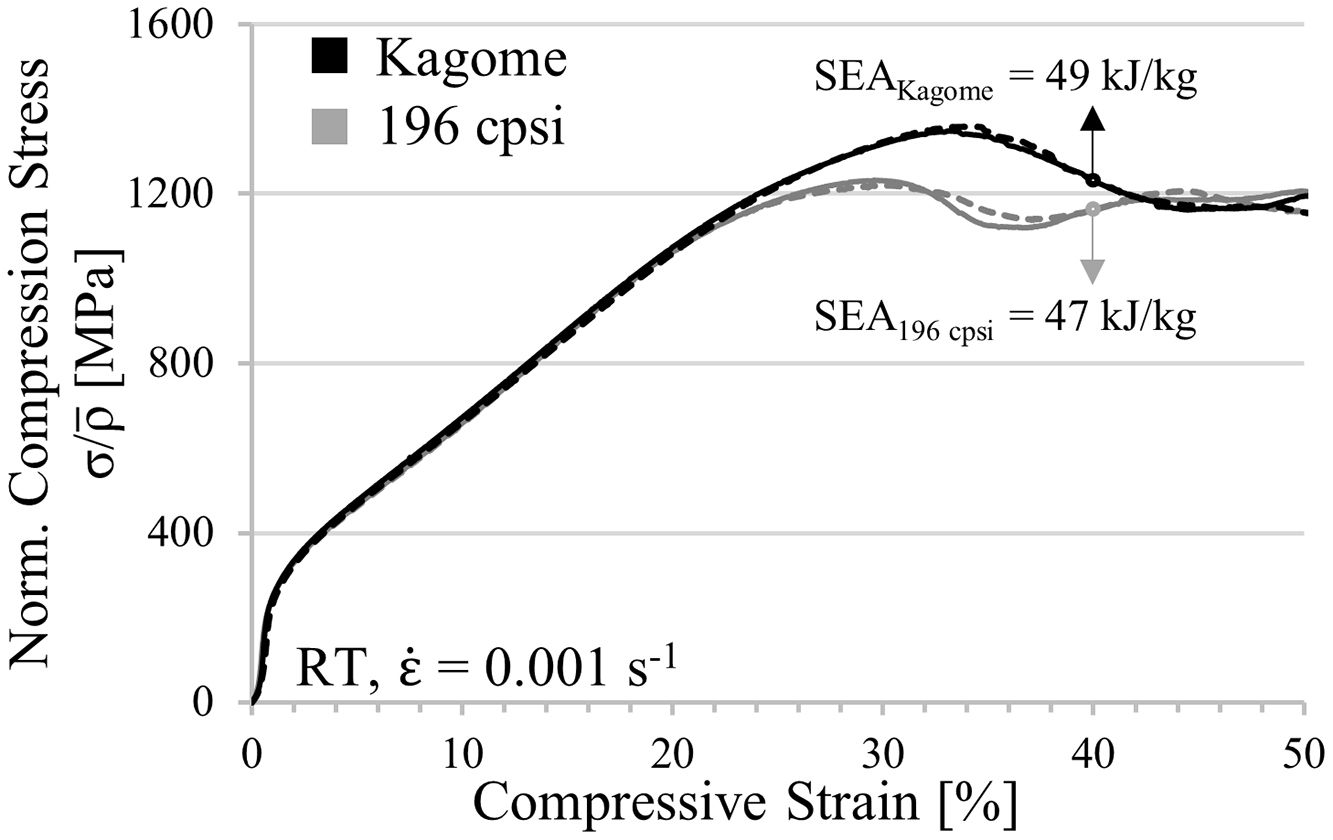
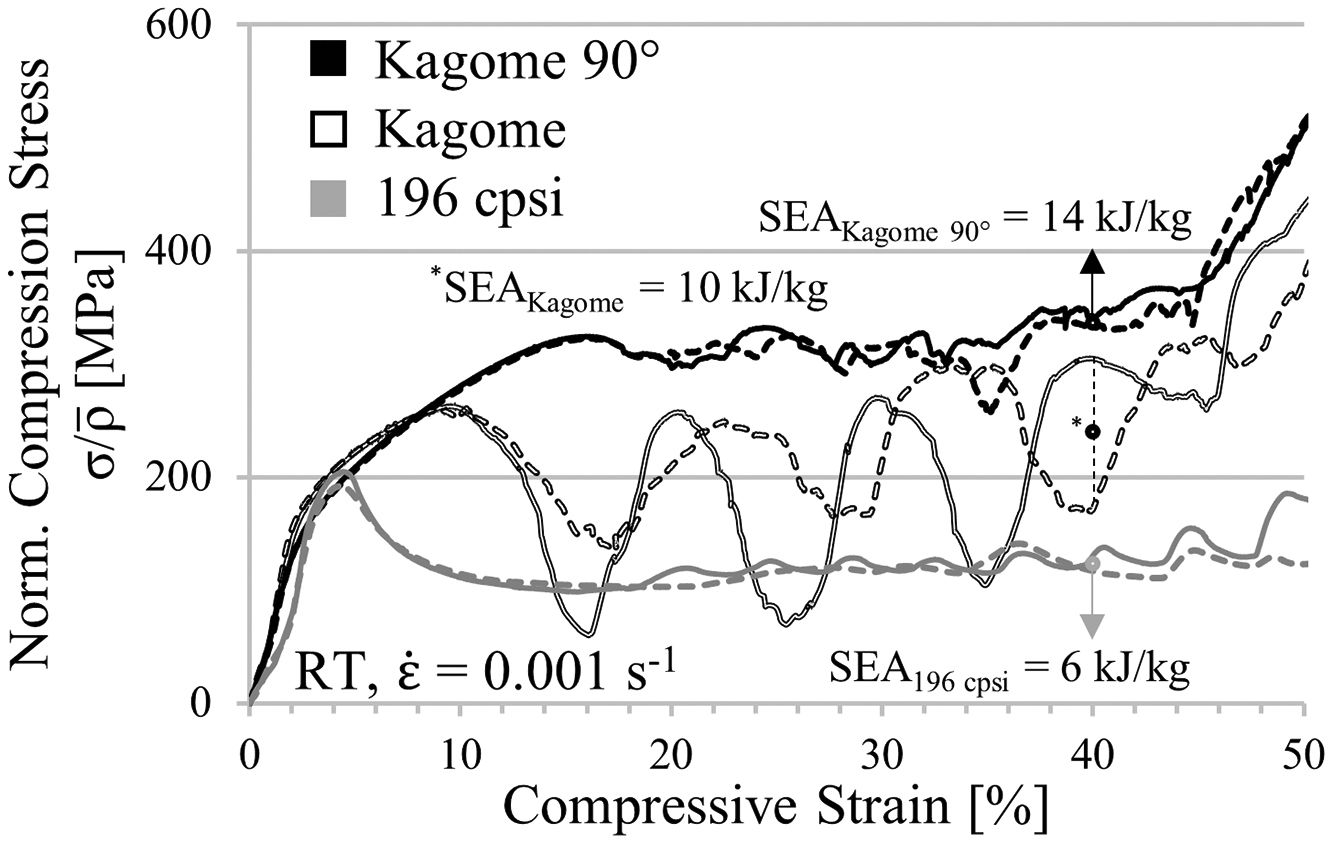
Fig. 7 contains the static stress–strain curves normalized to the relative density of both geometries. For each condition two samples are tested, which is represented by a solid and a dashed line in the diagram, in order to prove the reproducibility of measurement results. As it can be seen by comparative analysis of curve progression, the linear-elastic region and the pre-buckling stage at low strains are unaffected by the cell design. However, bifurcation and structural collapse initiates at lower deformation stages and is triggered by lower stresses in the square-celled honeycomb structure. The simulation (Fig. 5b) reveals a higher collapse strength for the Kagome structure equally, although the strength levels of both structures are slightly shifted already by overcoming the compressive yield strength. Nevertheless, the deviation increases with increasing strain. An oscillation of force signal apparent in the simulated curves is not detectable experimentally. It is assumed that dynamic effects such as vibration phenomena, natural frequencies or numerical issues, which concern the contact definitions, lead to the oscillation behavior. Regarding the SEA capability, the tendency of the simulation gets confirmed by the experiments. At 40% engineering strain an increase of 2kJ/kg is achievable.
4.2In-plane compression
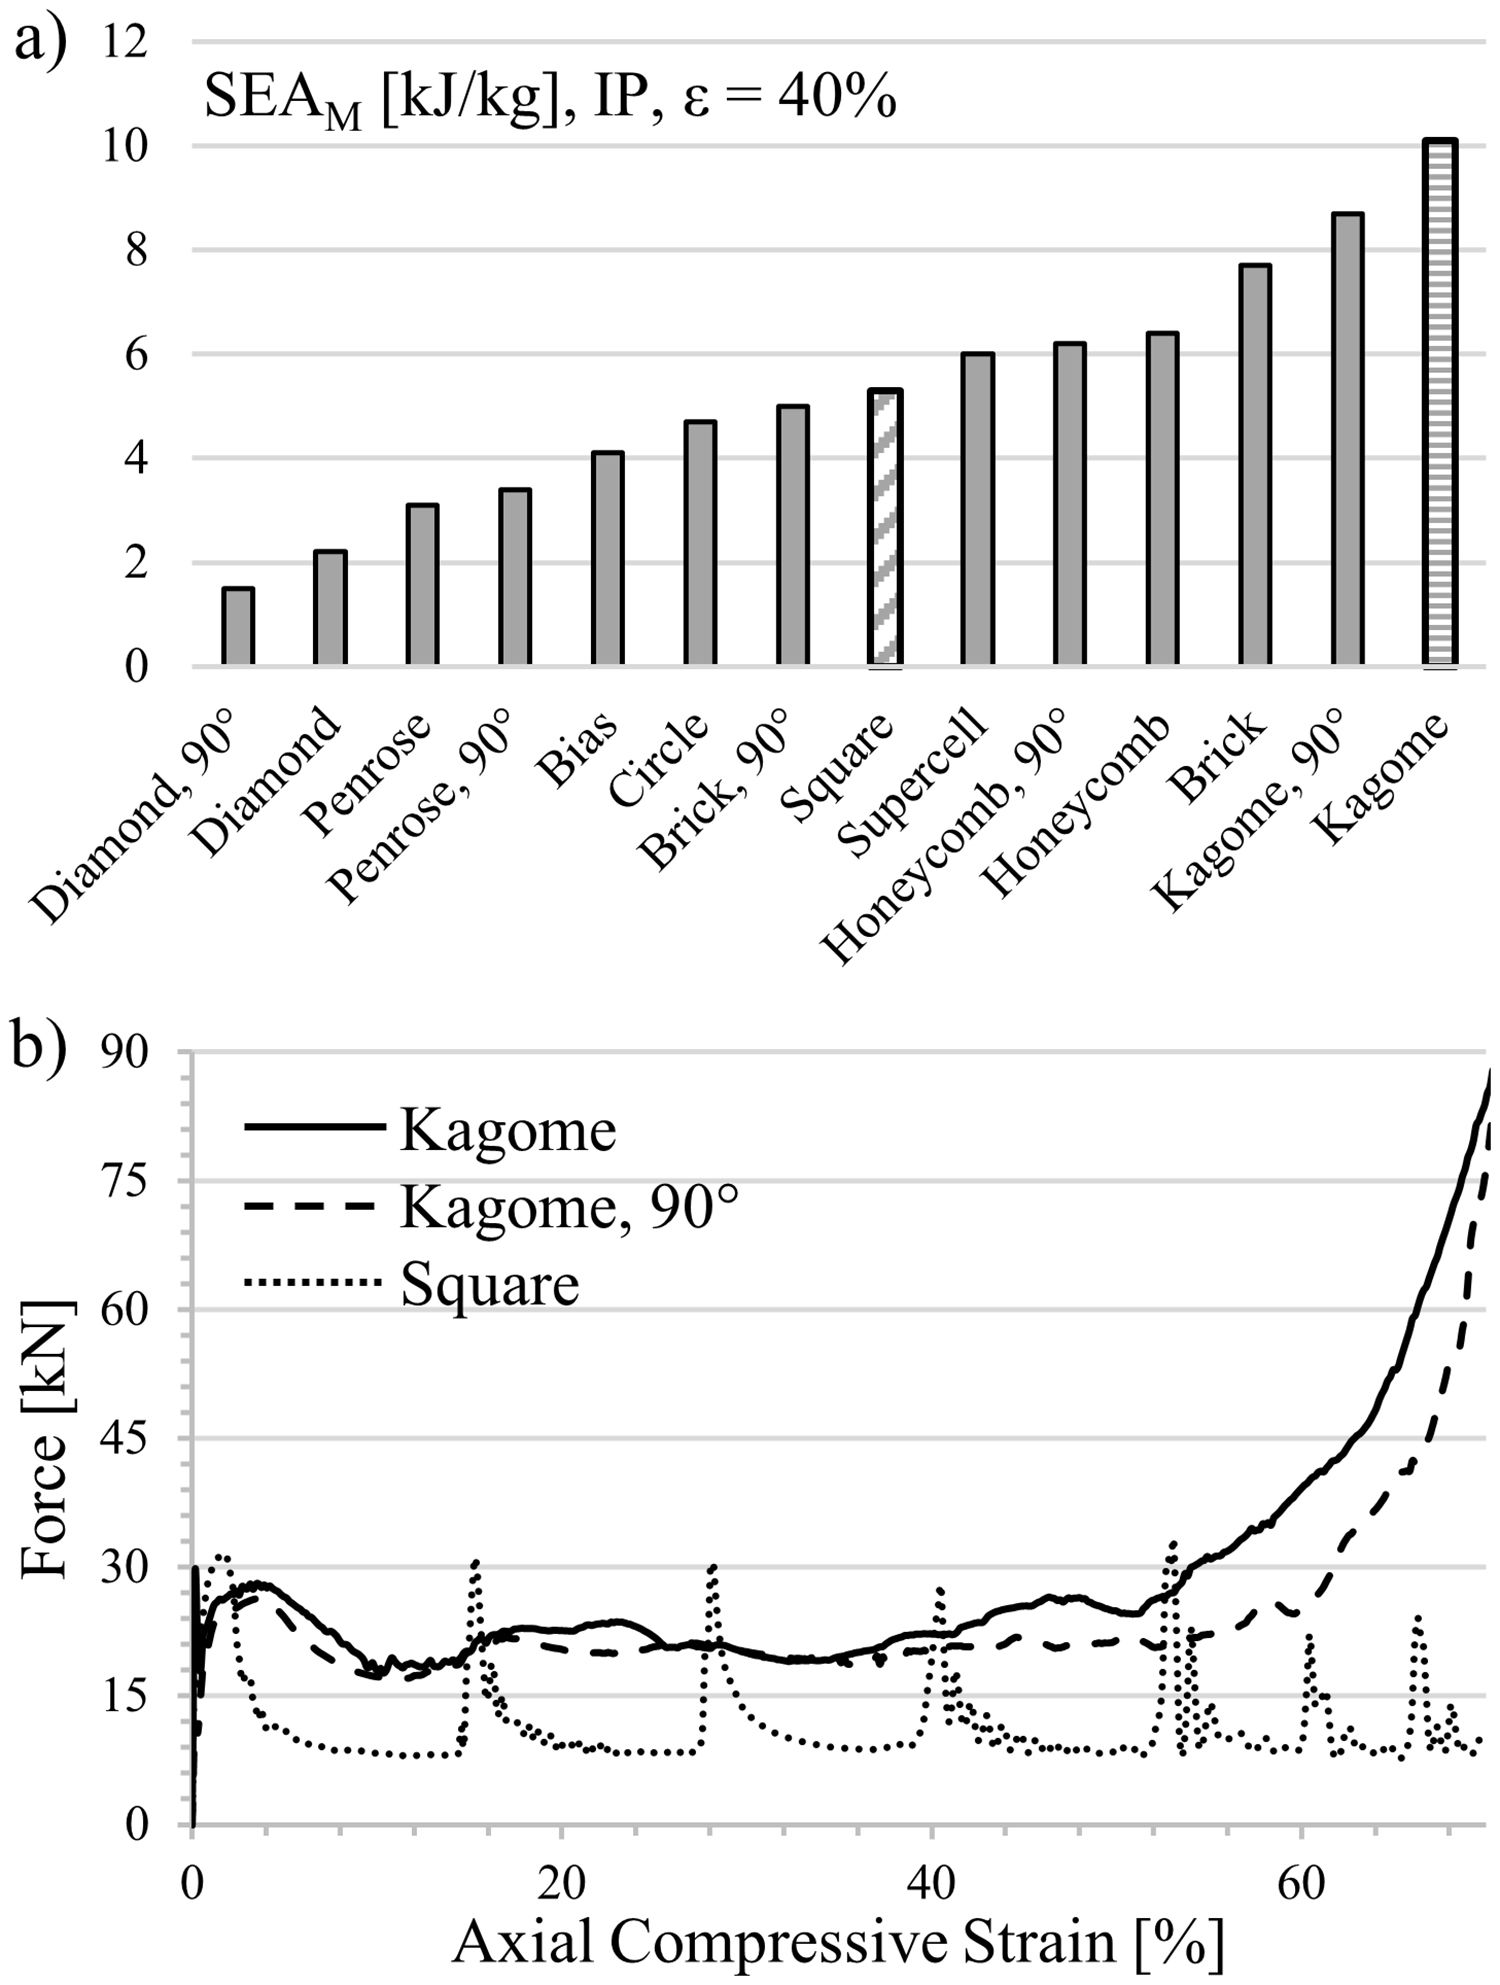
The strong geometrical anisotropy of five cell profiles requires a 90°-rotation in in-plane mode, which results in a distinction in 14 structure variants. In contrast to the so far investigated square-celled structure, some of the computed profiles exhibit no distinct peak stress initiating structural failure. Representatives of this group are the low energy-absorbing structures (Fig. 8a) Diamond 90°, Penrose and Circle. In addition, the simulation indicates for profiles such as Diamond 90°, Square or Bias no densification up to deformation degrees of 75%. Responsible for the lower strength level in in-plane direction is the constraint of plastic deformation in the X1–X2-plane. Contrary, in out-of-plane mode the applied force affects all three spatial directions as described in the last paragraph.
 mass-specific energy absorption capability of considered cell profiles and (b) force–strain curve of Kagome, Kagome 90° and square-celled profiles.")
The computed results reveal that the Kagome profile incorporates the highest forces as well in in-plane load direction and consequently dissipates the highest energy by plastic deformation of all considered cell geometries. Thereby, the assumption derived from literature, that structures like the Kagome geometry with stretch-dominated deformation mechanism are superior to bending occupied structures, could be partially confirmed [7,8].
Fig. 8a displays an increment of energy absorption capability between Kagome and the square-celled structure of 91%. Even the Kagome 90° orientation leads to an increase of 64%, which is still higher as compared to the increment in out-of-plane mode.
In contrast to the square-celled honeycomb structure, both Kagome profiles exhibit a distinct work hardening behavior following the linear elastic region, as experimentally demonstrated in Fig. 9 for two samples per condition (solid and dashed line). Subsequently to structural collapse, the average plateau strength proceeds on a higher level, which means that at engineering strains of 40% an improved SEA capability is measureable for both orientations. In case of the Kagome direction, it increases about 67% whereas in Kagome 90° orientation even 133% are measurable.

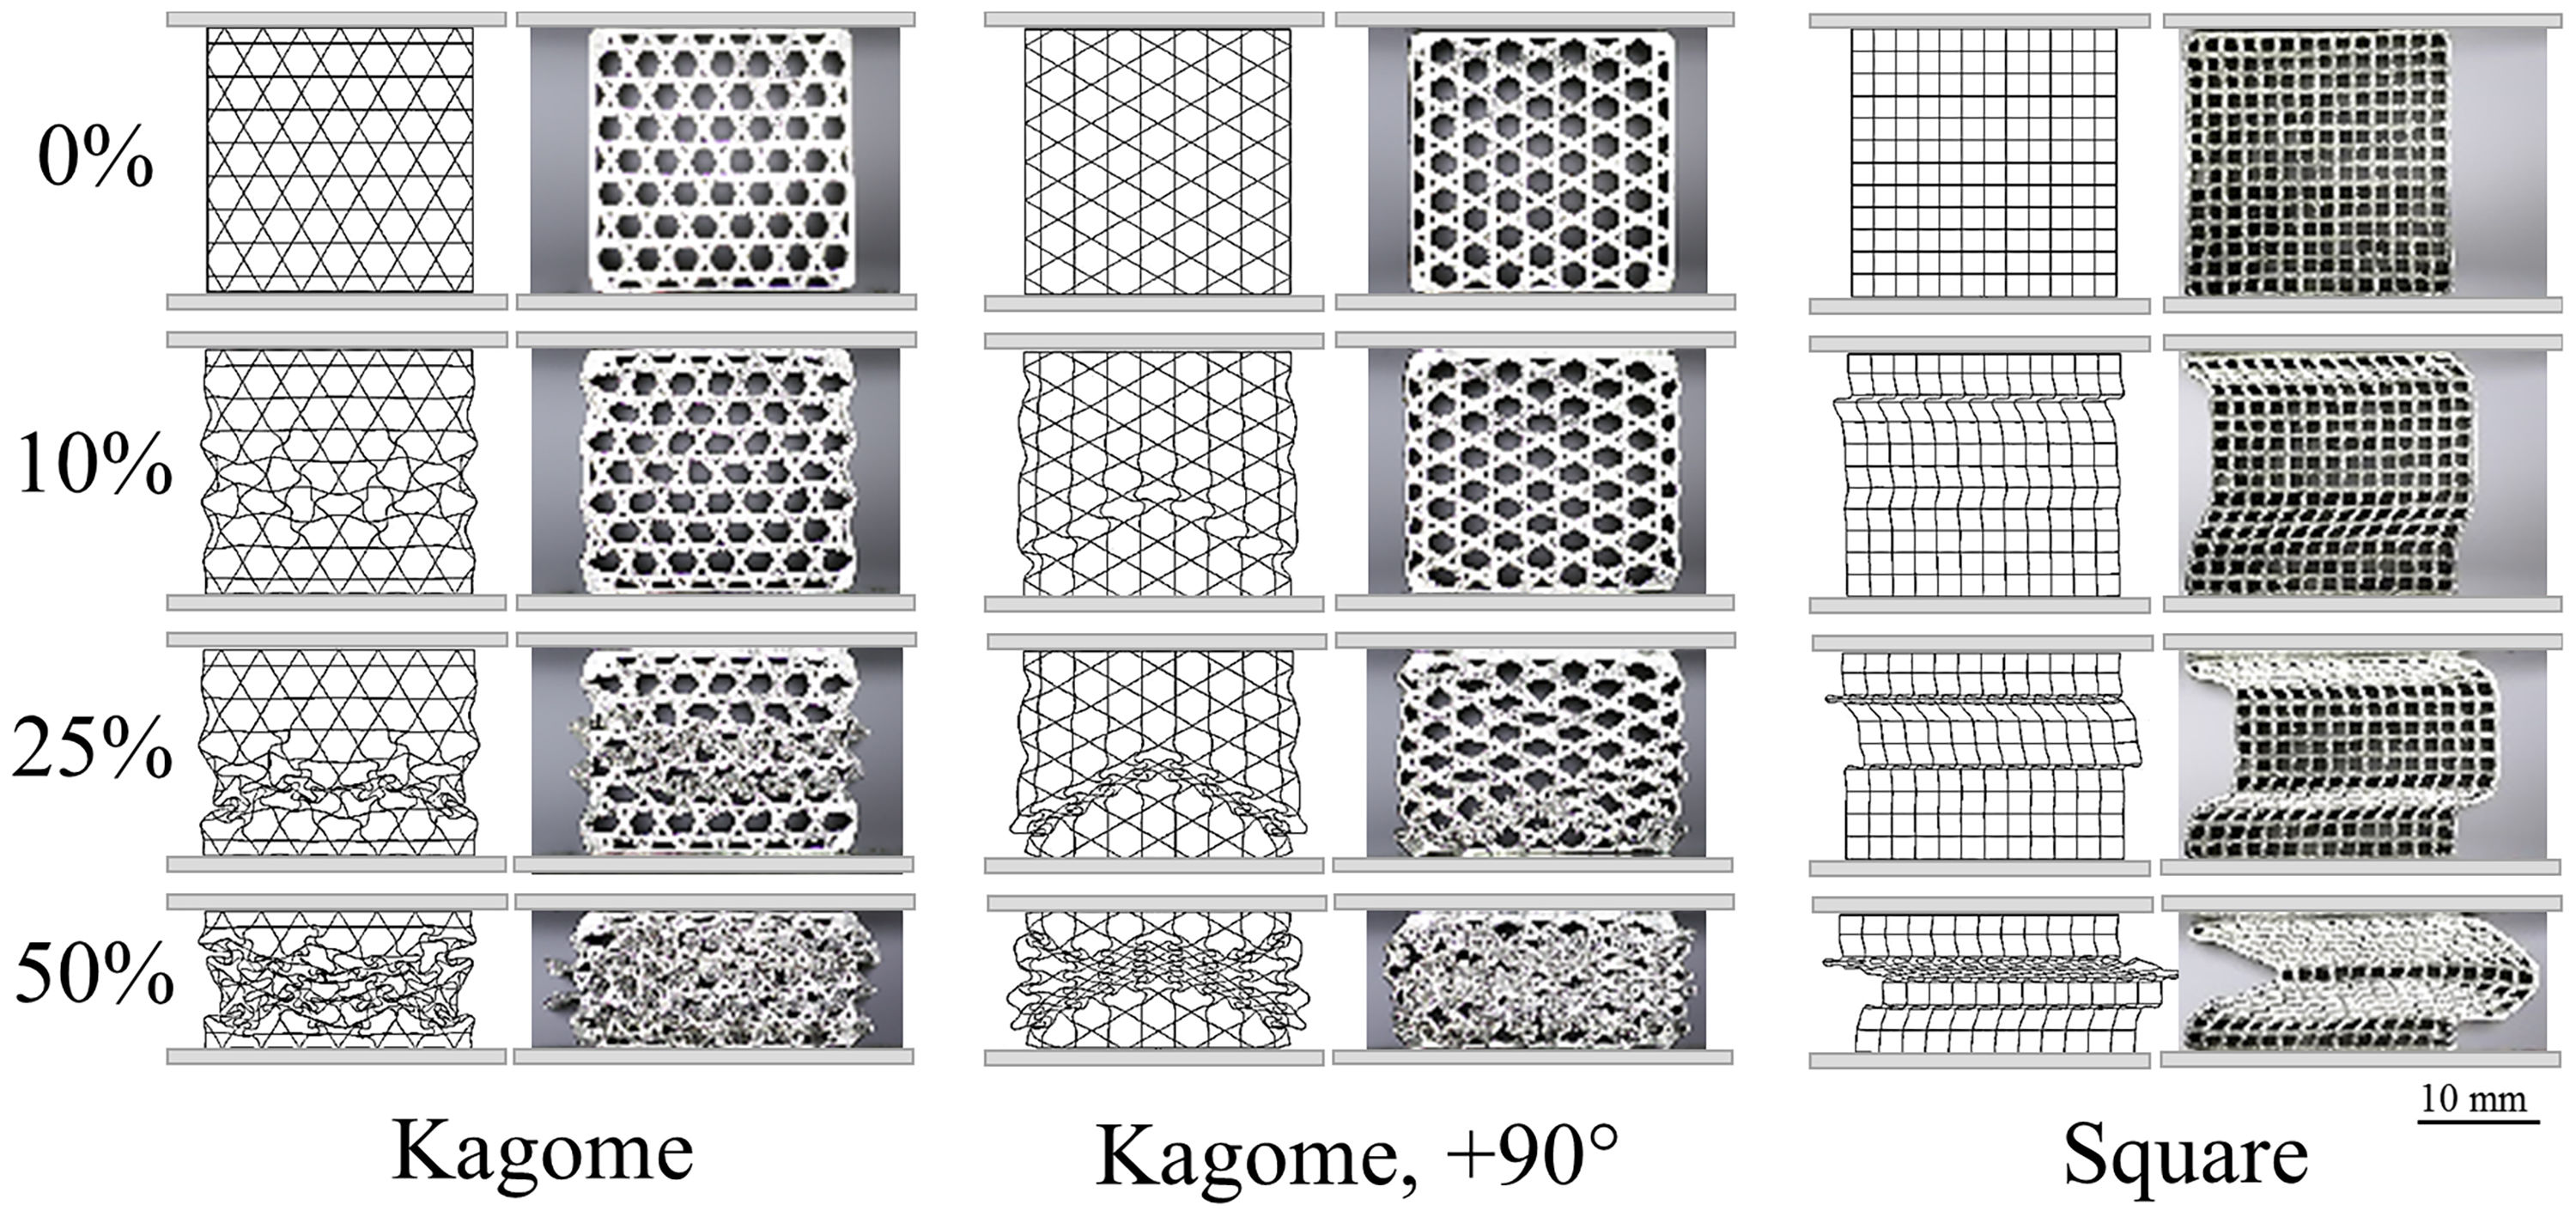
These results reflect a difference regarding the FEM-analysis. Contrary to the static compression test, the simulated strength of the Kagome 90° orientation is lower as compared to the Kagome alignment. In addition, the extent of work hardening region and the marked oscillations of plateau strength, recorded for Kagome direction, are not well described. Nevertheless, the deformation patterns are in excellent accordance with the simulation. In Kagome direction, first buckling is initiated in the cell walls angled to the load direction, followed by cell wall rotation around the nodes. In contrast, the vertical struts of the Kagome 90° orientation buckle in a triangular deformation band, which combines for higher deformation degrees with an upper deformation band. Common for both alignments is the symmetric folding, which differs significantly to the asymmetrical shear found in the square-celled structure (Fig. 10).

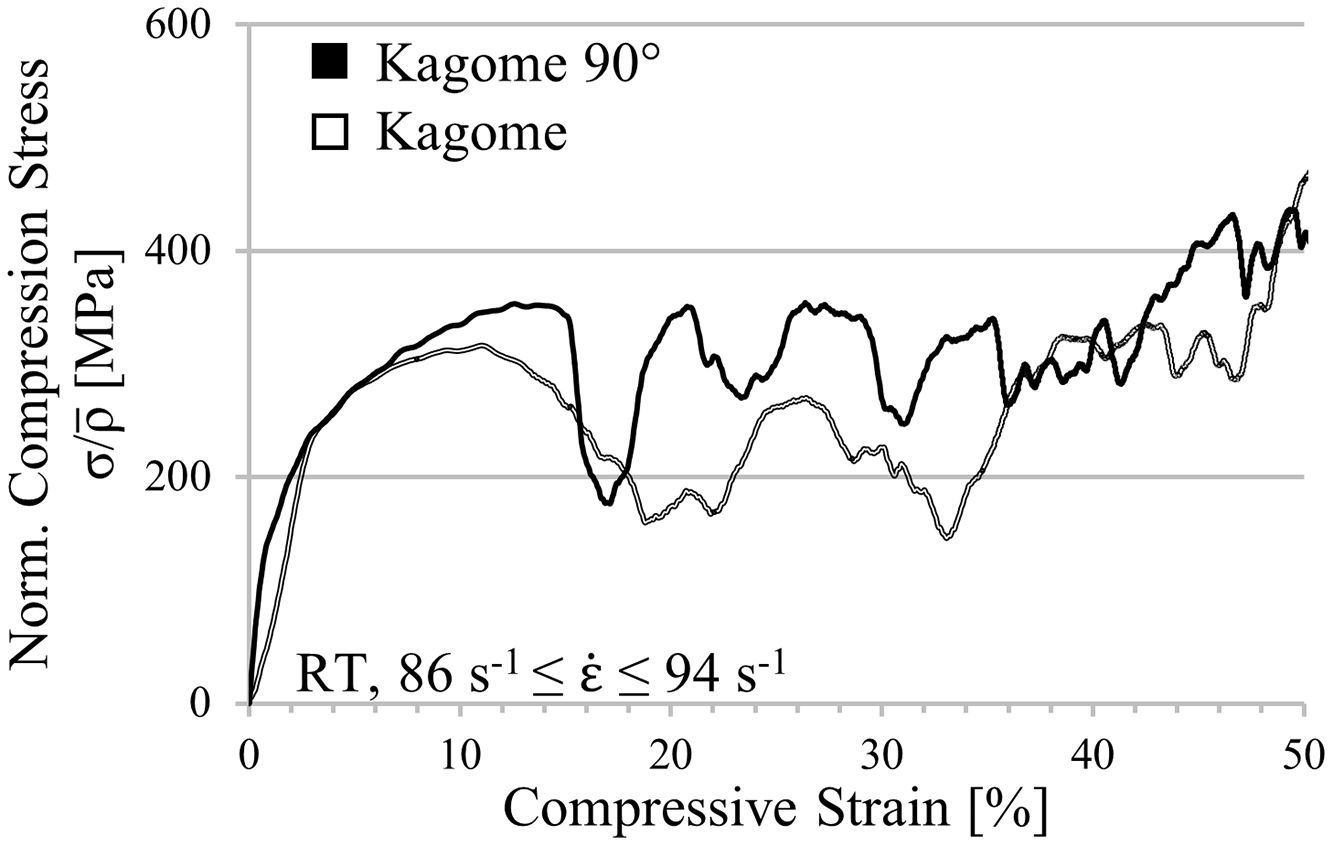
In order to exclude strain rate effects, which may be responsible for differences between simulation and experiment, a drop weight tower with a weight of approx. 190kg and a height of 350mm is used to record dynamic stress–strain curves for Kagome and Kagome 90° orientation, exclusively. As it can be seen in Fig. 11, the absolute strength difference decreases. However, Kagome 90° is still superior as compared to Kagome. Besides, the stress oscillation increases for Kagome 90° and is still recordable in Kagome direction. A potential reason for the detected deviations between experiment and simulation represents the increase of cell wall thickness resulting from the difficulties during the extrusion process (cf. Section 4.1). In further computations an adjustment should be conducted in order to verify this aspect.
5Conclusions
This study comprises the numerical and experimental investigation of honeycomb structures with varying cell topologies in order to identify the geometry with the highest energy absorption capability compressed in out-of-plane and in-plane direction. Therefore an isotropic, strain rate dependent and isothermal material model is developed based on true stress–strain curves, which were obtained on compact material out of austenitic stainless steel 1.4301. Input scripts containing structure models of the 14 investigated honeycombs are generated in a semi-automatic C++ routine in order to compute the mechanical behavior by the use of an explicit solver and 4 node shell elements in ABAQUS. Although the conducted model validation exhibits small deviations between simulation and experimental data of square-celled honeycomb structures, a legitimation of model usage to accurately describe the tendencies of out-of-plane and in-plane SEA capacity is given. A newly developed CrMnNi-steel serves as feedstock for manufacturing honeycombs with square and optimized cells, deviating from the material model used for numerical analysis. It is proven by means of static and dynamic flow curves that differences in the strain hardening behavior exist at low deformation degrees; however, key results and tendencies of the simulation should be transferable.
The numerical analysis revealed an increased strength and hence SEA capacity for the Kagome profile as compared to the so far investigated square-celled structure under both considered load directions. In out-of-plane mode the advantage is relatively low as confirmed by the experiments. However, in in-plane direction the static compression test revealed an even higher SEA capacity than predicted by the simulation. In particular the Kagome 90° orientation provides an increase of 133% while in Kagome direction 67% are measurable. This result implies a difference as compared to the simulation determining the Kagome direction as the superior structure variant. Dynamic drop weight tower tests deliver the same tendencies, which were conducted to exclude strain rate effects.
In following studies the influence of cell wall thickness should be investigated since this parameter was increased due to difficulties in green body stability during the extrusion process. Besides, microstructure imperfections could lead to the differences in numerical and experimental analysis. Additionally, an interesting aspect of investigation is the impact of structure geometry on the TRIP-effect occurrence in the cell wall material at static and dynamic strain rates.
The authors thank the German Research Foundation (DFG) for its financial support of the subproject B2 I “Experimental and model-based characterization of strength, deformation and damage behavior of optimized TRIP-steel modifications and TRIP-Matrix-Composites” as part of the “TRIP-Matrix-Composite” Collaborative Research Center (CRC 799) in which the presented results were obtained.
