


This study aimed to determine the fetal philtrum length at early stages of gestation and perceive its growth through different gestational ages in case of normal and pathological fetal development.
MethodsThis cross-sectional observational study was conducted based on ultrasound images obtained at an institutional centre specialised in Prenatal Diagnosis. A total of 108 fetuses between 10 and 26 weeks of gestation were included, of which 90 corresponded to normal pregnancies and 18 to pregnancies diagnosed with fetal pathology. The fetal philtrum study was performed by ultrasound during a routine evaluation for each fetus. Fetal philtrum length was measured by ultrasonography, based on a mid-sagittal plane from the posterior border of the columella to the top of the upper lip. Data analysis was conducted through predictive models.
ResultsThe best regression model for predicting the philtrum length between the 10th and 26th gestational weeks was the linear one (without constant). This model, defined by the equation yˆ=0.294×(R2=0.970,p=0.001), represents a 0.294mm increase of the philtrum length per week of gestation. No statistically significant differences were found in the mean value of the philtrum length, either in the presence or absence of fetal pathology.
ConclusionsThis study provides additional data about the growth pattern of the philtrum in early stages of gestation and offers a simpler way to identify alterations in the philtrum length. However, more studies with larger samples are needed to understand better the relationship between philtrum anomalies and craniofacial abnormalities in order to obtain a more accurate prenatal diagnosis.
Determinar o comprimento do filtro labial fetal em idades gestacionais precoces e compreender o seu crescimento ao longo da gestação em casos de desenvolvimento fetal normal e patológico.
MétodosEste estudo, observacional transversal, foi desenvolvido com base em imagens ultrassonográficas obtidas num centro institucional especializado em diagnóstico pré-natal. Um total de 108 fetos foram incluídos, entre a 10a e a 26a semana de gestação, dos quais 90 corresponderam a gestações normais e 18 a gestações patológicas. O estudo do filtro fetal foi realizado durante um exame ultrassonográfico de rotina para cada caso. O comprimento do filtro fetal foi medido num plano sagital médio ecográfico do bordo posterior da columela ao topo do lábio superior. A análise dos dados foi realizada através de modelos preditivos.
ResultadosO melhor modelo de regressão para prever o comprimento do filtro, entre a 10a e a 26a semana de gestação foi o linear (sem constante). Este modelo, definido pela equação yˆ=0.294×(R2=0.970,p=0.001), representa um aumento de 0,294mm no comprimento do filtro por semana de gestação. Não foram detetadas diferenças estatisticamente significativas no valor médio do comprimento do filtro, tanto na presença ou ausência de patologia fetal.
ConclusõesEste estudo fornece dados adicionais sobre o padrão de crescimento do filtro fetal em idades gestacionais precoces e oferece uma forma simples de identificar alterações no comprimento do mesmo. Contudo, tornam-se necessários mais estudos com amostras maiores para uma melhor compreensão da relação entre as anomalias do filtro e as anomalias craniofaciais de forma a permitir um diagnóstico pré-natal mais preciso.
Facial anomalies can occur isolated or associated with chromosomal anomalies or syndromes related to a disproportionate growth of fetal facial features.1,2 The most reported defects include an atypical profile, orbital dysplasia, low-set ears, hyper- or hypotelorism, retrognathia, and micrognathia.2,3 Since some of these defects can be prenatally diagnosed, the ultrasonographic study of the fetal face has become relevant to routine prenatal screening,3 especially in high-risk pregnancies.4 Although the ultrasonographic study can also be based on three-dimensional (3D) ultrasound images, two-dimensional (2D) ultrasonography has shown to be easier, quicker, more efficient, and more accurate.3 Several ultrasound studies on facial parameters have proposed different nomograms for the forehead,5 the orbits,6,7 the nose,8,9 the alveolar ridge,10 the mandible,11 the philtrum, and the chin.12
The early diagnosis and characterisation by ultrasound of some pathologies associated with orofacial features can allow the dentist in planning posterior treatments. In these type of cases, when the orofacial anomalies present result in physical disabilities, the dentist should adopt an active role since the counselling to the treatment in order to provide the best prognosis to the parents with a prenatal diagnosis of a craniofacial malformation.13–17
Regarding philtrum evaluation, one of the examples of the facial features that can be assessed by prenatal ultrasound, the detection of an abnormal length (too short or too long) constitutes a typical feature of several dysmorphological syndromes.1,18,19 The fetal alcohol syndrome is probably the most documented one associated with teratogenic exposure.12 Other teratogens, such as carbamazepine and valproate, are also associated with fetal syndromes characterised by several findings, including a long philtrum.
Despite its clinical importance, recognised in paediatrics, the evaluation of the fetal philtrum length (FPL) was initially based on subjective criteria. Currently, sonographic nomograms are available for in term and preterm neonates20 and for fetus from the 13th week of gestation.12 In most cases, the assessment of fetal facial profiles on the same plane as the philtrum is possible from the 12th week of gestation.3,21 However, since the fetal philtrum is formed around the 7th week of gestation,22 our study intended to evaluate this structure at earlier stages of gestation. This study also aimed to perceive the development of the fetal philtrum through different gestational ages in cases of normal and pathological fetal development due to its known association with numerous syndromes and to the absence of studies considering pathological cases.
Materials and methodsAn observational cross-sectional ultrasound study, over a 2-year period, was conducted on a total of 108 fetuses, normal and with pathology, between 10 and 26 weeks of gestation, which were followed at a specialised institutional centre for Prenatal Diagnosis of Centro Hospitalar de Vila Nova de Gaia/Espinho. The exclusion criteria adopted consisted in the presence of maternal or fetal limitations for image acquisition. Fetuses of older gestational ages (from the 27th week of gestation) were also excluded due to the small number obtained. The study was approved by the ethics committee of the Dental Medicine Faculty of the University of Porto and authorised by the Portuguese Data Protection Authority. The cases diagnosed with fetal pathology were classified according to the International Classification of Diseases (ICD-10). The gestational age at the screening date was determined based on the last menstrual period and confirmed by the ultrasonography of the first trimester, except when the two references differed in more than seven days, in which case only the last one was considered.
All ultrasound examinations were performed using a GE E8 Voluson® (GE Medical Systems, Tiefenbach, Zipf, Austria) ultrasound system with an abdominal transducer (RAB4-8-D) and a curved array transducer (C1-5-D).
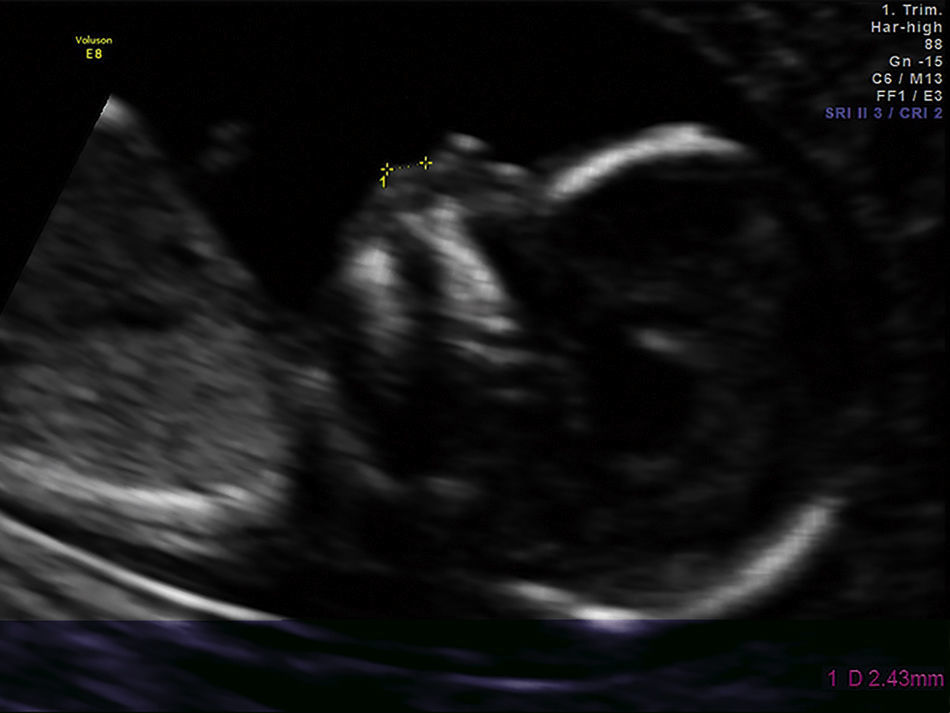
The fetal philtrum assessment was made only once during pregnancy in a routine ultrasound evaluation after written informed consent. For all examinations the mid-sagittal plane was obtained only by a single operator. The FPL was measured with electronic callipers from the posterior border of the columella to the top of the upper lip, as described by a previous study12 (Fig. 1).

Statistical analysis was performed using IBM® SPSS® Statistics (version 23.0) and R® version 3.1.1 (2014–07-10). The statistical evaluation consisted in sample characterisation and determination of the best predictive model for FPL measurement. Simple regression models (linear and nonlinear) were used, as we have a single continuous predictor variable (gestational age, G). The t-Student test for independent samples was applied to detect differences between normal and pathological groups. Predictions were based on a 95% confidence interval. The recognition of statistical evidence for values of p<0.05 was the decision rule.
The Intra-observer variability was assessed by intraclass correlation coefficient and Bland–Altman analysis was used to evaluate the concordance between the measurements on 20% of the study sample randomly chosen, in two distinctive moments.
ResultsIn this study, 108 fetuses were considered, of which 90 presented a normal fetal development and 18 a pathological development. Chromosomal anomalies (n=8, 44.4%) were the most prevalent pathologies, followed by central nervous system anomalies (n=4, 22.2%) and musculoskeletal system anomalies (n=3, 16.6%). On the other hand, genitourinary system anomalies, circulatory system anomalies, and metabolic diseases were the less prevalent pathologies (n=1, 5.6%, each).
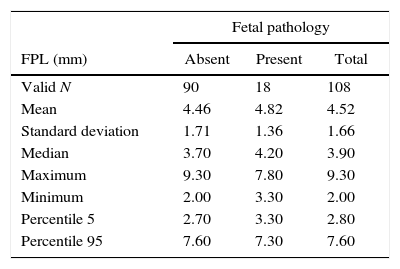
The median maternal age was 35 (range, 15–45; mean±SD, 34.2±6.1) years. The gestational age ranged from 10 to 26 (median 13.0; mean±SD, 15.6±4.2) weeks of gestation. Table 1 shows the descriptive statistics of FPL for fetuses with and without pathology.
Descriptive statistics of the fetal philtrum length (FPL) by fetuses with and without pathology.
| Fetal pathology | |||
|---|---|---|---|
| FPL (mm) | Absent | Present | Total |
| Valid N | 90 | 18 | 108 |
| Mean | 4.46 | 4.82 | 4.52 |
| Standard deviation | 1.71 | 1.36 | 1.66 |
| Median | 3.70 | 4.20 | 3.90 |
| Maximum | 9.30 | 7.80 | 9.30 |
| Minimum | 2.00 | 3.30 | 2.00 |
| Percentile 5 | 2.70 | 3.30 | 2.80 |
| Percentile 95 | 7.60 | 7.30 | 7.60 |
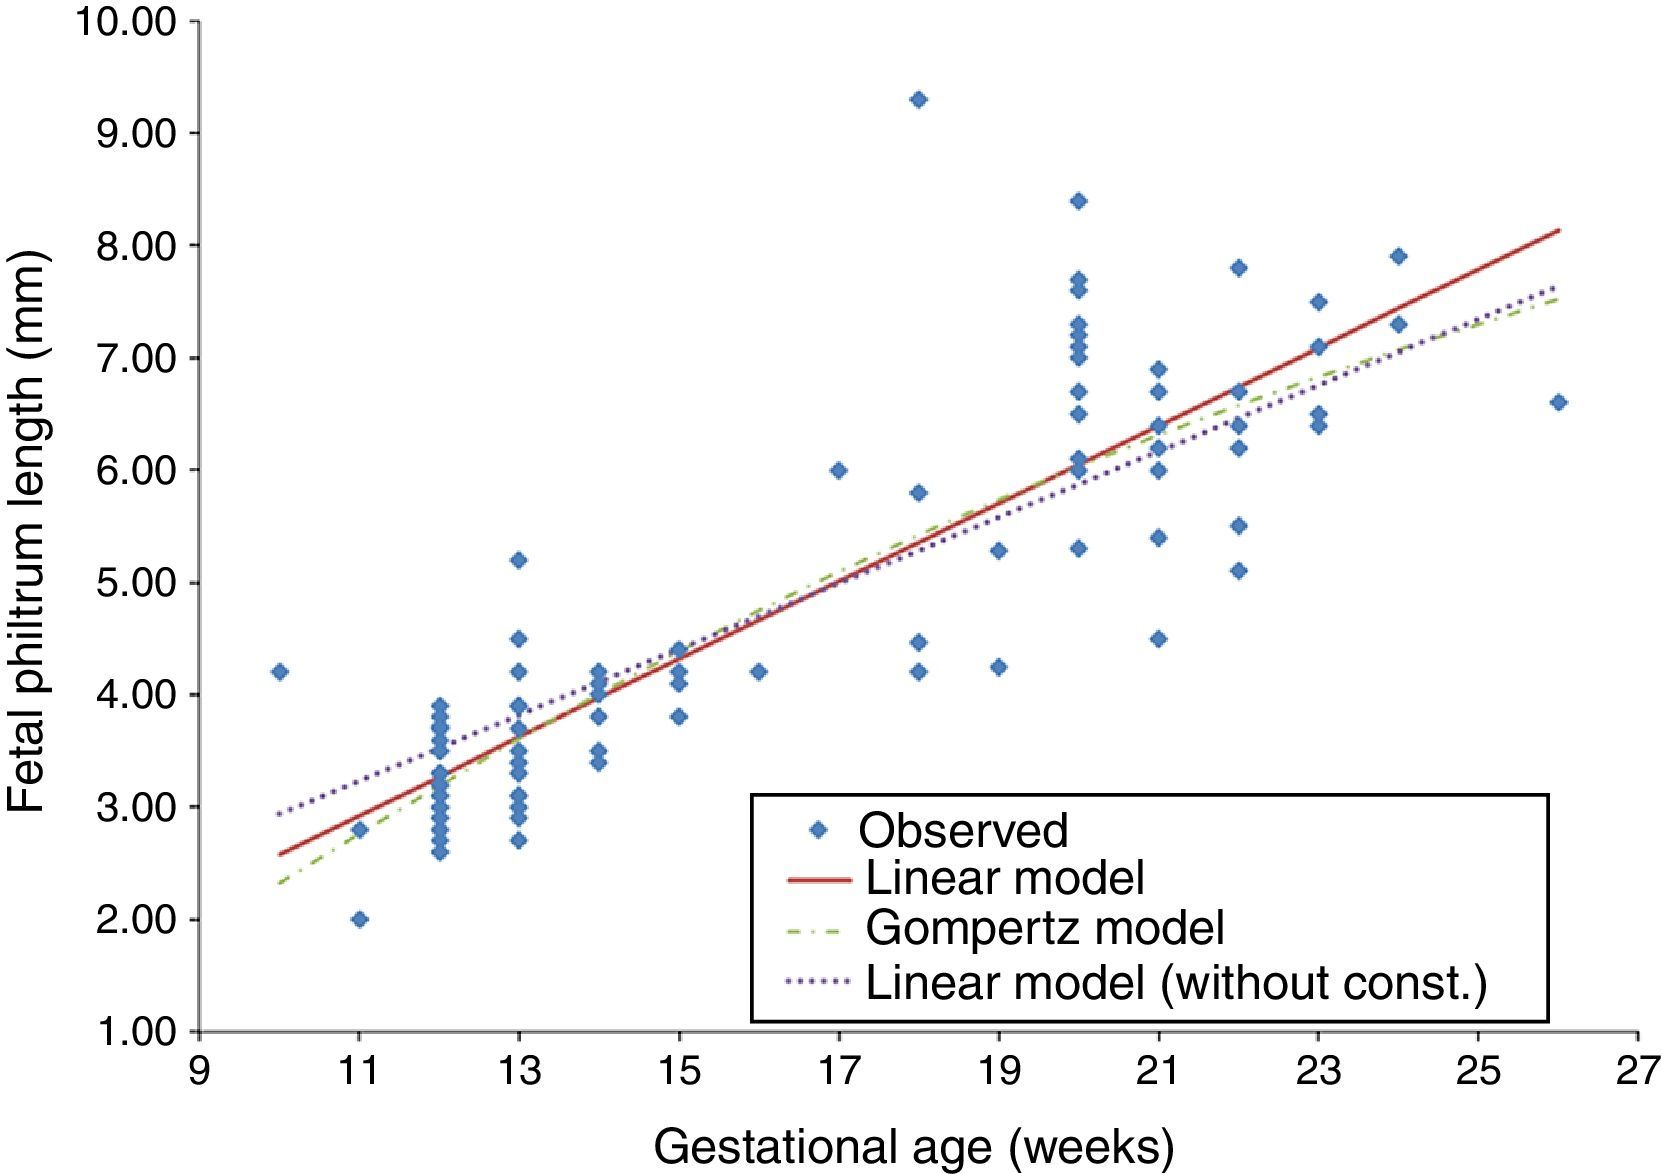
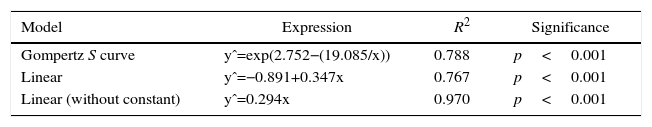
The t-Student test for independent samples (t=−0.831, df=106, p=0.408>0.05) showed no statistically significant differences in the mean FPL of both normal and pathological groups. Since there were no significant differences in our sample regarding the presence of fetal pathology, the development of FPL by gestational age was evaluated for all valid cases (N=108). This evaluation was conducted using the Gompertz model (a nonlinear regression), based on a previous study,12 and the linear regression model (with and without constant) (Table 2). For each model, the dependent variable was the FPL (y) and the independent variable was the gestational age in weeks (x) (Fig. 2).
Regression equations for FPL according to gestational age in weeks.
| Model | Expression | R2 | Significance |
|---|---|---|---|
| Gompertz S curve | yˆ=exp(2.752−(19.085/x)) | 0.788 | p<0.001 |
| Linear | yˆ=−0.891+0.347x | 0.767 | p<0.001 |
| Linear (without constant) | yˆ=0.294x | 0.970 | p<0.001 |
Legend: yˆ, Predicted value; R2, coefficient of determination.

A residual analysis was performed to validate each regression model. For all models, the quantile–quantile plot (Q–Q plot) graphical method was used to assess the normality of residuals. The homogeneity of the residual variance was evaluated based on the graph of residuals versus the FPL estimated values for detecting non-conforming behaviour. Finally, interval estimates were applied to test if the mean of residuals was zero, establishing a 95% confidence interval for the mean of residuals of each model. Although all the considered regression models were statistically valid, the best in predicting FPL was the linear one (without constant) because it presented the higher coefficient of determination (R2=0.970). This finding means that 97.0% of the model results can be explained by variation in x values (Fig. 3).

The elected regression model for gestational ages between 10 and 26 weeks is described by the equation yˆ=0.294x and represents a 0.294-mm increase on FPL per week of gestational age.
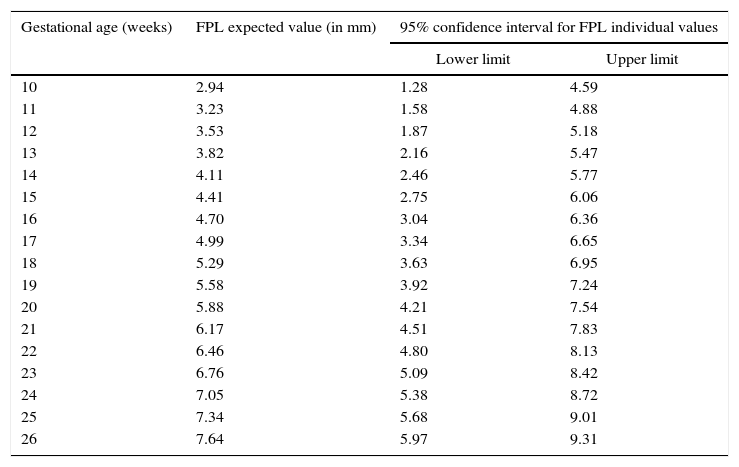
DiscussionPrenatal detection of abnormal facial features, such as philtrum length anomalies, can be isolated or associated with many syndromes. Nomograms of in term and preterm neonates from 27 to 41 gestational weeks,20 nomograms of autopsy measurements of fetuses between the 13 and 26 weeks of gestation,23 and sonographic nomograms from as early as the 13th week of gestation of the second trimester12 are already available for an objective FPL measurement. Comparatively, our data concerns earlier weeks of gestation and, therefore, provides additional information on the fetal philtrum growth during pregnancy. Moreover, our study, following of another study,23 considered other regression models for predicting fetal philtrum growth, besides the S-curve (Gompertz) model referred by the first study mentioned,12 which had an R2 of 85.3%. In our study, the linear model (without constant) had an R2 of 97.0%, being higher than the one similar to ours23 (R2 of 46.5%), and, thus, was the best model for predicting the prenatal diagnosis and the easiest to interpret. Furthermore, our data demonstrated a close concordance with those last23 regarding the determined 95% confidence interval limits. For clinical purposes, the FPL expected values and the respective 95% confidence interval limits at the considered gestational ages are summarised in Table 3. In the evaluation of measurement error at two different times in 20% of the sample, the Student's t test for paired samples showed that there were no statistically significant differences in the average value of the measurements (t=0.640, df=12, p=0.534). As the standard error calculated for these pairs is about 0.123mm, which is very small in relation to the measure performed, the results probably were not influenced by these. FPL was also studied in normal versus pathological pregnancies but, contrary to what had been expected, no significant differences were detected. The maternal age of our sample does not seem to have influenced the results since the Mann–Whitney test revealed no statistically significant differences (U=646, p=0.175>0.05) in mean values of maternal age between groups of fetuses (with and without disease). These results may be explained by the sample dimension of our study and/or by the nature of the fetal pathology present. So, the sample size can be considered a limitation of this study. Therefore, more studies, with larger samples are needed to understand if this relation is significant in some types of fetal pathologies and to establish the clinical utility and applicability of these data in congenital abnormalities diagnosis.
Expected linear measurements (in millimetres) and respective 95% confidence interval limits at various gestational ages.
| Gestational age (weeks) | FPL expected value (in mm) | 95% confidence interval for FPL individual values | |
|---|---|---|---|
| Lower limit | Upper limit | ||
| 10 | 2.94 | 1.28 | 4.59 |
| 11 | 3.23 | 1.58 | 4.88 |
| 12 | 3.53 | 1.87 | 5.18 |
| 13 | 3.82 | 2.16 | 5.47 |
| 14 | 4.11 | 2.46 | 5.77 |
| 15 | 4.41 | 2.75 | 6.06 |
| 16 | 4.70 | 3.04 | 6.36 |
| 17 | 4.99 | 3.34 | 6.65 |
| 18 | 5.29 | 3.63 | 6.95 |
| 19 | 5.58 | 3.92 | 7.24 |
| 20 | 5.88 | 4.21 | 7.54 |
| 21 | 6.17 | 4.51 | 7.83 |
| 22 | 6.46 | 4.80 | 8.13 |
| 23 | 6.76 | 5.09 | 8.42 |
| 24 | 7.05 | 5.38 | 8.72 |
| 25 | 7.34 | 5.68 | 9.01 |
| 26 | 7.64 | 5.97 | 9.31 |
This study provides additional data about the growth pattern of the fetal philtrum according to gestational age. It also offers a way for identifying alterations in FPL that can serve as a tool in the prenatal diagnosis of syndromes including facial anomalies.
Ethical disclosuresProtection of human and animal subjectsThe authors declare that no experiments were performed on humans or animals for this study.
Confidentiality of dataThe authors declare that they have followed the protocols of their work centre on the publication of patient data.
Right to privacy and informed consentThe authors have obtained the written informed consent of the patients or subjects mentioned in the article. The corresponding author is in possession of this document.
Conflicts of interestThe authors declare no conflicts of interest.