


To evaluate the accuracy of two-dimensional (2D) cephalometric analysis when compared to “gold standard” measurements on skulls. Also to appraise the reliability of 10 linear measurements commonly used in 2D lateral cephalometric analysis.
MethodsTwenty dry human skulls and its digital lateral cephalometric images of were taken. The skulls were positioned in an aluminum filter box to mimic soft tissue attenuation. Ten linear measurements were performed both in skulls and radiographs by 2 observers (experienced dentomaxillofacial radiologists). The same procedure was repeated twice, with 1 month interval, to allow calculation of the intra- and inter-observer variability.
ResultsStatistically significant differences were found between cephalometric and direct craniometric measurements. In general, measurements were on average lower in skulls with exception of three that were on average significantly higher (Co-Gn, Go-Me, Co-ANS). When a bilateral landmark was included, measurements were significantly higher. Furthermore, no significant differences were observed between measurements by the two observers (p<0.05).
ConclusionRadiographic linear measurements systematically overestimated the direct linear measurements performed on the skulls. However, differences found were most often <1mm, which is generally within one standard deviation of “normal” values in conventional cephalometric analysis. It is assumed that such differences are often clinically acceptable, yet further studies are encouraged to evaluate the impact on cephalometry-based therapy planning.
Para avaliar a precisão da análise cefalométrica bidimensional (2D) quando comparada com as medições de “padrão ouro” em crânios. Também para avaliar a fiabilidade de dez medições lineares, normalmente usadas na análise cefalométrica lateral 2D.
MétodosVinte crânios humanos secos e foram tiradas fotografias da sua cefalometria lateral digital. Os crânios foram colocados numa caixa do filtro de alumínio para simular a atenuação de tecidos moles. Foram realizadas dez medições lineares em ambos os crânios e radiografias por 2 observadores (radiologistas dento-maxilo-faciais experientes). O mesmo procedimento foi repetido duas vezes, com 1 mês de intervalo, para permitir o cálculo da variabilidade inter e intraobservadores.
ResultadosForam encontradas diferenças estatisticamente significativas entre as medições cefalométrica e directa craniométrica. Em geral, as medições foram, em média, inferiores em crânios, com a excepção de três que foram, em média, significativamente superiores (Co-Gn, Go-Me, Co-ANS). Quando foi incluído um marco bilateral, as medições foram significativamente superiores. Além disso, não foram encontradas diferenças significativas entre as medições pelos dois observadores (p<0,05).
ConclusãoAs medições lineares radiográficas sobrestimaram sistematicamente as medições lineares directas realizadas nos crânios. No entanto, as diferenças encontradas eram mais frequentemente inferiores a 1mm, o que se encontra, de um modo geral, dentro de um desvio-padrão de valores “normais”, numa análise cefalométrica convencional. É assumido que essa diferenças são frequentemente clinicamente aceites, no entanto é encorajada a realização de estudos adicionais para avaliar o impacto no planeamento de tratamento baseado na cefalometria.
Human form measurements have been based on self-portrait, sculpture or drawing throughout the history. Likewise, craniofacial measurements have been thoroughly investigated by anthropologists, especially the proportions and relationships between anatomical craniofacial structures. By means of craniometrics, direct measurement on dry skulls was used extensively to determine their characteristic relationship to gender, body type, or genetic population, until the discovery of X-rays and the introduction of cephalometry. Lateral cephalometry radiography (LCR) was introduced simultaneously by a German dentist, Hofrath, and an American dentist, Broadbent, in 1931.1 It has been tremendously used in craniofacial analysis, and as a standard tool in orthodontics.2 It is used to define morphology and predict facial skeleton's growth, treatment planning and on the evaluation of treatment outcome.3 Moreover, specific identification of anatomical landmarks can be performed on cephalometric radiographs. It allows measurements of various angular and linear variables. Nevertheless, the scientific value of cephalometric analyses is still questioned due to its lack of validity and reliability as a diagnostic tool. Several errors can occur on landmark identification, linear and angle measurements and magnification of certain anatomical structures should be considered.4 In addition, magnification radiographs, patient positioning or occasional different levels of knowledge and experience between observers may also lead to different results and interfere with the reliability of measurements.5–8
Previous studies have indicated that the major error in cephalometric studies is caused by an erroneous identification of landmarks, and that each landmark exhibits a characteristic pattern of error.9 Only two studies reported the validity of skeletal landmarks.6,10 Mattila and Haataja10 studied the validity of eight skeletal landmarks in the cranium and maxilla, but no statistical test was used to evaluate their results. Tng et al.6 investigated true anatomical landmarks in comparison with landmarks identified on cephalograms, and found that there is a trend for a minor degree of error for cephalometric angles and distances involving only skeletal landmarks compared to those involving skeletal and dental landmarks. They stressed that landmarks identified on cephalograms differed from the true anatomical landmarks.6 Even though the validity of landmarks has been examined, the former studies did not cover its effect on linear measurement between anatomical landmarks. Therefore, the present aim was to evaluate the reliability of some linear measurements commonly used in 2D lateral cephalometric analysis and to determine its accuracy in comparison with the gold standard measurements performed on skulls. The null hypothesis tested was that 2D cephalometrics landmark identification is not accurate when compared to the real skull analysis.
Materials and methodsTwenty dry mixed dentate human skulls from the Anatomy Department of the University of Hasselt were used. This sample of convenience was selected according to the following inclusion criteria: reproducible occlusion, presence of permanent upper and lower incisors, and presence of at least one molar on either side to maintain the vertical dimension. The mandibles were stably connected to the maxilla through occlusal interdigitation at the maximum occlusion, with the condyles located in the glenoid fossa. The mandibles were attached to the skulls with broad tape attached from the temporal bone of one side, crossing the inferior border of the mandible, to the temporal bone of the opposite side.
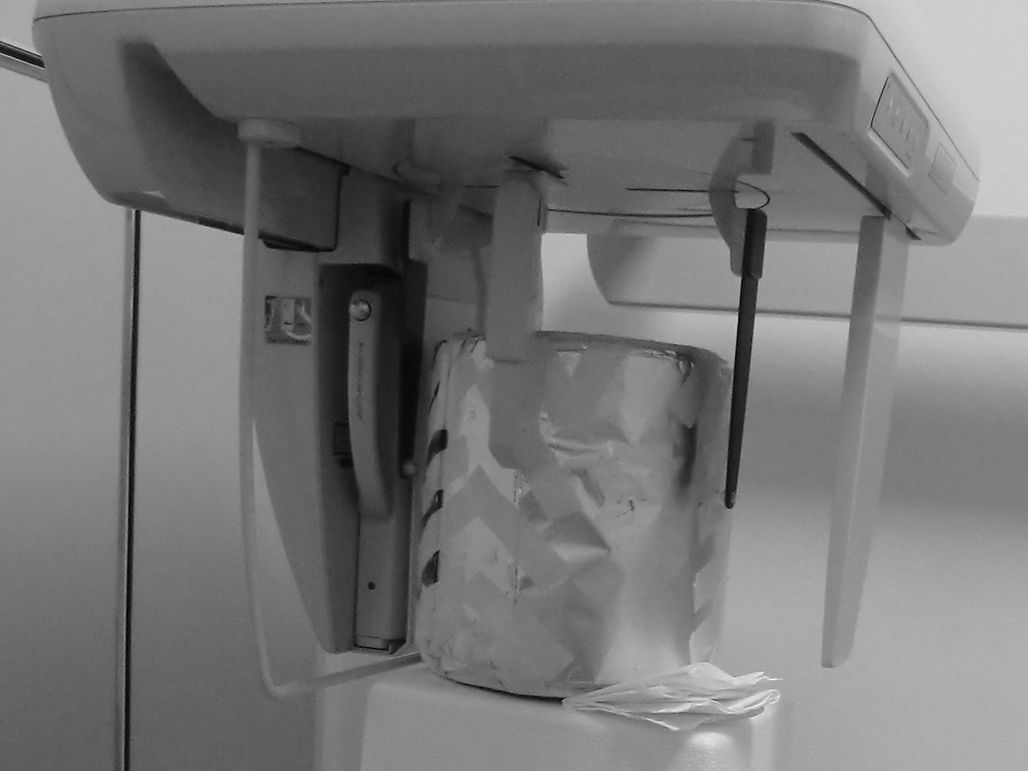
Lateral cephalograms were acquired by positioning the skulls in a standard panoramic-cephalometric device (Veraviewepocs 2D®, J. Morita, Kyoto, Japan). The magnification ratio of the lateral cephalometry was 1.1. The skulls were stabilized in the cephalostat on an aluminum filter cylinder (thickness of 400 aluminum foils sheets). It had 18.5cm of diameter and 2.5cm of thickness (Fig. 1). The purpose of using the aluminum filter was to simulate a real situation, mimicking soft tissue attenuation, in the identification of bony landmarks on radiographs.

The radiographic settings used were 77kV, 7.2mA and 3.2s. All the images were then exported in TIFF format, and imported to Adobe Photoshop® CS3 software (Adobe Systems Incorporated, California, USA). Before radiographic evaluation, the skull position was adjusted to allow the Frankfort horizontal plane to be parallel with the horizontal plane for further measurements.
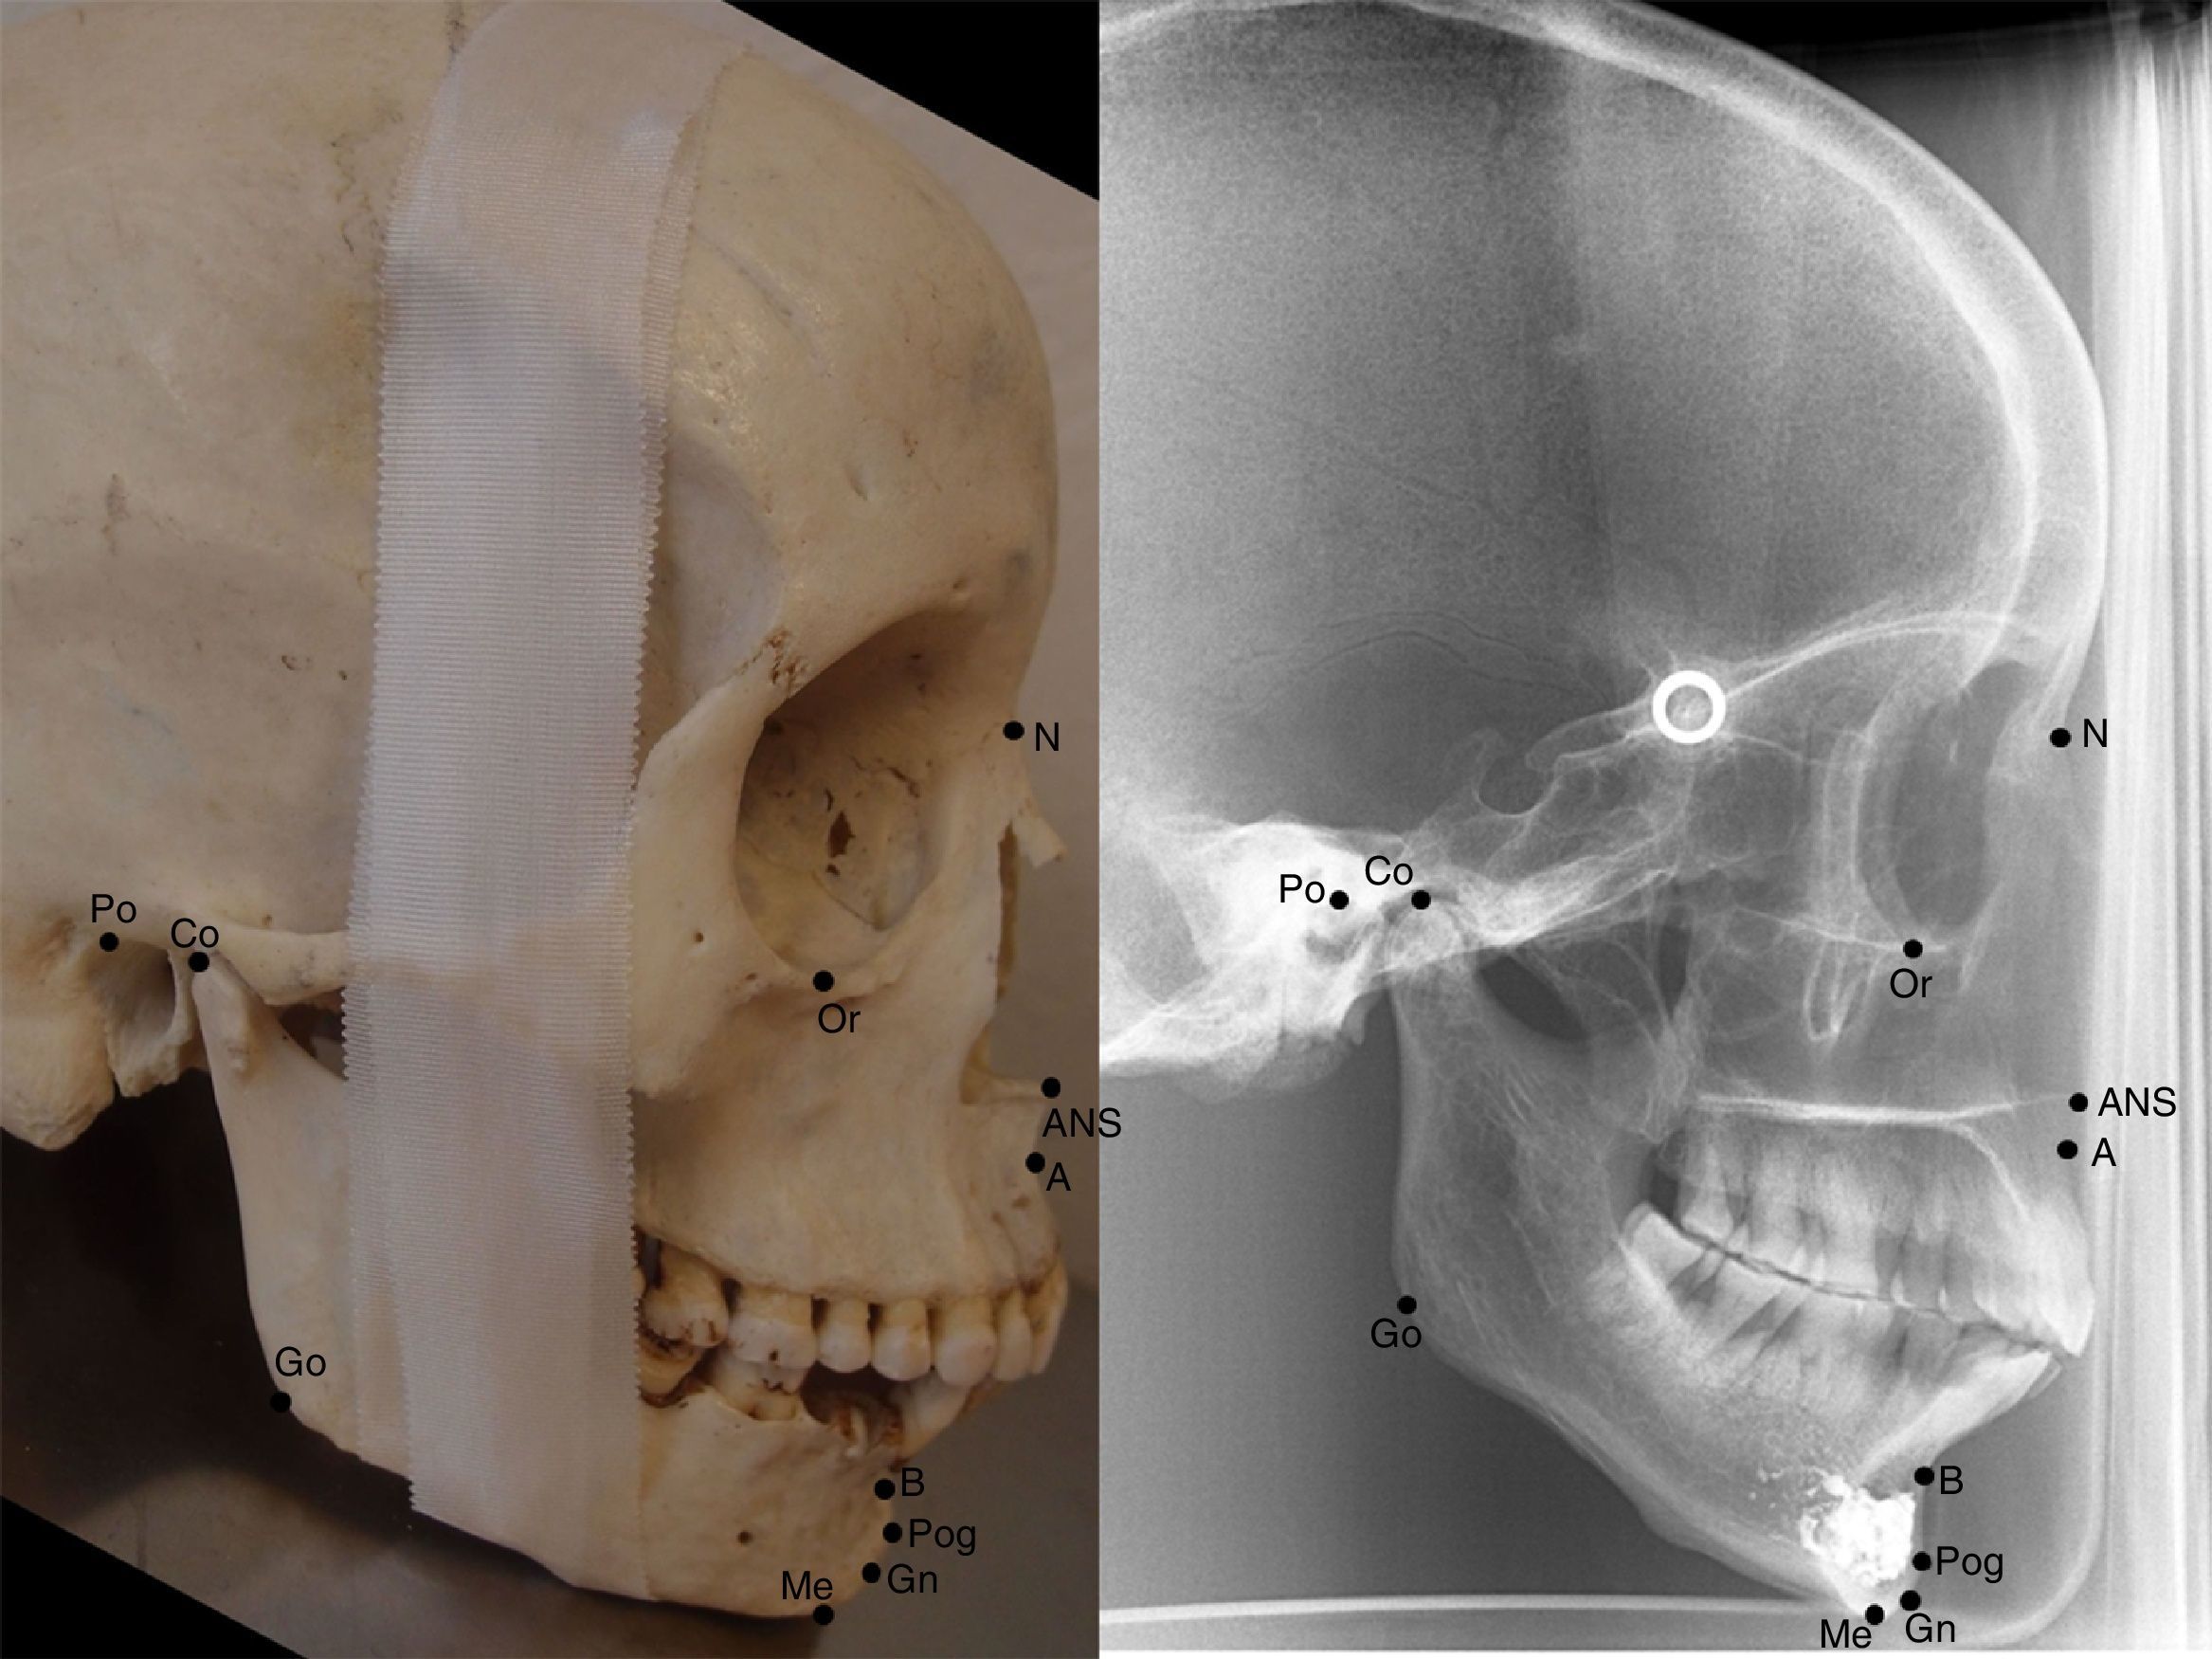
Two experienced observers (dentomaxillofacial radiologists) performed this study with a session of calibration prior to the analysis. Ten commonly used skeletal landmarks were identified on 20 skulls and its radiographs according to Fig. 2.11 Both observers had been informed about all the required anatomical landmarks, identification methods used on radiographs, and also craniometric measurement of the skulls. Five skulls and its radiographs were used for calibration. Both observers measured the 5 skulls and respective radiographs. At the end of the calibration, both observers were in agreement and any remaining doubt was clarified. In case of any uncertainty between the two observers, an additional advice from a third observer was essential to reach agreement. It was agreed to identify the bilateral landmarks seen on radiographs by establishing a middle point between the two structures. A mean value was used when bilateral structures were identified on skulls. The experimental work started one week after.

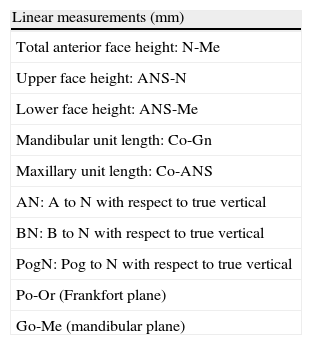
The craniometric measurements considered to be the gold standard were done on 20 dry dentate skulls by using a digital caliper (Absolute Digimatic Caliper No. 500-161U; Mitutoyo America Corp., Aurora, IL). The same measurements were performed by digitally determining the landmarks on the viewing monitor in a dim-lighted room without any interruption. All measurements were repeated 1 month later, both on skulls and radiographs. The results of the intra- and inter-observer reliability were analyzed. Linear measurements were chosen according to the vertical and anteroposterior dimensions of the craniofacial form (Table 1). The landmarks on which these measurements were based represented both midsagittal and bilateral anatomical structures.
Linear measurements evaluated on both human skulls and lateral cephalometric radiographs in this study.
| Linear measurements (mm) |
| Total anterior face height: N-Me |
| Upper face height: ANS-N |
| Lower face height: ANS-Me |
| Mandibular unit length: Co-Gn |
| Maxillary unit length: Co-ANS |
| AN: A to N with respect to true vertical |
| BN: B to N with respect to true vertical |
| PogN: Pog to N with respect to true vertical |
| Po-Or (Frankfort plane) |
| Go-Me (mandibular plane) |
Variables were described through its mean, standard deviation and measurements of dispersion. Intra-observer variation and inter-observer variation were studied using the intraclass correlation coefficient (ICC) with a confidence interval of 95%. General guidelines for this measure rate an ICC>0.90 as excellent, an ICC of 0.75–0.90 as good, and an ICC<0.75 as representing poor to moderate reliability.12 Differences between the measurements performed on skulls and on radiographs were evaluated by the Bland–Altman limits of agreement.13 One sample t-test was used to evaluate if the mean of the differences between the two measurements was different from 0.14
The Statistical Package for Social Sciences 20.0 for Windows (SPSS Inc., Chicago, IL, USA) was used for statistical analysis. The level of statistical significance for all tests was set at α=0.05.
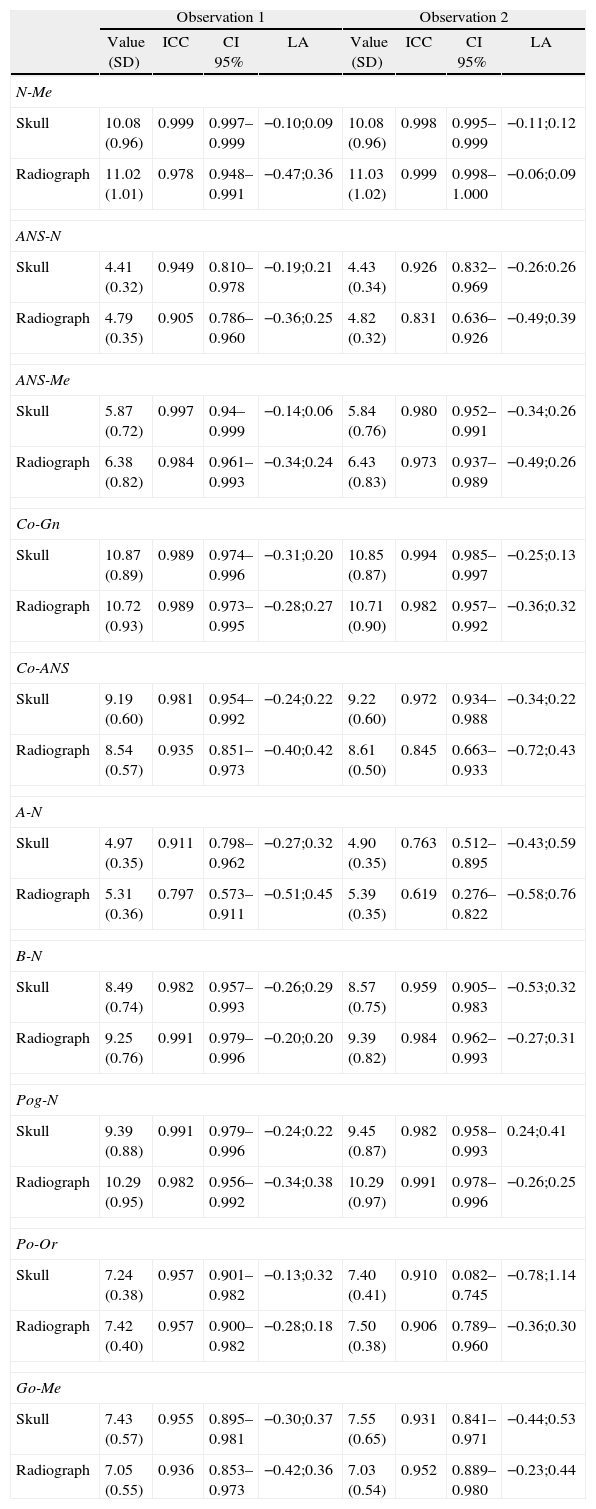
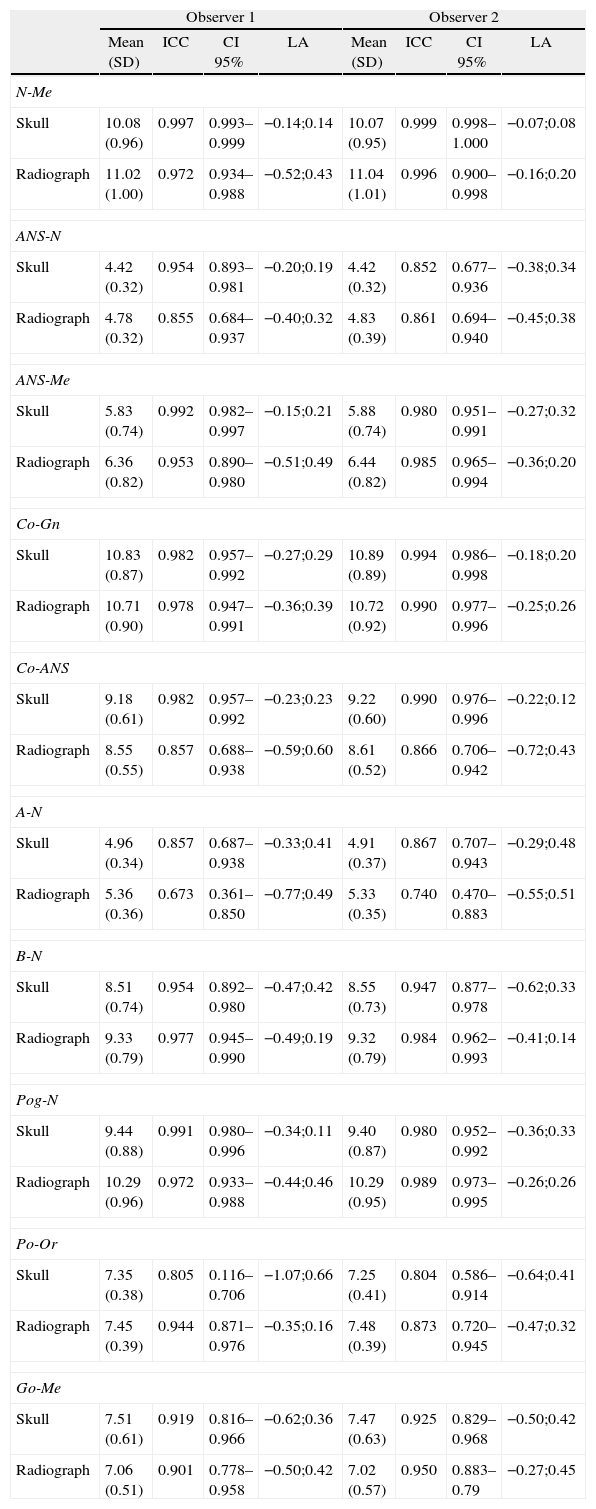
ResultsIntra-observer consistency is shown in Table 2. In Table 3 the inter-observer reliability is presented.
Mean differences between the first and second observations with regard to intra-observer agreement (mm).
| Observation 1 | Observation 2 | |||||||
| Value (SD) | ICC | CI 95% | LA | Value (SD) | ICC | CI 95% | LA | |
| N-Me | ||||||||
| Skull | 10.08 (0.96) | 0.999 | 0.997–0.999 | −0.10;0.09 | 10.08 (0.96) | 0.998 | 0.995–0.999 | −0.11;0.12 |
| Radiograph | 11.02 (1.01) | 0.978 | 0.948–0.991 | −0.47;0.36 | 11.03 (1.02) | 0.999 | 0.998–1.000 | −0.06;0.09 |
| ANS-N | ||||||||
| Skull | 4.41 (0.32) | 0.949 | 0.810–0.978 | −0.19;0.21 | 4.43 (0.34) | 0.926 | 0.832–0.969 | −0.26:0.26 |
| Radiograph | 4.79 (0.35) | 0.905 | 0.786–0.960 | −0.36;0.25 | 4.82 (0.32) | 0.831 | 0.636–0.926 | −0.49;0.39 |
| ANS-Me | ||||||||
| Skull | 5.87 (0.72) | 0.997 | 0.94–0.999 | −0.14;0.06 | 5.84 (0.76) | 0.980 | 0.952–0.991 | −0.34;0.26 |
| Radiograph | 6.38 (0.82) | 0.984 | 0.961–0.993 | −0.34;0.24 | 6.43 (0.83) | 0.973 | 0.937–0.989 | −0.49;0.26 |
| Co-Gn | ||||||||
| Skull | 10.87 (0.89) | 0.989 | 0.974–0.996 | −0.31;0.20 | 10.85 (0.87) | 0.994 | 0.985–0.997 | −0.25;0.13 |
| Radiograph | 10.72 (0.93) | 0.989 | 0.973–0.995 | −0.28;0.27 | 10.71 (0.90) | 0.982 | 0.957–0.992 | −0.36;0.32 |
| Co-ANS | ||||||||
| Skull | 9.19 (0.60) | 0.981 | 0.954–0.992 | −0.24;0.22 | 9.22 (0.60) | 0.972 | 0.934–0.988 | −0.34;0.22 |
| Radiograph | 8.54 (0.57) | 0.935 | 0.851–0.973 | −0.40;0.42 | 8.61 (0.50) | 0.845 | 0.663–0.933 | −0.72;0.43 |
| A-N | ||||||||
| Skull | 4.97 (0.35) | 0.911 | 0.798–0.962 | −0.27;0.32 | 4.90 (0.35) | 0.763 | 0.512–0.895 | −0.43;0.59 |
| Radiograph | 5.31 (0.36) | 0.797 | 0.573–0.911 | −0.51;0.45 | 5.39 (0.35) | 0.619 | 0.276–0.822 | −0.58;0.76 |
| B-N | ||||||||
| Skull | 8.49 (0.74) | 0.982 | 0.957–0.993 | −0.26;0.29 | 8.57 (0.75) | 0.959 | 0.905–0.983 | −0.53;0.32 |
| Radiograph | 9.25 (0.76) | 0.991 | 0.979–0.996 | −0.20;0.20 | 9.39 (0.82) | 0.984 | 0.962–0.993 | −0.27;0.31 |
| Pog-N | ||||||||
| Skull | 9.39 (0.88) | 0.991 | 0.979–0.996 | −0.24;0.22 | 9.45 (0.87) | 0.982 | 0.958–0.993 | 0.24;0.41 |
| Radiograph | 10.29 (0.95) | 0.982 | 0.956–0.992 | −0.34;0.38 | 10.29 (0.97) | 0.991 | 0.978–0.996 | −0.26;0.25 |
| Po-Or | ||||||||
| Skull | 7.24 (0.38) | 0.957 | 0.901–0.982 | −0.13;0.32 | 7.40 (0.41) | 0.910 | 0.082–0.745 | −0.78;1.14 |
| Radiograph | 7.42 (0.40) | 0.957 | 0.900–0.982 | −0.28;0.18 | 7.50 (0.38) | 0.906 | 0.789–0.960 | −0.36;0.30 |
| Go-Me | ||||||||
| Skull | 7.43 (0.57) | 0.955 | 0.895–0.981 | −0.30;0.37 | 7.55 (0.65) | 0.931 | 0.841–0.971 | −0.44;0.53 |
| Radiograph | 7.05 (0.55) | 0.936 | 0.853–0.973 | −0.42;0.36 | 7.03 (0.54) | 0.952 | 0.889–0.980 | −0.23;0.44 |
SD – standard deviation; ICC – intraclass correlation; CI (5–95%) confidence interval; LA – limits of agreement.
Inter-observer agreement (mm).
| Observer 1 | Observer 2 | |||||||
| Mean (SD) | ICC | CI 95% | LA | Mean (SD) | ICC | CI 95% | LA | |
| N-Me | ||||||||
| Skull | 10.08 (0.96) | 0.997 | 0.993–0.999 | −0.14;0.14 | 10.07 (0.95) | 0.999 | 0.998–1.000 | −0.07;0.08 |
| Radiograph | 11.02 (1.00) | 0.972 | 0.934–0.988 | −0.52;0.43 | 11.04 (1.01) | 0.996 | 0.900–0.998 | −0.16;0.20 |
| ANS-N | ||||||||
| Skull | 4.42 (0.32) | 0.954 | 0.893–0.981 | −0.20;0.19 | 4.42 (0.32) | 0.852 | 0.677–0.936 | −0.38;0.34 |
| Radiograph | 4.78 (0.32) | 0.855 | 0.684–0.937 | −0.40;0.32 | 4.83 (0.39) | 0.861 | 0.694–0.940 | −0.45;0.38 |
| ANS-Me | ||||||||
| Skull | 5.83 (0.74) | 0.992 | 0.982–0.997 | −0.15;0.21 | 5.88 (0.74) | 0.980 | 0.951–0.991 | −0.27;0.32 |
| Radiograph | 6.36 (0.82) | 0.953 | 0.890–0.980 | −0.51;0.49 | 6.44 (0.82) | 0.985 | 0.965–0.994 | −0.36;0.20 |
| Co-Gn | ||||||||
| Skull | 10.83 (0.87) | 0.982 | 0.957–0.992 | −0.27;0.29 | 10.89 (0.89) | 0.994 | 0.986–0.998 | −0.18;0.20 |
| Radiograph | 10.71 (0.90) | 0.978 | 0.947–0.991 | −0.36;0.39 | 10.72 (0.92) | 0.990 | 0.977–0.996 | −0.25;0.26 |
| Co-ANS | ||||||||
| Skull | 9.18 (0.61) | 0.982 | 0.957–0.992 | −0.23;0.23 | 9.22 (0.60) | 0.990 | 0.976–0.996 | −0.22;0.12 |
| Radiograph | 8.55 (0.55) | 0.857 | 0.688–0.938 | −0.59;0.60 | 8.61 (0.52) | 0.866 | 0.706–0.942 | −0.72;0.43 |
| A-N | ||||||||
| Skull | 4.96 (0.34) | 0.857 | 0.687–0.938 | −0.33;0.41 | 4.91 (0.37) | 0.867 | 0.707–0.943 | −0.29;0.48 |
| Radiograph | 5.36 (0.36) | 0.673 | 0.361–0.850 | −0.77;0.49 | 5.33 (0.35) | 0.740 | 0.470–0.883 | −0.55;0.51 |
| B-N | ||||||||
| Skull | 8.51 (0.74) | 0.954 | 0.892–0.980 | −0.47;0.42 | 8.55 (0.73) | 0.947 | 0.877–0.978 | −0.62;0.33 |
| Radiograph | 9.33 (0.79) | 0.977 | 0.945–0.990 | −0.49;0.19 | 9.32 (0.79) | 0.984 | 0.962–0.993 | −0.41;0.14 |
| Pog-N | ||||||||
| Skull | 9.44 (0.88) | 0.991 | 0.980–0.996 | −0.34;0.11 | 9.40 (0.87) | 0.980 | 0.952–0.992 | −0.36;0.33 |
| Radiograph | 10.29 (0.96) | 0.972 | 0.933–0.988 | −0.44;0.46 | 10.29 (0.95) | 0.989 | 0.973–0.995 | −0.26;0.26 |
| Po-Or | ||||||||
| Skull | 7.35 (0.38) | 0.805 | 0.116–0.706 | −1.07;0.66 | 7.25 (0.41) | 0.804 | 0.586–0.914 | −0.64;0.41 |
| Radiograph | 7.45 (0.39) | 0.944 | 0.871–0.976 | −0.35;0.16 | 7.48 (0.39) | 0.873 | 0.720–0.945 | −0.47;0.32 |
| Go-Me | ||||||||
| Skull | 7.51 (0.61) | 0.919 | 0.816–0.966 | −0.62;0.36 | 7.47 (0.63) | 0.925 | 0.829–0.968 | −0.50;0.42 |
| Radiograph | 7.06 (0.51) | 0.901 | 0.778–0.958 | −0.50;0.42 | 7.02 (0.57) | 0.950 | 0.883–0.79 | −0.27;0.45 |
SD – standard deviation; ICC – intraclass correlation; CI (5–95%) confidence interval; LA – limits of agreement.
Craniometric measurement revealed ICC values in general, above 0.90, for the intra-observer reliability, with the exception of the A-N measurement for observer 2, which showed an ICC of 0.76 (Table 2).
For the inter-observer reliability seen in craniometric measurement, the ICC was also, in general, above 0.90, with the exception of ANS-N for the second observation, A-N and Po-Or for both observations (Table 3).
Intra-observer reliability for the linear measurement on radiographs revealed ICC values above 0.90, except for ANS-N and Co-ANS for the second observer, and A-N for both observers (Table 2).
There was an overall good agreement, with regard to inter-observer reliability for the linear measurement performed on radiographs, when comparing between linear measurements, with the exception of ANS-N, Co-ANS, A-N and Po-Or for both observations (Table 3).
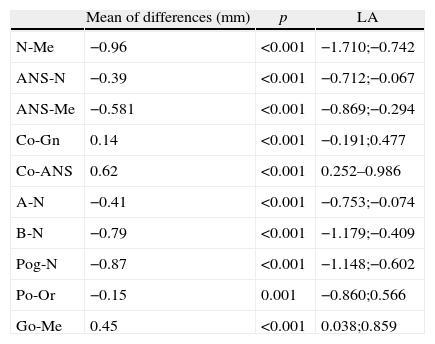
Regarding accuracy of 2D cephalometric radiographs, the mean differences between linear measurements (mm) when performed by both observers on skulls and radiographs were investigated and the results are shown in Table 4.
Mean of differences and level of agreement between the measurements performed on the skull and radiography.
| Mean of differences (mm) | p | LA | |
| N-Me | −0.96 | <0.001 | −1.710;−0.742 |
| ANS-N | −0.39 | <0.001 | −0.712;−0.067 |
| ANS-Me | −0.581 | <0.001 | −0.869;−0.294 |
| Co-Gn | 0.14 | <0.001 | −0.191;0.477 |
| Co-ANS | 0.62 | <0.001 | 0.252–0.986 |
| A-N | −0.41 | <0.001 | −0.753;−0.074 |
| B-N | −0.79 | <0.001 | −1.179;−0.409 |
| Pog-N | −0.87 | <0.001 | −1.148;−0.602 |
| Po-Or | −0.15 | 0.001 | −0.860;0.566 |
| Go-Me | 0.45 | <0.001 | 0.038;0.859 |
p – one-sample t-test; LA – limits of agreement.
Radiograph and craniometric measurements presented statistically significant differences between them, with p<0.05, implying that there was a difference in landmark identification between these two modalities.
Seven of the 10 linear measurements on radiographs were on average significantly higher (Table 4). Only three of the linear measurements were on average significantly higher when performed directly on the skulls (Co-Gn, Co-ANS, and Go-Me). The largest deviation between the two methods was seen on measurement N-Me, with a difference of 0.96mm. The lowest value was detected on the linear measurements between Co-Gn (0.14) and Po-Or (0.14). The Bland–Altman limits of agreement showed the 95% differences between measurements performed on the skulls and on radiographs. All the differences found between the two methods were inferior to two units of measurement (mm), which is, generally, within one standard deviation of the norm values in cephalometric analysis.4
DiscussionEvidence shows that landmark identification is a great source of error in 2D cephalometric analysis because of the uncertainty in recognizing accurately where the landmark is located. Linear radiographic measurements systematically and significantly overestimated the gold standard measurements of the skulls.
Some landmarks also show a wider variation in localization than others.3,6 Superimposition between bilateral anatomical structures and anatomical localization may hinder its identification, with the example of the landmarks Co, Go, Po, Or, and the lower incisor apex.3,4 Therefore, it is essential to accurately determine anatomical landmarks in order to reduce the linear measurement error on cephalometric analysis. Moreover, it is important to assess the quantitative differences between craniometric measurement and the corresponding radiographic measurements.
The observers’ agreement is another factor that influences the measurement error. Chen et al.4 found that in general the inter-observer error presents greater values than the intra-observer error. The present study confirmed that, on average, there was a higher rate of the inter-observer error. Regarding the comparison between craniometric and cephalometric measurement, our study found that intra-observer reliability and inter-observer reliability for the linear measurements performed on the skulls were on average significantly lower than on radiographs (Tables 2 and 3).
Table 2 shows that intra-observer reliability for the skull linear measurement A-N was the least consistent for observer 2, with an ICC of 0.76. When comparing intra-observer reliability on radiographs, the lowest agreement was seen in A-N, Co-ANS and ANS-N, respectively, for both observers. Linear measurement A-N showed a lower agreement between observers both on skulls and on radiographs. This might be due to the localization of point A, Co and ANS.3,4 The evidence shows that bilateral anatomical landmark identification, such as Co, is a great source of error in 2D lateral cephalometry.4 Relating to points A and ANS, they might appear more radiolucent on radiograph, which may lead to uncertain position of these landmarks. In addition, point A is a landmark that is located at a curve which may be difficult to identify in the skull.
Intra- and inter-observer SD for the skulls and radiographs were lower (value inferior to 0.5) for the linear measurements ANS-N, A-N and Po-Or for observations 1 and 2.
On average, in a 12-year-old male, the Harvold linear measurement ANS-Me presents a SD of approximately 3.7mm,11 which is a value higher than the ones found in the present study (maximum 0.83).
The results revealed that, in general, craniometric measurements tended to be shorter than linear measurement on radiographs, except for Co-Gn (mandibular unit), Co-ANS (maxillary unit), and Go-Me (mandibular plane) (Table 4). This may be related with the fact that, on these linear measurements, at least one of the landmarks is placed on bilateral structures (Co and Go), which may have increased this variability. Also, it is more difficult to establish a middle point directly on the skull than on the radiograph. The validity of cephalometric distances depended on the validity of the individual landmarks involved.
Our results contrast with the study from Farkas et al.,15 where they found that singular and paired cephalometric distances were significantly shorter than the craniometric distances on postero-anterior cephalometric radiographs. Our 10 measurements were statistically significant (p<0.05), even though the interval for limits of agreement were on average low (see Table 4).
The mean difference was significant and presented the highest variance for the total anterior face height linear measurement (on average, N-Me at 0.956mm). This means that there is a 95% chance that the value varies from −1.71 to −0.74, which is within the clinically acceptable limits, since it is inferior to 1mm (Table 4).
McNamaras’ cephalometric analysis, published in 1984, estimated an error of ±2mm for the linear measurement A-N,11 while in the present study was found a confidence interval of −0.753 to −0.074, which shows that the confidence interval presents values much lower than 2mm.
The shortest mean differences were observed in the linear measurements Co-Gn (0.143mm) and Po-Or (−0.416mm), which showed an extremely low value. Considering Po-Or, even though the mean difference was low, there was no significant difference between the two measurement methods. This could be explained by measurement errors from equipment, observers, or both. Therefore, these results should be investigated and taken into consideration. However, this might also have happened because of being easier to identify the Co and Gn on radiographs than on skulls.
Regarding radiographs, when landmarks were located at superimposed structures or placed on curves, they tend to have poorer validity, for example for linear measurements that contained A-point, Co, Gn and Po. Superimposition of adjacent structures confuses the identification of certain landmarks, such as Co, Or and Po, on radiographs.
There is always a degree of magnification on radiographs, caused by the variable distance between the X-ray source and the image receptor. Thus, exact superimposition of the right and left sides is impossible due to the magnification of structures further from the image receptor and the slightly lesser magnification of structures nearer to the image receptor.16,17 Panoramic equipment with a cephalometric arm at a 1.5m distance, as used in this study, may present shortcomings in enlargement factors and in superimposition of the bilateral structures more distant from the midsagittal plane. In former studies where equipment with a 4m arm was used, the long distance allowed radiation at a much lower dose and a parallel bundling of the X-rays, as to guarantee a magnification of ×1, eliminating any left/right magnification differences.18 Nevertheless, the logistic requirements for such a cephalometric machine with a 4m distance separation, made companies and dentists favor cephalometric arms (1.5m focus-object distance) together with a panoramic radiography device. The latter are more compact, but may present a differential enlargement between the left and right sides and contrasts within the midline enlargement.
It has been suggested that observed differences should represent at least twice the standard deviation of the estimating error in order to be significant.3 The current differences are usually shorter than ±1mm, which is less than the estimated standard deviation for each linear measurement. Besides, cephalometric analysis finally reports on relative relations. The present study showed that significant deviations in landmark identifications may have rather limited interference on the orthodontic diagnosis and treatment planning. However, one should perform a thorough cephalometric analysis on a large sample, with subsequent treatment planning, in order to exclude any occurrence of a significant clinical effect.
ConclusionsIn the present study, linear radiographic measurements systematically and significantly overestimated the gold standard measurements of the skulls, while intra-observer reliability and inter-observer reliability were also significant. Further studies focusing on the impact of deviating cephalometric analysis may be required to determine its clinical impact.
Ethical responsibilitiesProtection of human and animal subjectsThe authors declare that no experiments were performed on humans or animals for this study.
Confidentiality of dataThe authors declare that they have followed the protocols of their work center on the publication of patient data.
Right to privacy and informed consentThe authors declare that no patient data appear in this article.
Conflicts of InterestThe authors have no conflicts of interest to declare.