

This experimental study examined the effect of the antioxidant drug “U-74389G”, on a rat model and particularly in a hypoxia – reoxygenation protocol. The effects of that molecule were studied hematologically using blood mean platelets volume (MPV) levels.
Methods40 rats of mean weight 231.875g were used in the study. MPV levels were measured at 60min of reoxygenation (groups A and C) and at 120min of reoxygenation (groups B and D). The drug U-74389G was administered only in groups C and D.
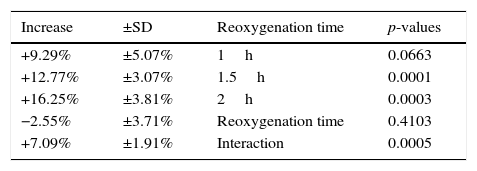
ResultsU-74389G administration kept significantly increased the predicted MPV levels by 12.77±3.07% (p=0.0001). Reoxygenation time non-significantly decreased the predicted MPV levels by 2.55±3.71% (p=0.4103). However, U-74389G administration and reoxygenation time together kept significantly increased the predicted MPV levels by 7.09±1.91% (p=0.0005).
ConclusionsU-74389G administration whether it interacted or not with reoxygenation time kept significantly increased the predicted MPV levels. This finding has great clinical interest in blood clotting and coagulation pathophysiology.
Transient or permanent damage with serious implications on adjacent organs and systems may be due to tissue hypoxia – reoxygenation (HR). The use of U-74389G in HR has been a challenge for many years. However, although the progress was significant, several practical affairs have not been clarified. They include: (a) how potent U-74389G should be (b) when should it be administered and (c) at what optimal dose U-74389G should be administered. The promising effect of U-74389G in tissue protection has been noted in several HR studies. U-74389G or also known as 21-[4-(2,6-di-1-pyrrolidinyl-4-pyrimidinyl)-1-piperazinyl]-pregna-1,4,9(11)-triene-3,20-dione maleate salt is an antioxidant which prevents both arachidonic acid-induced and iron-dependent lipid peroxidation.1 It protects against ischemia – reperfusion (IR) injury in organs such as animal hearts, livers and kidneys. These membrane-associating antioxidants are particularly effective in preventing permeability changes in brain microvascular endothelial cells monolayers.2 A meta-analysis of 25 published seric variables, as WBC, RBC and platelet counts, hematocrit, hemoglobin, MCH, MCHC, RbcDW, platelet-crit, PDW, glucose, creatinine, uric acid, total protein, γGT, ALP, ACP, CPK, LDH, sodium, potassium, chloride, calcium, phosphorus and magnesium levels coming from the same experimental setting, enhanced by 0.48±17.28% (p-value=0.2377) their total catabolism after U-74389G administration for the same endpoints.7,8 The studied molecule U-74389G belongs to a wider family of other similar antioxidant molecules; all used in several published trials.
Mean platelet volume (MPV) is a machine-calculated measurement of the average size of platelets found in blood and is typically included in blood tests as part of the complete blood count one. Since the average platelet size is larger when the body is producing increased numbers of platelets, the MPV test results can be used to make inferences about platelet production in bone marrow or platelet destruction problems. MPV is higher when there is destruction of platelets. This may be seen in inflammatory bowel disease,3 immune thrombocytopenic purpura (ITP), myeloproliferative diseases and Bernard–Soulier syndrome. It may also be related to pre-eclampsia and recovery from transient hypoplasia.4 Abnormally low MPV values correlate with thrombocytopenia when it is due to impaired production as in aplastic anemia. In addition, low MPV, can correlate with abnormally small platelet size, sometimes a symptom of a spectrum referred to as Wiskott–Aldrich Syndrome,5 caused by a genetic mutation of the WAS gene. A typical range of platelet volumes is 9.7–12.8 femtolitre (fL), equivalent to spheres 2.65–2.9μm in diameter. Normal range is given as 7.5–11.5fL.6 The aim of this experimental study was to examine the effect of the antioxidant drug “U-74389G” on rat model and particularly in a hypoxia-reoxygenation HR protocol. The effects of that molecule were studied by measuring blood MPV levels.
Materials and methodsAnimal preparationThis biomedical research was licensed by Veterinary Address of East Attiki Prefecture based on 3693/12-11-2010 & 14/10-1-2012 decisions. All substances, consumables and equipment were a grant of Experimental Research Centre of ELPEN Pharmaceuticals Co. Inc. S.A. at Pikermi, Attiki. Appropriate humanistic care was adopted for Albino female Wistar rats. Pre-experimental normal housing included ad libitum diet in laboratory for one week. Animals’ prenarcosis was preceded of continuous intra-experimental general anesthesia,7,8 oxygen supply, electrocardiogram and acidometry. Euthanasia did not permit post-experimental awakening and preservation of animals. Rats were randomly delivered to four experimental groups by 10 animals in each one, using following protocols of HR: Hypoxia for 45min followed by reoxygenation for 60min (group A); hypoxia for 45min followed by reoxygenation for 120min (group B); hypoxia for 45min followed by immediate U-74389G intravenous (IV) administration and reoxygenation for 60min (group C); hypoxia for 45min followed by immediate U-74389G IV administration and reoxygenation for 120min (group D). The dose of U-74389G was 10mg/kg body mass of animals. Hypoxia was caused by laparotomic clamping inferior aorta over renal arteries with forceps for 45min. The clamp removal re-established the inferior aorta patency and restored reoxygenation. U-74389G was administered at the time of reperfusion; through catheter of inferior vena cava. The MPV levels were determined at 60th min of reoxygenation (for A and C groups) and at 120th min of reoxygenation (for B and D groups). The sampling was performed after vena cava venipuncture by filling a 2cc dimpled control stroke syringe with pre-set volume for withdrawal and sterile insulin needle. Then, the sample was transferred to vacuum blood collection tube (disposable vacutainer) of 2ml containing K2EDTA, the “anticoagulant of choice in specimen collection and blood cell features counting” according to both NCCLS and the International Council for Standardization in Hematology. MPV levels measurements were performed by Nihon Kohden celltac a MEK-6450 K automatic hematology analyzer with pre-set rat type and cyanide-free reagents. Fourty female Wistar albino rats were used (mean weight 231.875g [Standard Deviation (SD): 36.59703g], with minimum weight 165g and maximum weight 320g. Rats’ weight could be potentially a confusing factor, e.g. more obese rats to have higher MPV levels. This assumption was also investigated.
Control groups20 control rats (mean mass 252.5g [SD: 39.31988g]) experienced hypoxia for 45min followed by reoxygenation.
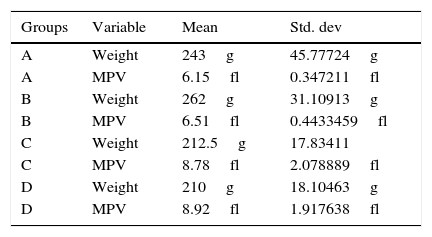
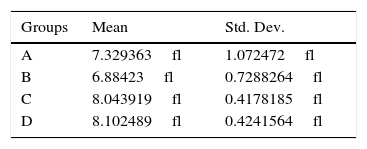
Group AReoxygenation lasted for 60min (n=10 controls rats) mean mass 243g [SD: 45.77724g], mean MPV levels 6.15fl [SD: 0.347211fl] (Table 1).
Weight and mean platelet volume levels and Std. Dev. of groups.
| Groups | Variable | Mean | Std. dev |
|---|---|---|---|
| A | Weight | 243g | 45.77724g |
| A | MPV | 6.15fl | 0.347211fl |
| B | Weight | 262g | 31.10913g |
| B | MPV | 6.51fl | 0.4433459fl |
| C | Weight | 212.5g | 17.83411 |
| C | MPV | 8.78fl | 2.078889fl |
| D | Weight | 210g | 18.10463g |
| D | MPV | 8.92fl | 1.917638fl |
MPV, mean platelet volume; Std. Dev, standard deviation.
Reoxygenation lasted for 120min (n=10 controls rats) mean mass 262g [SD: 31.10913g], mean MPV levels 6.51fl [SD: 0.4433459fl] (Table 1).
Lazaroid (L) group20L rats (mean mass 211.25g [SD: 17.53755g] experienced hypoxia for 45min followed by reoxygenation in the beginning of which 10mg U-74389G/kg body weight were IV administered.
Group CReoxygenation lasted for 60min (n=10L rats) mean mass 212.5g [SD: 17.83411g], mean MPV levels 8.78fl [SD: 2.078889fl] (Table 1).
Group DReoxygenation lasted for 120min (n=10L rats) mean mass 210g [SD: 18.10463g], mean MPV levels 8.92fl [SD: 1.917638fl] (Table 1).
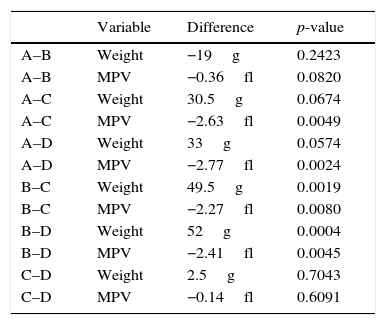
Statistical significance of mean values difference for groups (DG) after statistical standard t test application.
| Variable | Difference | p-value | |
|---|---|---|---|
| A–B | Weight | −19g | 0.2423 |
| A–B | MPV | −0.36fl | 0.0820 |
| A–C | Weight | 30.5g | 0.0674 |
| A–C | MPV | −2.63fl | 0.0049 |
| A–D | Weight | 33g | 0.0574 |
| A–D | MPV | −2.77fl | 0.0024 |
| B–C | Weight | 49.5g | 0.0019 |
| B–C | MPV | −2.27fl | 0.0080 |
| B–D | Weight | 52g | 0.0004 |
| B–D | MPV | −2.41fl | 0.0045 |
| C–D | Weight | 2.5g | 0.7043 |
| C–D | MPV | −0.14fl | 0.6091 |
MPV, mean platelet volume; DG, difference for groups.
Every weight and MPV level group was compared with each other by statistical standard t-tests (Table 3). Any significant difference among MPV levels, was investigated whether owed in any potent significant weight one. The application of generalized linear models (glm) with dependant variable the MPV levels was followed. The 3 independent variables were the U-74389G or no drug administration, the reoxygenation time and both variables in combination. Inserting the rats’ weight also as an independent variable at glm analysis, a significant relation resulted in (p=0.0033), so as to further investigation was needed. The predicted MPV values for weight were calculated and are depicted at Table 4. The differences between predicted MPV values groups calculated by standard t test are depicted at Table 5. The application of generalized linear models (glm) with dependant variable the predicted MPV levels was followed. The 3 independent variables were the same as in the first glm analysis.
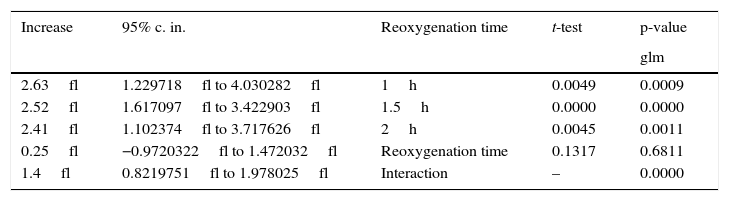
The increasing influence of U-74389G in connection with reoxygenation time.
| Increase | 95% c. in. | Reoxygenation time | t-test | p-value |
|---|---|---|---|---|
| glm | ||||
| 2.63fl | 1.229718fl to 4.030282fl | 1h | 0.0049 | 0.0009 |
| 2.52fl | 1.617097fl to 3.422903fl | 1.5h | 0.0000 | 0.0000 |
| 2.41fl | 1.102374fl to 3.717626fl | 2h | 0.0045 | 0.0011 |
| 0.25fl | −0.9720322fl to 1.472032fl | Reoxygenation time | 0.1317 | 0.6811 |
| 1.4fl | 0.8219751fl to 1.978025fl | Interaction | – | 0.0000 |
c. in., confidence interval.
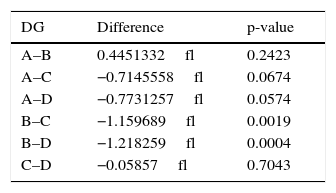
Statistical significance of predicted mean platelet volume values difference for groups (DG) after statistical standard t test application.
| DG | Difference | p-value |
|---|---|---|
| A–B | 0.4451332fl | 0.2423 |
| A–C | −0.7145558fl | 0.0674 |
| A–D | −0.7731257fl | 0.0574 |
| B–C | −1.159689fl | 0.0019 |
| B–D | −1.218259fl | 0.0004 |
| C–D | −0.05857fl | 0.7043 |
DG, difference for groups.
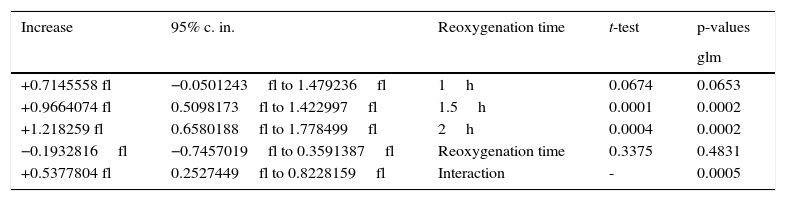
The first glm resulted in: U-74389G administration kept significantly increased the MPV levels by 2.52fl [1.617097–3.422903fl] (p=0.0000). This finding was in accordance with the results of standard t-test (p=0.0000). Reoxygenation time kept non-significantly increased the MPV levels by 0.25fl [−0.9720322fl to 1.472032fl] (p=0.6811), also in accordance with standard t-test (p=0.1317). However, U-74389G administration and reoxygenation time together kept significantly increased the MPV levels by 1.4fl [0.8219751–1.978025fl] (p=0.0000). Reviewing the above and Table 2, Table 3 sums up concerning the increasing influence of U-74389G in connection with reoxygenation time. The second glm resulted in: U-74389G administration kept significantly increased the predicted MPV levels by 0.9664073fl [0.5098173–1.422997fl] (p=0.0001). This finding was in accordance with the results of standard t-test (p=0.0002). Reoxygenation time kept non-significantly decreased the predicted MPV levels by 0.1932816fl [−0.7457019fl to 0.3591387fl] (p=0.4831), also in accordance with standard t-test (p=0.3375). However, U-74389G administration and reoxygenation time together kept significantly increased the predicted MPV levels by 0.5377804fl [0.2527449–0.8228159fl] (p=0.0005). Reviewing the above and Table 5, Tables 6 and 7 sum up concerning the increasing influence of U-74389G in connection with reoxygenation time on predicted MPV levels.
The predicted increasing influence of U-74389G in connection with reoxygenation time.
| Increase | 95% c. in. | Reoxygenation time | t-test | p-values |
|---|---|---|---|---|
| glm | ||||
| +0.7145558 fl | −0.0501243fl to 1.479236fl | 1h | 0.0674 | 0.0653 |
| +0.9664074 fl | 0.5098173fl to 1.422997fl | 1.5h | 0.0001 | 0.0002 |
| +1.218259 fl | 0.6580188fl to 1.778499fl | 2h | 0.0004 | 0.0002 |
| −0.1932816fl | −0.7457019fl to 0.3591387fl | Reoxygenation time | 0.3375 | 0.4831 |
| +0.5377804 fl | 0.2527449fl to 0.8228159fl | Interaction | - | 0.0005 |
c. in., confidence interval.
The (%) predicted increasing influence of U-74389G in connection with reoxygenation time.
| Increase | ±SD | Reoxygenation time | p-values |
|---|---|---|---|
| +9.29% | ±5.07% | 1h | 0.0663 |
| +12.77% | ±3.07% | 1.5h | 0.0001 |
| +16.25% | ±3.81% | 2h | 0.0003 |
| −2.55% | ±3.71% | Reoxygenation time | 0.4103 |
| +7.09% | ±1.91% | Interaction | 0.0005 |
SD, standard deviation.
Hypoxia may influence MPV levels. Ghahremanfard et al. associated9 MPV levels with first acute ischemic stroke severity grading (p=0.012). Isik et al. correlated10 the MPV levels ranged from 6.5fL to 11.7fL, with slow coronary flow (p=0.03). Balcik et al. measured11 MPV values significantly higher at 24h after progression of ischemic stroke (p=0.001) than control participants. Damaske et al. indicated12 increased MPV levels in slow coronary flow phenomenon than control ones. Ertaş et al. observed13 an increase in MPV levels in chronic heart failure as an independent predictor of mortality than (p=0.004) in control group. Açikgöz et al. noted14 significantly higher MPV values in ischemic cardiomyopathies than control ones (p<0.001). Ntaios et al. related15 the significantly increased MPV levels in acute ischemic non-lacunar stroke with poor functional outcome 24h after. Slavka et al. indicated16 that an increased MPV value (≥11.01fL) creates higher risk for ischemic heart disease. Ilhan et al. found17 significant differences of MPV levels in symptomatic lacunar stroke infarct group than control one (p<0.01). Mayda-Domaç et al. associated18 the MPV levels as independent risk factors with ischemic, hemorrhagic stroke and a bad prognosis (p=0.007). Pikija et al. associated19 higher MPV levels with larger infarct volume and greater risk of late death/dependence rates (p=0.048) in acute ischemic stroke. Durmaz et al. found20 MPV levels higher in the aspirin non-responder stable coronary artery disease patients than responder ones. Yetkin21 and Muscari et al. associated22 MPV levels with ischemic electrocardiographic changes in elderly population. Bitigen et al. found23 significantly higher isolated coronary artery ectasia (CAE) MPV values than control ones (p<0.0001). Ihara et al. profoundly related24,25 MPV levels in patients with ischemic heart disease but non in angiographically negative group than in positive one. Nadar et al. found26 lower MPV levels in acute stroke and on follow-up, but higher mean MPV ones in uncomplicated hypertensive patients than control ones. McCabe et al. found27 reticulated platelets larger than more mature ‘non-reticulated’ platelets in ischemic cerebrovascular disease (p<0.01). Greisenegger et al. associated28 the MPV levels with higher risk of severe stroke and worse outcome (p=0.013). O’Malley et al. found29 MPV levels higher 48h after an acute stroke (p<0.001), in available survivors and in both acute and chronic (>6 months) phase of cerebral ischemia preceded of vascular event. Kristensen et al. assessed30 the increased MPV level as risk factor for acute phase of MI patients and death. Legrand et al. described31 the in vitro platelet fragmentation in the circulation of patients with ischemic cerebrovascular disease. Dudley et al32 distinguished primary thrombocythemia from reactive thrombocytosis by MPV levels. Although the fragmented discussion with the successive analysis of more than 25 studies, the constant outcome is the narrow association of high MPV values with ischemia proved across all of them. The MPV values role cannot be dissociated with platelet count, coagulation physiology and blood clotting. Indeed, U-74389G administration decreases the platelet count short-term by different significance levels, exerting a potent beneficial effect on the range of all thrombotic situations. Furthermore, Fang et al. associated33 the increase in MPV values with increased platelet distribution, prothrombin time, activated partial thromboplastin time, thrombin time, prothrombin ratio, international normalized ratio, blood clotting time and platelet anti-aggregation, but with decreased PT%, fibrinogen level, platelet aggregation (p<0.05), platelet count and platelet-crit in rats. Qureshi et al. demonstrated34 a dose-dependent anticoagulation effect with significantly (p<0.0002) prolonged coagulation time, bleeding time, prothrombin time, activated partial thromboplastin time, international normalized ratio and MPV values, while plasma calcium concentration and mean platelet count were significantly decreased (p<0.001). Yuce et al. considered the35 larger platelets hemostatically more reactive than normal size ones, increasing the propensity to thrombosis. Ouyang et al. showed36 that the plasma clotting time induced by cryopreserved fresh platelet-rich plasma was significantly shorter than that induced by fresh platelet-rich plasma, evaluating the MPV variable. Teitel identified the aetiological mechanism as hypoproliferative or consumptive37 for impaired fibrin clot formation and delayed bleeding after primary haemostasis characteristic of hyperfibrinolysis; after examination of the MPV morphology. van der Planken et al. found38 no difference in MPV between diabetic and control platelet-rich plasma. The outer layer of platelet phospholipid membrane is more procoagulant than in the quiescent state, stimulating thrombin formation in plasma. This platelet function is called platelet procoagulant activity. Gunsilius et al. calculated39 the VEGF content per 109 platelets at 2.51±2.39pg and as dependent on the MPV values. Van der Planken et al. associated40 the higher MPV values of buffy coat method (BCM) concentrates (p<0.0005) with higher platelet procoagulant activity than the MPV ones of platelet-rich method concentrates at any storage day. Nelson et al. measured41 significantly increased MPV values (p<0.01); shortened prothrombin time by 1s (p<0.01) during the consumption period of dietary n−3 fatty acids salmon diet. van Wersch et al. found42 a significant decrease of the platelet count, MPV levels and total thrombocytic clotting capacity. Mammen et al. found43 a marked post-operational increase in all clotting factors and measured near normal levels 48h after cardiopulmonary bypass operation. Platelet counts remained low, however; the decrease in factors rarely dropped so as to compromise hemostasis (<30%). Although antithrombin levels decreased below 60%, no difficulties with heparinization were encountered. A significant drop in MPV levels was recorded only after protamine administration; restored 24h post-operatively. The MPV levels are considered a rather insignificant variable when evaluating the clotting situations. The above literature has shown that the role of MPV variable is not subordinate than other platelet characteristics and should be taken into consideration when assessing the clotting profiles. Although the information given by all these separate studies is constant, even in combination with platelet count, coagulation physiology and blood clotting; it cannot be integrated, it is ambiguous and not clear: while the MPV augmentations increase the hemostatic reactivity and associate the ischemic situations, the coagulation is attenuated. The U-74389G administration seems to enhance this phenomenon since it increases the MPV levels. How ischemia can compromise with anticoagulation by the same drug has difficult answer. Nevertheless, the investigation of the clotting process dominant direction is very complicated studied individually only by the MPV variable. This direction cannot be predicted by any critical analysis, perhaps due to the size, limits and constrains of the present experiment. However, the effect of U-74389G at other platelet features such as the platelet counts is attenuating, causing also anticoagulation trend. The resultant effect of U-74389G on the clotting tendency of blood can be determined only by the most appropriate assays evaluating the extrinsic pathway of coagulation. These assays which unpleasantly were not included in the present experiment are the prothrombin time (PT), the prothrombin ratio (PR) and the international normalized ratio (INR) that must be evaluated in a future experiment.
ConclusionU-74389G administration whether it interacted or not with reoxygenation time kept significantly increased the predicted MPV levels in the short term prospect of this experiment. However, the total clotting effect of U-74389G can be revealed only after the PT, PR and the INR evaluation inclusion in a future experiment.
Conflicts of interestThe authors declare no conflicts of interest.
This study was funded by Scholarship by the Experimental Research Center ELPEN Pharmaceuticals (E.R.C.E.), Athens, Greece. The research facilities for this project were provided by the aforementioned institution.