

The onset and exacerbation of allergic diseases and asthma have been associated with poor indoor air quality (IAQ) inside classrooms.
ObjectiveThe aim was to investigate how IAQ changed in primary schools after applying indoor air quality recommendations, and to explore how these changes influenced allergic sensitization on children.
MethodsTotal volatile organic compounds, PM2.5, PM10, CO2, CO, temperature and relative humidity in the indoor and outdoor air of 20 primary schools were measured in 2010–2012. The school staff received instructions on how to improve IAQ in accordance with the dedicated guidelines. Atopy status was assessed in children attending the participating classrooms by skin prick tests and exhaled nitric oxide. A follow-up sampling campaign was performed in 2014–2015 in the same schools.
ResultsIndoor PM2.5 and PM10 concentrations were approximately 40% lower in the follow-up measurements (p<0.05). There were no significant differences regarding outdoor PM concentrations. Nevertheless, PM levels from the follow-up campaign still exceeded the reference value established by Portuguese legislation. Moreover, there were no significant differences in atopic prevalence and FENO values between the campaigns.
ConclusionThese findings suggest that adoption of the recommendations based on the SINPHONIE guidelines was particularly successful in reducing PM2.5 and PM10 in primary schools of Porto. Nevertheless, the schools failed to reduce the levels of other IAQ pollutants, as well as the prevalence of atopic disease.
School classrooms are one of the indoor environments where children spend most of their time.1 Indoor air quality (IAQ) in schools has thus been recognized as one of the key influences on children's health, given the high potential for a large exposure to indoor air contaminants in that environment. The development and exacerbation of allergic sensitization, asthma, rhinitis or rhinoconjunctivitis have all been associated with poor IAQ inside classrooms2,3 and, according to the World Health Organization (WHO), 36% of respiratory diseases and 22% of chronic diseases are associated with a poor indoor environment.4
In 2010, to further investigate IAQ in schools, the SINPHONIE project was conducted. It comprised 36 environment and health institutions from 25 countries, and assessed several IAQ parameters in more than 100 European schools. These parameters included total volatile organic compounds (TVOC), fine and coarse particulate matter (PM2.5 and PM10, respectively), carbon monoxide (CO), carbon dioxide (CO2), temperature, and relative humidity.5 The results of the SINPHONIE project led to production of a set of Guidelines for healthy environments within European schools6 that, as its name suggests, aimed at improving IAQ in schools.
During the SINPHONIE project, a total of 20 schools were audited in Porto, Portugal, and each school received a report with the audit's results, along with specific recommendations based on the SINPHONIE guidelines on how to improve IAQ. For instance, if the classrooms presented CO2 levels above 1250ppm due to air renovation deficiency, the report recommended that school staff should open windows and promote ventilation during recess periods. As another example, if PM concentrations in a classroom were very high and the blackboard was identified as a main emission source, the recommendations would suggest a more frequent blackboard cleansing with a wet cloth, to prevent particle suspension. However, there was no supervision to verify if the recommendations were correctly adopted.
The aim of this study was to investigate (a) if and how IAQ improved in the audited schools in Porto, after the implementation of recommendations; and (b) to compare the atopic status of the children attending the schools between both campaigns.
Materials/methodsStudy designAfter getting the consent from Porto City Hall and schools’ principals, 19 of the 20 schools that participated in the SINPHONIE project in Porto were included in this follow-up study. The missing school has since been closed due to extremely high concentrations of indoor radon and thus was not considered for the follow-up. For convenience reasons, the SINPHONIE and the follow-up campaign shall be abbreviated in future references as T1 and T2, respectively.
In each campaign, children attending the sampled classrooms were invited to participate in a clinical assessment and an informed consent request was sent to their legal guardians in accordance with the Helsinki declaration.
Sampling campaignT1 campaign occurred from 2011 to 2012, while T2 occurred from 2014 to 2015. In order to replicate the auditing conditions, the T2 campaign was similarly conducted during the heating season, i.e. during winter. In each school, 2 to 4 classrooms and 1 outdoor location were selected for IAQ assessment, resulting in a total of 67 classrooms and 19 outdoor spaces. Preference was given to classrooms with high densities of occupation (occupant/m2) and fully occupied throughout the week. Identically to T1, TVOC, PM2.5, PM10, CO, CO2, temperature and relative humidity were sampled. Safe and childproof sampling locations were selected, complying with ISO 16000-1.7 Indoor samples were collected near children's breathing zone (approximately 0.7–1.5m above ground) and no closer than 1m to a wall, window, door or active heating system. The instruments were placed as far away as possible from the blackboard, when applicable. The sampling process was supervised by a researcher, avoiding disturbances of the normal classroom activities.
Volatile organic compounds were collected by passive diffusion, during 5 days per classroom/outdoor (from Monday to Friday), using stainless-steel sorption tubes containing a single-bed Tenax® TA (60/80) matrix. A field blank was employed in every school to control contamination during transport and sampling. All samples were taken in duplicate to verify the reproducibility of measurements.
Portable TSI DustTrak DRX photometers (model 8533, TSI Inc.) were used for the assessment of PM2.5 and PM10 concentrations. This equipment measures particles with a laser photometer based on light scattering principle. The measuring range of the equipment is 1–150×103μg/m3 with accuracy of ±0.1% for 1μg/m3, operating with a flow rate of 3.0 l/min using a built-in diaphragm pump powered by an internal battery. Instruments were installed inside each classroom and were set to continuously measure PM during at least one school day (7h, avoiding Mondays and Fridays). Logging intervals were set to 1min. Outdoor PM2.5 and PM10 were sampled by a similar instrument. The respective instruments were installed in the school playgrounds, at a height of 1–1.2m and protected from rain. The instrument setup was the same as the one used indoors. The photometers were calibrated externally, once per year, at the manufacturer.
CO, CO2, temperature and relative humidity levels were recorded continuously for 24h per day during 5 days per week (from Monday to Friday) in each sampling location. These parameters were all measured using the IAQ-CALC monitor (model 7545, TSI, Inc.). The equipment combined an electrochemical sensor for CO, an infrared non-dispersive sensor for CO2, a thermistor for measuring temperature in a range from 0 to 60°C with an accuracy of ±0.6°C, and a thin-film capacitive sensor for relative humidity (range of 5–95%; accuracy ±3.0%). Logging intervals were set to 5min.
Clinical assessmentParticipating children performed skin prick tests (SPT) and had their exhaled level of nitric oxide (FENO) measured by a trained professional.
The volunteers were submitted to SPT on their forearm using a QuickTestTM applicator containing house dust mite, mix of weeds, mix of grasses, cat dander, dog dander, Alternaria alternata, negative control, and a positive control consisting of histamine at 10mg/ml, all belonging to the same batch (Hall Allergy, Netherlands). Results were read 15min afterwards and atopy was defined by a positive SPT to at least one of the allergens.8 If patients were on tricyclic antidepressants or antihistamines or if they had applied any product containing corticosteroids on the skin within the previous 7 days, skin prick tests would be postponed.
The NObreath (Bedfont Scientific Ltd., UK) was used to perform the FENO assessment and the results were expressed as parts per billion (ppb). The FENO values were stratified according to the official ATS guidelines for children.9
Laboratory analysisThe stainless-steel Tenax tubes were thermally desorbed (Dani STD 33.50) and quantified using a non-polar column by gas chromatography (Agilent Technologies 6890N) coupled to a mass spectrometry detector (Agilent Technologies 5973), according to ISO 16000-6.10 TVOC concentrations were quantified using toluene response factor, and were calculated as the sum of VOC eluting between hexane and hexadecane (included), expressed as toluene.
Statistical analysisStatistical analysis was performed using IBM® SPSS® version 23. The Kolmogorov-Smirnov test was used to check if data was normally distributed. Since non-Gaussian distributions were observed for all continuous variables other than age, non-parametric tests were selected for inferential statistics. Age between both campaigns was compared using the t-student test, while the Wilcoxon signed ranks test was used to compare non-parametric data between campaigns.
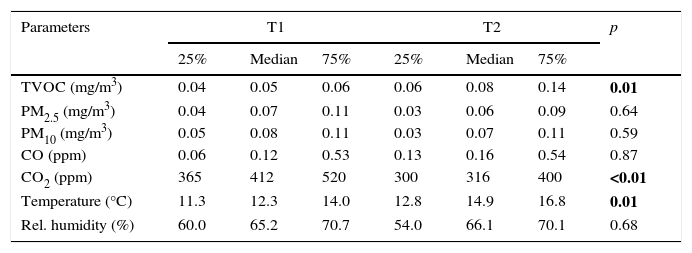
ResultsWhen comparing outdoor air parameter concentrations in T1 and T2, the results showed that certain measured parameters were significantly different between the two campaigns (Table 1). For instance, outdoor CO2 concentrations were significantly higher in T1 when compared to T2 (p<0.01). Conversely, temperature and TVOC increased significantly in T2 (p=0.01, for both cases). No significant differences were found between T1 and T2 in regards to outdoor CO, relative humidity, PM2.5 and PM10.
Outdoor concentrations of air parameters measured in T1 and T2. “p” values in bold correspond to statistically significant differences between the two campaigns (Wilcoxon signed ranks test).
| Parameters | T1 | T2 | p | ||||
|---|---|---|---|---|---|---|---|
| 25% | Median | 75% | 25% | Median | 75% | ||
| TVOC (mg/m3) | 0.04 | 0.05 | 0.06 | 0.06 | 0.08 | 0.14 | 0.01 |
| PM2.5 (mg/m3) | 0.04 | 0.07 | 0.11 | 0.03 | 0.06 | 0.09 | 0.64 |
| PM10 (mg/m3) | 0.05 | 0.08 | 0.11 | 0.03 | 0.07 | 0.11 | 0.59 |
| CO (ppm) | 0.06 | 0.12 | 0.53 | 0.13 | 0.16 | 0.54 | 0.87 |
| CO2 (ppm) | 365 | 412 | 520 | 300 | 316 | 400 | <0.01 |
| Temperature (°C) | 11.3 | 12.3 | 14.0 | 12.8 | 14.9 | 16.8 | 0.01 |
| Rel. humidity (%) | 60.0 | 65.2 | 70.7 | 54.0 | 66.1 | 70.1 | 0.68 |
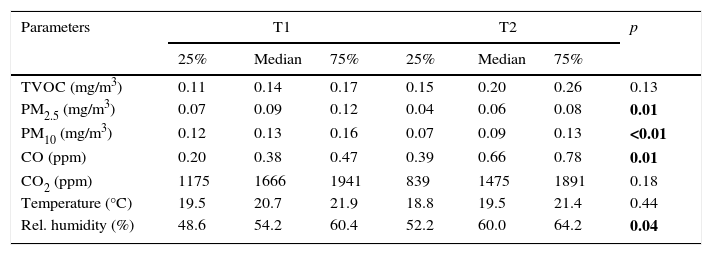
Regarding the indoor air, there were no significant changes in temperature between the two campaigns. Moreover, although there was a CO2 decrease and a TVOC increase during T2, these changes were also non-significant. However, significant differences were observed for other indoor air parameters (Table 2).
Indoor concentrations of air parameters measured in T1 and T2. “p” values in bold correspond to statistically significant differences between the two campaigns (Wilcoxon signed ranks test).
| Parameters | T1 | T2 | p | ||||
|---|---|---|---|---|---|---|---|
| 25% | Median | 75% | 25% | Median | 75% | ||
| TVOC (mg/m3) | 0.11 | 0.14 | 0.17 | 0.15 | 0.20 | 0.26 | 0.13 |
| PM2.5 (mg/m3) | 0.07 | 0.09 | 0.12 | 0.04 | 0.06 | 0.08 | 0.01 |
| PM10 (mg/m3) | 0.12 | 0.13 | 0.16 | 0.07 | 0.09 | 0.13 | <0.01 |
| CO (ppm) | 0.20 | 0.38 | 0.47 | 0.39 | 0.66 | 0.78 | 0.01 |
| CO2 (ppm) | 1175 | 1666 | 1941 | 839 | 1475 | 1891 | 0.18 |
| Temperature (°C) | 19.5 | 20.7 | 21.9 | 18.8 | 19.5 | 21.4 | 0.44 |
| Rel. humidity (%) | 48.6 | 54.2 | 60.4 | 52.2 | 60.0 | 64.2 | 0.04 |
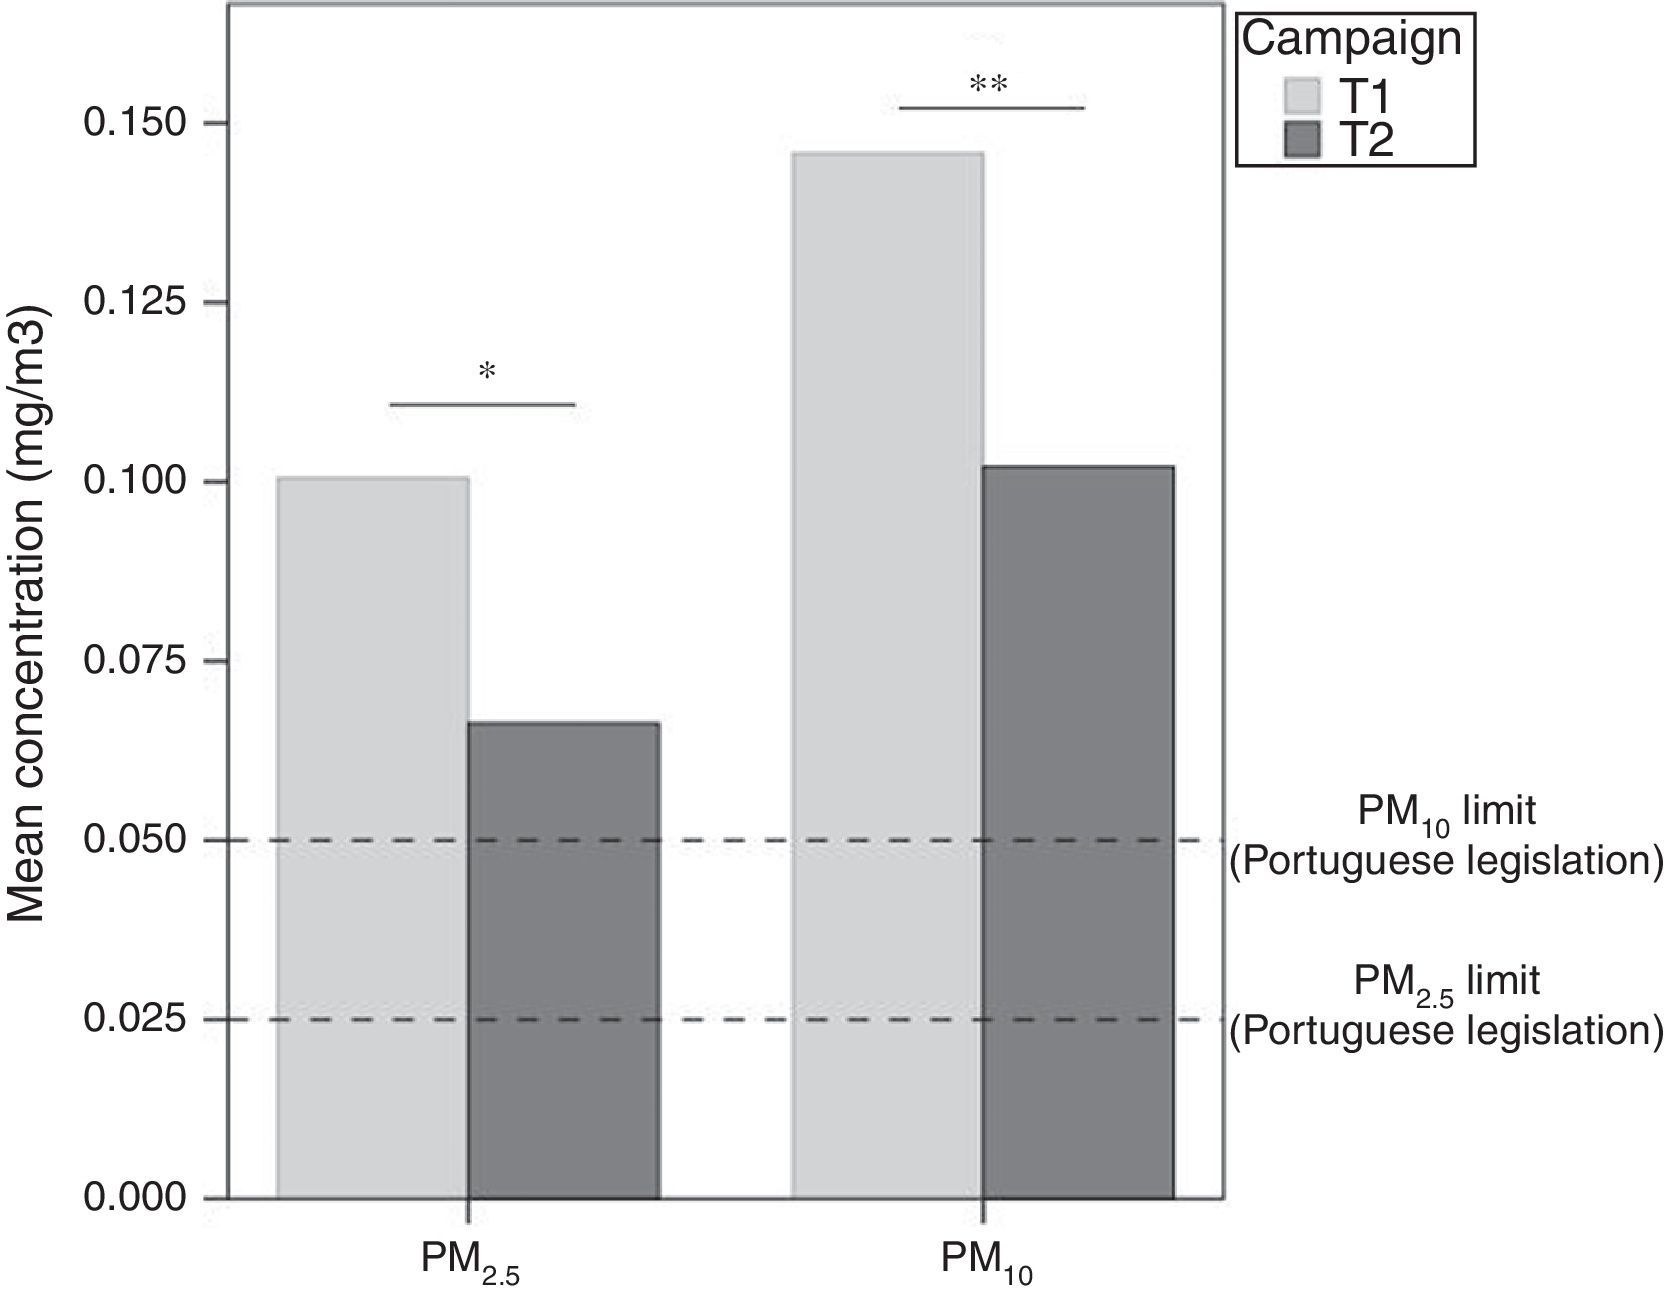
Indoor concentrations of CO and relative humidity increased significantly in T2 (p=0.01 and p=0.04, respectively), while PM2.5 and PM10 concentrations decreased significantly (p=0.01 and p<0.01, respectively), being approximately 40% lower when compared to T1. Nevertheless, the median PM2.5 and PM10 concentrations obtained in T2 (0.06 and 0.09mg/m3, respectively) still exceeded the safety limit established by the Portuguese legislation of 0.025mg/m3 for PM2.5 and 0.05mg/m3 for PM10.11Fig. 1 illustrates these results.
. *p=0.01; **p<0.01 (Wilcoxon signed ranks test).")
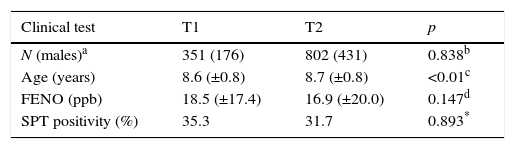
A total of 1580 and 1523 children were invited to participate in T1 and T2, respectively. FENO data was obtained for 351 children in T1 and 802 in T2. A total of 330 children performed SPT in T1 while 786 children performed SPT T2. There were no significant differences in gender between campaigns (p=0.838) but there were in age (p<0.01), although the means were quite similar (8.6±0.8 in T1 vs. 8.7±0.8 in T2). No significant differences were found in SPT positivity between campaigns (p>0.05), although the prevalence of allergic sensitization was higher in T1 when compared to T2 (35.3 and 31.7%, respectively). There were also no significant differences in FENO values between the campaigns (p>0.05). However, similar to SPT positivity, children in T1 presented higher levels of FENO when compared to children in T2 (18.5 and 16.9ppb, respectively). These results are presented in Table 3.
Summarized results of the clinical tests in T1 and T2. The presented “p” values represent the statistical significance of the comparisons between campaigns.
| Clinical test | T1 | T2 | p |
|---|---|---|---|
| N (males)a | 351 (176) | 802 (431) | 0.838b |
| Age (years) | 8.6 (±0.8) | 8.7 (±0.8) | <0.01c |
| FENO (ppb) | 18.5 (±17.4) | 16.9 (±20.0) | 0.147d |
| SPT positivity (%) | 35.3 | 31.7 | 0.893* |
Results are presented in mean (±SD) except if stated otherwise.
This study constitutes the first time that the impact of adopting the recommendations based on the guidelines for healthy environments within European schools was investigated. The results show how IAQ changed in schools after providing the aforementioned recommendations, while not disregarding the differences in the outdoor environment.
The most accentuated changes between campaigns were observed in indoor PM concentrations. Outdoor air is one of the most predominant sources of indoor PM.2,12 However, there were no significant differences in outdoor PM2.5 and PM10 concentrations between T1 and T2, strongly suggesting that the decrease in the follow-up may be associated with a change in indoor sources or occupants’ activities. Even considering possible confounding factors, such as the higher relative humidity in T2, the decrease in PM concentrations was highly significant. As previously mentioned, reduction of indoor sources is the most probable cause for this result and, although the implementation of the recommendations based on the SINPHONIE guidelines was not supervised, it is possible to assume that certain actions to reduce indoor PM2.5 and PM10, such as cleaning the chalk boards more frequently with a wet cloth to avoid re-suspension of particles, were taken into consideration. Unfortunately, the nature of the present study does not allow the identification of indoor PM sources, therefore it is not possible to ascertain which actions were responsible for the decrease of indoor PM2.5 and PM10 concentrations in the schools. Despite the significant reductions, median PM concentrations in T2 still exceeded the Portuguese legislation by 80 to 140%, suggesting that further recommendations and actions should be taken into consideration in order to enhance the improvement of IAQ. Moreover, it is important to point that outdoor PM concentrations also exceeded the WHO recommended limit in both T1 and T2,13 thus further efforts should be made to reduce outdoor emissions in order to prevent penetration of large concentrations of PM into the indoor environments.
Although no significant changes in TVOC concentrations were observed between T1 and T2, it is possible to notice a certain tendency for higher concentrations in the follow-up. The reason behind this slight increase may be associated with the significantly higher outdoor concentrations of TVOC in T2. Moreover, although indoor concentrations were considerably lower than the recommended value establish by the Portuguese legislation (600μg/m3)11, certain specific volatile organic compounds recognized by the WHO to be responsible for adverse health effects in high concentrations, such as benzene or toluene, may be increased in schools.13 Special attention should be given to these compounds in future studies in schools.
Despite outdoor CO2 concentrations being significantly lower in the second sampling campaign, indoor concentrations, a proxy for the ventilation rate, showed no significant changes and were still above the Portuguese legislated limit of 1250ppm. This suggests that ventilation in the classrooms may still be inadequate and CO2 levels are still a problem in schools. Furthermore, even though the recommendations underlined the importance of air renovation, it seems that the school staff's efforts were not sufficient to significantly reduce indoor CO2 concentrations. These results are in accordance with previous studies that identified similar problems concerning IAQ in schools.14–17 Interestingly, a study by Geelen et al., 2008, where several different approaches to reduce CO2 in schools (such as specific classroom-advice, CO2 warning devices and teaching packages based on ventilation recommendations) were investigated, showed that the interventions were unsuccessful in reducing indoor CO2 concentrations to levels below 1000ppm. Nevertheless, the authors showed that, to significantly improve air renovation in schools, CO2 warning device and teaching package combined with a class-specific ventilation advice are effective tools, while giving the ventilation advice is not effective on its own.18 The present study supports these results, suggesting that the school staff tend to disregard the recommendations that aim to promote proper ventilation in classrooms. Moreover, inadequate ventilation is a risk factor for increased concentrations of indoor air pollutants, such as PM or TVOC. Since indoor CO2 concentrations were non-significantly different between T1 and T2, any alteration in the concentrations of indoor air parameters in the follow-up were most probably not significantly associated with changes in air renovation. However, this cannot be completely verified since ventilation rates were not measured in T1 and, therefore, CO2 concentrations are the most approximate indicator.
The indoor median concentrations of CO measured in both campaigns (0.38 and 0.66 in T1 and T2, respectively) were far from the protection limit of 9.00ppm established by the Portuguese legislation,11 and were, thus, not problematic. Despite this, a significant increase was observed in T2. Carbon monoxide is one of the most characteristic traffic pollutants, usually observed in urban areas.15 However, in the present study, the median outdoor concentrations of CO were lower than those indoors in both campaigns, suggesting the existence of indoor sources such as combustion activity, natural plant decay or simply the occupants’ exhaled breath which may have been further aggravated by low ventilation rates in the classroom.19,20
The measured median outdoor temperature values suggest that T1 had a colder heating season than T2, although the relative humidity was not significantly different between the two campaigns. Regarding the indoor air, however, while temperature registered no significant changes, relative humidity was significantly higher in T2. This change in indoor relative humidity may not only influence the concentration of indoor air pollutants (i.e. number of particles in suspension), but may also affect the occupants’ perception of poor IAQ,21,22 as suggested by Feng et al. (1998) who showed that the perception of air quality is negatively associated with temperature and relative humidity. Therefore, since relative humidity was higher in T2, the school staff may have had a lower perception of IAQ when compared to T1, which could have contributed in a minor extent to some disregarding of the recommendations by the school occupants.
In regards to the clinical trials, the participation rates were considerably higher in T2 when compared to T1 (228–238% higher). The reason behind this increase in participation rates is probably associated with an enhanced awareness of the parents to the problems of poor IAQ in schools in T2. Moreover, the fact that one of the schools sampled in T1 was closed due to IAQ issues may have increased the parents’ concern to this issue, thus resulting in a higher number of legal guardians consenting their children to participate in the second campaign. While there were no significant differences in FENO values and SPT positivity between the campaigns, both parameters were lower in T1. This is an interesting result since this tendency for a lower prevalence of atopic sensitization overlapped with an improvement of the IAQ. However, it is not possible to establish a causal relation.
The present study has some limitations mainly involving bias produced by the presence of some confounding factors. The most relevant confounding factor is the ventilation rate, which was not supervised in either campaign, thus CO2 levels were used as the most appropriate indicator. Additionally, the observed differences in outdoor air between both campaigns may have had an impact on the IAQ. Finally, the impact of a specific recommendation on IAQ could not be verified since no source apportionment analysis was conducted in the present study, therefore it is not possible to identify which recommendations or guidelines were truly important in the improvement of IAQ in the schools. A more detailed analysis, with a more extensive number of building/classroom characteristics, could also help suggesting specific measures of prevention. However, the high number of schools re-audited in the follow-up (95%), the rigorous mimicry of the baseline audit methodology, as well as the large amount of participants and data collected, all count as strengths that support the study results.
ConclusionsThe present work investigated how SINPHONIE-based recommendations contributed to improving IAQ in schools in a follow-up study. Moreover, occupant's sensitization status was also assessed. The most significant results pointed out that primary schools were able to reduce indoor PM2.5 and PM10 concentrations. This significant decrease in PM was most likely caused by changes in occupational activities presumably associated with the recommendations transmitted to the school staff. Nevertheless, median indoor PM2.5 and PM10 still exceeded the Portuguese legislation by at least 80%, and the levels of other IAQ parameters, such as of CO2, remained high, indicating that adequate ventilation was not guaranteed. This suggests that the use of guidelines for healthy environments within European schools contributed to the improvement of IAQ in schools, but further work is required in order to minimize the adverse health effects on children, teachers and school staff associated with poor IAQ.
Conflicts of interestThe authors declare no conflicts of interest.
FundingThis work was financed by the HEBE project (NORTE-01-0145-FEDER-000010), and by Fundação para a Ciência e Tecnologia through the ARIA project (PTDC/DTP-SAP/1522/2012, FCOMP-01-0124-FEDER-028709) and through the scholarships SFRH/BD/108605/2015, SFRH/BD/112269/2015 and SFRH/BPD/105100/2014.
The following are the supplementary data to this article: