


Verbal and visuospatial span, Letter-Number Sequencing (LNS), Trail Making Test (TMT), and Symbol Digit Modalities Test (SDMT) are frequently used in clinical practice to assess attention, executive functions and memory.
In the present study, as part of the Spanish normative studies of NEURONORMA young adults Project, normative data adjusted by age and education are provided for Digits, Corsi Block-Tapping Task, LNS, TMT, and SDMT.
Subjects and methodsThe sample consisted of 179 participants from 18 to 49 years old, who were cognitively normal. Tables to convert raw scores to scaled scores are provided. Age and education adjusted scores are provided by applying linear regressions.
ResultsEducation affected scores in most of the attention tests; age was found to be related to the visuospatial span and to speed of visuomotor tracking, and there was no relationship as regards sex.
ConclusionsThe current normative data should provide clinically useful data for evaluating young Spanish adults.
El span verbal y visuoespacial, el test Letter-Number Sequencing (LNS), el Trail Making Test (TMT) y el Symbol Digit Modalities Test (SDMT) son pruebas ampliamente utilizadas en la práctica clínica para explorar la atención, las funciones ejecutivas y la memoria.
ObjetivoEn el presente estudio, como parte de los estudios normativos españoles del Proyecto NEURONORMA jóvenes, se aportan datos normativos ajustados por edad y escolaridad para los Dígitos, los Cubos de Corsi, la LNS, el TMT y el SDMT.
Sujetos y métodosLa muestra está formada por 179 participantes, cognitivamente normales, de entre 18 y 49 años de edad. Se aportan tablas para convertir las puntuaciones brutas en escalares y tablas con los ajustes pertinentes por edad y escolaridad a partir de una regresión lineal.
ResultadosSe observa influencia de la escolaridad en la mayoría de los tests de atención, así como efecto de la edad en el span visuoespacial y en la velocidad de rastreo visuomotor. El efecto del género es mínimo.
ConclusionesLas normas obtenidas aportan datos de gran utilidad clínica para la evaluación de población adulta joven española.
The NEURONORMA project (NN) is a multicentre study gathering normative data from a Spanish population older than 49.1 The present study, the NEURONORMA young adults project (NNy), aims to build upon NN by gathering normative data from a Spanish sample of subjects younger than 50. The general characteristics of this study are described in another article.
Within the framework of that project, this study presents normative data for a sample of subjects aged 18–49. Data were gathered for different attention tests: verbal span (forward and backward), visuospatial span (forward and backward), the Letter-Number Sequencing test (LNS), the Trail Making Test (TMT) and the Symbol Digit Modalities Test (SDMT).
Attention is one of the most relevant aspects in neuropsychological assessment,2 since attention disorders affect a significant number of patients with brain lesions.3 Although attention is a well-differentiated function in theory, isolating it is difficult in clinical practice. This multi-factor task may overlap with other neuropsychological domains such as the executive functions, working memory, and memory.4
Some of the tests listed above measure selective attention (verbal span and digit-symbol substitution), whereas other tests measure capacities such as mental flexibility and psychomotor speed (TMT).
The verbal span test (forward and backward digit span5) is an attention and memory task with 2 parts. In the first part, the subject listens to a sequence of numbers and repeats it in the same order. In the second part, he/she repeats the sequence in reverse order.
The forward version is considered to be a tool for measuring verbal attention2 and not memory, as was previously believed.6 A normal digit span is 7±2 digits,6,7 although the Spanish version of the Wechsler Adult Intelligence Scale-Third Edition (WAIS-III)8 measures it at 6±1 digits. The literature describes a marked education effect on performance,9–11 and a slight age effect in subjects aged 65 or older.12–15 Comparisons of results obtained for Spanish and English speakers reveal differences. Performance was poorer in the first group. This is probably due to Spanish numbers containing more syllables than English ones.16
The backward digit span is a mental tracking task that includes verbal and visual procedures and working memory.17 The difference between forward verbal span and backward verbal span is about 1 point (0.59–2).14,18 When examining the influence of sociodemographic factors, we found a moderate age effect on scores.15 Performance decreased in subjects older than 70.13 On the other hand, there were no differences linked to sex or educational level.
The digit span test from the Wechsler scale is the one most commonly used in neuropsychological examinations. Normative data are included in the Spanish versions of WAIS-III,8 the Wechsler Memory Scale-Third Edition (WMS-III),8,19 and other Spanish-language test batteries.5,20,21
The visuospatial span test (Corsi forward and backward block-tapping test) is both a spatial memory23 and a visual working memory24 task. The test features a board upon which several cubes are placed in random order. The test is divided into 2 parts. First, the subject has to reproduce the sequence previously demonstrated by the examiner; second, the subject has to reproduce the sequence in reverse order. Both forward and backward visuospatial spans score between 1 and 2 points lower than verbal span.18
Farrell Pagulayan et al.23 described an upper developmental plateau for visuospatial span in early adolescence. No differences were found among the scores from subjects aged between 14 and 21. Wilde et al.15 found a moderate correlation between age and visuospatial span with a more acute decrease in performance from the age of 50. However, other authors state that this decrease begins at age of 65.14 These authors found differences in the performances of men and women on these tests, although such differences were not present among subjects with more than 12 years of schooling.14 Other studies have concluded that the sex effect on these tasks is not significant.24
Several normative studies exist for Spanish speakers, and Olazarán et al.16 found similar performances in both Spanish and English speaking populations. The WMS-III19 provides normative data for its Spanish version. Moreover, normative data for a sample older than 50 have recently been published.21
The LNS test is also used to measure working memory.25 This test is included in the WAIS-III8 and WMS-III19 test batteries. It consists of repeating a sequence of letters and numbers. Subjects first have to repeat the numbers in ascending order, followed by the letters in alphabetical order.
Normative studies for Letter-Number Sequencing show a moderate influence of age on scores.25,26 Spanish versions of the WAIS-III8 and WMS-III19 tests include normative data in Spanish. The NN project also includes normative data in Spanish for subjects older than 50.21
The TMT27 is used to measure visual motor speed, visual tracking, attention, motor function, working memory, processing speed, and executive function.2,28 The test is divided into 2 parts, A and B. In the first part, subjects order numbers from smallest to largest; in the second part, subjects add letters from the alphabet. Part A delivers additional information on sustained attention and hand-eye coordination speed; part B assesses subjects’ ability to alternate 2 sets of cognitive stimuli and mental flexibility in a more precise way.29
Recent studies with wide age ranges showed poorer performance on part A of the test with increasing age.30–35 Nevertheless, studies of a sample of young adults with a high educational level showed no significant changes with regard to this factor.36 These findings may suggest a decline in performance on this part of the TMT after 40 years37 or 50 years of age.38 Subjects with lower educational levels show poorer performances on the TMT.30,32–34 Heaton et al.39 found a more marked education effect among subjects younger than 60. Most studies in the literature show no sex-related differences between scores.30,32,34
Several studies provide normative data for the TMT, although they differ in their sample characteristics and the sociodemographic variables that were studied.2,29 Moreover, a recent meta-analysis concluded that normative data from different geographic regions and cultures were not equivalent.40 Two studies provide normative data in Spanish for the TMT in older adults21,41 and another study shows data for subjects aged 16–80.32
The SDMT42,43 is a test that mainly evaluates attention, visual tracking, mental processing speed, and visual motor speed. The test consists of using a key to assign a specific number between 1 and 9 to a meaningless geometric figure. Alternative forms have been developed and they feature in some compendia of neuropsychological tests.4
Several studies have shown how demographic factors influence performance on the SDMT.2,4,29 Jorm at al.44 found a decline in performance beginning at age 55. Years of schooling may also influence performance on this test.45–47 Results regarding sex effect are contradictory. Some studies found that sex had no significant effect on scores,48 whereas others found better performance in women.44
Smith43 gathered normative data in healthy adults aged between 18 and 78. Jorm et al.44 presented data broken down by sex and age in a sample of subjects aged between 20 and 64 upon finding differences between men and women.
Smith included normative data in Spanish for ages ranging between 18 and 85 in 2 groups differentiated by educational level.49 Within the NN project, Peña-Casanova et al. published normative data for a sample of Spanish subjects older than 50.21
With a view to the background described above, it is necessary to obtain normative data for attention tests in young Spanish adults. The purpose of this study is therefore to describe performance on these attention tasks in subjects aged between 18 and 49.
Materials and methodsSubjectsRecruitment methods and sample characteristics have already been described in another article. To summarise, we recruited 179 white subjects who had been educated in Spain, regardless of their first language (for bilingual subjects). The sample was stratified by age and educational level. All subjects were unaffected by cognitive disorders; their scores on the Mini-Mental State Examination50,51 were ≥24 and their scores on the Memory Impairment Screen52,53 were ≥4.
Neuropsychological testsWe followed the neuropsychological protocol established for the NN project.21 All tests were administered according to the procedures published in their manuals.
Verbal spanThis task consists of repeating increasingly long digit sequences in forward and then backward order. We used the Spanish version of the test.5 The task was administered according to the rules in the WAIS-III manual. This meant that subjects had 2 attempts to complete each sequence even if they made no errors on the first attempt. Scores were assigned according to the last completed sequence, known as the span. Scores ranged from 0 to 9 for forward digits, and from 0 to 8 for backward digits.
Visuospatial spanThe task features a board with 9 cubes placed in random positions. In the first part, the subject reproduces the sequence of cubes chosen by the examiner. In the second part, the subject reproduces the same sequence in reverse order.54 Both visuospatial span tasks (forward and backward) were administered according to the rules of the WAIS-III manual.19 This meant that subjects had 2 attempts to complete each sequence, even if they made no errors on the first attempt. Two scores were recorded: the span and the total score. In this test, the span does not correspond to the number of cubes in the last correct sequence. We add 1 point to that number to obtain the span. Scores for both forward and backward spans ranged from 0 to 9.
Letter-Number SequencingThis task consisted of repeating a letter-number sequence read aloud by the examiner. First, the subject repeated numbers in ascending order, followed by the letters in alphabetical order. The tests were administered according to the standard procedures described in the WAIS-III8 manual. Span scores ranged from 0 to 7 and total scores, from 0 to 21.
Trail Making TestThe test was divided into 2 parts. In part A, subjects repeat randomly distributed numbers in ascending order; in part B, subjects order numbers as in part A but alternate them with letters in alphabetical order. Subjects had to complete both tasks as quickly as possible. The test was administered according to the rules described by Reitan.27 There was no time limit for completing the task. Scores were equal to the time (in seconds) a subject needed to perform each part of the test.
Symbol Digit Modalities TestSubjects assigned numbers from 1 to 9 to meaningless geometric figures according to a key which remained visible during the test. The test was administered according to the standard procedures described in the manual.49 After completing a training session with 10 items, subjects took the test which contained 110 items. The score corresponded to the total number of substitutions performed during a 90-second time period. The highest possible score was 110.
Statistical analysisThe statistical analysis is described in greater detail in the specific article on methods used in NNy. Briefly, the procedure was as follows. (a) We calculated the cumulative frequencies of the raw scores on all the attention tests. Scores were grouped by percentile ranges according to their position in the distribution. Percentile ranges were then converted into NSS (NEURONORMA Scaled Scores), between 2 and 18. This transformation of raw scores to NSS produced an approximation of normal distribution (mean=10, standard deviation=3) to which linear regressions could be applied. (b) We defined the effects of age, education and sex. NSS correlation coefficients (r) and coefficients of determination (R2) were determined for age, years of education, and sex for each of the attention tests. Variables were adjusted only in cases in which the explained variance exceeded 5% and where the regression coefficient was statistically significant. (c) The NSS was adjusted for age, education, and sex according to the following formula: NSSA&E&S=PE−(β1×[Age−35]+β2×[Education−13]+β3×Sex). The regression coefficient (β) from this analysis was used as the basis for adjusting for sociodemographic factors. The value being adjusted was truncated to the next lower integer.
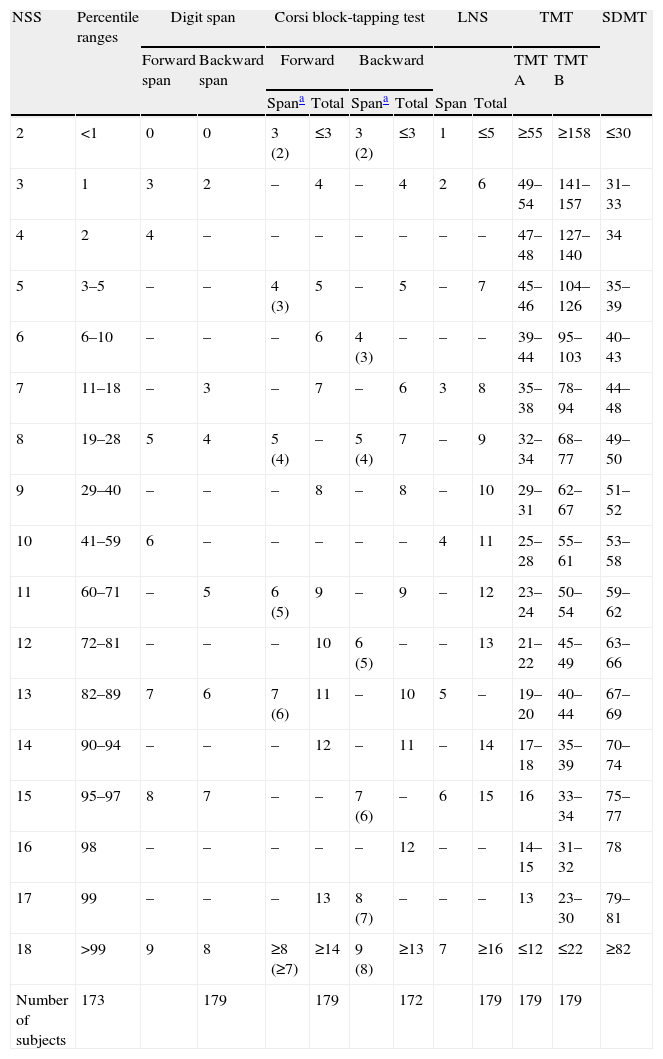
ResultsTable 1 displays the array of frequencies of raw scores for the entire group, with the corresponding NSS and percentile ranks. To use the table, select the patient's raw score for each test and identify the corresponding NSS and the percentile rank.
Raw scores for the digit span, Corsi block-tapping test, LNS, TMT, and SDMT.
| NSS | Percentile ranges | Digit span | Corsi block-tapping test | LNS | TMT | SDMT | ||||||
| Forward span | Backward span | Forward | Backward | TMT A | TMT B | |||||||
| Spana | Total | Spana | Total | Span | Total | |||||||
| 2 | <1 | 0 | 0 | 3 (2) | ≤3 | 3 (2) | ≤3 | 1 | ≤5 | ≥55 | ≥158 | ≤30 |
| 3 | 1 | 3 | 2 | – | 4 | – | 4 | 2 | 6 | 49–54 | 141–157 | 31–33 |
| 4 | 2 | 4 | – | – | – | – | – | – | – | 47–48 | 127–140 | 34 |
| 5 | 3–5 | – | – | 4 (3) | 5 | – | 5 | – | 7 | 45–46 | 104–126 | 35–39 |
| 6 | 6–10 | – | – | – | 6 | 4 (3) | – | – | – | 39–44 | 95–103 | 40–43 |
| 7 | 11–18 | – | 3 | – | 7 | – | 6 | 3 | 8 | 35–38 | 78–94 | 44–48 |
| 8 | 19–28 | 5 | 4 | 5 (4) | – | 5 (4) | 7 | – | 9 | 32–34 | 68–77 | 49–50 |
| 9 | 29–40 | – | – | – | 8 | – | 8 | – | 10 | 29–31 | 62–67 | 51–52 |
| 10 | 41–59 | 6 | – | – | – | – | – | 4 | 11 | 25–28 | 55–61 | 53–58 |
| 11 | 60–71 | – | 5 | 6 (5) | 9 | – | 9 | – | 12 | 23–24 | 50–54 | 59–62 |
| 12 | 72–81 | – | – | – | 10 | 6 (5) | – | – | 13 | 21–22 | 45–49 | 63–66 |
| 13 | 82–89 | 7 | 6 | 7 (6) | 11 | – | 10 | 5 | – | 19–20 | 40–44 | 67–69 |
| 14 | 90–94 | – | – | – | 12 | – | 11 | – | 14 | 17–18 | 35–39 | 70–74 |
| 15 | 95–97 | 8 | 7 | – | – | 7 (6) | – | 6 | 15 | 16 | 33–34 | 75–77 |
| 16 | 98 | – | – | – | – | – | 12 | – | – | 14–15 | 31–32 | 78 |
| 17 | 99 | – | – | – | 13 | 8 (7) | – | – | – | 13 | 23–30 | 79–81 |
| 18 | >99 | 9 | 8 | ≥8 (≥7) | ≥14 | 9 (8) | ≥13 | 7 | ≥16 | ≤12 | ≤22 | ≥82 |
| Number of subjects | 173 | 179 | 179 | 172 | 179 | 179 | 179 | |||||
LNS, Letter-Number Sequencing; NSS, NEURONORMA Scaled Score; SDMT, Symbol Digit Modalities Test; TMT, Trail Making Test.
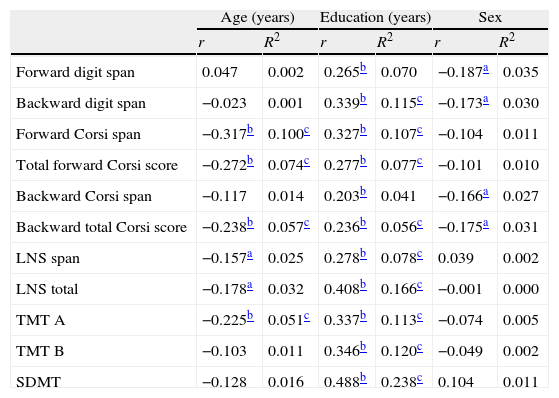
Based on the NSS, we calculated the correlation coefficient (r) and coefficient of determination (R2), which are shown in Table 2. The ‘years of schooling’ variable explains a significant percentage of the variation in most of the tests that were studied. These included: forward verbal span (7%), backward verbal span (11.5%), forward visuospatial span (10.7%), forward total Corsi block-tapping test score (7.7%), backward total Corsi block-tapping test score (5.7%), LNS span (7.8%), LNS total score (16.6%), TMT part A (11.3%), TMT part B (12%), and SDMT (23.8%). The percentage of variation explained by the age variable was remarkable in only 3 tasks: forward visuospatial span (10%), total score on the forward and backward Corsi block-tapping tests (8.7% and 7.3) respectively, and TMT part A (5.1%). We found no significant sex effect on any of the tests.
Correlation coefficients (r) and coefficients of determination (R2) of the scaled scores by age, education, and sex.
| Age (years) | Education (years) | Sex | ||||
| r | R2 | r | R2 | r | R2 | |
| Forward digit span | 0.047 | 0.002 | 0.265b | 0.070 | −0.187a | 0.035 |
| Backward digit span | −0.023 | 0.001 | 0.339b | 0.115c | −0.173a | 0.030 |
| Forward Corsi span | −0.317b | 0.100c | 0.327b | 0.107c | −0.104 | 0.011 |
| Total forward Corsi score | −0.272b | 0.074c | 0.277b | 0.077c | −0.101 | 0.010 |
| Backward Corsi span | −0.117 | 0.014 | 0.203b | 0.041 | −0.166a | 0.027 |
| Backward total Corsi score | −0.238b | 0.057c | 0.236b | 0.056c | −0.175a | 0.031 |
| LNS span | −0.157a | 0.025 | 0.278b | 0.078c | 0.039 | 0.002 |
| LNS total | −0.178a | 0.032 | 0.408b | 0.166c | −0.001 | 0.000 |
| TMT A | −0.225b | 0.051c | 0.337b | 0.113c | −0.074 | 0.005 |
| TMT B | −0.103 | 0.011 | 0.346b | 0.120c | −0.049 | 0.002 |
| SDMT | −0.128 | 0.016 | 0.488b | 0.238c | 0.104 | 0.011 |
LNS, Letter-Number Sequencing; SDMT, Symbol Digit Modalities Test; TMT, Trail Making Test.
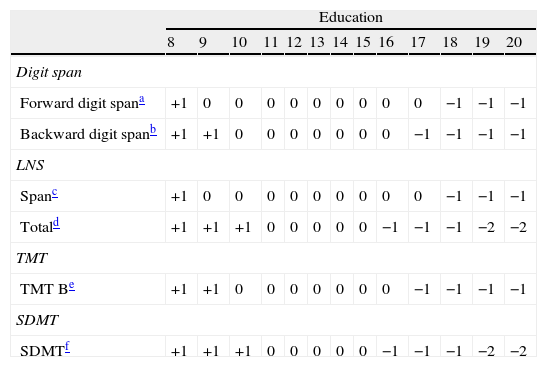
Multiple regression coefficients were used to adjust for age and education by using the NSSA&E&S formula. Based on these data, we created age and education adjustment tables for education, which doctors can use to adjust scores (Tables 3–7). Table 3 is used by selecting the ‘years of schooling’ variable on the top row in order to know what correction to apply to the NSS of each group. In order to obtain the adjustments, select the age (top row) and the years of education (left column) variables in Tables 4 and 7.
Education-adjusted table for digit span, LNS, TMT and SDMT.
| Education | |||||||||||||
| 8 | 9 | 10 | 11 | 12 | 13 | 14 | 15 | 16 | 17 | 18 | 19 | 20 | |
| Digit span | |||||||||||||
| Forward digit spana | +1 | 0 | 0 | 0 | 0 | 0 | 0 | 0 | 0 | 0 | −1 | −1 | −1 |
| Backward digit spanb | +1 | +1 | 0 | 0 | 0 | 0 | 0 | 0 | 0 | −1 | −1 | −1 | −1 |
| LNS | |||||||||||||
| Spanc | +1 | 0 | 0 | 0 | 0 | 0 | 0 | 0 | 0 | 0 | −1 | −1 | −1 |
| Totald | +1 | +1 | +1 | 0 | 0 | 0 | 0 | 0 | −1 | −1 | −1 | −2 | −2 |
| TMT | |||||||||||||
| TMT Be | +1 | +1 | 0 | 0 | 0 | 0 | 0 | 0 | 0 | −1 | −1 | −1 | −1 |
| SDMT | |||||||||||||
| SDMTf | +1 | +1 | +1 | 0 | 0 | 0 | 0 | 0 | −1 | −1 | −1 | −2 | −2 |
LNS, Letter-Number Sequencing; SDMT, Symbol Digit Modalities Test; TMT, Trail Making Test.
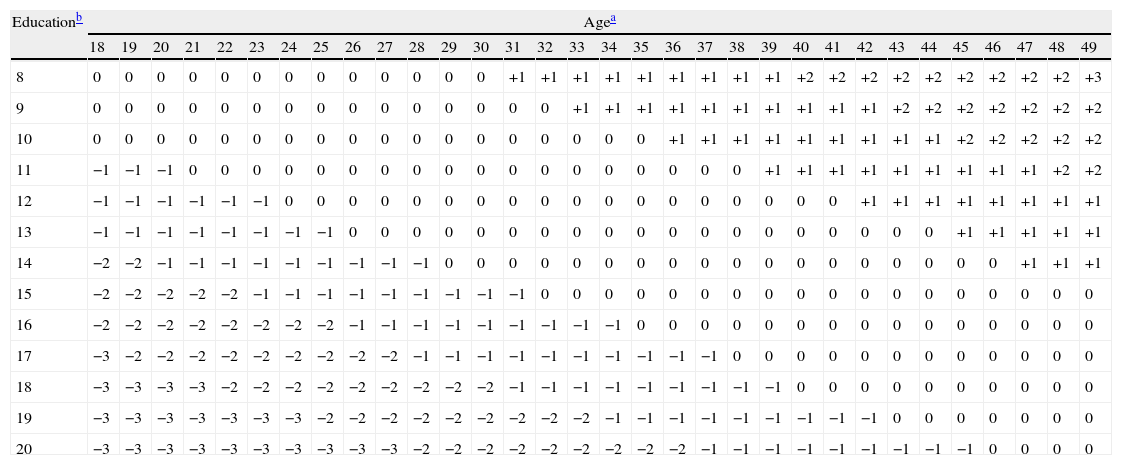
Age-adjusted and education-adjusted table corresponding to the last item of the forward Corsi block-tapping test.
| Educationb | Agea | |||||||||||||||||||||||||||||||
| 18 | 19 | 20 | 21 | 22 | 23 | 24 | 25 | 26 | 27 | 28 | 29 | 30 | 31 | 32 | 33 | 34 | 35 | 36 | 37 | 38 | 39 | 40 | 41 | 42 | 43 | 44 | 45 | 46 | 47 | 48 | 49 | |
| 8 | 0 | 0 | 0 | 0 | 0 | 0 | 0 | 0 | 0 | 0 | 0 | 0 | 0 | +1 | +1 | +1 | +1 | +1 | +1 | +1 | +1 | +1 | +2 | +2 | +2 | +2 | +2 | +2 | +2 | +2 | +2 | +3 |
| 9 | 0 | 0 | 0 | 0 | 0 | 0 | 0 | 0 | 0 | 0 | 0 | 0 | 0 | 0 | 0 | +1 | +1 | +1 | +1 | +1 | +1 | +1 | +1 | +1 | +1 | +2 | +2 | +2 | +2 | +2 | +2 | +2 |
| 10 | 0 | 0 | 0 | 0 | 0 | 0 | 0 | 0 | 0 | 0 | 0 | 0 | 0 | 0 | 0 | 0 | 0 | 0 | +1 | +1 | +1 | +1 | +1 | +1 | +1 | +1 | +1 | +2 | +2 | +2 | +2 | +2 |
| 11 | −1 | −1 | −1 | 0 | 0 | 0 | 0 | 0 | 0 | 0 | 0 | 0 | 0 | 0 | 0 | 0 | 0 | 0 | 0 | 0 | 0 | +1 | +1 | +1 | +1 | +1 | +1 | +1 | +1 | +1 | +2 | +2 |
| 12 | −1 | −1 | −1 | −1 | −1 | −1 | 0 | 0 | 0 | 0 | 0 | 0 | 0 | 0 | 0 | 0 | 0 | 0 | 0 | 0 | 0 | 0 | 0 | 0 | +1 | +1 | +1 | +1 | +1 | +1 | +1 | +1 |
| 13 | −1 | −1 | −1 | −1 | −1 | −1 | −1 | −1 | 0 | 0 | 0 | 0 | 0 | 0 | 0 | 0 | 0 | 0 | 0 | 0 | 0 | 0 | 0 | 0 | 0 | 0 | 0 | +1 | +1 | +1 | +1 | +1 |
| 14 | −2 | −2 | −1 | −1 | −1 | −1 | −1 | −1 | −1 | −1 | −1 | 0 | 0 | 0 | 0 | 0 | 0 | 0 | 0 | 0 | 0 | 0 | 0 | 0 | 0 | 0 | 0 | 0 | 0 | +1 | +1 | +1 |
| 15 | −2 | −2 | −2 | −2 | −2 | −1 | −1 | −1 | −1 | −1 | −1 | −1 | −1 | −1 | 0 | 0 | 0 | 0 | 0 | 0 | 0 | 0 | 0 | 0 | 0 | 0 | 0 | 0 | 0 | 0 | 0 | 0 |
| 16 | −2 | −2 | −2 | −2 | −2 | −2 | −2 | −2 | −1 | −1 | −1 | −1 | −1 | −1 | −1 | −1 | −1 | 0 | 0 | 0 | 0 | 0 | 0 | 0 | 0 | 0 | 0 | 0 | 0 | 0 | 0 | 0 |
| 17 | −3 | −2 | −2 | −2 | −2 | −2 | −2 | −2 | −2 | −2 | −1 | −1 | −1 | −1 | −1 | −1 | −1 | −1 | −1 | −1 | 0 | 0 | 0 | 0 | 0 | 0 | 0 | 0 | 0 | 0 | 0 | 0 |
| 18 | −3 | −3 | −3 | −3 | −2 | −2 | −2 | −2 | −2 | −2 | −2 | −2 | −2 | −1 | −1 | −1 | −1 | −1 | −1 | −1 | −1 | −1 | 0 | 0 | 0 | 0 | 0 | 0 | 0 | 0 | 0 | 0 |
| 19 | −3 | −3 | −3 | −3 | −3 | −3 | −3 | −2 | −2 | −2 | −2 | −2 | −2 | −2 | −2 | −2 | −1 | −1 | −1 | −1 | −1 | −1 | −1 | −1 | −1 | 0 | 0 | 0 | 0 | 0 | 0 | 0 |
| 20 | −3 | −3 | −3 | −3 | −3 | −3 | −3 | −3 | −3 | −3 | −2 | −2 | −2 | −2 | −2 | −2 | −2 | −2 | −2 | −1 | −1 | −1 | −1 | −1 | −1 | −1 | −1 | −1 | 0 | 0 | 0 | 0 |
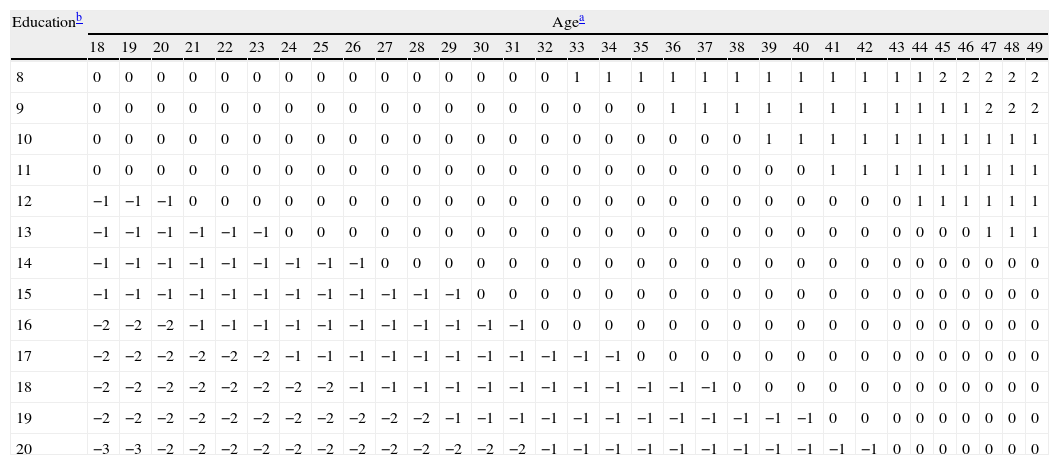
Age-adjusted and education-adjusted table for the total forward Corsi block-tapping test.
| Educationb | Agea | |||||||||||||||||||||||||||||||
| 18 | 19 | 20 | 21 | 22 | 23 | 24 | 25 | 26 | 27 | 28 | 29 | 30 | 31 | 32 | 33 | 34 | 35 | 36 | 37 | 38 | 39 | 40 | 41 | 42 | 43 | 44 | 45 | 46 | 47 | 48 | 49 | |
| 8 | 0 | 0 | 0 | 0 | 0 | 0 | 0 | 0 | 0 | 0 | 0 | 0 | 0 | 0 | 0 | 1 | 1 | 1 | 1 | 1 | 1 | 1 | 1 | 1 | 1 | 1 | 1 | 2 | 2 | 2 | 2 | 2 |
| 9 | 0 | 0 | 0 | 0 | 0 | 0 | 0 | 0 | 0 | 0 | 0 | 0 | 0 | 0 | 0 | 0 | 0 | 0 | 1 | 1 | 1 | 1 | 1 | 1 | 1 | 1 | 1 | 1 | 1 | 2 | 2 | 2 |
| 10 | 0 | 0 | 0 | 0 | 0 | 0 | 0 | 0 | 0 | 0 | 0 | 0 | 0 | 0 | 0 | 0 | 0 | 0 | 0 | 0 | 0 | 1 | 1 | 1 | 1 | 1 | 1 | 1 | 1 | 1 | 1 | 1 |
| 11 | 0 | 0 | 0 | 0 | 0 | 0 | 0 | 0 | 0 | 0 | 0 | 0 | 0 | 0 | 0 | 0 | 0 | 0 | 0 | 0 | 0 | 0 | 0 | 1 | 1 | 1 | 1 | 1 | 1 | 1 | 1 | 1 |
| 12 | −1 | −1 | −1 | 0 | 0 | 0 | 0 | 0 | 0 | 0 | 0 | 0 | 0 | 0 | 0 | 0 | 0 | 0 | 0 | 0 | 0 | 0 | 0 | 0 | 0 | 0 | 1 | 1 | 1 | 1 | 1 | 1 |
| 13 | −1 | −1 | −1 | −1 | −1 | −1 | 0 | 0 | 0 | 0 | 0 | 0 | 0 | 0 | 0 | 0 | 0 | 0 | 0 | 0 | 0 | 0 | 0 | 0 | 0 | 0 | 0 | 0 | 0 | 1 | 1 | 1 |
| 14 | −1 | −1 | −1 | −1 | −1 | −1 | −1 | −1 | −1 | 0 | 0 | 0 | 0 | 0 | 0 | 0 | 0 | 0 | 0 | 0 | 0 | 0 | 0 | 0 | 0 | 0 | 0 | 0 | 0 | 0 | 0 | 0 |
| 15 | −1 | −1 | −1 | −1 | −1 | −1 | −1 | −1 | −1 | −1 | −1 | −1 | 0 | 0 | 0 | 0 | 0 | 0 | 0 | 0 | 0 | 0 | 0 | 0 | 0 | 0 | 0 | 0 | 0 | 0 | 0 | 0 |
| 16 | −2 | −2 | −2 | −1 | −1 | −1 | −1 | −1 | −1 | −1 | −1 | −1 | −1 | −1 | 0 | 0 | 0 | 0 | 0 | 0 | 0 | 0 | 0 | 0 | 0 | 0 | 0 | 0 | 0 | 0 | 0 | 0 |
| 17 | −2 | −2 | −2 | −2 | −2 | −2 | −1 | −1 | −1 | −1 | −1 | −1 | −1 | −1 | −1 | −1 | −1 | 0 | 0 | 0 | 0 | 0 | 0 | 0 | 0 | 0 | 0 | 0 | 0 | 0 | 0 | 0 |
| 18 | −2 | −2 | −2 | −2 | −2 | −2 | −2 | −2 | −1 | −1 | −1 | −1 | −1 | −1 | −1 | −1 | −1 | −1 | −1 | −1 | 0 | 0 | 0 | 0 | 0 | 0 | 0 | 0 | 0 | 0 | 0 | 0 |
| 19 | −2 | −2 | −2 | −2 | −2 | −2 | −2 | −2 | −2 | −2 | −2 | −1 | −1 | −1 | −1 | −1 | −1 | −1 | −1 | −1 | −1 | −1 | −1 | 0 | 0 | 0 | 0 | 0 | 0 | 0 | 0 | 0 |
| 20 | −3 | −3 | −2 | −2 | −2 | −2 | −2 | −2 | −2 | −2 | −2 | −2 | −2 | −2 | −1 | −1 | −1 | −1 | −1 | −1 | −1 | −1 | −1 | −1 | −1 | 0 | 0 | 0 | 0 | 0 | 0 | 0 |
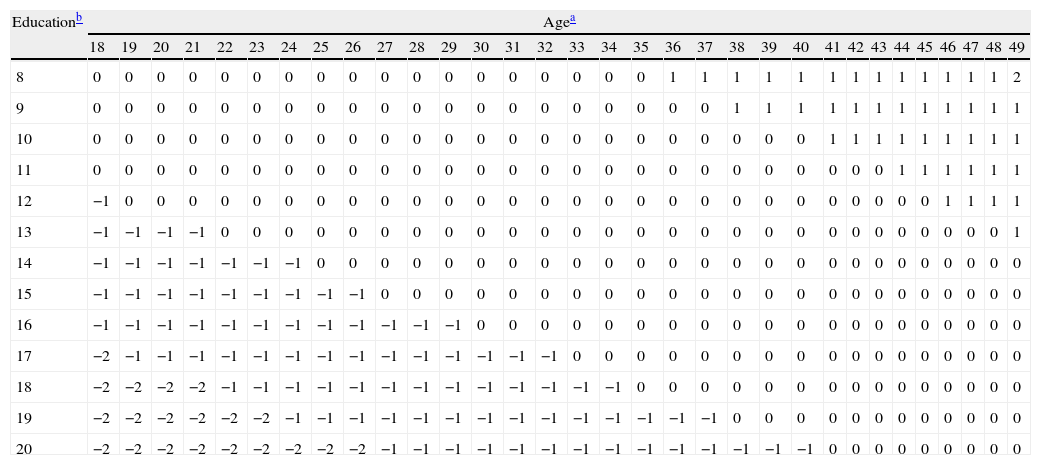
Age-adjusted and education-adjusted table for the total backward Corsi block-tapping test.
| Educationb | Agea | |||||||||||||||||||||||||||||||
| 18 | 19 | 20 | 21 | 22 | 23 | 24 | 25 | 26 | 27 | 28 | 29 | 30 | 31 | 32 | 33 | 34 | 35 | 36 | 37 | 38 | 39 | 40 | 41 | 42 | 43 | 44 | 45 | 46 | 47 | 48 | 49 | |
| 8 | 0 | 0 | 0 | 0 | 0 | 0 | 0 | 0 | 0 | 0 | 0 | 0 | 0 | 0 | 0 | 0 | 0 | 0 | 1 | 1 | 1 | 1 | 1 | 1 | 1 | 1 | 1 | 1 | 1 | 1 | 1 | 2 |
| 9 | 0 | 0 | 0 | 0 | 0 | 0 | 0 | 0 | 0 | 0 | 0 | 0 | 0 | 0 | 0 | 0 | 0 | 0 | 0 | 0 | 1 | 1 | 1 | 1 | 1 | 1 | 1 | 1 | 1 | 1 | 1 | 1 |
| 10 | 0 | 0 | 0 | 0 | 0 | 0 | 0 | 0 | 0 | 0 | 0 | 0 | 0 | 0 | 0 | 0 | 0 | 0 | 0 | 0 | 0 | 0 | 0 | 1 | 1 | 1 | 1 | 1 | 1 | 1 | 1 | 1 |
| 11 | 0 | 0 | 0 | 0 | 0 | 0 | 0 | 0 | 0 | 0 | 0 | 0 | 0 | 0 | 0 | 0 | 0 | 0 | 0 | 0 | 0 | 0 | 0 | 0 | 0 | 0 | 1 | 1 | 1 | 1 | 1 | 1 |
| 12 | −1 | 0 | 0 | 0 | 0 | 0 | 0 | 0 | 0 | 0 | 0 | 0 | 0 | 0 | 0 | 0 | 0 | 0 | 0 | 0 | 0 | 0 | 0 | 0 | 0 | 0 | 0 | 0 | 1 | 1 | 1 | 1 |
| 13 | −1 | −1 | −1 | −1 | 0 | 0 | 0 | 0 | 0 | 0 | 0 | 0 | 0 | 0 | 0 | 0 | 0 | 0 | 0 | 0 | 0 | 0 | 0 | 0 | 0 | 0 | 0 | 0 | 0 | 0 | 0 | 1 |
| 14 | −1 | −1 | −1 | −1 | −1 | −1 | −1 | 0 | 0 | 0 | 0 | 0 | 0 | 0 | 0 | 0 | 0 | 0 | 0 | 0 | 0 | 0 | 0 | 0 | 0 | 0 | 0 | 0 | 0 | 0 | 0 | 0 |
| 15 | −1 | −1 | −1 | −1 | −1 | −1 | −1 | −1 | −1 | 0 | 0 | 0 | 0 | 0 | 0 | 0 | 0 | 0 | 0 | 0 | 0 | 0 | 0 | 0 | 0 | 0 | 0 | 0 | 0 | 0 | 0 | 0 |
| 16 | −1 | −1 | −1 | −1 | −1 | −1 | −1 | −1 | −1 | −1 | −1 | −1 | 0 | 0 | 0 | 0 | 0 | 0 | 0 | 0 | 0 | 0 | 0 | 0 | 0 | 0 | 0 | 0 | 0 | 0 | 0 | 0 |
| 17 | −2 | −1 | −1 | −1 | −1 | −1 | −1 | −1 | −1 | −1 | −1 | −1 | −1 | −1 | −1 | 0 | 0 | 0 | 0 | 0 | 0 | 0 | 0 | 0 | 0 | 0 | 0 | 0 | 0 | 0 | 0 | 0 |
| 18 | −2 | −2 | −2 | −2 | −1 | −1 | −1 | −1 | −1 | −1 | −1 | −1 | −1 | −1 | −1 | −1 | −1 | 0 | 0 | 0 | 0 | 0 | 0 | 0 | 0 | 0 | 0 | 0 | 0 | 0 | 0 | 0 |
| 19 | −2 | −2 | −2 | −2 | −2 | −2 | −1 | −1 | −1 | −1 | −1 | −1 | −1 | −1 | −1 | −1 | −1 | −1 | −1 | −1 | 0 | 0 | 0 | 0 | 0 | 0 | 0 | 0 | 0 | 0 | 0 | 0 |
| 20 | −2 | −2 | −2 | −2 | −2 | −2 | −2 | −2 | −2 | −1 | −1 | −1 | −1 | −1 | −1 | −1 | −1 | −1 | −1 | −1 | −1 | −1 | −1 | 0 | 0 | 0 | 0 | 0 | 0 | 0 | 0 | 0 |
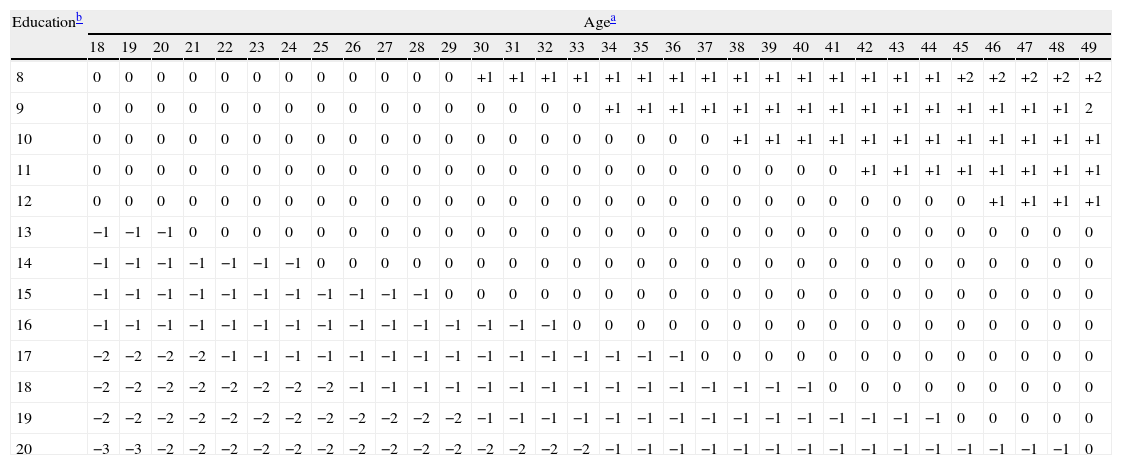
Age-adjusted and education-adjusted table for TMT A.
| Educationb | Agea | |||||||||||||||||||||||||||||||
| 18 | 19 | 20 | 21 | 22 | 23 | 24 | 25 | 26 | 27 | 28 | 29 | 30 | 31 | 32 | 33 | 34 | 35 | 36 | 37 | 38 | 39 | 40 | 41 | 42 | 43 | 44 | 45 | 46 | 47 | 48 | 49 | |
| 8 | 0 | 0 | 0 | 0 | 0 | 0 | 0 | 0 | 0 | 0 | 0 | 0 | +1 | +1 | +1 | +1 | +1 | +1 | +1 | +1 | +1 | +1 | +1 | +1 | +1 | +1 | +1 | +2 | +2 | +2 | +2 | +2 |
| 9 | 0 | 0 | 0 | 0 | 0 | 0 | 0 | 0 | 0 | 0 | 0 | 0 | 0 | 0 | 0 | 0 | +1 | +1 | +1 | +1 | +1 | +1 | +1 | +1 | +1 | +1 | +1 | +1 | +1 | +1 | +1 | 2 |
| 10 | 0 | 0 | 0 | 0 | 0 | 0 | 0 | 0 | 0 | 0 | 0 | 0 | 0 | 0 | 0 | 0 | 0 | 0 | 0 | 0 | +1 | +1 | +1 | +1 | +1 | +1 | +1 | +1 | +1 | +1 | +1 | +1 |
| 11 | 0 | 0 | 0 | 0 | 0 | 0 | 0 | 0 | 0 | 0 | 0 | 0 | 0 | 0 | 0 | 0 | 0 | 0 | 0 | 0 | 0 | 0 | 0 | 0 | +1 | +1 | +1 | +1 | +1 | +1 | +1 | +1 |
| 12 | 0 | 0 | 0 | 0 | 0 | 0 | 0 | 0 | 0 | 0 | 0 | 0 | 0 | 0 | 0 | 0 | 0 | 0 | 0 | 0 | 0 | 0 | 0 | 0 | 0 | 0 | 0 | 0 | +1 | +1 | +1 | +1 |
| 13 | −1 | −1 | −1 | 0 | 0 | 0 | 0 | 0 | 0 | 0 | 0 | 0 | 0 | 0 | 0 | 0 | 0 | 0 | 0 | 0 | 0 | 0 | 0 | 0 | 0 | 0 | 0 | 0 | 0 | 0 | 0 | 0 |
| 14 | −1 | −1 | −1 | −1 | −1 | −1 | −1 | 0 | 0 | 0 | 0 | 0 | 0 | 0 | 0 | 0 | 0 | 0 | 0 | 0 | 0 | 0 | 0 | 0 | 0 | 0 | 0 | 0 | 0 | 0 | 0 | 0 |
| 15 | −1 | −1 | −1 | −1 | −1 | −1 | −1 | −1 | −1 | −1 | −1 | 0 | 0 | 0 | 0 | 0 | 0 | 0 | 0 | 0 | 0 | 0 | 0 | 0 | 0 | 0 | 0 | 0 | 0 | 0 | 0 | 0 |
| 16 | −1 | −1 | −1 | −1 | −1 | −1 | −1 | −1 | −1 | −1 | −1 | −1 | −1 | −1 | −1 | 0 | 0 | 0 | 0 | 0 | 0 | 0 | 0 | 0 | 0 | 0 | 0 | 0 | 0 | 0 | 0 | 0 |
| 17 | −2 | −2 | −2 | −2 | −1 | −1 | −1 | −1 | −1 | −1 | −1 | −1 | −1 | −1 | −1 | −1 | −1 | −1 | −1 | 0 | 0 | 0 | 0 | 0 | 0 | 0 | 0 | 0 | 0 | 0 | 0 | 0 |
| 18 | −2 | −2 | −2 | −2 | −2 | −2 | −2 | −2 | −1 | −1 | −1 | −1 | −1 | −1 | −1 | −1 | −1 | −1 | −1 | −1 | −1 | −1 | −1 | 0 | 0 | 0 | 0 | 0 | 0 | 0 | 0 | 0 |
| 19 | −2 | −2 | −2 | −2 | −2 | −2 | −2 | −2 | −2 | −2 | −2 | −2 | −1 | −1 | −1 | −1 | −1 | −1 | −1 | −1 | −1 | −1 | −1 | −1 | −1 | −1 | −1 | 0 | 0 | 0 | 0 | 0 |
| 20 | −3 | −3 | −2 | −2 | −2 | −2 | −2 | −2 | −2 | −2 | −2 | −2 | −2 | −2 | −2 | −2 | −1 | −1 | −1 | −1 | −1 | −1 | −1 | −1 | −1 | −1 | −1 | −1 | −1 | −1 | −1 | 0 |
TMT, Trail Making Test.
The main objective was to obtain normative data for Spanish young adults by using attention tests within the framework of a co-normalisation project on cognitive tests.
Verbal spanResults of this study showed the effect of education on verbal span. In this test, age and sex did not have a significant influence on performance. We can therefore state that age has no effect when the subject is younger than 50. Previous studies reached the same conclusion, as they described the influence of this variable from the age of 65 and not before.12–15 Moreover, concurring with other studies,9–11,21 we can affirm the influence of education on performance.
Apart from the well-known effect of the sociodemographic variables, it has been suggested that raw span provides enough information. Lezak et al. suggested the following scale: a span of 6 or more is within normal levels, a span of 5 may be within the normal limits, a span of 4 is within the normal-low limits and a span of 3 is low.
In other normative studies,8 a span of 4 may be considered either normal or pathological. The NN study (with a sample of subjects 49 years and older21) was more precise due to the adjustments for education. Subjects with a span of 4 were considered to have either normal or pathological results depending on their educational levels.
Results of this study in subjects younger than 50 confirmed a normal span of 6±1; a span of 4 was clearly defined as low, even after adjusting scores for education. Even so, we should be mindful of the fact that this study sample contains no subjects with less than 8 years of education.
Backward verbal span scores were 1 point lower than forward verbal span scores. Our results coincide with those described in the literature.
Visuospatial spanForward visuospatial span results were similar to those described in the study sample for forward verbal span. Nevertheless, other authors found that visuospatial span was 1–2 points lower than verbal span.18 Others stated that the difference could be as much as 3 points in samples of young subjects.55 This finding could be explained by the hypothesis that verbal span and visual span make use of different cognitive processes.56 An alternative explanation may be that verbal and visual tasks have different levels of difficulty. Moreover, the type of answer differs between the tasks.2
Backward and forward visuospatial span performances were similar, which coincides with findings by Kessel et al.24 It should be noted that results could be affected by the fact that we used the same sequences in both tasks (forward and backward). This would therefore elicit an implicit learning effect.57
We found slight associations between forward visuospatial span scores and both age and education. This was not the case for backward visuospatial span, which coincides with results from studies.24,58
Letter-Number SequencingWe found an association between Letter-Number Sequencing test scores and education, but not age.
Results of this study were similar to the ones described in the Spanish version of WMS-III,19 despite differences in samples, methods, and age ranges. A total raw score of 11±2 was considered to be normal since it corresponded to the central scaled-score ranges in both studies. In this study, we observed that a total raw score of 8 marked the limit between normal and pathological results for the entire age range. However, subjects could be identified as belonging to one of the categories after adjusting for education. In contrast, educational level was not taken into account in some other studies.19
Trail Making TestResults showed a minimum reverse association between age and performance in part A, but not in part B. These results coincide with findings by Yeudall et al.36 which show a decline in test scores on part A from the age of 40.37 The differences in age effect between part A and part B may be due to the fact that psychomotor speed is the most determinant function in part A, whereas in part B speed would be linked to other executive aspects. Education affected performance on both parts of the test, which coincides with findings in most studies in the literature.30–34 We found no relationship between performance and sex, which also coincides with results from other studies.30,32,34
The study showed no age effect, which contrasted with our findings in the sample of subjects older than 50 in the NN project.21 This result is to be expected due to the effect of ageing on cognition and time trials. An education effect was observed in both studies. However, the effect was less pronounced in the younger group, probably because it contained no subjects with less than 8 years of education.
Symbol Digit Modalities TestResults from this study support the findings from most of the previous studies regarding the positive effect of education on SDMT scores.45–47 We found no age effect, which coincides with the findings described by Jorm et al.44 for a sample of young adults. We found no links between sex and performance on the test. Our results coincide with those described by Gilmore et al.,48 and do not support studies that describe better performance by women.44
If we compare the data from the young adult sample and the over-50 sample (both in the NN project21), findings are similar for the education effect, but not for the age effect. This may suggest a decline in performance beginning at the age of 50.
ConclusionsSignificantly, this is the first study to produce normative data for the tests listed above in a single sample of subjects younger than 50.
This study provides normative data for attention tests in young Spanish adults and presents results in such a way that doctors can use them in diagnostic procedures. Based on the results obtained from young adults, we can confirm the presence of an education affect and a slight age effect, and state that sex had no effect on performance.
Conflicts of interestThe authors have no conflicts of interest to declare.
Please cite this article as: Tamayo F, et al. Estudios normativos españoles en población adulta joven (Proyecto NEURONORMA jóvenes): normas para las pruebas span verbal, span visuoespacial, Letter-Number Sequencing, Trail Making Test y Symbol Digit Modalities Test. Neurología. 2012;27:319–29.
