

Several models of chronic obstructive pulmonary disease (COPD) in mice have been developed; the most similar to the habit of smoking is the inhalation of the smoke in mice. The objective was to develop and implement an experimental model of COPD in mice through the passive inhalation of smoke and demonstrate the physiological changes on ventilatory function and its correlation with 3 emphysema quantification methods.
Materials and methodsTwenty Wistar mice were included in an experimental and control group. The experimental group was exposed to tobacco smoke, and we performed several pulmonary functional tests and imaging techniques.
ResultsPulmonary function tests showed the volume expiration in the first second (VEF1) differs significantly between groups (p<0.001). Pulmonary compliance was reduced in the experimental group by 50% in comparison to the control group (male vs control p<0.001). Morphometric analysis: 17% reduction in lung volume with a destructive index (DI) of 45%. The intersection test had a DI of 43%. The free point test showed a DI of 44%.
ConclusionsThe implementation of our model generated the presence of emphysema and alterations in the lung physiology in the experimental group. We demonstrated evidence of 90% with emphysema.
Chronic obstructive pulmonary disease (COPD) is a rising health problem worldwide. The World Health Organization estimates that by the year 2020 it will be the third leading cause of death and the fifth most common cause of disability, and to this date there are no therapies to reduce the inevitable progression of this disease.1 One of the main causes of COPD is inhalation and/or regular exposure to tobacco smoke.
Involuntary exposure to tobacco smoke can cause significant adverse health effects.2 In fact, estimations suggest that for a non-smoker, involuntary exposure may have a risk equivalent to a consumption of anywhere from 4 to 10 cigarettes a day.3 The reason for this is that the smoke breathed by involuntary or passive smokers (a person who, within a closed environment, inhales tobacco smoke coming from smokers) contains a far higher concentration of certain toxic components than the smoke breathed directly by the smoker (person who has smoked any amount of cigarettes daily for the last month).4 Alveolar inflammation, obstruction and destruction are pathophysiological changes which manifest with an increase in airway resistance, the lowering of oxygen diffusion capacity, deterioration of the ventilation–perfusion relationship and a decrease in pulmonary compliance.
Different models have been developed to explain COPD's pathogenesis. The most important one is the inhalation of harmful stimulus. Different animals, such as guinea pigs, rabbits, dogs, rats and mice have been exposed to tobacco smoke. There are different methods for tobacco smoke exposure, such as through a mask or body chamber.5 The results obtained with this model are analyzed with physiological parameters as previously stated as well as with histopathological analyses such as the expansion method,6,7 evaluation methods with stained cuts and H&E stain, and indirect methods, like the fast interval processor.8,9
General objectiveThe objective of this study was the implementation of a tobacco smoke passive inhalation model in order to induce emphysema, prove morphological and morphometric changes in the lungs and analyze correlations with physiological variations in pulmonary volumes. Additionally, the three tissue loss (emphysema) quantification methods were compared.
Materials and methodsThe study included 20 Wistar rats. The experimental group (EG) consisted of 5 males and 6 females, with a weight of 150g each at the beginning of the study. The rats were kept in stable hosting conditions, in cages with an ad limitum diet. The control group (CG) was made up of 6 males and 3 females were paired with those of a similar weight to those in the EG at the end of the study.
- A.
Exposure to tobacco smoke:
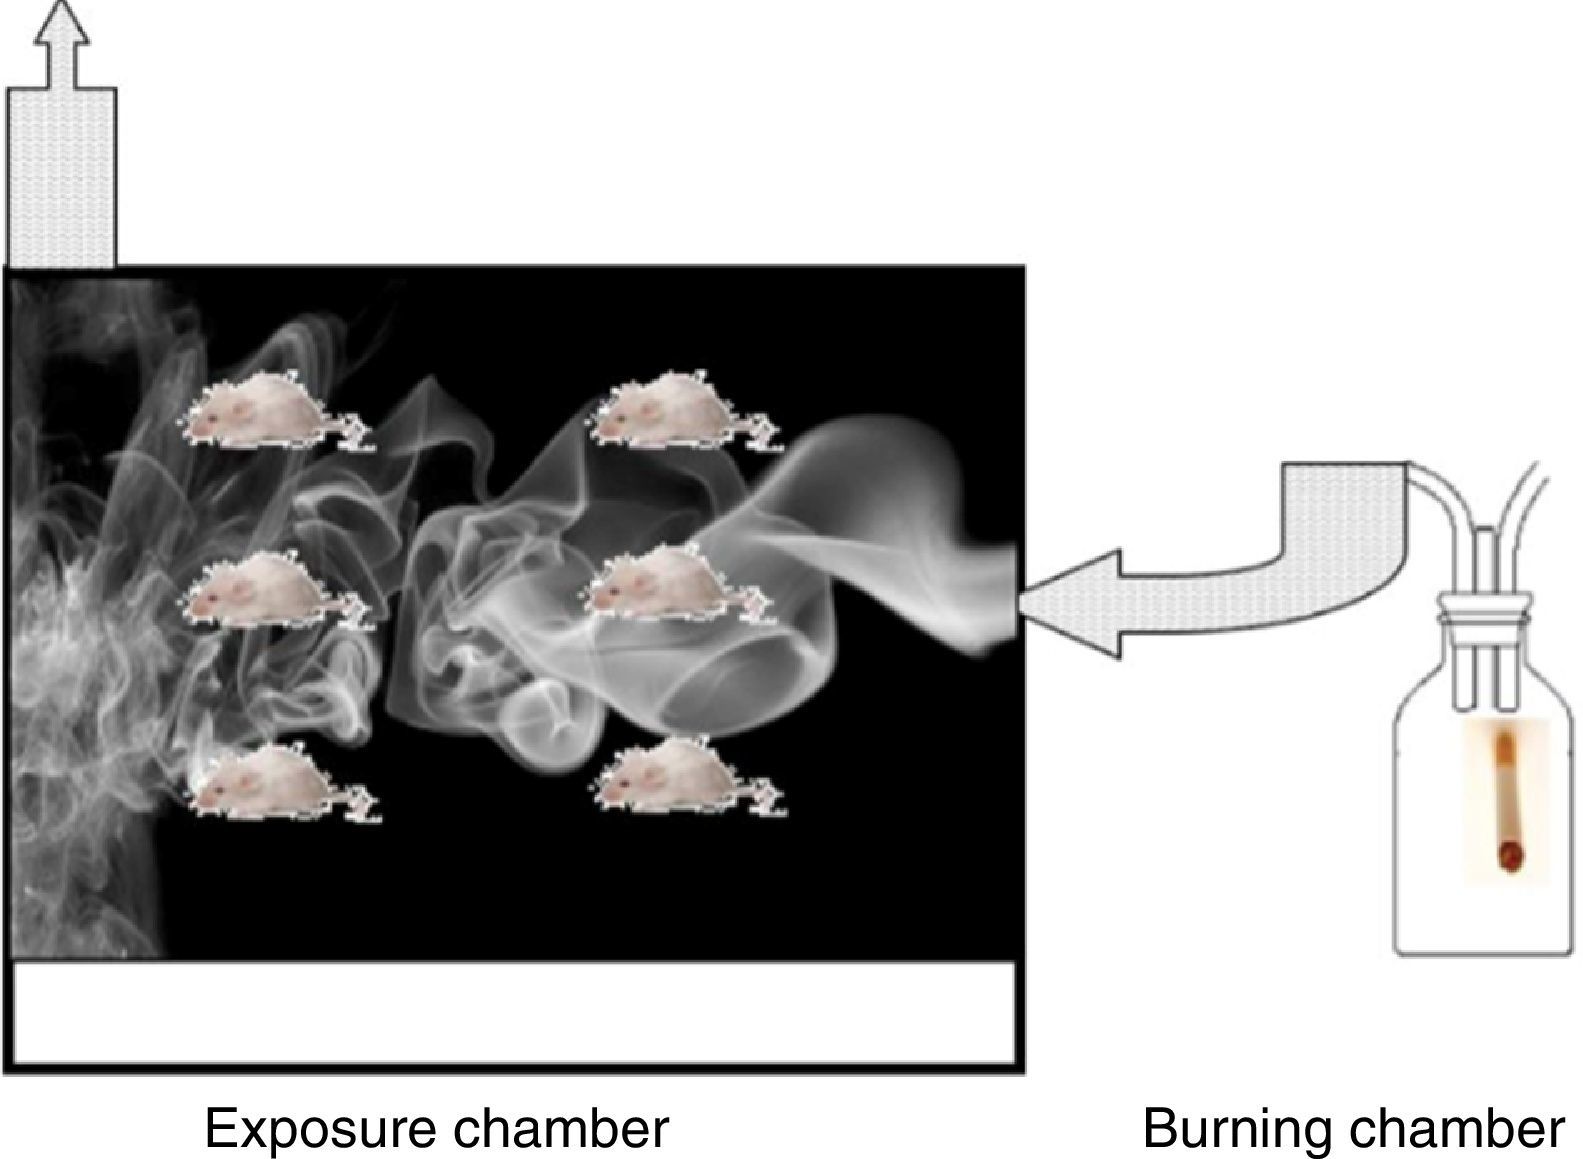
The Wistar rats used were each over 150g, 6 weeks old, with an ad limitum diet. Rats in the EG were exposed to the smoke produced by the combustion of 5 consecutive cigarettes with filters (Marlboro® red) for a 90min a day, 5 days a week, for a total period of 5 months. The exposure chamber was acrylic, 25×25×40cm, and was built with an upper chimney and an orifice in the lower part so smoke could be introduced. The smoke was generated in a combustion chamber formed by a glass jar through which ambient air was constantly pumped. The tobacco smoke was conducted through a tube toward the base of the box (Fig. 1).
- B.
Pulmonary dynamic measurement
Pulmonary function tests
- (1)
Tidal volume (flow) (TV) and respiratory frequency (RF) were calculated by placing the animal in a 1.5-liter plethysmograph connected through a MTL1 flow meter to a spirometer pod and using AID instruments® Power Lab hardware. After calibrating it and spending 10min of habituating, they were registered with Chart 5 during the next 15min.
- (2)
Forced expiratory volume measurement in the first second (FEV1), forced vital capacity (FVC), and maximum expiratory flow were performed after applying anesthesia with pentobarbital (50mg/kg intraperitoneally). A metallic stent was connected to the flow meter through a tracheotomy and a three-way connector was adapted to the other opening of the meter, one opening for free inhalation–exhalation (I–E), the second one connected to the flow meter and the third one to a 20-ml syringe. Normal respirations were registered for 5min, and a pentobarbital overdose was administered. When the breathing stopped the I–E way was occluded, and a volume of air equivalent to 5 times the TV was injected, this was calculated using the formula 0.0062×weight (kg). In order to obtain FEV1, the abdomen was pressed manually using half the distance between the back and rectum as a reference point, subsequently it was released via I–E simultaneously. These measurements were conducted in quadruplicate.
- (3)
Since the FEV1 percentage in relationship to FCV is considered in medical literature as one of the most important variables to define obstructive pathology, these percentages were obtained in order to compare them under the following parameters: Mild obstructive alteration (FEV1 60–80%), moderate FEV1 (40–59%) and advanced FEV1 (≤39%).
- (4)
Weight variables were analyzed through ANOVA tests of a contrast factor with the Scheffe test (non-homogeneous variances), taking p<0.05 to be a significant value.
Spirometry variables between EG and CG (same sex) were analyzed through the Student t-test for independent groups, prior to a Levene test to document the equality of variances. In the case of FVC and the FEV1/FVC relationship, we used the Mann–Whitney U test.
Pulmonary compliance and tissue preparation
- (5)
After conducting pulmonary function tests, the tracheal cannula was connected though a three-way valve to a water gauge, the anterior part of the thorax was removed and volumes of 5, 10, 15 and 20ml of physiological solution were injected. Water pressure during inflation was quantified in cm.
- (6)
The left lung was insufflated with formaldehyde at 10% until reaching a pressure of 25cm of water, the main bronchi was occluded and submerged in formaldehyde at 10% for 24h, and was subsequently histologically processed.
- (1)
- C.
Pulmonary histology and emphysema quantification
Morphology and morphometry
Both the lungs of animals exposed to tobacco smoke and those in the CG were fixed in formaldehyde, dehydrated, washed in toluene and placed in paraffin. Histological sections of 5 microns of thickness were performed and stained with hematoxylin, eosin and the Wilder method for reticular fibers; morphologic and morphometric evaluations were then conducted.

Morphometric analysis:
- (A)
Pulmonary tissue particle analysis:
- (1)
Capture: Images at 4× of the entire lung were taken using an Olympus BX41 microscope, and an Olympus SP-350 digital camera with a 32MB memory card. The pictures were stored in a Pentium 4 IBM computer.
- (2)
Processing: A total of 52 images of each lung were obtained. Subsequently, these images were combined using Adobe Photoshop, forming a single image or the entire lung.
- (3)
Image analysis: The application ImageJ by Tony Collins, PhD was used. The images were converted to 8-bit, then, through a “Rolling ball” algorithm, the background of the image was removed, thus obtaining a clearer image without shadows. Lastly, the image was converted to black and white. Once this process was performed and, using particle analysis, we obtained the percentage of tissue (Fig. 2).
- (1)
- (B)
Destructive index analysis using acetates with 50 countable dots.
- (1)
Image selection: Images free of large bronchioles, vessels, collapsed tissue or extensive fibrosis were obtained.
- (2)
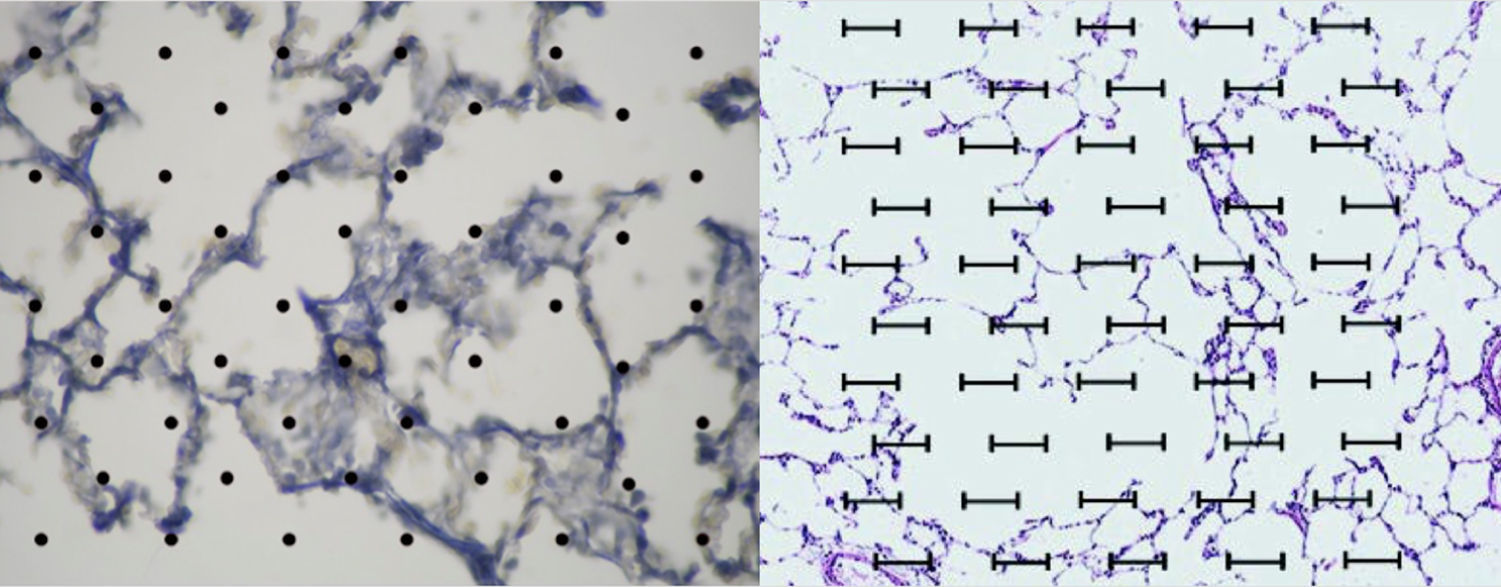
An acetate with 50 countable dots was used, which was placed over the computer screen. The latter showed the images of the tissues configured (in size A5) in relationship to the size of the acetate (Fig. 2).
- (3)
Destruction was defined based on one or two of the following criteria: (a) at least two defects on the alveolar wall, (b) at least two intersections with intramural parenchymal tissue in the alveolar ducts, (c) clear abnormal morphology or (d) classic emphysematous changes.
- (4)
The total amount of dots counted was divided between the total area of each lung, thus obtaining the area/dots ratio and an average. The results were included in the formula to calculate the destructive index [D/(D+N)]×100%, where D=dots where there are tissue defects compatible with those described in the last section and N=dots where there is normal tissue10 (Fig. 2).
- (1)
- (C)
Line intersection analysis.11
- (1)
Image selection: Images free of large bronchioles, vessels, collapsed tissue or extensive fibrosis were obtained. The same images used in the destructive index analysis with 50 dots were used for the alveolar wall intersection analysis.
- (2)
A horizontal acetate with 50 horizontal lines was placed over the computer screen, where we were able to see the images of the tissue configured (in size A5) in relationship to the size of the acetate.
- (3)
Images of bronchi, large bronchioles, blood vessels and collapsed tissue were excluded for measurement.
- (4)
The total amount of intersections counted was divided between the total area of each lung, thus obtaining the area/lines ratio and an average. The results were included in the formula to calculate the destructive index.
- (1)
 and line intersection (right).")
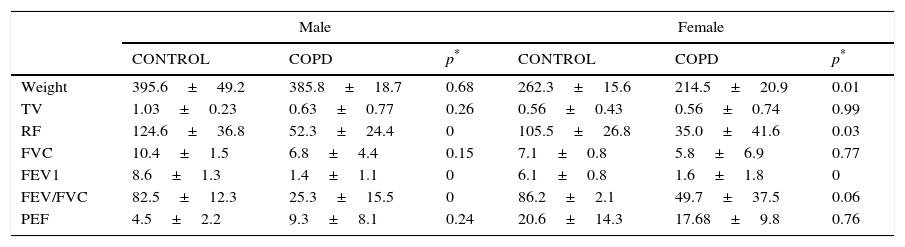
The comparison between EG and CG by gender showed similarities between TV, peak expiratory flow (PEF) and FCV. RF and FEV1/FCV between controls and experimental males differed significantly.
FEV1 differed significantly between both groups (Table 1). In the EG, FEV1 showed a severe alteration in 81.8% of the animals. 9.1% of the animals presented a mild alteration and the remaining 9.1% did not present anomalies.
Pulmonary function tests.
| Male | Female | |||||
|---|---|---|---|---|---|---|
| CONTROL | COPD | p* | CONTROL | COPD | p* | |
| Weight | 395.6±49.2 | 385.8±18.7 | 0.68 | 262.3±15.6 | 214.5±20.9 | 0.01 |
| TV | 1.03±0.23 | 0.63±0.77 | 0.26 | 0.56±0.43 | 0.56±0.74 | 0.99 |
| RF | 124.6±36.8 | 52.3±24.4 | 0 | 105.5±26.8 | 35.0±41.6 | 0.03 |
| FVC | 10.4±1.5 | 6.8±4.4 | 0.15 | 7.1±0.8 | 5.8±6.9 | 0.77 |
| FEV1 | 8.6±1.3 | 1.4±1.1 | 0 | 6.1±0.8 | 1.6±1.8 | 0 |
| FEV/FVC | 82.5±12.3 | 25.3±15.5 | 0 | 86.2±2.1 | 49.7±37.5 | 0.06 |
| PEF | 4.5±2.2 | 9.3±8.1 | 0.24 | 20.6±14.3 | 17.68±9.8 | 0.76 |
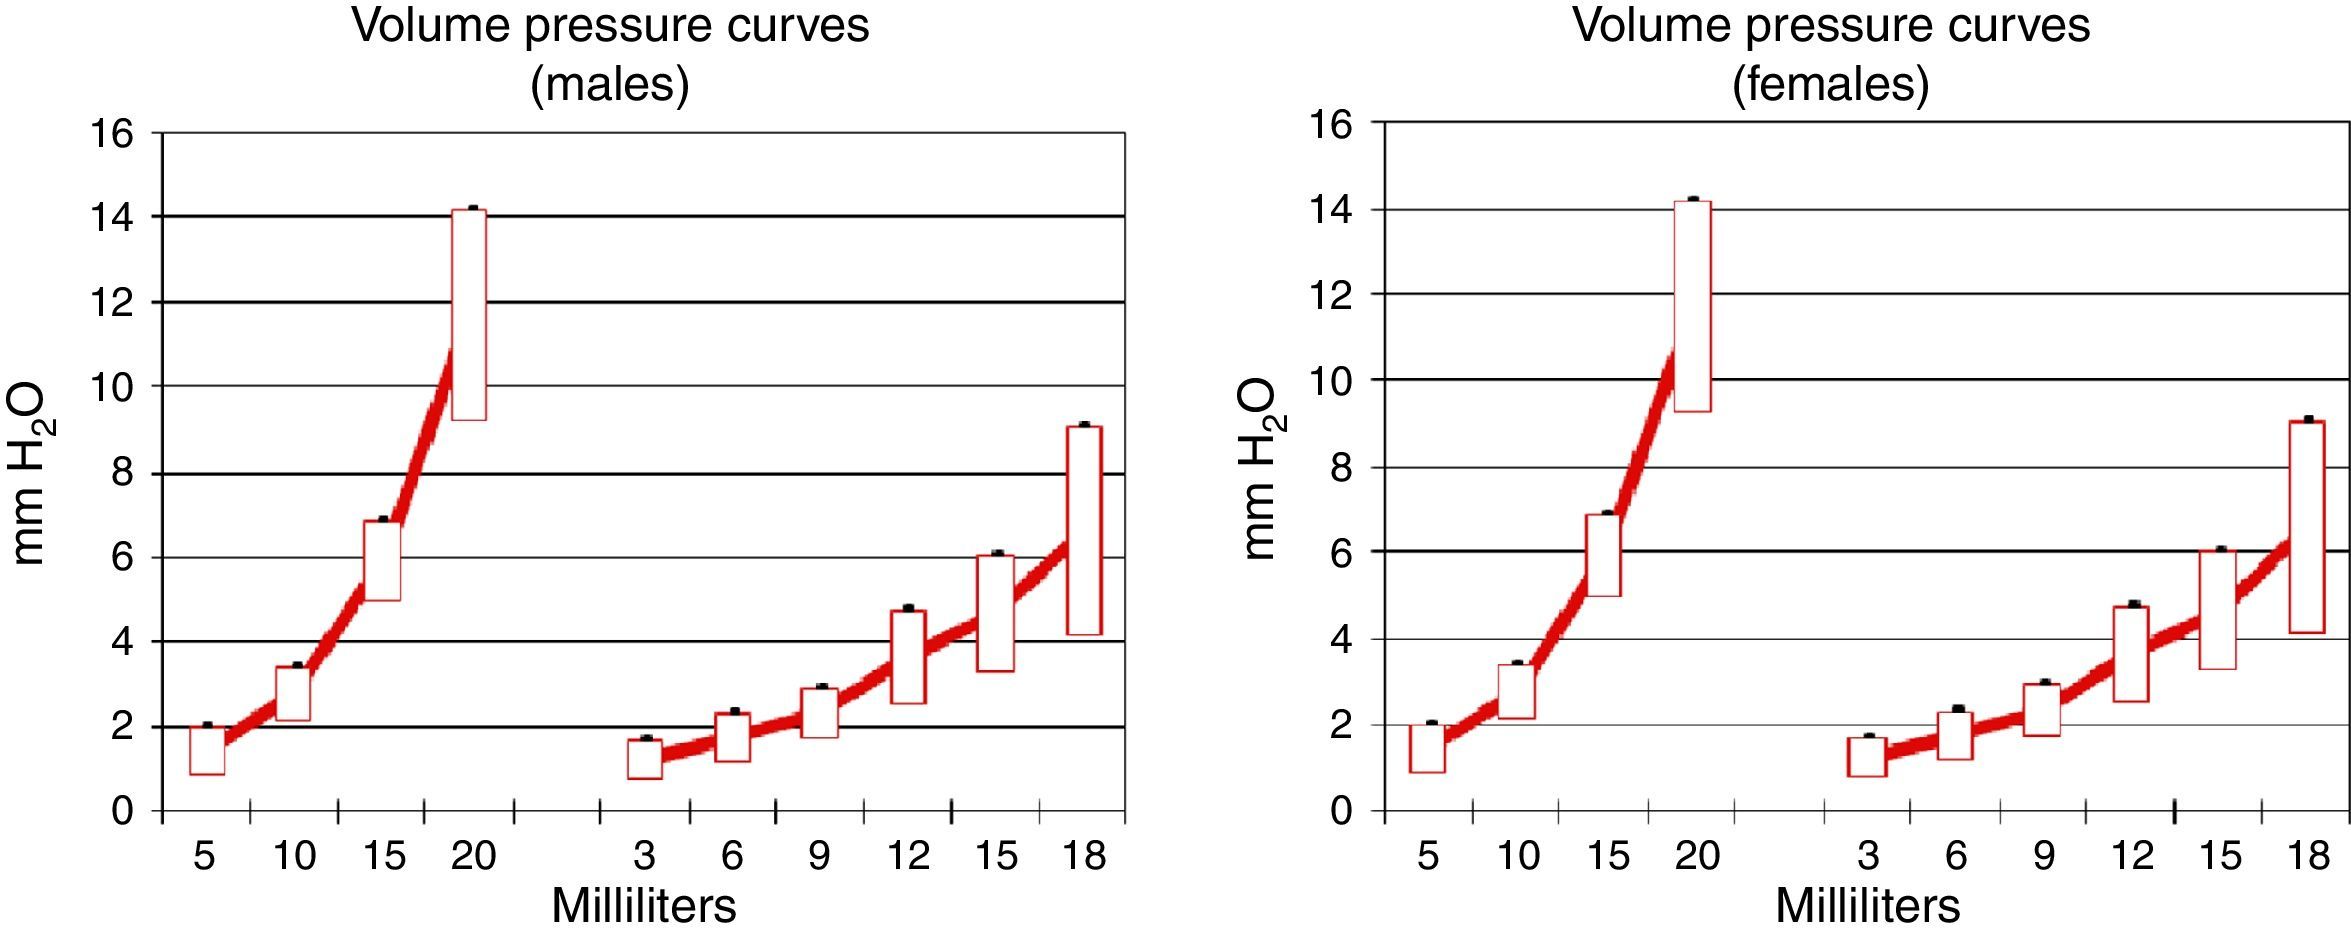
Pulmonary compliance decreased in EG, in both genders, proven by the reduction in the slope of the pressure–volume graph (Graph 1).
 and females (left). In each graph, the control group is shown on the left and the experimental group is shown on the right.")
Morphometric analysis:
- (1)
Particle analysis
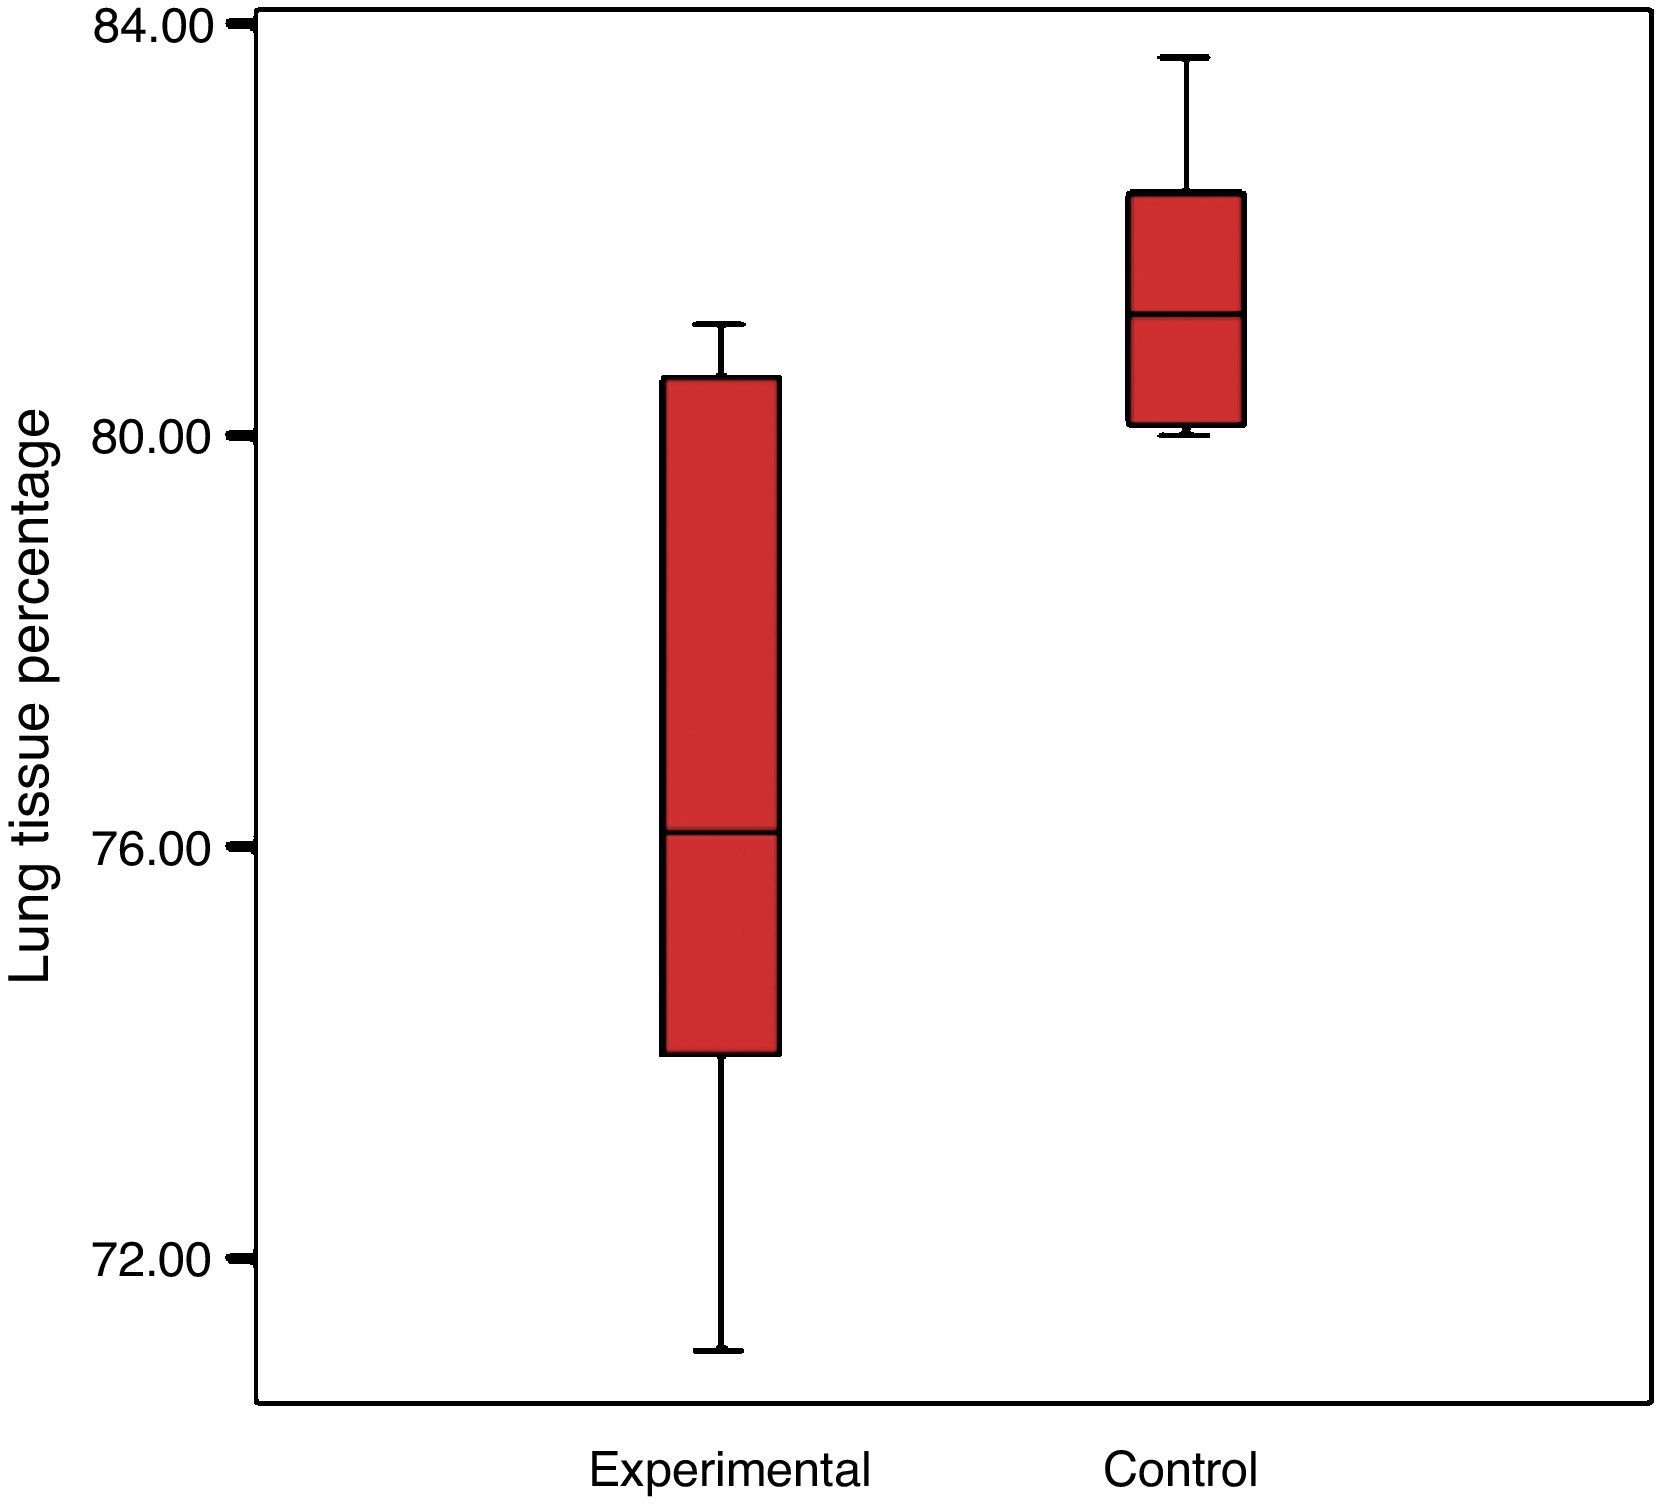
There was a reduction in the experimental group's percentage of cellular tissue, from 23.5% to 19.44%, which reflects that there was a loss of 17.3% of the tissue, when considering that the lung of the control group is 100%. The control group had a standard deviation of 4% and the experimental group 2.7% (Graph 2).
The average size of the tissue (in mm2) in the lungs of the control group was 8.9mm2, and was 7.47mm2 in the experimental group. This translates to an average loss of 1.5mm2 of tissue in the experimental group. The destructive index was calculated at 45.3%.
- (2)
Lines and dots intersection
The result of the area/lines index in the lungs of the CG was 0.014, and 0.011 for the EG. This is reflected as a 21.4% tissue loss in the lungs of the EG, taking into account that the lungs in the CG represent 100%. The calculated destructive index was 43.6%, with 100% being total destruction.
The result of the area/dot index in the lungs of the CG was 0.022 and 0.018 in the lungs of the EG. This is a tissue loss of 18.19% in the lungs of the EG. The calculated destructive index was 44.8%.
Pearson correlation between the results of both the lines and dots tests gave us r=0.576, p<0.05. This proves that both tests are valid to use in the morphometric analysis of pulmonary tissue.

The implementation of a tobacco smoke inhalation model is the closest to the habit of smoking. Physiological findings identified in this model partially match with published results of other models like the degradative enzyme instillation and genetic modification techniques, as well as with other harmful stimuli inhalation models.12 Unlike previously described models, we were able to observe that in our tobacco smoke inhalation model COPD-type lesions were generated and, even though it was a slow process, it was an easy and cheap one compared to other more sophisticated and costly models.
There is no doubt that the COPD induction model based on inhalation of tobacco smoke is the closest to the process that the habit of smoking causes in humans. Taking into consideration the design and application of the model, it was proven that passive exposure to tobacco smoke is significant in the development of this pathology. Studies which use biological markers such as cotinine report significant levels of environmental nicotine in the homes of smokers.13 The relevance lies in the fact that there are over 400 isolated substances of cigarette smoke, some of which have carcinogenic potential, like lead and polonium.14
Approximately half of all smokers have an early death caused by diseases linked to smoking.15 The existing relationship between smoking and the different types of cancer or cardiovascular diseases has been proven.16,17 For example, a 50 year study on health effects in British doctors showed that a doctor who was 35 years old or older who smoked had a life expectancy of approximately 10 years less than those who never smoked.
Because of the relative risks of suffering adverse health effects by being a passive smoker are much lower, they are less tangible than those of an active smoker. Studies, however, have proven correlations between passive smoking and a number of diseases, including lung cancer and heart disease.18
A meta-analysis of 37 epidemiological studies of lung cancer found a relative risk (RR) of lung cancer of 1.24, with a confidence interval (CI) of 95%, in non-smokers who lived with a smoker, compared to non-smokers who lived with non-smokers.19
Another meta-analysis of 19 published studies showed a relative risk of heart disease of 1.23, with a CI of 95%, in non-smokers who lived with a smoker versus non-smokers who did not.20
Estimations suggest that in the US, there are 60,460 deaths of passive smokers a year, versus 47,000 deaths by heart disease, 3060 by lung cancer and 10,400 of other cancers.21 A study of ischemic heart disease estimated a mortality risk for the non-smoker who lives with a smoking partner is 2.2% for men and 1.2% for women (RR assumed for heart disease: 1.31 and 1.24, respectively).22
Alveolar inflammation, obstruction and destruction are pathophysiological changes that manifest with a rise in airway resistance, a reduction of the capacity for oxygen diffusion, deterioration of the ventilation–perfusion relationship and a decrease in pulmonary compliance. Research of functional parameters, while still controversies in the study of this pathology, reports values which are the base for its own diagnosis. In this model, we are able to find from the studied parameters that the greatest objective to corroborate an obstructive pathology is the reduction of FEV1, since, in the other major parameters reported in other studies,23 FVC and FEV1/FVC did not show statistically significant differences between groups. In fact, FCV does not differ in any of the groups, in both males and females the FEV1/FVC relationship differs only amongst male COPD versus controls, which leaves them out of the criteria to include them as an objective parameter in the model. There is current evidence that females tend to develop emphysema before males do. In our study, it may be due to an insufficient sample size.24
During the pathological process of emphysema, the elastic pulmonary tissue is destroyed by different mechanisms, which reduces pulmonary compliance and provokes the lungs to resist volume pressure changes less. We found that the COPD groups (males and females) showed a reduction in pulmonary compliance according to the pressure–volume charts, which agrees with the alterations described by other authors.25,26 This allows us to consider pulmonary compliance as a major indicator in this model.
Only 9.1% of the animals did not develop emphysema, possibly due to a genic polymorphism. In the morphological analysis by dot intersection, which is a technique used to quantify the increase in the alveolar space size, a greater pulmonary parenchymal destruction was proven. As with the intersection with lines, this is a semi-quantitative test targeted to assess parenchymal destruction. A more specific test would be particle analysis, which is a computerized technique based on pixel counting in digital images, thus finding out the cellular percentage. This is the most specific technique to assess changes that occur in pathologies where there is loss of the parenchyma; therefore, it is the most recommended.
One of the limitations of the study is that we did not measure the carboxyhemoglobin or cotinine levels for an accurate measurement of tobacco smoke exposure as other studies have done.
The developed COPD model showed pathophysiologic results characteristic of emphysema, such as the destruction of the alveolar walls. The marked reduction in pulmonary tissue, which translates to parenchymal destruction of the EG, demonstrates the effect of tobacco smoke in the production of COPD. This proves the important relationship between morphology and ventilator function.
ConclusionsThe implementation of our model created the presence of emphysema and pulmonary physiological alterations in the experimental group.
Based on our results, we are able to conclude that there is a strong correlation between histopathological studies and those which assess pulmonary function since, from the animals which presented emphysema demonstrated by pathology, 90% presented alterations in the pulmonary function tests.
The three methods used to quantify tissue loss, the particle analysis and dot and line intersection, are effective in the assessment of emphysema. Nevertheless, out of the three, the method which is the easiest to apply is the particle analysis, since one of its advantages is that it is automatic. Also, its assessment is through computer software. However, this can turn out to be a limitation as well. Regarding the other two methods, they have the advantage that their technique is simple, yet they take a long time and their application is too elaborate.
The correlation between lines and dots intersection test results show that both are valid tests to use in the morphometric analysis of pulmonary tissue.
FundingNo financial support was provided.
Conflict of interestThe authors have no conflicts of interest to declare.
This research was supported greatly by Dr. Efrén Josimar Gutiérrez Enríquez, Dra. Carolina Morales Cuellar and Dra. Adriana Galdamez Tapia. We thank our colleagues who provided insight and expertise that greatly assisted the research.