


Firms strategically promote, foster and pursue a reputation for technological innovation. Yet, present research did not examine whether such perception actually coheres with innovative activity itself. Previous studies in this field often relied solely on tangible products/product introductions, hence we apply multiple proxies based on a firm's intangible innovative performance to examine the influences on reputation for technological innovation. Using patent, financial and consumer data our Poisson regression analyzes 65 international firms which have been nominated by 231 consumers. We apply time-series and likewise cross-sectional data for our interdisciplinary analysis. Our findings demonstrate that innovative performance (citation intensity) is linked to reputation for technological innovation. Counter-intuitively, our results provide evidence that marketing intensity negatively influences a reputation for technological innovation. From the results, we conclude that innovative performance may be associated with a reputation for technological innovation. Actual technological advancement attracts attention from consumers that cannot be purchased with greater marketing investments. This implies that consumers appreciate the costly and uncertain R&D efforts and value those firms that constantly offer innovation. As a theoretical implication, the consideration of intangible inputs for reputation research is an important contribution for a holistic understanding. The results represent essential strategic information for innovation and marketing functions, where both divisions need to align their activities and investments.
“You can’t buy a good reputation, you must earn it”
Can consumers assess the innovative performance of firms? There are strong signs suggesting that the subjective perception of innovative performance differs from objectively measurable performance criteria: The study “Navigating the Digital Future: The Global Innovation 1000” by Jaruzelski, Loehr, and Holman (2013) analyzed the top R&D spenders worldwide. In the same study, senior managers also ranked the most innovative companies according to their own perceptions. Exemplarily, Apple Inc. was perceived as most innovative company, however ranked on position 43 based on their R&D spending. Studying whether innovative performance and reputation cohere is legitimate and urgent, particularly when considering the benefits of a good reputation (Boyd, Bergh, & Ketchen, 2010; Henard & Dacin, 2010).
Most papers in this field investigated reputation as a resource of competitive advantage with effects on financial results (Roberts & Dowling, 2002) or shareholder value (Raithel & Schwaiger, 2014). Fewer studies researched how firms gain reputational status and how reputation as a signal contributes to defending a strategic, competitive position (Shamsie, 2003). Basdeo, Smith, Grimm, Rindova, and Derfus (2006) found that reputation is substantially affected by both a firm's own and its rivals’ activities. Henard and Dacin (2010) specifically investigated the development of reputation for product innovation, finding that consumers increase their loyalty, their excitement and their tolerance for failure. Recently, Stock and Zacharias (2013) found positive effects of product meaningfulness and negative effects of product newness on customer loyalty.
Although the topic is relevant for research and practice, prior papers have been limited. First, previous research on the reputation for technological innovation addressed “innovative performance in the narrow sense” (Freeman & Soete, 1997; Hagedoorn & Cloodt, 2003), i.e. product innovations. Henard and Dacin (2010) developed a specific “reputation for product innovation”, showing that firms yield a specific reputation for introducing product innovations to the market. A shortcoming is the focus on “innovative performance in the narrow sense” (Hagedoorn & Cloodt, 2003), by focusing on products/product introductions which are tangible and visible aspects (Freeman & Soete, 1997; Henard & Szymanski, 2001; Szymanski, Kroff, & Troy, 2007). Henard and Dacin (2010, p. 322) in particular state that “one cannot simply rely on a proxy (e.g. number of patents filed, R&D dollars spent) to adequately capture the true measure of an organization's reputation for product innovation”. We extend this by using multiple proxies based on patents, its citations and R&D spending. Patents are often considered to be the ultimate and accepted measure of an organization's innovative output (Griliches, 1990; Hirshleifer, Hsu, & Li, 2013). In many high-tech industries, innovative products new to markets are often based on patents (Battisti, Gallego, Rubalcaba, & Windrum, 2015) as they protect innovation which is often economically relevant and thus actively commercialized (Eusebi & Silberglitt, 2014). Therefore, patents are established intellectual property rights used by firms to sustain competitive advantage (Hall, 1993). Today, it remains unclear whether these two factors for competitive advantage, innovative performance and reputation for technological innovation, are empirically associated. Considering its market benefits and its influence on long-term competitiveness (Hörner, 2002; Raithel & Schwaiger, 2014), the question of whether innovative performance can yield effects on reputation needs to be researched.
Second, we examine the influences of marketing investments in this regard. Scholars find that companies, which deploy more resources in marketing are thus able to better preserve innovation (Chandy & Tellis, 2000). The possibility of a firm to strategically position itself in a favorable light reduces the constituents’ search for information (Fombrun & Shanley, 1990). For example, Samsung Electronics spent 14 billion US-Dollars on advertising in 2013 (Gilbert, 2013). However, truly innovative firms, often younger and new to the market thus have scare resources to invest in marketing. The establishment of their technological reputation and its strategic positioning may rely rather on their ability to develop and introduce cutting edge research and development than on marketing efforts. Small firms can be efficient in coordination, being able to answer and adapt rapidly to the market with new and innovative products (Artz, Norman, Hatfield, & Cardinal, 2010). Such technology lead “is like a high tree in a small forest; since it gets more sun, it will grow faster and stay taller” (Wernerfelt, 1984, p. 174). Since previous research did not concentrate on patents and R&D in this setting, we aim to find whether placing marketing cues, e.g. to demonstrate technological superiority for consumers, may be advantageous to achieve gains for a technological reputation.
Third, there is a methodological gap because research in innovation management usually applies variables such as patents or R&D spending, whereas consumer research uses psychological measures (Archibugi & Planta, 1996). Our interdisciplinary approach applies specific algorithms to connect consumers’ perceptions of innovative performance to the corresponding innovative performance of firms (cf. Nagel, Höflinger, & Welpe, 2014). We apply patent information from the worldwide patent statistical database (PATSTAT1) provided by the European Patent Office. This study relies on a fact-based evaluation rather than survey-based constructs for the assessment of innovative performance. This enables and justifies the pressing research quest for actual innovative activity. With the combination of both approaches, it is possible to derive a comprehensive perspective on how perceptions and reality cohere.
In addressing the aforementioned gaps, this paper yields the following contributions. We add to current reputation research by showing that reputation for technological innovation is actually associated to the innovative performance of companies. We find significant support that inventive performance as measured by citation intensity is related to reputation for technological innovation. The higher the citation intensity, usually employed to identify patent quality and value (Hall, Jaffe, & Trajtenberg, 2005), the better the corresponding reputation. Thus, we are able to show that innovative performance can be positively associated with the consumer's perception of innovative entities. This insight is new to current reputation and innovation research because prior studies mainly investigated “innovative performance in the narrow sense”, by exclusively using products/product introductions (Freeman & Soete, 1997; Hagedoorn & Cloodt, 2003; Henard & Dacin, 2010). Above, we have significant evidence that marketing intensity is negatively related to reputation for technological innovation. In the case for a technological reputation, the result suggest that marketing investments should be rather spent on “true” technological advancements rather than on advertising to achieve gains in technological reputation. Further, the incorporation of intellectual assets as patents and citations is an important step toward a better understanding of knowledge and a technological reputation.
The remainder of this paper is divided as follows. The next chapter provides a theoretical background to develop the model and its hypotheses. Our description of methods introduces data and measures. Then, we provide additional statistics and a test of our hypotheses in the results section to critically discuss the findings. After outlining the implications of this research, we suggest opportunities for further research.
Theoretical backgroundReputationReputation can be viewed as the sole most appraised organizational resource (Gibson, Gonzales, & Castanon, 2006; Walker, 2010). Similarly, Hall (1993) discovered that chief executive officer's classify reputation as the most relevant intangible asset. It is also widely accepted that reputation and competitive advantage cohere (Fombrun & Shanley, 1990; Hall, 1993; Roberts & Dowling, 2002), and multiple scholars found that reputation and firm performance are linked (Brown & Perry, 1994; Deephouse, 2000; Fombrun & Shanley, 1990; Walker, 2010). In today's competitive environments, the role of reputation is remarkably essential (Abimbola & Vallaster, 2007).
Generally, companies compete for reputational status as they compete for customers (Fombrun & Shanley, 1990), because reputation represents an important intangible resource for competitive advantage (Hall, 1993; Roberts & Dowling, 2002; Walker, 2010). A good reputation has multiple strategic benefits, because it helps firms to distinguish themselves from rivals (Peteraf, 1993), and it decreases information asymmetry and uncertainties of the consumer (Boyd et al., 2010; Weigelt & Camerer, 1988). Moreover, a good reputation increases overall firm image, the loyalty to the firm, the tolerance for failure and the propensity to pay premium prices (Henard & Dacin, 2010). Reputation is key in understanding why certain firms outperform other organizations (Boyd et al., 2010), which is viewed by many as the fundamental question of the strategic management field (Hitt, Boyd, & Li, 2004; Rumelt, Schendel, & Teece, 1994).
Reputation for technological innovationReputation is manifold (Rindova, Williamson, Petkova, & Sever, 2005), meaning that organizations operate in diverse settings and address multiple groups that evaluate signals differently. Lange, Lee, and Dai (2011) developed a general conceptualization that organizations are either “being known”, “being known for something” or are regarded as “generally favorable”. For instance, accounting signals can be used to assess corporate performance, whereas strategic signals evaluate the relative position of companies in competitive environments. Similarly, there are multiple ways a company can signal quality to consumers. Potential signals of product quality include e.g. price, brand name, warranty and advertising expenditures (Kirmani & Rao, 2000).
Within this study, we concentrate on organizations that are “known for something” (Lange et al., 2011), more specifically for reputation for technological innovation. Such reputation entails perceptions regarding a very specific and interesting characteristic for the observer (Lange et al., 2011). “Innovation” is generally associated with positive ideas such as change, newness, improvement, value and benefits (Courtright & Smudde, 2009). Schumpeter (1934) finds that innovative organizations are regarded as advanced, active and willing to take risks. In other words, innovation covers a set of characteristics that are valuable to possess within competitive markets. Reputation for technological innovation is one of these multifaceted constructs of reputation (Rindova et al., 2005). Every year firms spend a billions in R&D in order to compete, succeed and survive (Wood & Hoeffler, 2013). Firms aggressively foster their perception of being innovative entities (Henard & Dacin, 2010). We extend the research of Henard and Dacin (2010) to research the less tangible facets of an innovate reputation (e.g. patents). We do so because products are often only consequences of patents (Malewicki & Sivakumar, 2004) and patents have regularly been a measure of technological innovation (e.g. Abraham & Moitra, 2001; Johnstone, Haščič, & Popp, 2010). Our study adapts the definition of Henard and Dacin (2010) and defines (cf. p. 1594 in Shams, Alpert, & Brown, 2015): […] consumer's perception of a firm's track record of technological innovation, degree of creativity, and potential for continued innovative activity.
Reputation among customers, consumers and further constituents is hence a subjective impression of firms (Schwaiger, 2004) and of course its offerings (Shams et al., 2015). How firms can achieve gains, specifically for a technological reputation is hence a difficult task but offers many different opportunities as e.g. leaps in science, new products, design innovations, process innovations and so forth. An innovation is viewed to be “an idea, practice, or object which is perceived as new by the individuals or other units of adoption” (p. 11 in Rogers, 2003). Scholars view that the subjective assessment of innovation is often related to two conceptualizations: basically either product-based or organizationally related (Shams et al., 2015). Kunz, Schmitt, and Meyer (2011) suggest that both concepts are thus interrelated and consumers capture a more comprehensive perspective. They rely on a range of activities and elements to derive a judgment whether a company is innovative as a whole. Further, the success of an innovative firm, meaning its reputation, also depends upon their capability of commercializing their innovative and creative knowledge into marketable solutions (Kunz et al., 2011).
Theories of reputationWalker (2010) divided the current research on reputation from a theoretical perspective into institutional theory, signaling theory and finally the resource-based view. Institutional theory (Meyer & Rowan, 1977) is focused on building reputation, more specifically, on how organizations obtain support as institutions and receive legitimacy (Deephouse & Carter, 2005; Walker, 2010). Conversely, the resource-based view (RBV) aims at investigating outcomes of reputation (Barney, 1991), viewing reputation as an intangible resource. The RBV for instance explains why a severe reputation enables a competitive advantage (Hall, 1992). Competitive advantage exists when rivals are unable to reproduce or implement the benefits of a certain behavior (see Barney, 1986 for more information). Applying the RBV for reputation fulfills all the requirements to explain a competitive advantage (Lin, Yang, & Arya, 2009; cf. Nagel et al., 2014); a proper reputation is valuable because it helps to overcome information asymmetries to achieve a positive public perception (Fombrun & Shanley, 1990). Reputation is rare, because it is inconsistently spread across industry participants. Reputation is inimitable because it is causally ambiguous and socially complex (Lin et al., 2009). Based on the fact that reputation is hierarchically allocated and information is incomplete, there is no substitute available to it (Lin et al., 2009).
Finally, signaling theory is focused on how to gain, maintain and defend reputation (Basdeo et al., 2006; Shamsie, 2003). Several studies employed signaling theory to investigate the development of reputation and how reputation as a signal contributes to defending a strategic position in competition (Basdeo et al., 2006; Shamsie, 2003). Signaling theory is based on situations that are characterized by incomplete information (Akerlof, 1970; Spence, 1973). These settings feature ubiquitous uncertainty between interacting parties. The inherent risk that is taken by one party, while engaging in any type of exchange relationship with another, can be lowered via searching and processing information regarding the counterpart. This action is performed by interpreting observable characteristics. Those attributes are fixed to the entities, and others can be actively influenced. In the terminology of signaling theory, the former are called indices and the latter are termed signals (Spence, 1973). In practice, incomplete information is an obstacle, hindering risk averse consumers from buying from companies that are new to the market and yet unknown (Nayyar, 1990). This initial competitive disadvantage must be overcome by effectively signaling quality to consumers (Kirmani & Rao, 2000; Rao, Qu, & Ruekert, 1999); this commonly means attesting to the firm's capability to meet customer needs.
Together with signaling theory, cue utilization theory is also often used to explain how firms shape their image across consumers. A signal is basically a cue which a seller can use “to convey information credibly about unobservable product quality to the buyer” (Rao et al., 1999, p. 259). The theory proposes that e.g. a product does exhibit a bundle of cues according to its diagnosticity and the existence of other cues (Purohit & Srivastava, 2001; Wang, Cui, Huang, & Dai, 2016). Gidron, Koehler, and Tversky (1993) categorized cues into either “high scope” or “low scope”. The former are usually substantiated over a longer time and are thus rather believable and reliable (e.g. reputation) whereas the latter can be manipulated as product warranty or price (Wang et al., 2016). When individuals are encounter multiple cues during decisions, they tend to enact more often based on high scope cues and the effect of other cues is mitigated (Utz, Kerkhof, & van den Bos, 2012; Wang et al., 2016).
Innovative performanceFor many firms, intangible assets increasingly “surpass physical assets […] both in value and contribution to growth” (p. 7 in Lev, 2000). Hence, abnormal profits and dominant competitive positioning are achieved by the right deployment of intangibles (e.g. patents, trademarks, copyrights) and with other types of assets such as raw materials, financials or productions facilities (Lev, 2000). Innovative performance is the outcome of these complex processes. The ability of firms to develop, produce and successfully introduce innovations to the market is related to competitive advantage (Lengnick-Hall, 1992). Hall (1993) and Coyne (1986) point at the use and strategic value of intellectual assets as patents in this regard, providing regulatory capabilities in strategic positioning. To measure a firm's performance in regard to innovation dimensions, Hagedoorn and Cloodt (2003) introduced the concept of “innovative performance”. Thus, innovative performance is useful to evaluate various dimensions of innovative efforts and can be narrowly subdivided into the following: (1) “inventive performance”, (2) “technological performance” and (3) “innovative performance in the narrow sense” (p. 1366 in Hagedoorn & Cloodt, 2003).
“Inventive performance” can be defined “as the achievements of companies in terms of their ideas, sketches, models of new devices, products, processes and systems” (Ernst, 2001; Hagedoorn & Cloodt, 2003). The concept represents the output of the innovative efforts of firms and thus deliberates the intellectual creativity and the available knowledge within a firm. It is usually applied by using patent counts or patent citations (Hagedoorn & Cloodt, 2003).
“Technological performance” is determined as “the accomplishment of companies with regard to the combination of their R&D input, as an indicator of their research capabilities, and their R&D output in terms of patents” (p. 1367 in Hagedoorn & Cloodt, 2003). Technological performance is comparable to Hirshleifer et al. (2013) understanding of “innovative efficiency”, which is “a firm's ability to generate patents and patent citations per dollar of research and development (R&D) investment” (p. 2).
“Innovative performance in the narrow sense” is regarded as an organization's capability to regularly introduce products to the marketplace (Freeman & Soete, 1997; Hagedoorn & Cloodt, 2003) and makes use of new product introductions.
All of the constructs introduced in this section describe different perspectives and measurements of the output of innovation. Many studies employ this concept as a prevalent source in different contexts. In a recent study, Zwick, Frosch, Hoisl, and Harhoff (2017) research individual-level drivers of fostering inventive performance in firms and find that ability and problem solving style are significantly related. Brem, Nylund, and Schuster (2016) examine the how the existence of a dominant design affects innovative performance in a sample of 2.5 million patents among radical innovation and process innovation. Fang, Wang, and Chen (2016) investigate network structures in order to evaluate the chances of increasing the firm's innovative performance by making use of recognizing new knowledge sources. Recent research applies similar measures of innovative performance and many of its sub segments.
HypothesesIn competitive high-tech environments, firms actively promote their perception of being innovative entities (Henard & Dacin, 2010). Although innovative performance is an essential part of competitive advantage, its relation to reputation remains to be researched more extensively. Rindova et al. (2005) explicitly find that further research needs to determine how organizational resources attributes affect reputation. In the following hypothesis development, we will explain that this interdisciplinary setting requires elements of both theories, namely the resource-based view and signaling theory. Anything that is made by companies for the sale on competitive markets, obviously with the help of intangible assets, is logically required to be somehow perceived by its constituents. The resource based view is suited to explain particular capability of firms to develop and commercialize innovative solutions (Barney, 1991). Signaling theory and cue utilization theory are used to explain how firms shape their image across consumers (Rao et al., 1999; Spence, 1973).
Examining important studies in reputation research, the common finding is that consumers in different settings have difficulties in predicting and evaluating future firm outputs and their behavior (Lange et al., 2011). The internal workings of a firm are rather opaque with limited availability of information regarding organizational abilities and intentions (Rindova et al., 2005). Therefore, there are reasons to doubt the signaling value of less tangible facets, such as patents and R&D (Henard & Dacin, 2010). Rindova et al. (2005) explicitly highlighted the role of knowledge as an intangible asset in this context. The authors argue that “the difference [to inputs] may also be because of the fact that the quality of productive assets, especially knowledge assets, is complex and difficult to observe, therefore reducing their value as a signal that stakeholders can readily use to form expectations about quality” (p. 1045 in Rindova et al., 2005). This is most likely the case, even though the external validation of the basic technology (by the respective patent office with the patent grant) can often be seen as an external positive evaluation of the companies’ ability to develop innovation. Strictly in accordance with these assumptions, we take away that intangible resources as patents, citations and R&D spending are very complex and difficult to detect by consumers.
From a practical perspective, the above mentioned argumentation may not fully incorporate certain preconditions that characterize industries where technically innovative firms operate. High-tech firms usually act on markets with high barriers to enter (Carpenter & Petersen, 2002), shortening product cycles (Ali, Krapfel, & LaBahn, 1995) and large R&D investments (Neelankavil & Alaganar, 2003). The intellectual property protection in these industries is shaped by a trend of increased patenting activity (Hirshleifer et al., 2013), also often referred to as a “patent explosion” (Hall, 2004). The annual report “The most innovative companies” from The Boston Consulting Group (Wagner, Taylor, Zablit, & Foo, 2014) highlights that a key strategy of the firms on the report is “to leverage their IP both to exclude rivals and to build markets” (p. 11). That strategy has been found to be repeatedly successful for “breakthrough innovators” for several years (Wagner et al., 2014). In the long run, firms do likely secure its competitive advantage via patents (Cohen, Nelson, & Walsh, 2000), including established firms as well as ventures for whom intellectual property is their precious asset (Gans & Stern, 2003). The consequence is that innovative products new to markets are likely to be protected by patents (Battisti et al., 2015). In that sense, Wernerfelt (1984) finds that “most products require the services of several resources and most resources can be used in several products” (p. 171). Even tough consumers may have difficulties to accurately observe intangible assets as described above (e.g. Rindova et al., 2005), the products are still likely to be embodied by them (Archibugi & Planta, 1996). Many products are even composed of “numerous separately patentable elements” (p. 14 in Cohen et al., 2000).
The fact that these patented technologies have to be novel in order to get granted by the patent office (USPTO, 2016) however logically increases the introduction of “new” technology. By definition, patents have to be the first of its kind (“novelty”), a nontrivial extension of what is known and finally useful thus having commercial potential (Hall, Jaffe, & Trajtenberg, 2000; Merges, 1988). Securitizing proprietary innovation is usually fostered when technologies are likely to become economically valuable (Eusebi & Silberglitt, 2014) and are thus commercialized. Otherwise, the economic payoff for engineering, time, capital, legal and human resources into filing patents would not be given (Archibugi & Planta, 1996). The higher the ability to produce leading patented innovation increases the chance that technologically innovative products are finally brought to the market. This is also confirmed by Artz et al. (2010) who find that patents are positively associated to product introductions in a longitudinal study in 35 industries over 19 years. Above, the temporal monopoly for that certain invention secures the ability to be the only firm offering that technology (USPTO, 2016). Creating something inimitably that makes it difficult for rivals to copy with certain technology-based features enhances the value for the consumer (Hanaysha, Hilman, & Abdul-Ghani, 2014). Research also discovered that the main factor of product failure is the absence of innovation with a novel and unique aspect (Sethi, Smith, & Park, 2001). As “newness” usually largely shapes consumers perception of innovation (Garcia & Calantone, 2002; Shams et al., 2015; Tomczak, Vogt, & Frischeisen, 2016), the perception should therefore be positively influenced based on fundamentally new technology. We therefore argue that the higher the technologial performance and inventive performance of firms, the higher should be its reputation among consumers to be also technologically innovative. Weighing the arguments from above, relying on signaling theory and cue utilization theory alone would logically result in a negation of these relations (cf. Popper, 1959), meaning that consumers can most likely not evaluate and assess intangibles as patents and R&D. However, looking at the predominant circumstances in competitive markets and the inclination toward proprietary protection it is hypothesized as follows:Hypothesis H1 Technological performance (patent stock/R&D stock) is positively associated with reputation for technological innovation. Inventive performance (citation intensity) is positively associated with reputation for technological innovation.
Furthermore, we hypothesize about influences that may shape the perception of a technologically innovative firm. In almost any market, marketing is a central part of an organization's collective strategy (Neelankavil & Alaganar, 2003). Scholars found that firms advertise to build favorable and strong images in consumers’ minds (Aaker, 2012; Collins & Han, 2004). Furthermore, it has been shown that these investments do result in positive outcomes in terms of firm perception (Cobb-Walgren, Ruble, & Donthu, 1995). Firms set cues over time to establish their reputation (e.g. Wang et al., 2016) by making use of marketing investments (Srinivasan, Pauwels, Silva-Risso, & Hanssens, 2009). Advertising functions ideal when a company does offer something new to the consumer (Lodish et al., 1995), which can help to shape strategic positions of firms to differentiate then from competitors (Fombrun & Shanley, 1990; Rumelt, 1987). In a high-tech environment, firms actively promote and shape their perception of being innovative entities (Henard & Dacin, 2010), as technologically innovative firms need to introduce their products successfully (Neelankavil & Alaganar, 2003). Scholars find that firms which deploy more resources in marketing are thus able to better preserve innovation (Chandy & Tellis, 2000). In this vein, marketing cues can include technical novelty in comparison to its predecessors (Pauwels, Silva-Risso, Srinivasan, & Hanssens, 2004), new attributes of an innovation providing added value (Mukherjee & Hoyer, 2001) or a novel design for the perception of technological innovation (Rindova & Petkova, 2007). The possibility of a firm to strategically position itself in a favorable light reduces the constituents’ search for information (Fombrun & Shanley, 1990). As any allocation of capital, marketing spending is likewise a strategic investment that should most effectively foster the desired firm image to withstand competition. In accordance with the logic described above, the hypothesis is as follows:Hypothesis H3 Marketing intensity is positively associated with reputation for technological innovation.
The data for this study consist of consumer data, patent data and financial data (cf. Nagel et al., 2014).
Consumer dataWe obtained the consumer data via an online survey among a consumer sample from February through March 2013. We invited 2367 consumers by email to complete our survey in an online community. The topic was the technological performance of firms. We did not provide any incentives. In this approach, 7.09 percent responded to the invitation. Second, we approached another online community in which 474 consumers were invited to complete the identical survey with a response rate of 16.24 percent. In total, we gathered 244 questionnaires in which 231 (8.13%) provided the needed information. In the survey, we requested a recall task; consumers needed to freely recall the names of the five technologically most innovative companies they can think of (for more information see measures). Additionally, we collected demographic data (age, gender, level of education, field of study, and field of work experience) from the participants. With this list, we generated and searched for the required patent and financial information.
Patent dataThis study's patent data were generated from the EPO worldwide patent statistical database (PATSTAT). EPO's PATSTAT collects bibliographic patent information for over a hundred patent offices in a transparent manner, with data that often date to the nineteenth century (De Rassenfosse, Dernis, & Boedt, 2014). The data provide information on the firm's patent applications and the portfolio. Because consumers occasionally named the parent company (e.g. “Facebook”) or a subsidiary (e.g. “Whatsapp”), we collected the data for both entities. In order to assign the appropriate patents to a company we applied a semi-manual approach (Boeing, Mueller, & Sandner, 2016). For each company we defined a set of search patterns including the corporate name, its main name changes and variations (Nagel et al., 2014). Exemplarily, a company named StemCells, Inc. holds patents under the patent applicant names “StemCells, Inc.” and “Stem Cells, Inc.”; to obtain all relevant patents we exemplarily defined the two search patterns “STEMCELLS” and “STEM CELLS”. With these two search patterns we were able to identify all relevant patents even though different variations of the corporate name exist. This way, we were able to compensate different variations of name spellings in multiple legislations and also spelling errors on behalf of the patent offices. Hence, for the firms we are not able to gather patent data within the PATSTAT database, due to inconsistencies in large datasets, we applied dummy variable to account for these firms (see measures). In total, we gathered patent data for 46 of 65 companies.
Financial dataWe collected most firms’ financials from Thomson Reuters. For the non-publicly traded firms, we manually collected the information from income statements and balance sheets from e.g. data providers as Orbis. For firms for which there was no information collected in the prior steps, we contacted the public relations department by email to provide the necessary financials. Not all firms provided us with information because of their restricted financial policies. Some firms explicitly do not publish or any financial information. In total, we were able to obtain complete financial data for 48 of 65 firms. Next, we merged these three datasets for further analysis. The dataset for regression offers information for 231 consumers, 65 firms and in total 1046 observations (Nagel et al., 2014).
MeasuresDependent variableReputation for technological innovation: We invited the participants to freely recall the five most innovative companies in their perception. Consumers needed to provide their answers in ranked order starting with the technologically most innovative firms. Furthermore, we did ask the consumers to name only technologically innovative companies (Nagel et al., 2014). We are aware that there are various paths to innovation (Chandy & Tellis, 1998), so asking strictly for technologically innovative firm should ensure that respondents are not confused with other types of non-technology innovations (e.g. new organizational processes such as selling directly to consumers or a new website). Our procedure is similar to the annual report “The most innovative companies” from The Boston Consulting Group (Wagner et al., 2014). We specifically did not provide a list of predefined firms to choose from. Instead, we used an unaided recall task as e.g. in Nedungadi and Hutchinson (1985), Kim and Kim (2005) or Agarwal and Rao (1996). Predefined firm lists, such as the Fortune ranking used by Roberts and Dowling (2002), preselect a firm by its revenue in a given year. In addition, this would result solely in large firms, but technically innovative firms are often relatively new to a market, such as Tesla or Dropbox. For the further understanding of the data, it is important to note a lower number is actually a better place in the corresponding ranking (position “1” is the lowest number for the statistical analysis, but the technologically most innovative firm). Exemplarily, negative correlations indicate that higher values are associated with higher ranks.
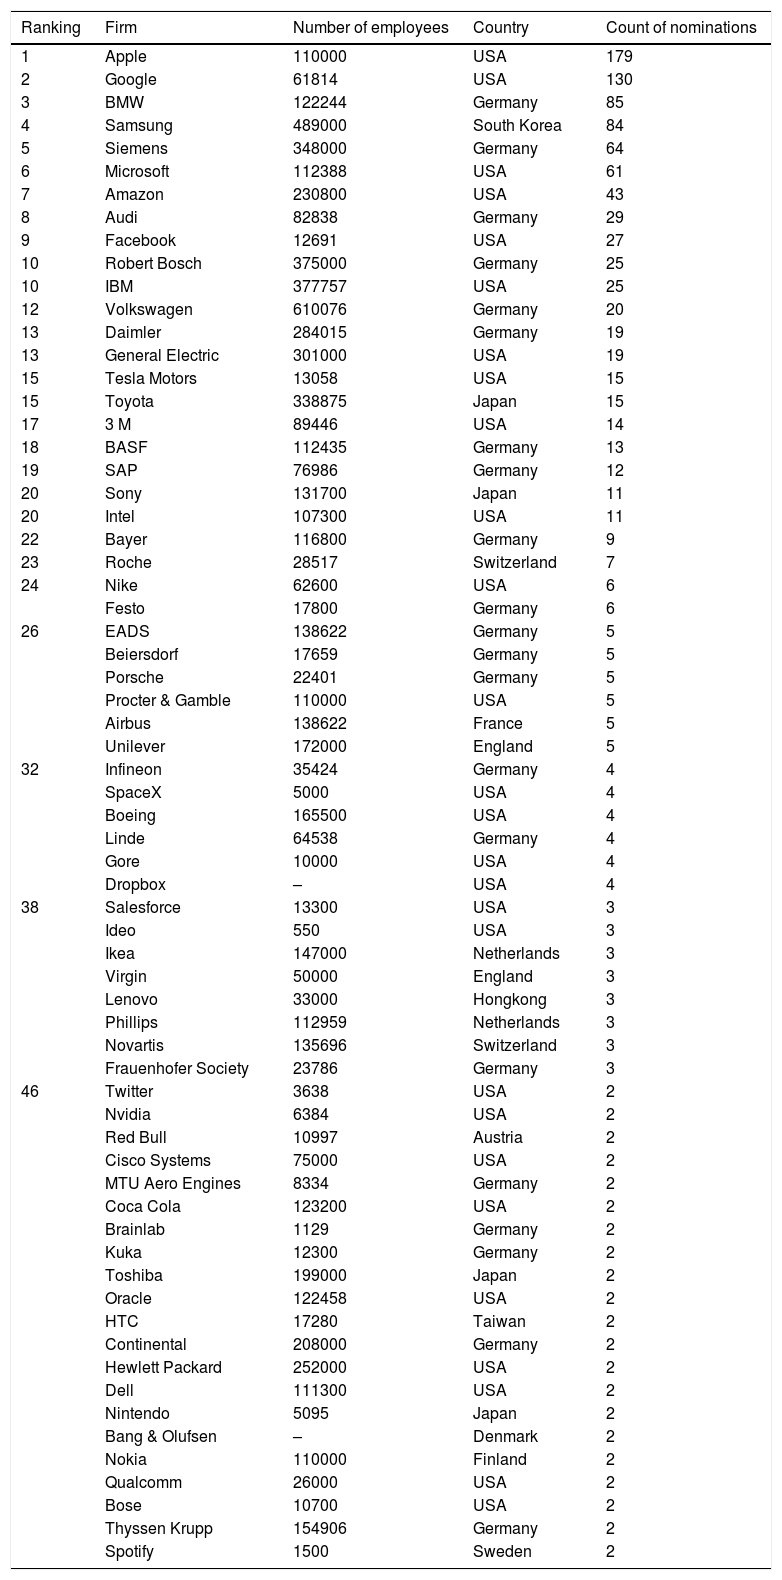
We finally deleted those firms that occurred once, leading to a list that covered 90.56 percent of all mentioned firms. Operationally, we ranked the remaining firms based on the frequency of their nominations by the consumers (see Table 1). The company that was recalled by most consumers is ranked number 1; the firm that was least nominated by the sample is ranked last. For firms in which the frequency of nominations is identical, the equivalent position in the ranking is provided. Furthermore, the subsequent ranking positions remain empty if two firms share the identical ranking position (cf. Nagel et al., 2014).
Firm nominations.
| Ranking | Firm | Number of employees | Country | Count of nominations |
|---|---|---|---|---|
| 1 | Apple | 110000 | USA | 179 |
| 2 | 61814 | USA | 130 | |
| 3 | BMW | 122244 | Germany | 85 |
| 4 | Samsung | 489000 | South Korea | 84 |
| 5 | Siemens | 348000 | Germany | 64 |
| 6 | Microsoft | 112388 | USA | 61 |
| 7 | Amazon | 230800 | USA | 43 |
| 8 | Audi | 82838 | Germany | 29 |
| 9 | 12691 | USA | 27 | |
| 10 | Robert Bosch | 375000 | Germany | 25 |
| 10 | IBM | 377757 | USA | 25 |
| 12 | Volkswagen | 610076 | Germany | 20 |
| 13 | Daimler | 284015 | Germany | 19 |
| 13 | General Electric | 301000 | USA | 19 |
| 15 | Tesla Motors | 13058 | USA | 15 |
| 15 | Toyota | 338875 | Japan | 15 |
| 17 | 3 M | 89446 | USA | 14 |
| 18 | BASF | 112435 | Germany | 13 |
| 19 | SAP | 76986 | Germany | 12 |
| 20 | Sony | 131700 | Japan | 11 |
| 20 | Intel | 107300 | USA | 11 |
| 22 | Bayer | 116800 | Germany | 9 |
| 23 | Roche | 28517 | Switzerland | 7 |
| 24 | Nike | 62600 | USA | 6 |
| Festo | 17800 | Germany | 6 | |
| 26 | EADS | 138622 | Germany | 5 |
| Beiersdorf | 17659 | Germany | 5 | |
| Porsche | 22401 | Germany | 5 | |
| Procter & Gamble | 110000 | USA | 5 | |
| Airbus | 138622 | France | 5 | |
| Unilever | 172000 | England | 5 | |
| 32 | Infineon | 35424 | Germany | 4 |
| SpaceX | 5000 | USA | 4 | |
| Boeing | 165500 | USA | 4 | |
| Linde | 64538 | Germany | 4 | |
| Gore | 10000 | USA | 4 | |
| Dropbox | – | USA | 4 | |
| 38 | Salesforce | 13300 | USA | 3 |
| Ideo | 550 | USA | 3 | |
| Ikea | 147000 | Netherlands | 3 | |
| Virgin | 50000 | England | 3 | |
| Lenovo | 33000 | Hongkong | 3 | |
| Phillips | 112959 | Netherlands | 3 | |
| Novartis | 135696 | Switzerland | 3 | |
| Frauenhofer Society | 23786 | Germany | 3 | |
| 46 | 3638 | USA | 2 | |
| Nvidia | 6384 | USA | 2 | |
| Red Bull | 10997 | Austria | 2 | |
| Cisco Systems | 75000 | USA | 2 | |
| MTU Aero Engines | 8334 | Germany | 2 | |
| Coca Cola | 123200 | USA | 2 | |
| Brainlab | 1129 | Germany | 2 | |
| Kuka | 12300 | Germany | 2 | |
| Toshiba | 199000 | Japan | 2 | |
| Oracle | 122458 | USA | 2 | |
| HTC | 17280 | Taiwan | 2 | |
| Continental | 208000 | Germany | 2 | |
| Hewlett Packard | 252000 | USA | 2 | |
| Dell | 111300 | USA | 2 | |
| Nintendo | 5095 | Japan | 2 | |
| Bang & Olufsen | – | Denmark | 2 | |
| Nokia | 110000 | Finland | 2 | |
| Qualcomm | 26000 | USA | 2 | |
| Bose | 10700 | USA | 2 | |
| Thyssen Krupp | 154906 | Germany | 2 | |
| Spotify | 1500 | Sweden | 2 |
Notes: Firm nominations by the consumers. Number of employees are from 2015.
Inventive performance (citation intensity): Citation intensity is a relative measure for the overall quality of the patent portfolio and serves as a measure of inventive performance (Hagedoorn & Cloodt, 2003). Inventive performance represents the output of the R&D process; it is regarded as a measure of the value of a firm's science and technology (Hand & Lev, 2003). To calculate the citation intensity, we divide the citation stock by the patent stock. The patent stock is based on patent counts, measuring the absolute number of patent applications filed by a firm, representing a proxy for new technologies (Acs & Audretsch, 1989; Hagedoorn & Cloodt, 2003). The stock variables aggregate the patent counts; here, it is calculated as in Sandner and Block (2011) with a 15% depreciation rate. Likewise, the citation stock is based on patent citations to incorporate a quality factor in the analysis. This paper uses forward citations, basically citations from successive future patents, which are regarded to be a better value indicator than backward citation (Lanjouw & Schankermann, 2004). Likewise, we apply citations that have been obtained at least five years after its release (Bloom & Van Reenen, 2002). The citation stock is calculated as in Hall et al. (2005).
Technological performance (patent stock/R&D stock): Hagedoorn and Cloodt (2003) find that technological performance is defined by the relation of R&D input and R&D output as measured by patents. We calculate this ratio using the firms patent stock divided by the R&D stock.
Marketing intensity: Advertising can help to shape strategic positions of firms to differentiate themselves from competitors (Fombrun & Shanley, 1990; Rumelt, 1987). Because advertising is usually used to influence the public's attention, we employ marketing intensity using the average selling, general and administrative expense for 2012 to explain short-term influences of marketing activities. Furthermore, these expenses are divided by the corresponding revenue (Krishnan, Tadepalli, & Park, 2009). It is used by a variety of studies as a valid measure to operationalize marketing investments (Krishnan et al., 2009; Lin, Lee, & Hung, 2006). Both information can be taken right from income statements. Exemplarily, such information is also available from Google Finance or other open access financial providers (e.g. Google Finance – Daimler AG Income Statement). The ratio is calculated as follows:
R&D stock: R&D inputs are usually applied as an indicator for the efforts a firm undertakes to generate innovative output (Hagedoorn & Cloodt, 2003). However, R&D spending is also associated with the innovative competence, because it is a part of broader routines a firm follows to be innovative (Hagedoorn & Cloodt, 2003). Successful R&D input in previous years results in the increasing commitment of the allocation of future R&D resources (Hagedoorn & Cloodt, 2003). To measure the amount of R&D, we use the declining-balance formula as in Hall (2007a); Sandner and Block (2011), with a stock variable. The variable is log transformed. The variable, is calculated as follows with a usual 15 per cent depreciation rate for comparison to earlier work:

Revenue: Larger firms tend to receive much public attention (Fombrun & Shanley, 1990), and reputation is positively related to a firm's size (Hutton, Goodman, Alexander, & Genest, 2001). The availability of more information biases the judgment of individuals, which, in turn, affects the familiarity of these organizations (Tversky & Kahneman, 1974). Consequently, we use annual revenue to explain size effects. The variable is log transformed.
Demographics: We also obtained supplemental information concerning the individual background of the participants. Thereafter, we received the age, the gender, the level of education, the time of work experience and the type of industry the experience was obtained in.
Control variablesType of industry: The importance of patents and R&D varies across industries, particularly high technology industries facing decisive allocations of resources to innovative efforts (Neelankavil & Alaganar, 2003). We apply the standard industrial classification (SIC) system to incorporate the effects of these differences. More specifically, we use the 2 digit major group code for further differentiation.
Country: Because consumers were able to freely recall firms, different origins were noted. As for the type of industry, a country variable explains the influence of country variations (Hall, 2007b; Sandner & Block, 2011).
Patent dummy: If it was not possible to collect patent data for firms, we employ a patent dummy to explain these influences (Suits, 1957).
R&D dummy: Similarly, when firms do not disclose available information on their R&D spending, we employ a dummy variable to account for this (Suits, 1957).
EstimationIn this study, we employ a Poisson regression to research the influence of intangible assets on the reputation for technological innovation. We do so because the dependent variable of this study, the ranking for the reputation for technological innovation conducted in 2013 has count data of the most innovative firms for the dependent variable (Fahrmeir, Kneib, & Lang, 2009). Similarly, all our consumer variables are obtained in 2013. In contrast, the independent variables are bound to time lags. The reasoning originates from the fact that it takes several years until ideas emerge into technology and finally patents. Therefore, studies usually employ time lags, e.g. Nooteboom, Van Haverbeke, Duysters, Gilsing, and Van den Oord (2007) find that a 5 year time frame to measure technological impact (for patents) is appropriate. We extend this time frame and employ a maximum time lag of 7 years until 4 years (2006–2009) prior to the dependent variable in 2013.
ResultsDescriptive statisticsFor our study, we were able to gather information from 231 consumers, each noting five firms to be among the most innovative firms in their perception. This procedure resulted in 1155 nominations for our ranking (cf. Nagel et al., 2014). From these initial company names, 1046 were determined to be mentioned at least twice. The top five nominations are Apple (17.11%), Google, Inc. (12.43%), BMW AG (8.12%), Samsung Corp. (8.03%) and Siemens AG (6.11%). In sum, the previously mentioned firms explain approximately 51.82 percent of all recalled firms. The top fifteen combined explain 80.31 percent of all ranking nominations. Interestingly, our respondents’ nominations are very similar to the annual report “The most innovative companies” from The Boston Consulting Group (Wagner et al., 2014). To provide further information, the complete list is attached in Table 1.
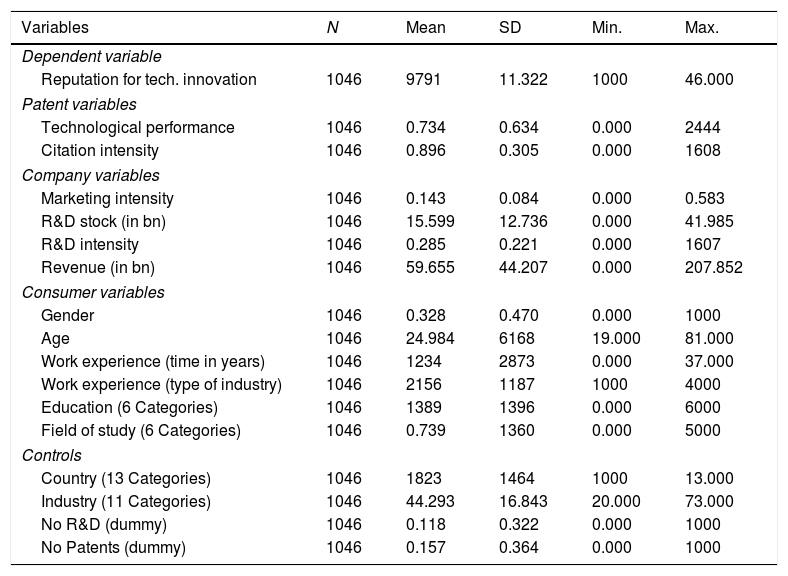
Furthermore, we gathered important information regarding consumers in our sample. The gender ratio in our sample of respondents is split into 67.50 percent male and 32.50 percent female. Furthermore, the age ranges from 19 to 81 years, averaging 24.98 years. Our participants have mean work experience of 1.22 years, with a minimum of none to a maximum of 37 years. Within this time frame, 42.10 percent have had experience in high tech industries, whereas 22.80 percent have experience in low-tech industries. From an education perspective, 44.60 percent of the sample has an educational background with a university entrance qualification. Of the respondents, 31.20 percent completed a bachelor's degree, and 19.50 percent finalized a master's program. During their studies, 68.40 percent focused on “business & economics” and 12.10 percent on engineering related subjects. Table 2 provides information for the variables. The patent data were gathered for the firms mentioned in the ranking. In detail, the largest patent stock originates from Samsung with 47,711.79 patents. The average patent stock size is 12,563.67 with a standard deviation of SD=15,979.52. From the patent citation stock, we can highlight that the highest number of citations again originate from Samsung, which has 10,813.83. On average, the firms in the sample have 14,328.89 patent citations. The citation intensity ratio (citation stock/patent stock) is, on average, 0.896. The highest ratio originates from Cisco Systems with 1.608. The technological performance (patent stock/R&D stock) has a mean of 0.734. Furthermore, company variables show that the firms achieved annual revenues with a mean of 59.65 billion US-dollars. The maximum annual revenue originates from Toyota Motor Corporation, which had approximately 207.85 billion US-dollars. The firms nominated in this study emerge from an international sample. Most perceived innovative companies originate from the USA (54.68%) and from Germany (29.90%). The largest industry type of our study, measured using the SIC classification, resulted in the following split: “Transportation equipment” (22.40%), “Machinery and computer equipment” (26.70%) and “Business Services” (23.80%).
Descriptive statistics.
| Variables | N | Mean | SD | Min. | Max. |
|---|---|---|---|---|---|
| Dependent variable | |||||
| Reputation for tech. innovation | 1046 | 9791 | 11.322 | 1000 | 46.000 |
| Patent variables | |||||
| Technological performance | 1046 | 0.734 | 0.634 | 0.000 | 2444 |
| Citation intensity | 1046 | 0.896 | 0.305 | 0.000 | 1608 |
| Company variables | |||||
| Marketing intensity | 1046 | 0.143 | 0.084 | 0.000 | 0.583 |
| R&D stock (in bn) | 1046 | 15.599 | 12.736 | 0.000 | 41.985 |
| R&D intensity | 1046 | 0.285 | 0.221 | 0.000 | 1607 |
| Revenue (in bn) | 1046 | 59.655 | 44.207 | 0.000 | 207.852 |
| Consumer variables | |||||
| Gender | 1046 | 0.328 | 0.470 | 0.000 | 1000 |
| Age | 1046 | 24.984 | 6168 | 19.000 | 81.000 |
| Work experience (time in years) | 1046 | 1234 | 2873 | 0.000 | 37.000 |
| Work experience (type of industry) | 1046 | 2156 | 1187 | 1000 | 4000 |
| Education (6 Categories) | 1046 | 1389 | 1396 | 0.000 | 6000 |
| Field of study (6 Categories) | 1046 | 0.739 | 1360 | 0.000 | 5000 |
| Controls | |||||
| Country (13 Categories) | 1046 | 1823 | 1464 | 1000 | 13.000 |
| Industry (11 Categories) | 1046 | 44.293 | 16.843 | 20.000 | 73.000 |
| No R&D (dummy) | 1046 | 0.118 | 0.322 | 0.000 | 1000 |
| No Patents (dummy) | 1046 | 0.157 | 0.364 | 0.000 | 1000 |
Notes: SD=standard deviation, 65 firms and 231 consumers; patent and company variables for 2009, consumer variables for 2013, Industry categories are based upon the SIC classification.
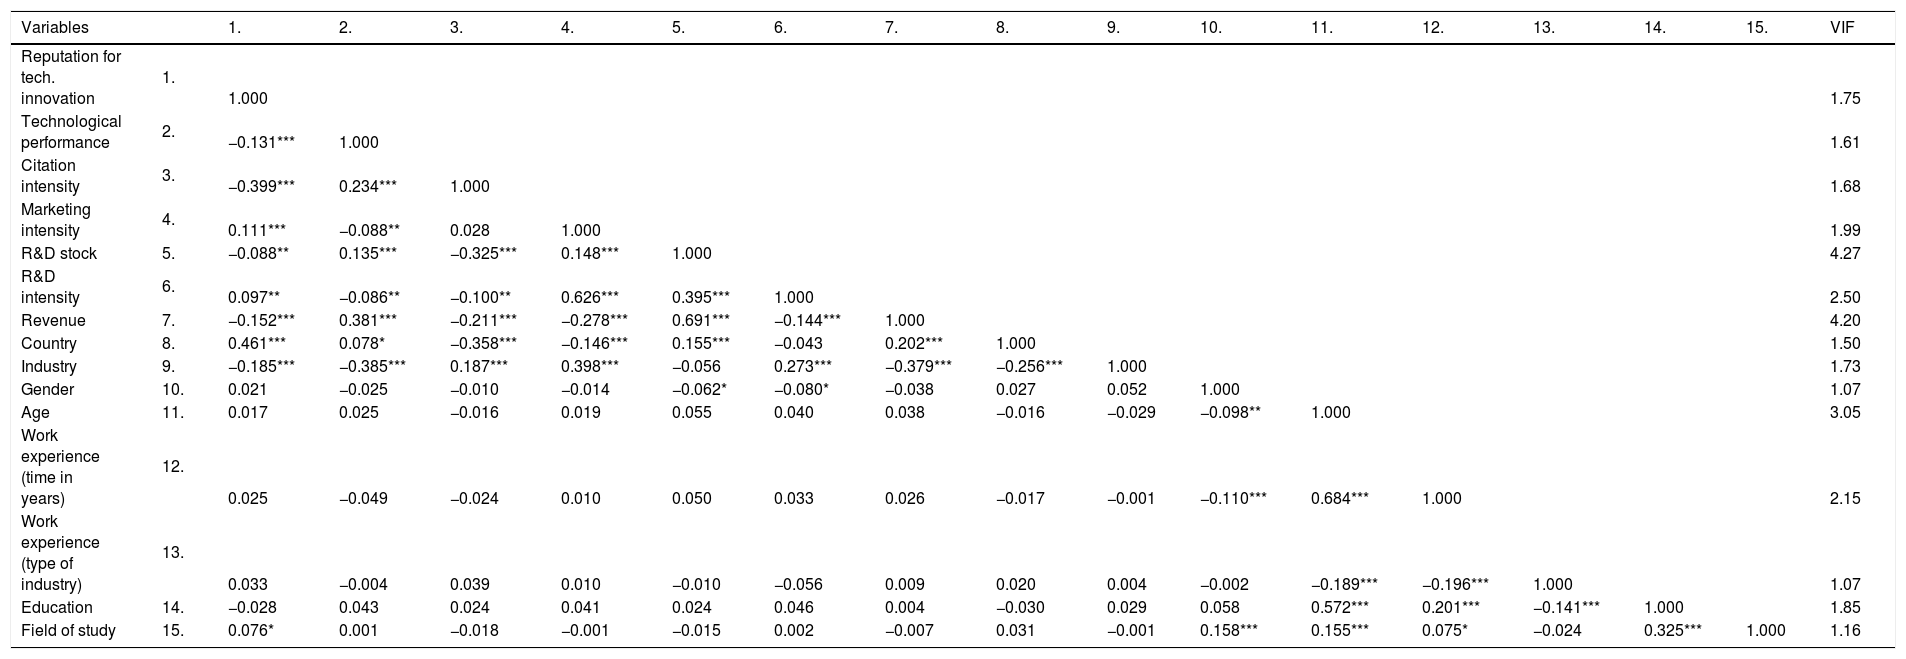
Information on the correlations among this study's variables can be found in Table 3. To additionally check for multicollinearity, the variance inflation factors (VIF) appear to be uncritical as none of the variables has a value above ten (Kennedy, 2003; Neter, Wasserman, & Kutner, 1989). Table 3 indicates that VIF values range from 1.07 to 4.27. We have also calculated an average VIF of 2.10, which indicates no apparent multicollinearity. Because some correlation coefficients are relatively high for R&D stock and revenues, the results should be still interpreted with care.
Correlation matrix.
| Variables | 1. | 2. | 3. | 4. | 5. | 6. | 7. | 8. | 9. | 10. | 11. | 12. | 13. | 14. | 15. | VIF | |
|---|---|---|---|---|---|---|---|---|---|---|---|---|---|---|---|---|---|
| Reputation for tech. innovation | 1. | 1.000 | 1.75 | ||||||||||||||
| Technological performance | 2. | −0.131*** | 1.000 | 1.61 | |||||||||||||
| Citation intensity | 3. | −0.399*** | 0.234*** | 1.000 | 1.68 | ||||||||||||
| Marketing intensity | 4. | 0.111*** | −0.088** | 0.028 | 1.000 | 1.99 | |||||||||||
| R&D stock | 5. | −0.088** | 0.135*** | −0.325*** | 0.148*** | 1.000 | 4.27 | ||||||||||
| R&D intensity | 6. | 0.097** | −0.086** | −0.100** | 0.626*** | 0.395*** | 1.000 | 2.50 | |||||||||
| Revenue | 7. | −0.152*** | 0.381*** | −0.211*** | −0.278*** | 0.691*** | −0.144*** | 1.000 | 4.20 | ||||||||
| Country | 8. | 0.461*** | 0.078* | −0.358*** | −0.146*** | 0.155*** | −0.043 | 0.202*** | 1.000 | 1.50 | |||||||
| Industry | 9. | −0.185*** | −0.385*** | 0.187*** | 0.398*** | −0.056 | 0.273*** | −0.379*** | −0.256*** | 1.000 | 1.73 | ||||||
| Gender | 10. | 0.021 | −0.025 | −0.010 | −0.014 | −0.062* | −0.080* | −0.038 | 0.027 | 0.052 | 1.000 | 1.07 | |||||
| Age | 11. | 0.017 | 0.025 | −0.016 | 0.019 | 0.055 | 0.040 | 0.038 | −0.016 | −0.029 | −0.098** | 1.000 | 3.05 | ||||
| Work experience (time in years) | 12. | 0.025 | −0.049 | −0.024 | 0.010 | 0.050 | 0.033 | 0.026 | −0.017 | −0.001 | −0.110*** | 0.684*** | 1.000 | 2.15 | |||
| Work experience (type of industry) | 13. | 0.033 | −0.004 | 0.039 | 0.010 | −0.010 | −0.056 | 0.009 | 0.020 | 0.004 | −0.002 | −0.189*** | −0.196*** | 1.000 | 1.07 | ||
| Education | 14. | −0.028 | 0.043 | 0.024 | 0.041 | 0.024 | 0.046 | 0.004 | −0.030 | 0.029 | 0.058 | 0.572*** | 0.201*** | −0.141*** | 1.000 | 1.85 | |
| Field of study | 15. | 0.076* | 0.001 | −0.018 | −0.001 | −0.015 | 0.002 | −0.007 | 0.031 | −0.001 | 0.158*** | 0.155*** | 0.075* | −0.024 | 0.325*** | 1.000 | 1.16 |
Notes: N=1046 observations for 65 firms and 231 consumers; patent and company variables for 2009, consumer variables for 2013. Significance levels: *p≤0.05. **p≤0.01. ***p≤0.001.
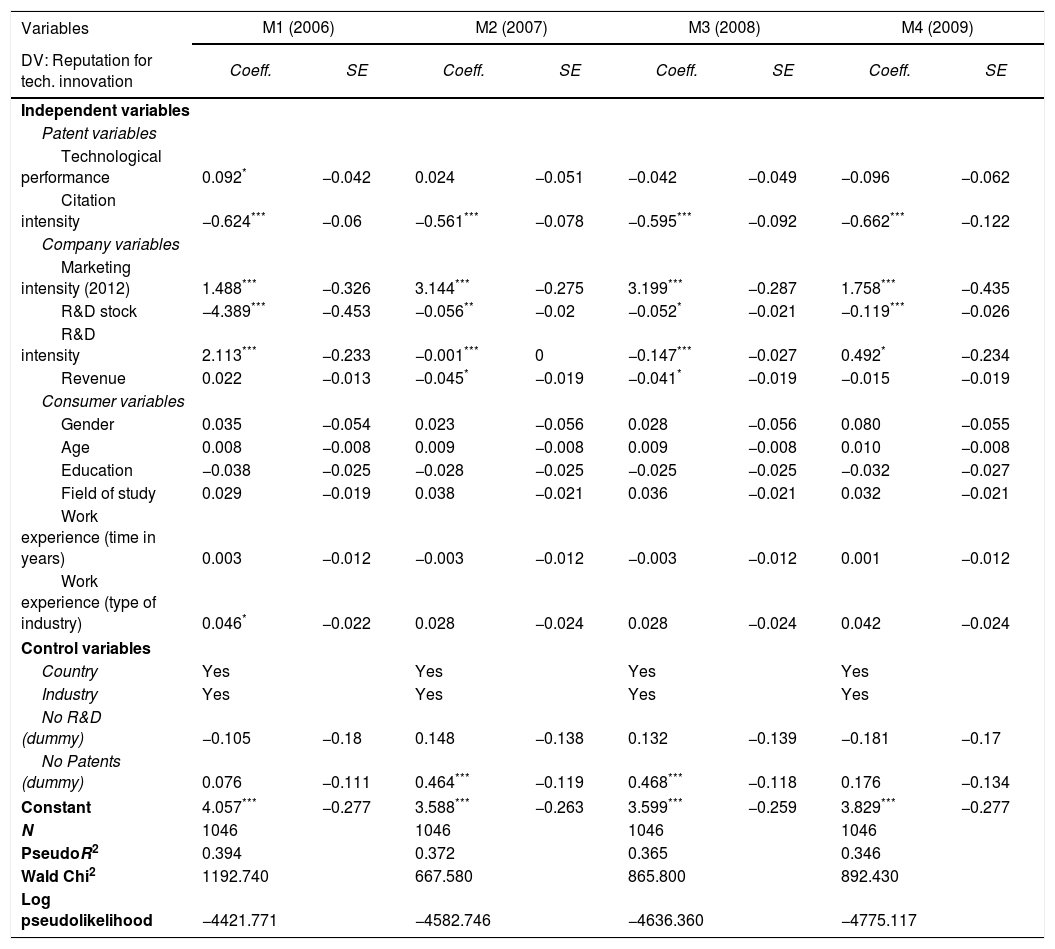
In our regression, we estimate four different models for the different time spans to explain the fact that knowledge needs time to be incorporated in products and services. Therefore, we employ regression models beginning in 2006 (M1) until 2009 (M4). We have clustered our models by the consumer because the consumers named companies, which resulted in the ranking for the dependent variable reputation for technological innovation. With this method, we find robust standard errors. To highlight our results, we start with largest time lag (M1) to the smallest time lag (M4). The complete results can be found in Table 4.
Poisson regression model.
| Variables | M1 (2006) | M2 (2007) | M3 (2008) | M4 (2009) | ||||
|---|---|---|---|---|---|---|---|---|
| DV: Reputation for tech. innovation | Coeff. | SE | Coeff. | SE | Coeff. | SE | Coeff. | SE |
| Independent variables | ||||||||
| Patent variables | ||||||||
| Technological performance | 0.092* | −0.042 | 0.024 | −0.051 | −0.042 | −0.049 | −0.096 | −0.062 |
| Citation intensity | −0.624*** | −0.06 | −0.561*** | −0.078 | −0.595*** | −0.092 | −0.662*** | −0.122 |
| Company variables | ||||||||
| Marketing intensity (2012) | 1.488*** | −0.326 | 3.144*** | −0.275 | 3.199*** | −0.287 | 1.758*** | −0.435 |
| R&D stock | −4.389*** | −0.453 | −0.056** | −0.02 | −0.052* | −0.021 | −0.119*** | −0.026 |
| R&D intensity | 2.113*** | −0.233 | −0.001*** | 0 | −0.147*** | −0.027 | 0.492* | −0.234 |
| Revenue | 0.022 | −0.013 | −0.045* | −0.019 | −0.041* | −0.019 | −0.015 | −0.019 |
| Consumer variables | ||||||||
| Gender | 0.035 | −0.054 | 0.023 | −0.056 | 0.028 | −0.056 | 0.080 | −0.055 |
| Age | 0.008 | −0.008 | 0.009 | −0.008 | 0.009 | −0.008 | 0.010 | −0.008 |
| Education | −0.038 | −0.025 | −0.028 | −0.025 | −0.025 | −0.025 | −0.032 | −0.027 |
| Field of study | 0.029 | −0.019 | 0.038 | −0.021 | 0.036 | −0.021 | 0.032 | −0.021 |
| Work experience (time in years) | 0.003 | −0.012 | −0.003 | −0.012 | −0.003 | −0.012 | 0.001 | −0.012 |
| Work experience (type of industry) | 0.046* | −0.022 | 0.028 | −0.024 | 0.028 | −0.024 | 0.042 | −0.024 |
| Control variables | ||||||||
| Country | Yes | Yes | Yes | Yes | ||||
| Industry | Yes | Yes | Yes | Yes | ||||
| No R&D (dummy) | −0.105 | −0.18 | 0.148 | −0.138 | 0.132 | −0.139 | −0.181 | −0.17 |
| No Patents (dummy) | 0.076 | −0.111 | 0.464*** | −0.119 | 0.468*** | −0.118 | 0.176 | −0.134 |
| Constant | 4.057*** | −0.277 | 3.588*** | −0.263 | 3.599*** | −0.259 | 3.829*** | −0.277 |
| N | 1046 | 1046 | 1046 | 1046 | ||||
| PseudoR2 | 0.394 | 0.372 | 0.365 | 0.346 | ||||
| Wald Chi2 | 1192.740 | 667.580 | 865.800 | 892.430 | ||||
| Log pseudolikelihood | −4421.771 | −4582.746 | −4636.360 | −4775.117 | ||||
Notes: Reference group for education: ‘University entrance qualification’. Reference group for field of study: ‘Business & Economics’. Reference group for work experience (type of industry): ‘High-tech’. Reference country: ‘USA’. Reference type of industry: ‘Chemicals and food’. Pseudo R2 generated without clustering.
We find significant support for the influences of technological performance (H1) on reputation for technological innovation in M1. Again, one must bear in mind that negative correlations indicate that higher values are associated with higher ranks. A lower number is actually a better place in the corresponding ranking. In M1, technological performance is positively and significantly related to reputation for technological innovation, (0.092, p<0.05). The other models M2–M4 do not show significant results and are negative. Furthermore, we find significant and negative associations of citation intensity (inventive performance) to reputation for technological innovation in all models M1–M4. In M1, citation intensity is negatively connected to the dependent variable (−0.624, p<0.001). This is similar in the following models, thereby M2 (−0.561, p<0.001), M3 (−0.595, p<0.001) and M4 (−0.662, p<0.001). For the results concerning our third hypothesis, we find that there are positive effects in the relation between marketing intensity and reputation for technological innovation in M1 (1.488, p<0.001), M2 (3.144, p<0.001), M3 (3.199, p<0.01) and finally M4. (1.758, p<0.001).
Again, one must bear in mind that positive correlations indicate that higher values are associated with lower ranks. Further, we find negative and significant effects of revenue (as size effects) in two models M2 (−0.045, p<0.05) and M3 (−0.041, p<0.05). Furthermore, the consumer variables in all regressions models do not play decisive effects on the dependent variable. For the control variables, we find when firms do not disclose available information on their R&D spending or patents, we employed a dummy variable.
DiscussionKnowledge is the main source for innovation and sophisticated technological advancements (Johannessen, Olaisen, Johannessen, & Olsen, 1999). Firms need to be innovative in order be to be differentiated among its competitors and specifically in the context of innovation (Popadiuk & Choo, 2006). In today's economic setting, organizations often tend to introduce their innovations to the market with patents (Hirshleifer et al., 2013), hence they are an important measure for the intellectual creativity and the available knowledge within a firm. Patents are on form of knowledge, specifically codified, of how can organizations convert ideas into products, service or processes. It is the unique combination of resources of firms which decides upon the possible future success of firms. However, how consumers can assess this innovative performance of firms as one of the relevant criteria for knowledge output? Based on our hypothesis we can significantly advance the understanding and importance of knowledge and thus patents in relation to reputation for technological innovation.
Our theoretical predictions suggested that multiple proxies as patent counts, patent citations or R&D (Hagedoorn & Cloodt, 2003) are associated to reputation for technological innovation by making use of the resource-based view and signaling theory/cue utilization theory. Based on the hypothesis we find support for our theoretical predictions. We find significant support that inventive performance as measured by citation intensity is connected to reputation for technological innovation in different time lags. Hypothesis H2 is therefore supported. The higher the citations of patents in relation to the number of patents (citation intensity), usually employed to identify patent quality and value (Hall et al., 2005), the better the reputation for technological innovation. Specifically these citations indicate patents of higher economic and technological achievements (Hall, Jaffe, & Trajtenberg, 2001; Trajtenberg, 1990). These patents are often based on creative ideas which represent new and original sources of knowledge, which are thus important to create relevant and technically innovative solutions for consumers.
Our first hypothesis is positively related to reputation for technological innovation, hence only in one regression model (M1) and with low significance. Hence, we cannot support hypothesis H1, as the parameter signs show that higher technological performance results in a lower ranking position (positive signs indicate that these values are associated with lower ranks). As noted in the theory section, the measurement of technological performance is similar to the concept of “innovative efficiency” by Hirshleifer et al. (2013). Even though both similar concepts measure innovative output, consumers may have still problems in deducing these efforts related to their overall innovative perception of a firm. The information is also publicly available, but as Rindova et al. (2005) still difficult to observe. A firm which is relatively efficient in terms of its ratio (patent stock/R&D stock) may have a considerable patent portfolio with adequate R&D investments. However, it does not significantly relate to a better ranking position. Yet, “better” codified knowledge as measured by citation intensity is positively associated with reputation for technological innovation (H2). This indicates that the higher “quality” of the underlying technology base can be significantly associated to the consumer's perception. The results suggest that firms which can be efficient in its innovation operations may have difficulties in transferring that into a better technological reputation. It may be the case that truly valuable and perceived solutions may rather be achieved by less efficient ratios of patents per dollar of R&D spent in this context. Maybe truly innovative firms are operating less efficient but with a higher qualitative output that finally results in an innovative reputation.
Research on innovative reputation has been mainly focused on product-based evaluation (Henard & Szymanski, 2001; Szymanski et al., 2007). This is slowly shifting toward a needed focus on innovation at the firm level (Stock & Zacharias, 2013). While none of these studies specifically examined the relationship between innovative performance and reputation for technological innovation, prior research found that a reputation for product innovation has positive and direct impacts on the level of excitement toward the products and the general perception of the innovative firm (Henard & Dacin, 2010). Similarly, Stock and Zacharias (2013) found positive results are found in terms of innovativeness on customer loyalty with a meaningfulness dimension. In comparison with our results, a higher inventive performance (H2) yields a better reputation for technological innovation. Interestingly, the authors question the conventional wisdom that an innovative perception is always connected to positive outcomes.
How do consumers evaluate innovative performance? Based on prior studies, a possible explanation is the finding that “resources and products are two sides of the same coin” where it is noted that “most products require the services of several resources and most resources can be used in several products” (p. 171 in Wernerfelt, 1984). In the research gap, we stated that products are consequences of the correct use of intangible assets as patents and R&D to achieve competitive advantage (Barney, 1991). In our study, we requested context specific reputation, firms that are “being known for something” (Lange et al., 2011), specifically known for a reputation for technological innovation. Although we do not have data on product characteristics, we assume that consumers build their perception mainly from signals caused by products/product experience. Interestingly, many firms in our sample originate from “Electronic equipment and components” and “Machinery and computer equipment”. Therefore, products are composed of numerous separately patentable elements (Cohen et al., 2000). Intellectual property in these industries is shaped by a sustainable trend of increased patenting activity, often referred to as a “patent explosion” (Hall, 2004). Because Apple, Inc. was voted as the most innovative firm in our sample, the company's IP strategy was famously announced by its former CEO and founder, Steve Jobs, who explicitly stated “we’re going to patent it all” (e.g. found in Duhigg & Lohr, 2012). The consequence is that innovative products based on creative knowledge new to markets are mostly to be protected by patents (Battisti et al., 2015). The fact that these patented technologies have to be novel in order to get granted by the patent office (USPTO, 2016) logically increases the introduction of “new” technology. As “newness” usually largely shapes consumers perception of innovation (Garcia & Calantone, 2002; Shams et al., 2015; Tomczak et al., 2016), the perception should therefore be positively influenced based on fundamentally new technology. This increases the chance that intangible assets are a good predictor for reputation for technological innovation. Furthermore, the annual report “The most innovative companies” from The Boston Consulting Group (Wagner et al., 2014) also highlights that a key strategy of the firms on the report's comparable list is “to leverage their IP both to exclude rivals and to build markets” (p. 11). That strategy has been found to be recurrently successful for “breakthrough innovators” for several years. Therefore, consumers may automatically ascertain innovative effort, although knowledge assets such as patents, remain “complex and hard to observe” (p. 1045 in Rindova et al., 2005).
Our third hypothesis (H3) suggested that the marketing intensity of firms should be positively associated with reputation for technological innovation. Again, one must bear in mind that positive correlations indicate lower ranks. In our regression models, we find that that there is a significant influence which relates negatively to a position in the ranking. Therefore, we cannot support hypothesis H3. While these results seem to contradict to existing evidence (e.g. Cobb-Walgren et al., 1995), some research exists that compares to our empirical findings. There is evidence that intensified marketing spending may also have negative effects for the firms. Shamsie (2003) found that the salience of information offers benefits for the “dominant firm”, therefore advertising generally supports a firm to pursue their goals. However, the fact that large scale advertising does inform consumers regarding the competing products of industry rivals exists (Shamsie, 2003). Therefore, the greater the amount of advertising is, the greater the potential to reduce reputational asymmetries (Shamsie, 2003). These effects have been found in a variety of studies (Farris & Buzzell, 1979; Lynk, 1981; Sutton, 1991). Furthermore, Wernerfelt (1984) stated that, in high technology industries, technology offers benefits “similar to a high tree in a small forest; because it obtains more sun, it will grow faster and remain taller”. Uncertain markets and incomplete information by the consumer will provide the market leader with more attention because of their innovative reputation. Followers and rivals need to spend millions of dollars to obtain attention in asymmetric informed consumer markets. Reputation grants attention, therefore it is valuable as a competitive advantage that cannot be easily “bought”. In this field, marketing influences, primarily induced by strategic advertisements, may also have negative effects on reputation. According financial investments should be spent on “true” technology advancements rather than on advertising.
ConclusionRecent and continuous research show that corporate reputation is perhaps the most important intangible asset causing multiple strategic benefits (Hall, 1992; Raithel & Schwaiger, 2014). How a firm's intellectual property is related to a technological reputation has not been studied. Adding to the current stream of research on an innovative reputation (Henard & Dacin, 2010; Stock & Zacharias, 2013), we overcome a methodological gap that existed between consumer studies and innovation research by combining primary as well as secondary data sources (cf. Nagel et al., 2014). We show that the actual innovative performance of firms is significantly associated with reputation for technological innovation. Furthermore, we have evidence that marketing intensity is negatively related to the reputation for technological innovation.
ImplicationsWe find higher levels of an important indicator to influence the reputation for technological innovation: inventive performance. Consumers likely value the costly and uncertain R&D efforts undertaken by companies and remember those firms that constantly provide innovation (Henard & Dacin, 2010). The results represent essential strategic information for both innovation and marketing functions. Practitioners have a high awareness of a sophisticated reputation as many managers and executives understand its use in the long term strategic positioning of the firm. Hall (1993) discovered that chief executive officer's classify reputation as the most relevant intangible resource. Unfortunately, reputation is very difficult to achieve and thus relatively easy to demolish. Warren Buffet, CEO of Berkshire Hathaway Inc., famously said, “It takes twenty years to build a reputation and five minutes to ruin it” (p. 111 in Lowenstein, 2013). The strong association of truly qualitative innovation with the corresponding technological reputation has been found. Innovation functions are required to deliver constant novel solutions to its customers, but this also brings enormous benefits in strategic positioning as its constituents can perceive it accordingly. R&D projects that foster new approaches and technological initiatives, likely sometimes aiming on risky breakthrough solutions, may be required in order to achieve a gains in technological reputation. Of course, those disruptions come with uncertainties for the innovator (Rindova & Petkova, 2007). Incremental changes to product offerings may not be that useful in the context of technological reputation, rather indicating to concentrate the investments and efforts on fewer and potentially cutting edge developments. Building competencies and capabilities to succeed in such new technological environments need to be planned and executed thoroughly (Leten, Belderbos, & Looy, 2016).
With marketing intensity negatively relating to the reputation for technological innovation, we note that these investments have be evaluated critically. In our case, simply spending more relatively is certainly not sufficient for defending a strategic competitive position (Basdeo et al., 2006; Shamsie, 2003) as consumer value truly innovative products and services. Delivering what the customers perceive as innovative is certainly a further aspect of how marketing functions need to evaluate their efforts. This may also incorporate specific content cues and signals to highlight technical novelties that have been developed. We can also behold that the interplay of marketing and innovation functions is very relevant. With the results of this study we find that specifically technical and non-technical efforts by firms need to be strategically aligned in order to achieve a maximum of return. This is particularly the case regarding obtaining the desired effects to support and achieve a competitive advantage via a sophisticated technological reputation.
Generally, the incorporation of intangible resources as patents and its citations in reputation research is a necessary step forward to get a better understanding of how the topics are connected and linked. This may open a new perspective in reputation research, especially in technology-related settings. R&D and patents are aspects that are usually nested in the resource-based view (Barney, 1991; Hall, 1992, 1993). Yet, as we noted in the hypothesis section, signaling theory and cue utilization theory are used to explain how firms shape their image across consumers (Rao et al., 1999; Spence, 1973). In particular, an approach to coherently explain the effects for competitive advantage, research on the reputation for technological innovation may need to base its evaluations not on one or the other theory, but on the alignment of these theories (cf. Nagel et al., 2014). This may further advance our contemporary understanding of the reputation for technological innovation.
LimitationsThese empirical findings have limitations. First, large datasets such as the one we used from EPO's PATSTAT encounter inconsistencies. Because the patent data are not originally cleaned, we cannot ultimately assure the correct assignment of patents to the corresponding firms after checking the data manually. We assume that the remaining effects are negligible. Although patents are a very rich and fruitful data source for research purposes (Hall et al., 2001) being applied in numerous studies (e.g. Harhoff, Scherer, & Vopel, 2003; Serrano, 2010) they also have drawbacks. For example, not all inventions are technically patentable and hence not every invention is actually patented (Archibugi & Planta, 1996). Above, “a few patents are very valuable, and many are worth almost nothing” (p. 6 in Hall et al., 2000). Of course, there are also different types of innovation, ranging from incremental to radical perceptions of those. These different (possibly subjective) innovation classifications and types may also be regarded as influencing factor. Also, marketing intensity may not capture what the marketing messages in advertising were about, hence we relied on a measure that is widely used in scholarly publications to operationalize marketing investments (Krishnan et al., 2009; Lin et al., 2006). Second, it is useful to notice that the survey is based on a relatively educated and young sample. Above, our response rate of less than 10 percent is relatively low (Dillman et al., 2009). A truly random sample, in terms of a general population may be useful for future studies in this context. Yet, the our respondents’ nominations are very similar to the annual report “The most innovative companies” from The Boston Consulting Group asking 1512 senior executives (Presidents, C-Level Executives, Directors) “from wide variety of industries and countries” (p. 23 in Wagner et al., 2014). The firms in our sample and therewith industries/countries also match this criterion. Above, the firms in which the R&D dummy variable and the patent dummy variable were significant show that firms for which we were able to get R&D and patent data differ from firms for which we do not have this information. For example, firms with no patent data do still significantly influence reputation for technological innovation. Previous work was not concerned with such differences in these groups, e.g. studies by Hall and Oriani (2006). A firm for which there is no data on R&D does not mean that they do not spend anything on R&D, they merely do not publicly publish this information due to restricted financial policies. For the firms with no patent data, we assume that highly innovative firms may also choose different paths to innovation (Chandy & Tellis, 1998), hence their effort and may not be measurable with patent data. We assume that the remaining effects are negligible. Further, the variable marketing intensity might measure marketing generically, as some effort of these investments might also be differently attributed to e.g. corporate social responsibility, corporate branding etc. and not purely on “innovation”. For the financial data we relied mostly on Thomson Reuters. To the best of our knowledge, a detailed measure for advertising expenses strictly related to innovation purposes is not listed. We suggest noting these limitations for future studies in this context.
Future researchThis research opens future opportunities in the IP and reputation areas. First, we believe that it would be interesting to investigate how firms perform in similar settings that are regarded as “non-innovative”. The question is whether the harsh evaluation of the respondents is also justified when examining the corresponding patent and financial data. If these firms are “true” innovative entities in reality, their unfortunate pursuit of the use of a favorable reputation is not based on their R&D efforts.
Second, because we found that the reputation for technological innovation is associated with the innovative performance, it would be interesting to examine the technology strategy of these firms. Prior studies found that the acquisition of knowledge can help firms in achieving a better innovative performance (Ahuja & Katila, 2001; Laursen & Salter, 2006). Thus, it would be interesting to research whether firms that buy external patents are also observing positive effects on their reputation for technological innovation. Is it possible to leverage the reputation for technological innovation through the acquisition of patents?
We presented a work in progress version of this paper at the ‘2014 Strategic Management Society Special Conference’ in Sydney (Australia) and at the ‘12th Annual Open and User Innovation Conference’ at Harvard Business School – Harvard University (Cambridge, USA). Elements of this paper have been co developed in an earlier master's thesis by the authors cited in the reference section.