


This essay elaborates on the usefulness of embracing complexity theory, modeling outcomes rather than directionality, and modeling complex rather than simple outcomes in strategic management. Complexity theory includes the tenet that most antecedent conditions are neither sufficient nor necessary for the occurrence of a specific outcome. Identifying a firm by individual antecedents (i.e., non-innovative versus highly innovative, small versus large size in sales or number of employees, or serving local versus international markets) provides shallow information in modeling specific outcomes (e.g., high sales growth or high profitability)—even if directional analyses (e.g., regression analysis, including structural equation modeling) indicates that the independent (main) effects of the individual antecedents relate to outcomes directionally—because firm (case) anomalies almost always occur to main effects. Examples: a number of highly innovative firms have low sales while others have high sales and a number of non-innovative firms have low sales while others have high sales. Breaking-away from the current dominant logic of directionality testing—null hypotheses statistic testing (NHST)—to embrace somewhat precise outcome testing (SPOT) is necessary for extracting highly useful information about the causes of anomalies—associations opposite to expected and “statistically significant” main effects. The study of anomalies extends to identifying the occurrences of four-corner strategy outcomes: firms doing well in favorable circumstances, firms doing badly in favorable circumstances, firms doing well in unfavorable circumstances, and firms doing badly in unfavorable circumstances. Models of four-corner strategy outcomes advances strategic management beyond the current dominant logic of directional modeling of single outcomes.
“An anomaly is a fact that doesn’t fit received wisdom … an anomaly marks an opportunity to learn something very valuable. In science, anomalies are the frontier, where the action is” (Rumelt, 2011, pp. 247–248). Most studies in the behavioral sciences and the sub-disciplines of business/management (e.g., accounting, finance, marketing, organizational behavior, and strategy) ignore anomalies in their testing of directionality of relationships (i.e., increases in X associates with increases in Y). These studies also fail to examine specific outcomes (e.g., firms with top-quintile profitability) and the antecedents to these outcomes—they focus on reporting precision in the directionality of relationships (e.g., p<0.05) rather than constructing algorithms (i.e., screens) that accurately and consistently predict the occurrence of a given outcome.
While several treatises are available that convincingly argue that the thousands of available studies in the leading journals in the behavioral sciences and sub-disciplines of business that construct and test theory based only on directionality (i.e., increases in X associate with increases in Y) represent mounds of rubbish (cf. Armstrong, 2012; Hubbard, 2016; Woodside, 2016, 2017a; Ziliak & McCloskey, 2008), a pervasive shift-away from the use of null hypothesis statistical tests (NHST) to somewhat precise outcome testing (SPOT) has yet to occur. The essay here is to nudge along this shift and to indicate how, why, and when (now) the shift is occurring.
Hubbard (2016) and Ziliak and McCloskey (2008, 2009) describe how bad science is pervasive and dominates several disciplines. “We find the results strange. The part of civilization claiming to set empirical standards for science and policy has decided to use illogical instruments [NHST] and irrelevant empirical standards [p<0.05] for science and policy. In journals such as Nature, Science, The New England Journal of Medicine, The Journal of Clinical Psychiatry, Annals of Internal Medicine, Educational and Psychological Measurement, Epidemiology and Infection, Administrative Science Quarterly, Decision Sciences, and the American Economic Review, size does not matter. Oomph does not matter. Something is wrong” (Ziliak & McCloskey, 2009, p. 2306). The present essay is not to review the literature on how bad science and method—the use of NHST and symmetric testing using regression analysis and structural equation modeling—dominates research relating to innovation and knowledge. Reading Hubbard (2016), Woodside (2016, 2017a, 2017b), and Ziliak and McCloskey (2008) provides sufficient evidence to support this conclusion. The present essay focuses on illustrating how to accomplish the shift away from rubbish to substance in strategy management—away from using NHST to embracing complexity theory and the use of SPOT.
The essay has the following structure. After this introduction, the second section describes core tenets of complexity theory and the need to embrace complexity theory in strategic management research (Misangyi et al., 2016; Woodside, 2014) and all sub-disciplines of research in business. The third section describes theory construction of antecedents to firms’ performance outcomes from case-based complexity (firm screening) versus variable-based linear (directionality) perspectives. The fourth section describes the method of a research study to test and compare the two perspectives. The fifth section presents the empirical findings of the study. The sixth section discusses the findings and limitations of the study. The seventh section concludes with a discussion of generalizing to firms as well as theory, and suggestions for future research.
Core tenets of complexity theoryThe tenets of complexity theory are the foundation of case-based predictive modeling of when configurations of conditions (recipes of ingredients) result in a somewhat specific or exact outcome. Complexity theory is the foundational grounding for case-based modeling and asymmetric testing. While the current dominant logic in research in the behavioral and management sciences attempts to identify the unique contribution and importance of independent variables in influencing the levels of a dependent variable using symmetric tests, case-based models examine how much complex wholes (i.e., algorithms, screens, or causal mechanisms) accurately indicate a given outcome (e.g., top or bottom quintile of a dependent variable). Case-based researchers seek to construct models highly accurate in identifying one directional outcomes. Because case-based modeling rests on the tenets of complexity theory, case-based asymmetric modeling (screens) almost always results in constructing greater numbers of models than variable symmetric modeling (regression analysis).T1 A highly statistically significant symmetric relationship is insufficient usually for accurately indicating a specific outcome consistently (e.g., cases with top quintile scores).
Embracing complexity theory includes the tenet that very high symmetric relationships between two variables are rare in reality and the objective of science should be predicting accurately when (under what conditions) a given outcome will occur and not simply the directionality of a relationship or the relative importance of independent variables in a multiple regression analysis. The first tenet of complexity theory (T1) is a high X score is insufficient for indicating the occurrence of high Y consistently even if the effect size between X and Y is high. Exceptions do occur to T1 when the association between X and Y is extremely high. Table 1 illustrates somewhat the occurrence of such an exception. Reporting a highly symmetric (two-directional) relationship should come with the caveat that a specific outcome relies on a number of usually unstated necessary conditions (e.g., the model findings hold for only the sample in the study) as well as antecedent conditions in the study.
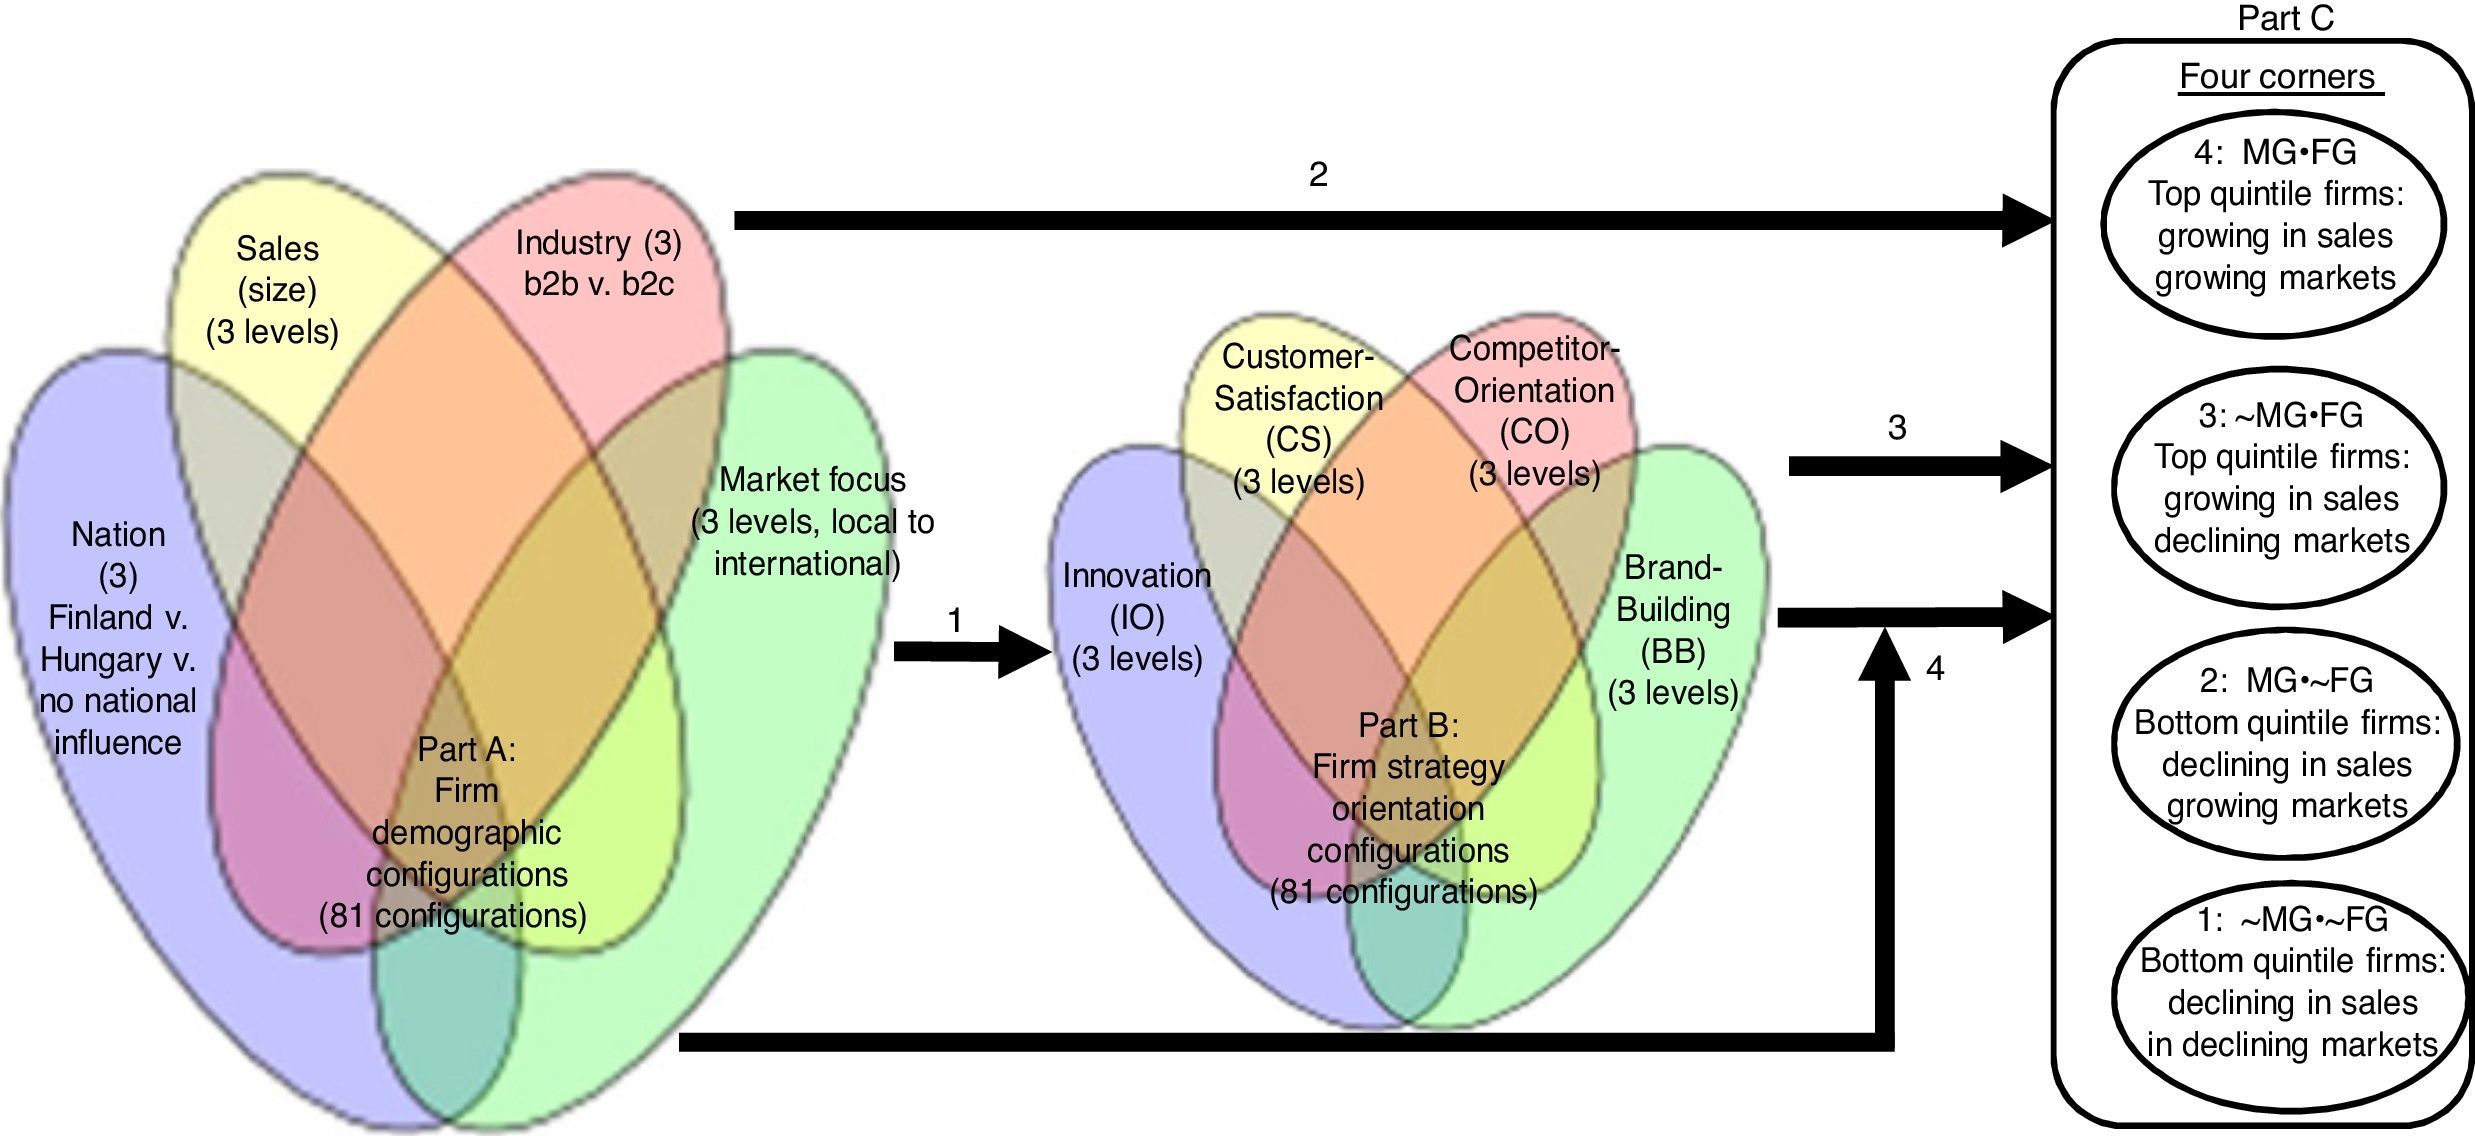
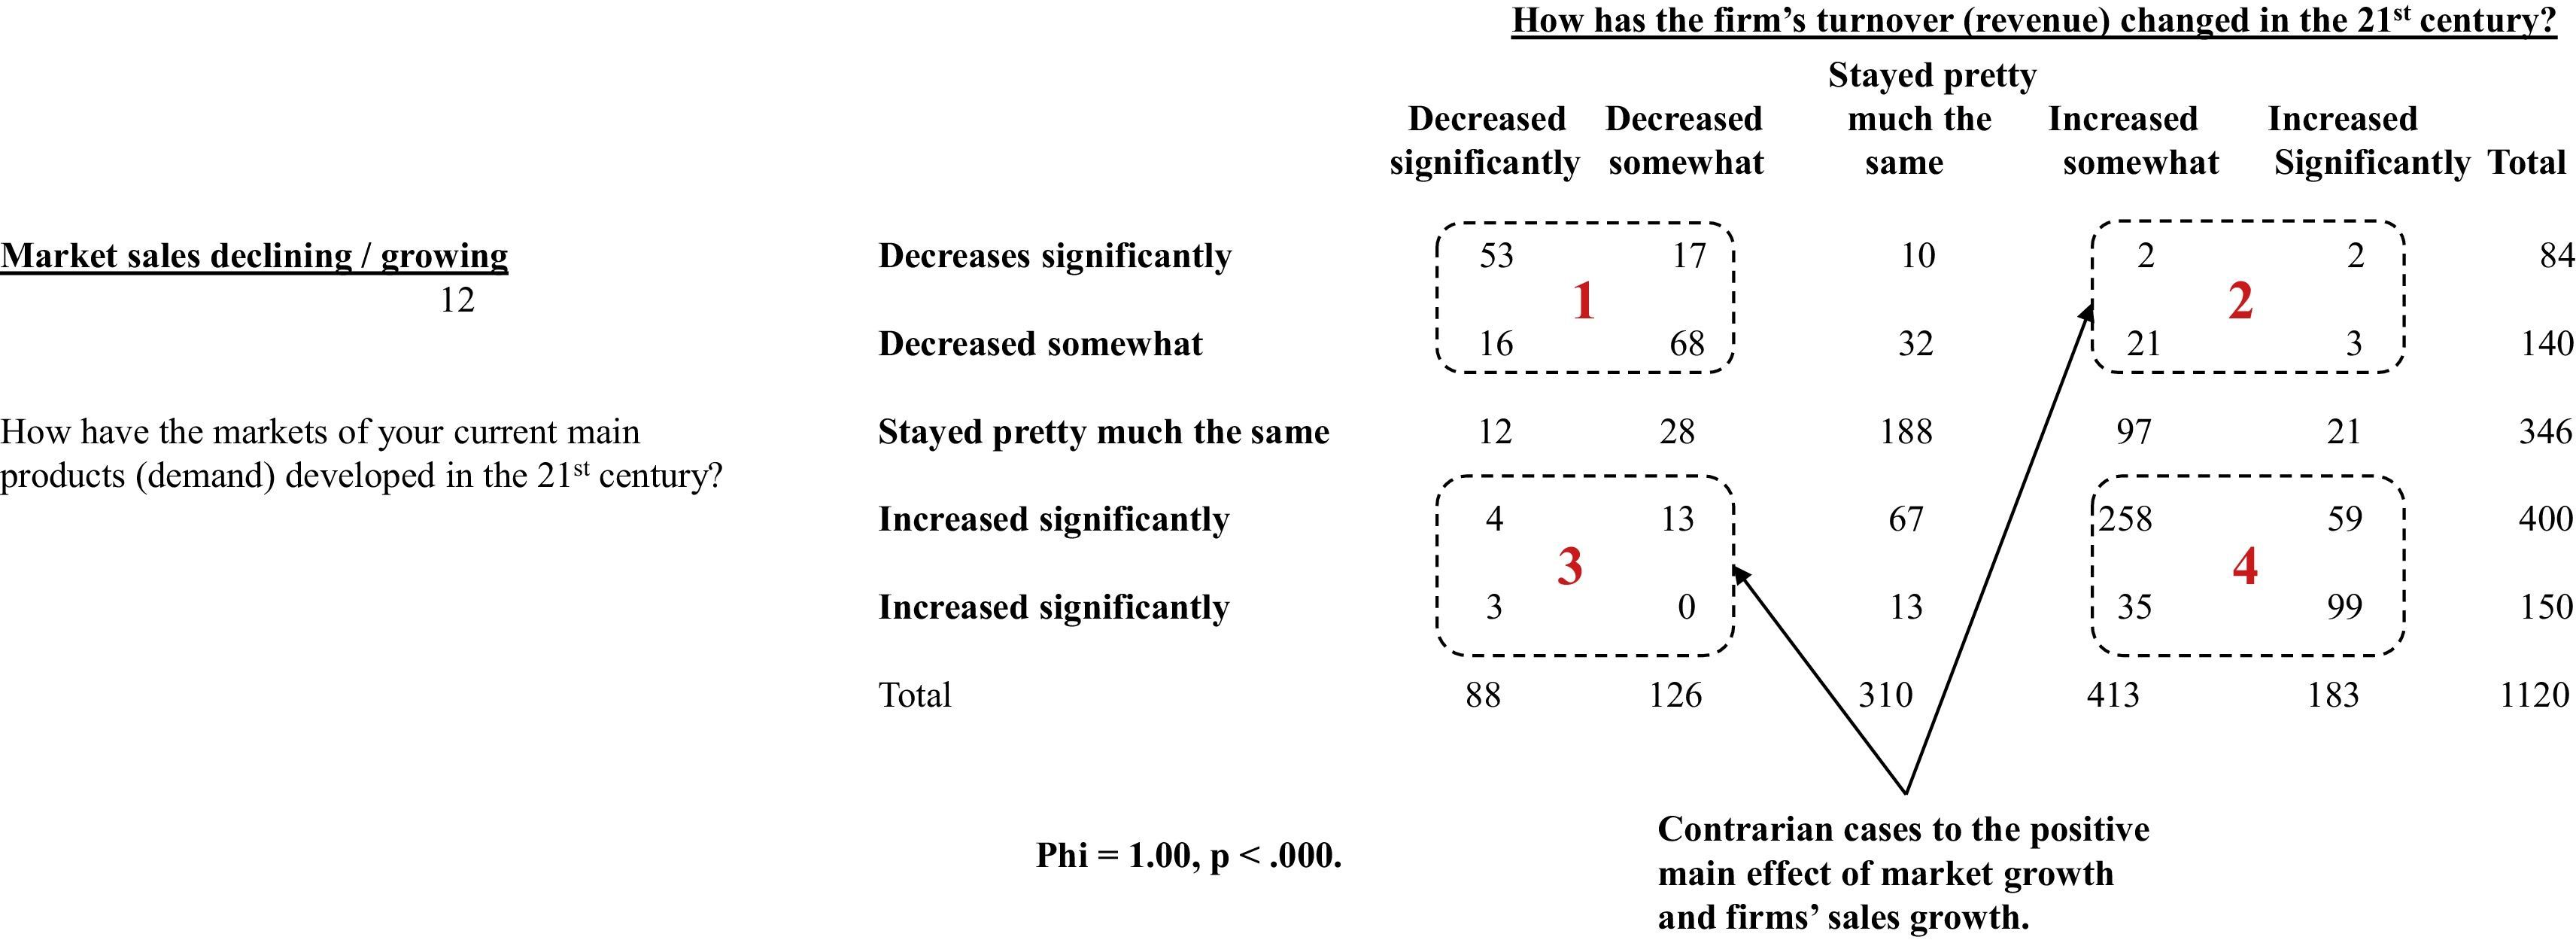
Four-corners view of market growth/decline and firms’ sales growth/decline.

Notes. Using continuous variable data, even though the correlation is 0.687 and the phi=1.00, contrarian cases are identifiable by discretizing the variables using quintiles. Shifting from variable-based symmetric testing to case-asymmetric testing permits focusing on frequencies (how much) rather than probabilities (size-less directionality). Case-based asymmetric theory and analysis permits fine-grained answers to the following questions. What causes firms to have decreases in their sales growth when the market is growing (n=20)? What causes firms to have high sales growth when the market is declining (n=27)? Just reporting a positive directionality for market growth and firm sales growth is shallowing reporting.
Table 1 reports an extremely high symmetric test finding (phi=1.00) of the association between X and Y where X is market sales growth and Y is firm sales growth—during the 21st century. The data in Table 1 includes survey responses from interviews of senior executives in 1120 firms (Nagy et al., 2017). The executives responding to the study selected one of five response levels for each variable. The symmetric test finding is that the observed phi coefficient equals 1.00 (p<0.000). Examining the 5×5 levels distribution of the responses indicates a statistically significant positive relationship. For cases where X is high and very high, 450 cases are high and very high in Y (cells in area 4 in Table 1). For cases where X is low and very low, 154 cases are low and very low in Y (cells in area 1 in Table 1). More than half (188/346) of the cases with the middle value in X have the middle value in Y. Most of cases are on the main diagonal in Table 1: 450+154+188=792 (792/1120=70.7%). The prediction that a very high score in X indicates a high to very high score in Y is somewhat accurate: (35+99)/150=0.893. The odds are nearly 9 to 1 that this prediction is correct. The conclusion is accepted that cases with very high X also have high to very Y for most of the cases. The “simple condition” of very high X indicates high to very high Y four out of every five cases. A simple condition is a statement of a somewhat or very specific amount of one antecedent variable. A simple condition is not a variable but a statement of a somewhat to very specific amount of a variable.
Cases are observable in 24 of 25 cells in Table 1. Cases exhibiting associations contrary to the main effect of a positive symmetric relationship exist in two ways. A total of 28 cases in low-to-very low market sales growth rows have high-to-very high firm sales growth (2.5% of the total sample, area 3 in Table 1). A total of 20 case in high-to-very high market sales growth have low-to-very low firm sales growth (1.8% of the total sample, area 2 in Table 1). Thus, a phi coefficient does not necessary indicate a perfect symmetrical relationship. Modeling anomaly outcomes is possible and useful for advancing theory and deepening explanation of practice. Case-based modelers can/should expect case anomalies. Such case anomalies are identifiable by discretizing continuous variables into quintiles—thus, not just by using 5-level responses to variables as appearing in Table 1. Calibrating values of continuous variables (or variables with a limited number of responses) into membership scores ranging from 0.00 to 1.00 is simply an extreme form of discretizing data. Software programs (e.g., fsQCA.com) are available to provide a smooth-fitting logarithmic calibration scores for continuous data.
Nearly all researchers in the behavioral and management sciences using symmetric tests (e.g., correlations and regression coefficients) stop their analysis after finding statistical significant support of directional relationships and then reporting that the relationship is positive or negative. Given that directionality is always statistically significant if the number of cases is large in a study and that regression models are far less accurate in predicting case outcomes than asymmetric models (Czerlinski, Gigerenzer, & Goldstein, 1999; Gigerenzer & Brighton, 2009), studies reporting only directionality findings and relative sizes of influences of each variable in regression models (i.e., standardized partial regression weights) are shallow reports—even though pervasive and dominant in examining data, these studies are closer to rubbish than substance (cf. Hubbard, 2016; Woodside, 2017; Ziliak & McCloskey, 2008). Such studies fail to provide causal mechanisms that accurately predict the occurrence of a (somewhat) specific outcome—and “the central explanatory task for social scientists is to uncover causal mechanisms” (Little, 1993, p. 185). Rather than testing whether or not a relationship differs from the null hypothesis via symmetric tests of directionality (null hypotheses statistical testing, NHST), substantive research indicates (somewhat) specific outcomes accurately consistently via configurational statements. In the sub-discipline of human relations management, McClelland (1998) provides a useful introduction of accomplishing the shift from NHST to the construction and testing of configuration statements (i.e., somewhat precise outcome testing, SPOT).T2 Constructing complex antecedent conditions is useful for predicting a given outcome accurately.
T2: achieving highly accurate predictions of an outcome condition (e.g., high-to-very high Y) requires the construction of complex antecedent conditions. Complex antecedent conditions constitute screens of two-or-more simple conditions. Based on theoretical conjecture, insight, and knowledge of prior studies, researchers construct screens (i.e., “causal mechanisms,” “algorithms,” and “configurational antecedent conditions” are interchangeable with “screens”) for accuracy in predicting a given outcome. The operational steps in using screens represents “computing with words” (CWW, Zadeh, 1996, 2010). CWW is building screens that identify a few cases for which the “hit rate” of finding specific cases having simple or complex outcome conditions of interest is very high to 100% accurate. In Table 1 the hit rate is 0.893; among cases very high in X (market sales growth), 89.3% are high to very high in firm sales growth. While accuracies are unlikely to reach 100% by any one causal mechanism in a behavioral or management science, researchers using SPOT can achieve accuracies above 0.80–0.95—a consistency index of 0.95 indicates that the cases with high scores in the screen are 19 to 1 in having high scores in the outcome condition.T3 The equifinality tenet—multiple routes occur to a specific outcome.
A complex antecedent condition may sufficient but it is not necessary for the occurrence of a specific outcome. In any given study with a large sample size (e.g., n>100), two-to-five plus screens are necessary to construct to identify a large share of cases having a given outcome. Whether or not the researcher is able to construct any screens that are accurate in indicating a given outcome is the core issue (i.e., is outcome prediction consistency possible)—not the share of coverage achieved by a model. “Coverage” is the number of cases that a model represents. The first objective is to construct highly consistent models. On examining a new pool of relevant cases to find cases having a given performance outcomes if only one model is available, executives would prefer a model having a consistency above 0.90 (9-to-1 odds) with a coverage of 0.02 to another model having a consistency of 0.80 (4-to-1 odds) and a coverage of 0.10. Embracing the equifinality tenet helps the researcher and practitioner achieve the “requisite variety” necessary for deep explanation of the causes of outcomes and for selecting particularly useful options in making decisions. Requisite variety is developing complicated sensing devices to enable identifying complicated sets of outcomes (cf. Weick, 2007). Haberstroh (1965, p. 1176) describes “the law of requisite variety” this way: “If the environment can disturb a system in a wide variety of ways, then effective control requires a regulator that can sense these disturbances and intervene with a commensurately large repertory of responses.”
While researchers relying on symmetric model construction and tests sometimes report a few regression models, they do so frequently to attempt to conclude that the direction (minus or positive) of one independent-dependent variable association does not change in the different models. These researchers fail to recognize that the inclusion of different variables in models frequently do associate with such changes in causal directions—because contrarian cases exist for practically all X and Y relationships.T4 Contrarian cases occur and are identifiable easily by discretizing continuous variables into quintiles, deciles, or by calibrating into scores ranging from 0.00 to 1.00.
Contrarian cases are facts in life. While variable-based modelers may view such cases as unexplainable anomalies (i.e., blips, errors, faults, bugs, outliers), case-based models view them as anomalies needing attention, explanation, and accurate modeling. Accurately explaining and modeling anomalies is another step enabling achieving requisite variety.T5 The screens indicating high Y outcomes include different ingredients from the screens indicating low Y outcomes.
T5 refers to the claim that causal mechanism leading to success differ in ingredients occurring in causal mechanism leading to failure. “Throw a wrench into the works” partly expresses the proposal that researchers need to construct models that predict failure accurately. Thus, two sets of asymmetric models are necessary for useful explanation and accurate prediction of what and how complex antecedent conditions inflect high versus low Y scores. Constructing separate sets of asymmetric models for high and low outcomes of Y is a third set of actions that increases the achievement of requisite variety.
Firms rarely plan on failure or plan on what to do when failure occurs, or plan on how to prevent avoidable failure outcomes, or study the occurrences of their own and other firms’ failures. Research on the study of low Y outcomes and avoiding some specific low Y outcomes (e.g., sales declines, disastrous customer service incidences) comes into view by constructing separate models of low Y outcomes. Weick (2007) and his colleagues (e.g., Vogus, Rothman, Sutcliffe, & Weick, 2014; Weick & Sutcliffe, 2003) describe affective properties and mechanism for creating “highly reliable organizations” focusing on preventing bad outcomes. “High-reliability organizations (HROs) such as aircraft-carrier flight decks (Weick & Roberts, 1993) and nuclear power control rooms (Schulman, 1993) consistently navigate complex, dynamic, and time-pressured conditions in an error-free manner. Research shows highly reliable performance results from mindful organizing—a collective behavioral capability to detect and correct errors and adapt to unexpected events (Weick & Sutcliffe, 2007). The specific behaviors by which members of an organization enact mindful organizing include discussing potential sources of system failure, questioning assumptions and received wisdom about their work, discussing ways to learn from errors and near misses, and drawing upon and deferring to each other's expertise when needed (Weick & Sutcliffe, 2007)” (Vogus et al., 2014). The construction and testing of asymmetric HRO models that are operating in firms awaits the attention of case-base researchers.T6 A simple antecedent condition (X) associates both positively and negatively with an outcome condition (Y); the directionality (±) between X and Y depends on what additional simple conditions occur in given contexts.
The occurrence of cases in 24 of 25 cells in Table 1 illustrates the general findings supporting T6. T6 challenges the pervasive shallow reporting that X generally relates to Y positively or the reporting that the X relates to Y negatively. While shallow in theory, analytics, and reporting of findings, research on bribery, corporate social responsibility, trust, lengths of relationships, innovation, and a host of additional variables attempting to demonstrate one particular directional relationship (±) on sales, profitability, or other dependent variables fill these respective literature streams. T6 redirects attention to asking when and not if. In what configurations (under what conditions) does X relate to Y positively, negatively, and not at all?T7 Tipping points occur in the impact of simple (X) and complex conditions (X•R•T) in their impact on Y.
X (any simple condition) in cases may not relate to Y unless X is very high or very low (e.g., top or bottom quintile among the Xs). Cases with very high (low) X may not affect Y unless these cases also are very high in R and T (additional simple conditions). Thus, a student (say, Harriet) applying to a university with a ranking among the top 10 among global rankings receives (A) admission if she is in the top decile in secondary school (G) grades AND in a nationwide administered general admissions (T) test AND speaks a second (L) language fluently AND exhibits exceptional (P) performance in some personal pursuit AND does not have a (F) felony conviction. Model 1 is the complex configurational statement expressing this computation with words:
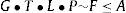
The mid-level dot (“•”) indicates the logical AND operation and the sideways tilde (“∼”) indicates the negation of the condition. Assuming Harriet's percentile ranking indicates her membership scores for the first four simple conditions and she has zero felony convictions, including the marks G=0.98, T=0.91, L=1.00, P=1.00, and zero convictions or ∼F=1.00, then Harriet's composite score equals 0.91 (the lowest membership score among the five simple conditions). This example applies the rule that a student applicant receive admission only if his or her composite score is equal to or above 0.90.
Model 1 is a complex antecedent condition. The operation of model 1 includes the use of Boolean algebra rather than matrix algebra. Thus, case-based modeling includes the use of conjunctive rules rather than compensatory rules. For consistently high accuracy, a complex antecedent condition (X) should indicate high Y outcomes for all cases (or nearly all cases) when X is high. The bottom row in Table 1 illustrates a simple antecedent conditional model for very high X indicating high Y: among the firms operating in very high market growth, 0.893 is the proportion of these cases high or very high in firm sales growth. The 0.893 is not a membership score but does indicate that the odds of high to very high Y scores occur when X (market sales growth) is very high. The following discussion of case-based modeling illustrates the calibration of values for variables into case membership scores.T8 Constructing and testing complex outcomes identifies anomalies and their causal conditions.
Researchers can examine several different outcome indicators of firm performance: sales, earnings per stock share, sales growth, financial leverage, and profitability are examples. Unfortunately, the pervasive and dominant research practice is to examine firm performance outcomes individually. Examining firm performance as configurations of simple conditions is a useful procedure for shifting from shallow to deep understanding, explanation, and accurate prediction of firm outcomes. Adopting this stance guides researchers’ search for anomalies and achievement of the requisite variety necessary for highly effective decision-making. For example, high-low firm sales growth can occur in high-low market demand contexts.
Referring to Table 1, four complex outcomes may be useful to construct and to test the complex antecedent conditions indicating high firm sales growth in markets with increasing sales (area 4 in Table 1); high firm sales growth in declining sales markets (area 3); declining firm sales in growing markets (area 2); and declining firm sales in declining markets (area 1). “A rising tide lifts all boats” might come-to-mind for the high firm sales growth and high market growth complex statement. Several causal mechanism (complex antecedent conditions) are likely to support such a complex outcome. “Successfully swimming upstream” (against the current) applies to cases of firms achieving high firm sales growth in declining sales markets. “Blown opportunity” and “Circumstances beyond our control” reflect complex outcome conditions 2 and 1, respectively.
Case-based versus variable-based theory construction of antecedents explaining firm performance outcomesFig. 1 shows three set of conditions in Parts A, B, and C. Part A is a Venn diagram of four simple to 81 complex conditions for firm demographics. The 81 (i.e., 34) complex conditions include all possible combinations of high, low, and absent levels of the four simple conditions for social demographics. (An example of a complex antecedent condition of firm demographics in a Hungarian firm with large sales revenues in a B-to-B industry serving mainly local Hungarian markets.) The Venn diagram includes an absent condition for each simple demographic antecedent to express the proposition that a given antecedent may be excluded from a complex statement. Exclusion from a statement indicates that the condition is irrelevant to the impact of the complex condition on the outcome. For example, a complex antecedent that is accurate in predicting high (low) scores in an outcome condition might exclude one or two of the four simple conditions.
. Notes. Focus in asymmetric theory construction is on building useful screens that are accurate consistently in identifying precise outcomes. These screens might have a few errors but the odds of correctly identifying case either high or low in the outcome condition should be high (e.g., 7 to 1 or 12 to 1). Most symmetric studies ignore demographic conditions (fail to model their influences) after reporting the distribution of cases for the demographic variables.")
Asymmetric theory focus: What configurations of antecedent conditions indicate high membership scores in the outcome condition? What configurations of antecedent conditions indicate low membership scores in the outcome condition? Which configurations have large coverage? (MG=high market sales growth; FG=high firm sales growth; ∼MG=low market sales growth; ∼FG=low firm sales growth). Notes. Focus in asymmetric theory construction is on building useful screens that are accurate consistently in identifying precise outcomes. These screens might have a few errors but the odds of correctly identifying case either high or low in the outcome condition should be high (e.g., 7 to 1 or 12 to 1). Most symmetric studies ignore demographic conditions (fail to model their influences) after reporting the distribution of cases for the demographic variables.
Arrow 1 in Fig. 1 visually represents the general statement of the study's first proposition. P1: Specific firm demographic configurations indicate different firms’ strategic orientations. Rationale: A firm's executives recognize their firm's orientation recipe by their firm's demographic profile and not just by what the firm seeks to accomplish or accomplishes. A small-sized industrial firm serving local-area customers is less likely to express a brand-building orientation and more likely to express a customer-satisfaction orientation versus firms with alternative demographic profiles. Discussion below describes firms’ strategic orientations.
While performing null hypothesis statistical testing on demographic variables’ influence on strategic orientations is possible using case data, case-based theory construction and testing usually excludes statistical significance NHST testing for several reasons. First, NHST is a shallow form of analysis that does not measure “oomph” (Ziliak & McCloskey, 2012). That is, NHST does not measure how much impact independent variables have on a dependent variable, and testing for directionality only is a trivial exercise (Hubbard, 2016; Woodside, 2017). Second, NHST fails to recognize the relevancy of complexity theory tenets. For example, NHST does not attempt to explain, describe, or predict cases exhibiting associations among variables opposite to the main effects hypotheses. Third, asymmetric case-based model construction and testing advances behavioral theory of the firm as a complex whole in contexts rather than attempting to deconstruct the influence of individual variables absent of context—a focus far more useful for management decision-making as well as for improving explanation of the influences of outcomes. Including Part A conditions in directional studies examining firms’ strategy behaviors and outcomes as integral to model construction appears only rarely in the literature. To be sure, firm demographic data are collected and their frequency distributions appear in early tables of journal articles but then testing is rarely performed on firm demographics in directional tests of firms’ strategies or outcomes. Taking a small step away from presenting simple main effects directional hypotheses, some NHST studies examine one or two demographic variables as “moderators” to the main directional hypotheses.
Part B in Fig. 1 is a second Venn diagram that represents four firm strategic orientations (SOs) and their combinations. SOs represent the broad strategic choices firms make (Gatignon & Xuereb, 1997) and/or unconsciously or consciously decide not to adopt. In simple terms, they describe how firms operate as well as do not operate, essentially classifying firms into categories such as “customer-oriented” or “competitor-oriented” (cf. Cadogan, 2012). The proposal that a firm's SO may include “what orientation is not our focus” and how such negations of SO influence outcomes is a contribution of the present essay. For example, research on the simple condition model testing high versus low competitor-orientation on firm survival and executive decision quality indicates that high competitor-orientation contributes to firm failure and bad decision making. Conversely, high profit-orientation contributes to firm longevity and making good decisions (Armstrong & Collopy, 1996; Armstrong & Green, 2007). The second equation expresses a complex statement of firm orientation:

Eq. (2) states that firms having the complex strategic orientation of being highly innovation oriented AND not brand building AND not competitor-oriented have high performance. Note that customer orientation does not appear in Eq. (2); this absence indicates the whether or not these firms are customer oriented is irrelevant to the model as an antecedent (and/or possibly as an outcome). Relevant research on firm SO supports the SO model represented as Eq. (2) as a popular and effective strategy of industrial firms in Germany (Simon, 1996). The title of Simon's (1996) book hints at the adoption of the complex SO he describes and Eq. (2) captures, Hidden Champions: Lessons from 500 of the World's Best Unknown Companies. The present study includes examining the mode appearing as Eq. (2).
A case-based perspective includes the view that the directionality of any one SO is insufficient for identifying high or low firm performance. The present study examines the proposition that a firm does not have the capabilities or resources to focus on all possible SOs. A firm selects a primary SO explicitly or implicitly. The possibility exists that a firm's explicitly stated SO differs from the firm's implemented SO. Also, the choice to enact a specific SO implies that alternative SOs are valued less or neglected. Thus, few firms, if any, likely report high enactments across several SOs. If any such firms are identified, such a lack of focus is likely to be delusional and indicative of low firm performance.
A firm SO is identifiable as the principal cultural value that a firm expresses and builds strategies to accomplish. The present study focuses on examining the complex antecedent and outcome conditions relevant for configurations of four SOs: innovation orientation (IO), customer-satisfaction orientation (CS), competitor orientation (CO), and brand-building orientation (BB). Fig. 1 expresses the possibility of three levels for each SO: high, low, and absent. Consequently, a total of 81 theoretical configurations are possible ranging from the firm expressing the enactment of none to all SOs as appearing in Eqs. (3) and (4):


While the four SOs do not necessarily include all possible SOs, the present study proposes and tests the expectation that the executives responding to a survey that includes questions on multiple SOs indicate high values on one or two and lower values other SOs. The empirical models represented by Eqs. (3) and (4) do not include any firms with membership scores above 0.50 because the respondents have low scores (0.50 or lower) for at least one SO.
The following descriptions provide a brief introduction to the four SOs. Innovation orientation (IO) refers to some firms’ tendencies to embrace and foster new ideas and experimentation that may result in new offerings or processes (Lumpkin & Dess, 1996). Firm executives may view innovativeness to be necessary so that the firm can fulfill potential customer needs (Li, Zhao, Tan, & Liu, 2008). Customer-satisfaction orientation (CS) (used here interchangeably with “market orientation”) is a firm culture that places top priority on the profitable creation and maintenance of superior customer value and delivering high customer satisfaction consistently; while being somewhat mindful of the interests of other key stakeholders; and second, provides norms for behavior regarding the organizational development of and responsiveness to market information (Deshpandé, Farley, & Webster, 1993; Kohli, Jaworski, & Kumar, 1993; Narver & Slater, 1990).
Competitor orientation (CO) focuses the firm on beating competitors in market share by designing creative advantages for the firm in behaviors related to the marketplace (Buzzell, Gale, & Sultan, 1975; Porter, 1979, 1980). (Buzzell et al. (1975) has had a huge impact in the marketing literature. By July 2017, the article's Google.com/scholar citation count was at 1417.) Historical analysis and findings from experiments supports the conclusion that adopting a competitor orientation leads to bad firm performance (Armstrong & Collopy, 1996; Armstrong & Green, 2007). However, based on the tenets of complexity theory, the general assertion that CO is bad may be too broad. The present study proposes and examines the proposition that firms high in CO may perform well if their high CO includes high IO and some additional complex strategy orientations:

Brand-building orientation (BB) recommends branding as a core competence, aiming to achieve high firm performance by brands by using the brand as a hub around which the organization's processes revolve (Gromark & Melin, 2011; Urde, 1999). Brand building needs to be managed as a process rather than as a project (Gromark & Melin, 2011). Keller (1993) proposes the building and development of strong brands necessitates that the brand receives proper support and that support is sustained in the long run. Brand-oriented firms recognize the brand as the driver of the whole marketing planning process, regarding branding as a strategic rather than a tactical decision (Wong & Merrilees, 2008).
Almost all, possibly all, of the published literature on strategic orientations (SOs) includes examinations of the main (individual) effects only or two-way interactions of SOs on outcomes such as strategy implementation behaviors and firm performance (e.g., Laukkanen, Nagy, Hirvonen, Reijonen, & Pasanen, 2013; Zhou, Yim, & Tse, 2005). For example, Zhou et al. (2005, pp. 45–46) propose and test the following hypotheses using NHST: “H1a: Market orientation has a positive effect on tech-based innovations… H1b: Market orientation has a negative effect on market-based innovations… H2: Technology orientation has a positive effect on tech-based innovations… H3: Entrepreneurial orientation has a positive effect on both tech- and market-based innovations… H4: Organizational learning mediates the relationships between strategic orientations and breakthrough innovations.” Laukkanen et al. (2013, pp. 515–516) propose and test the following and additional hypotheses: “H1. Learning orientation is positively related to brand performance… H2. Learning orientation is positively related to market performance… H3. Entrepreneurial orientation is positively related to brand performance… H4. Entrepreneurial orientation is positively related to market performance… H5. Market orientation is positively related to brand performance… H6. Market orientation is positively related to market performance.” From the perspectives of complexity theory and the reviews of the use of NHST (Hubbard, 2016; Woodside, 2017; Ziliak & McCloskey, 2008), these hypotheses are shallow and supporting such hypotheses provides scant substantive information on how to achieve/avoid specific outcomes. Constructing and empirically testing directional hypotheses is bad science.
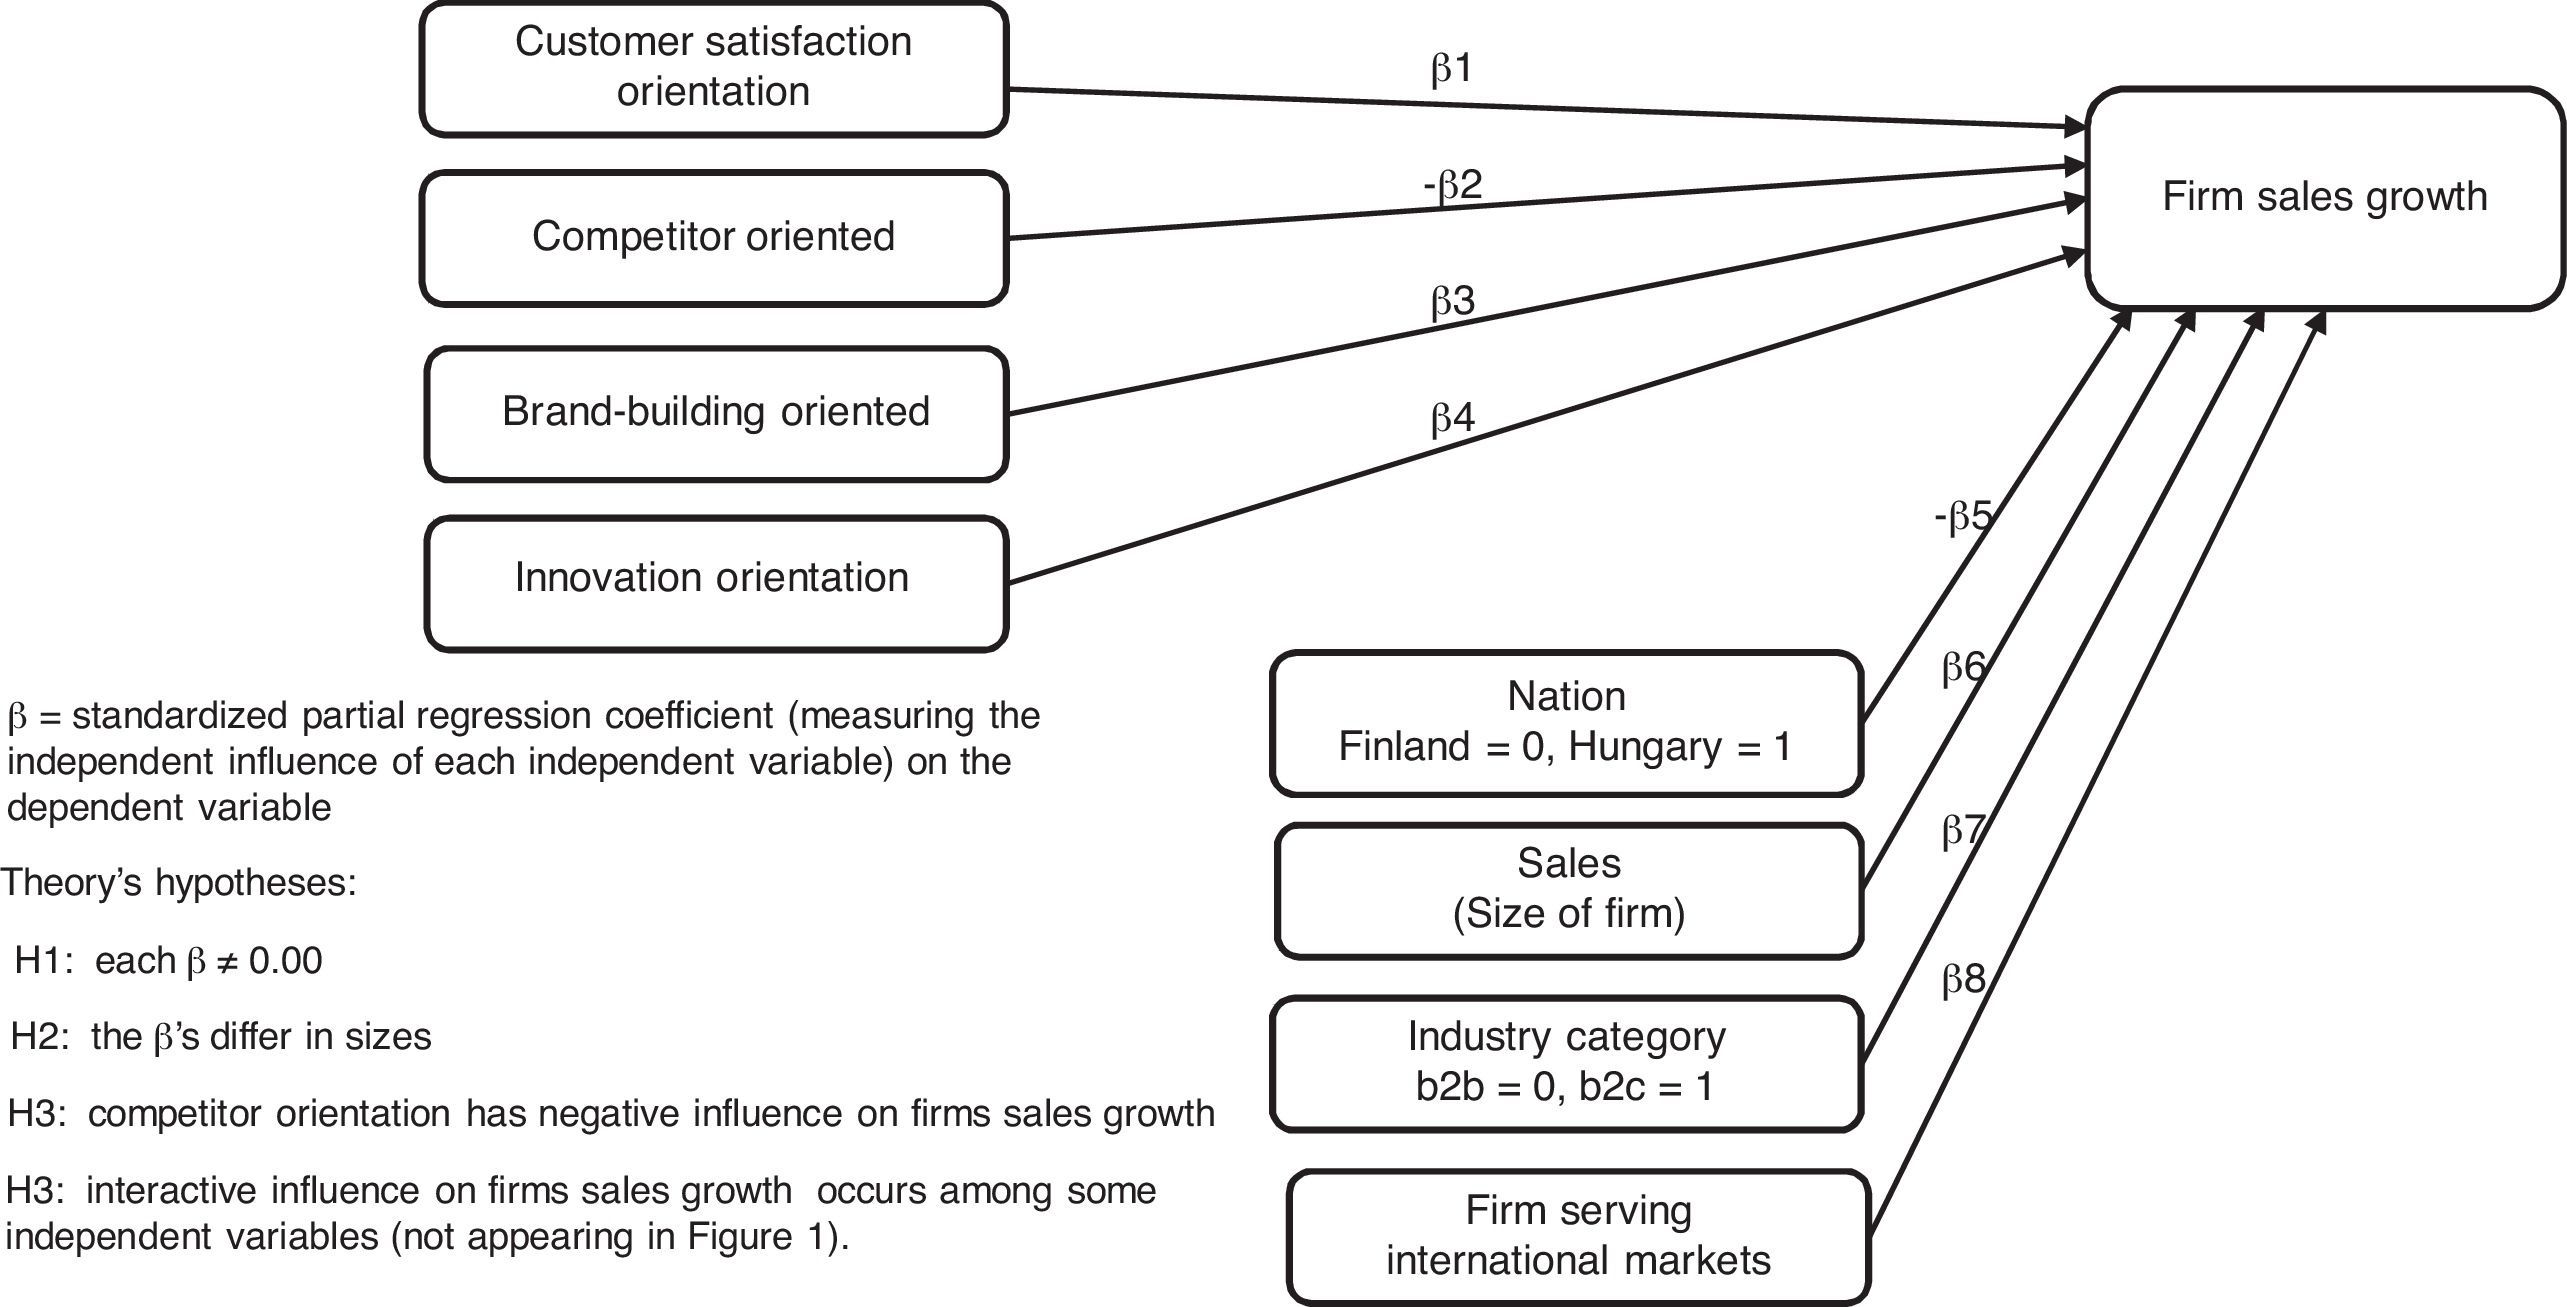
The tenets of complexity theory and the extensive literature on the low worth of performing NHST support the need to construct and test theory of specific outcomes rather than directional relationships. Nevertheless, to provide comparisons, the present study includes a set of directional hypotheses and NHST of these hypotheses. Fig. 2 is a visual representation of eight main effects of the SOs on firms’ sales growth. One alternative to these directional hypotheses is to propose the demographic variables to be moderators of the effects of SOs. The discussion and findings do not include all possibilities of constructing and testing directional relationships.

Symmetric theory focus: What independent variable have directional associations with the dependent variable? What are the relative sizes of the influence of each independent variable on the dependent variable? Does the analyses support hypothesized interaction influences among independent variables on the dependent variable?
Examining Figs. 1 and 2 may prompt the issue of what is missing from both figures. Attributes and configurations of attributes of firms’ implemented strategies do not appear in Figs. 1 and 2. SOs should impact what firms actually do—their implemented strategies (ISs). Possibly configurations of ISs are outcomes of firm's configurations of SOs and their demographic recipes. Implemented strategies have direct impact on firms’ performance. The argument here is that ISs are mediating configurations between SOs impacts on firm performance outcomes. The essay here proposes but does not elaborate on this theory construction. Even though their theory construction and empirical tests are limited to directional relationships and NHST, Zhou et al. (2005) provide a useful advance in describing how SOs affect firms’ “breakthrough technologies” and how such breakthroughs affect firm performance. Even though the correlation between “tech-based innovation” (an implemented strategy variable) and firm performance is only 0.31 in their survey study of executives in firms manufacturing consumer products, Zhou et al. (2005) do not consider the possible finding (really certain to occur) that a number of firms with high tech-based innovations have low performance outcomes. The central point here is that SOs are not measures of activities. Examining activities as well as SOs and firm demographics are necessary for deep explanation of firm performance. This argument identifies a major limitation of model constructions in Figs. 1 and 2.
Fig. 1 displays the four-corner firm performance outcomes: the combinations of high versus low firm performance in expanding versus declining markets. The discussion of the findings in Table 1 supports the construction of four-corner firm performance outcomes. Firms exist that achieve contrarian market sales growth and firm sales growth associations even when the relationship between these two variables indicates a positive association and a large effect size. For deep explanation of the antecedents to firm sales performance, four models are necessary because of the asymmetric nature of causes and the occurrences of contrarian cases. P2: Unique sets of firm demographic configurations indicate each of the four-corner firm performance outcomes.
P3: Unique sets of firm strategic orientation configurations occur for each of the four-corner firm performance outcomes. Rationale: Some SO configurations have negative consequences—they indicate highly negative firm performance outcomes. Firms high only in competitor orientation may have highly negative performance consistently. The statistically significant positive correlations among SOs and firm performance outcomes do not include effect sizes so large as to indicate that contrarian cases to these positive relationships are absent. The occurrences of cases with negative SO and firm performance associations supports the perspective that four-corner asymmetric analysis is necessary for gaining deep understanding of the antecedents of performance outcomes.
P4: Including demographic conditions with SO conditions enhances the accuracy of models of firm performance outcomes. Certain firms having particular demographic profiles are able to enact certain SO configurations effectively while other firms having different demographic profiles are unable to enact these SO configurations effectively. The effectiveness of a specific SO configuration depends on the foundational characteristics of firms. Context matters. Including demographic ingredients in SO recipes enhances understanding of when and how much these recipes work well versus work poorly.
MethodThe data for examining the propositions related to Fig. 1 and the NHST related to Fig. 2 come from surveys of executives of business-to-business and business-to-consumer manufacturing firms in Finland and Hungary. The present study is a re-analysis of the same data used in studies by Laukkanen et al. (2013) and Nagy et al. (2017). Laukkanen et al. (2013) provide a symmetric based theory and NHST analysis of the data. Nagy et al. (2017) provide an asymmetric based theory and SPOT analysis of the data. For the first time the theory construction and data analyses in the present study are present in asymmetric analyses of complex antecedents to the four-corner firm performance outcomes.
Data were used from samples of 820 and 300 SMEs with different industry affiliations located in Finland and Hungary, respectively. The data were collected in late 2009 and early 2010 using a survey sent to the CEOs and managing directors of these firms. Firms operating in different industries offer variation in the rate of change and uncertainty of the firm's competitive environments that would not be available focusing on a single industry. The questionnaire was sent to 9454 Finnish firms, yielding a response rate of 8.6%. A total of 5000 Hungarian SMEs were contacted; the useable response rate was 6.0%. The contact information on Finnish SMEs was obtained from public registers provided by various municipalities, local regional development companies, and the Federation of Finnish Enterprises.
Survey itemsThe survey questions include single items to measure the four firm demographics and the two conditions constituting the four-corner outcomes. Multi-item scales were used to measure each of the SOs. The following discussion describes each of the four scales to measure the four SOs in the present study. All items were measured using a 1–7 “totally disagree” to “totally agree” point scales.
Brand-building orientation. The brand building scale included seven items. “Brand is a valuable asset to us.” “Building a brand is an essential part of business operations.” “Building a brand is integrated in all our marketing.” “Our brand values direct the content and implementation of our marketing communications.” “Building a brand is a focal part of our strategy.” “Long-term brand building is a critical part of our success in the future.” “We are aware of the focal values of our brand.” Cronbach's alpha was 0.971 for the scale constituting these seven items. For the 1120 respondents, the 80th, 50th, and 20th values for this scale were 42, 31, and 20, respectively. These three percentile values were used in calibrating the values into membership scores as described below.
Competitor orientation. A three-item scale was used to measure competitor orientation. “Our company regularly discusses competitors’ strengths and strategies.” “We respond to competitive actions that threaten us.” “Our employees share information within our business concerning competitors’ strategies.” Cronbach's alpha equaled 0.775 for the scale constituting these three items. The 80th, 50th, and 20th values for this scale were 17, 13, and 8, respectively.
Customer satisfaction orientation. A four-item scale was used to measure customer-satisfaction orientation. “We monitor our level of commitment to serving customers’ needs.” “Our strategy for competitive advantage is based on our understanding of customer needs.” “Our business objectives are driven by customer satisfaction.” “Our business strategies are driven by our beliefs about how we can create greater value for customers.” Cronbach's alpha for this scale equaled 0.859. The 80th, 50th, and 20th values for this scale were 26, 22, and 18, respectively.
Innovation orientation. The following four items were used to measure firm innovation orientation. “Our company frequently tries out new ideas.” “Our company seeks out new ways to do things.” “Our company is creative in its methods of operation.” “Our company is often the first to market with new products and services.” Cronbach's alpha for this scale equaled 0.852. The 80th, 50th, and 20th values for this scale were 24, 19, and 14, respectively.
A single item scale was used to measure the firm's sales outcome condition, “How has the firm's turnover changed in the 21st century?” A 1–5 point scale was used containing the following responses, “1=decreased significantly” to “5=increased significantly.” A single item scale was used to measure the firm's market environment, “How have the markets of your current main products (demand) developed in the 21st century?” The same response options were used, “1=decreased significantly” to “5=increased significantly.”
Calibrations. The values for each scale are calibrated to membership scores ranging from 0.00 to 1.00. Thoughtful attention is necessary for calibrating values into membership scores. Most differences in different calibrations of values into scores have small impacts on the final analysis of the impacts of complex antecedent conditions on outcomes—but big differences in calibrations can dramatically reduce or increase in the impact of a simple condition in affecting an outcome condition—an example of this observation appears below.
The software program at fsQCA.com has a subroutine that converts a scale's values into a logarithmic scale whereby the researcher needs to specify three membership scores for the “threshold for full membership” equal to 0.95, the “threshold for maximum ambiguity” equal to 0.50, and the “threshold for full non-membership” equal to 0.05. See Ragin (2008) for full details on calibrating values into membership scores. For multi-item scales, the median is frequently used for 0.50 membership score. The 95th percentile is used frequently for the 0.95 membership score. The 5th percentile is used for the 0.05 membership score. However, for the present study, the 80th, 50th, and 20th percentiles are used for the 0.95, 0.50, and 0.05 membership scores because this scoring procedure provided more useful information relevant to estimating coverages of cases of interest having high scores in complex antecedent conditions using the guidelines recommended by Ragin (2008).
For the markets served single-item measure in the study, respondents selected one of four possible answers. “The market area of the enterprise” is (1) local, (2) regional, (3) national, and (4) international. The distribution of responses included (1) 354, (2) 337, (3) 271, and (4) 127. One possibility for calibrating the responses includes 3.5, 2.5 and 1.5 for the membership scores of 0.95, 0.50 and 0.05, respectively. However, assigning such a calibration places 398 firms above the 3.0 value—the response for serving national markets—an inaccurate view indicating firms serving international markets that is unfounded by the 271 of these firms that responded with a national market area. The calibration scores actually reflect the amount of membership in serving international markets. Respondents answering 3.0 are not serving international markets. Consequently, an alternative calibrating procedure was used that includes 3.5, 3.1, and 2.0 as the scores for 0.95, 0.50 and 0.05 membership scores. The responses indicating serving national markets (value 3.0) become membership scores for serving international markets equal to 0.45. For a dichotomous dummy coded variable such as nation (e.g., Finland=0.00, Hungary=1.00), the membership scores recommend include 0.01 and 0.99, although the dummy codes of 0.00 and 1.00 are perfectly acceptable.
Fuzzy-set membership scores are calculated to equal the lowest membership score of conditions in a complex statement. For example, for a small size (firm_size=0.01), Hungarian firm (Hungarian=0.99), with a membership score for serving international markets (international=0.99), the complex membership score is equal to 0.01. Using the Boolean algebra operation for union, the complex condition is written as “firm_size•Hungarian•international=(0.01•0.99•0.99)=0.01. The value for the complex statement is equal to lowest value for the simple condition in the configuration because this score represents the level of membership that the ingredients have in common. The statement can be rewritten to indicate a high membership score by converting SS into ∼SS and international into ∼international. Consequently, ∼firm_size•Hungarian•international equals (0.99•0.99•0.99)=0.99. High scores on the X-axis for this complex statement indicates small Hungarian firms serving international markets. If a researcher believed such a demographic recipe influenced a complex SO and/or one of the four-corner firm-market performance outcomes, she would compute membership scores for all of the cases (using 1 minus the firm-size calibrated membership scores for the first condition) and create an X–Y plot with the complex antecedent condition scores on the X-axis and complex market-firm performance outcome of interest on the Y-axis. If the researcher is correct, then all cases (firms) with high scores on X should have high scores on Y. If 20 cases having high scores on ∼firm_size•Hungarian•international then all, or nearly all, of them should have high scores on the complex outcome (e.g., say, high firm sales in a declining market).
The calibrations for sales changes in the 21st century for the firm and for its markets included 4.5, 3.0 and 1.5 for the threshold for full membership (0.95), threshold for maximum ambiguity (0.50), and the threshold for full non-membership (0.05).
Consistency and coverage indexesThe “consistency index” measures the levels of accuracy in such asymmetric predictions. The consistency index indicates the accuracy of the simple or complex antecedent condition in predicting high scores in the outcome condition. If 7 of 8 cases having high scores (say, >0.75) in X have high scores in Y, then the consistency index equals 0.875. Perfect accuracy is usually not achieved in case-based models of asymmetric outcomes. To write complex antecedent conditions to achieve perfection is to reduce the coverage in most data sets to one case—thus, the “somewhat” in “somewhat precise outcome testing” (SPOT). Complex antecedent conditions that provide consistency indexes above 0.85 are usually considered useful SPOT screens for correctly identify most cases high in a simple or complex outcome condition.
The “coverage index” measures the number of cases high in the outcome condition for the cases high in X relative to all the cases high in the outcome condition. If 80 cases have scores high in Y and a complex antecedent condition identifies 8 of these 80 cases, then the complex antecedent condition has a coverage equal to 0.10. The fsQCA.com software program reports raw and unique coverage indexes for the findings for each model. The unique coverage refers to only cases that a specific model identifies as high in the outcome (Y). The raw coverage includes the cases the specific model and alternative complex antecedent condition models identify as high in the outcome (Y). Using the XY plot subroutine in the fsQCA.com software reports the consistency and raw coverage indexes.
A useful rule to apply is that an antecedent model is applicable for identifying high Y cases when consistency is above 0.80 even if coverage is very small (e.g., <0.02). An application of achieving requisite variety is to construct a small basket of applicable models with each model having a consistency above 0.80 and a coverage greater than 0.01. In constructing models using the fsQCA.com program, the researcher can specific a “frequency cutoff” and a “consistency cutoff” that models must achieve. The higher the cutoffs the fewer the models constructed via the analyze sub-routine in the fsQCA.com software. Of course, the researcher should construct fuzzy statements of specific models for testing their applicability in identifying high Y outcomes. For example, testing the models appearing as equations 2–4 in this essay is done and reported in the findings section. However, due to the newness in applications of complexity theory and asymmetric case-based modeling in the late teen years of the 21st century, doing both approaches to model construction may be best—especially since the analyze function in the software frequently generates counter-intuitive models. At the this early stage of shifting away from using NHST to using SPOT, testing the general propositions (P1 to P4) by relying on model analyzer generator in software programs in case-based modeling is more beneficial than harmful—but the researcher should separately propose complex antecedent conditional models that should work well as well as models that should work poorly in predicting high Y outcomes.
FindingsThis section first examines the model appearing as Eq. (2). Then, the section presents the findings testing the four propositions. Finally, the symmetric analyses and NHST findings are presented and compared to the case-based asymmetric model findings.
Depending on nation the findings do and do not support IO•∼BB•∼CO≤high firm performanceSO configurational findings for the model appearing as Eq. (2) (firm high innovation orientation AND low brand-building AND low competitor orientation) do not indicate cases consistently with high firm sales performance in growing markets nor with high firm sales performance in declining markets. The model also was not useful in predicting firm declining sales in either market sales conditions. For the model, the consistency index equals 0.81 with the coverage index equal to 0.28 for the corner 4 outcome (high firm sales in high market growth)—this finding is sufficiently promising for additional examination. Consequently, nation was examined as an additional ingredient. Testing for this revision indicates high consistency (0.86) with a raw coverage equal to 0.27 for the model for Finnish firms. The model is not useful for predicting cases in the corner 4 outcomes for Hungary, but the model in Eq. (2) does work after revising it to include nation (Finnish firms):
This “hidden champion” SO that Simon (1996) expounds may be apt more for firms in high-tech nations like Finland, Germany, and Switzerland but less appropriate for firms still recovering from decades operating in “planned economies” (e.g., Hungary, Czech Republic, and Poland). This speculation needs confirmation by additional studies across several eastern and western European nations including Germany, Switzerland, Czech Republic, and Poland.
The findings provide limited support for P1Repeating P1: Specific firm demographic configurations indicate different firm's strategic orientations. P1 receives some, but limited, support. No configuration of the four demographic attributes in Fig. 1 indicate high innovation orientation. High case scores for one configuration of demographic configurations indicate high customer-satisfaction (CS) orientation: small, international, Hungarian B-to-C firms is a model indicating high CS (consistency=0.82, coverage=0.02). High case scores for one demographic configuration indicate high case scores for competitor orientation (CO): large international B-to-C Hungarian firms (consistency=0.81, coverage=0.04). High scores for one demographic configuration indicates high scores for brand-building (BB) orientation: large, international, B-to-C Finnish firms (consistency=0.82, coverage=0.05).
These findings provide limited but insightful information about SOs. Unexpectedly, specific demographic configurations do not indicate high IO. High IO is not restricted to large, internationally-focused, B-to-B firms in a very highly developed economy (Finland). Before examining the findings, the authors believed that this particular configuration would provide a highly accurate model of high IO. While the empirical models testing P1 do provide one (different) model useful for predicting each of the other three SOs, the empirical examination provides an inadequate number of models for achieving substantial coverage of cases (firms) high in these SOs. “Substantial coverage” would, overall, model coverage solutions above 0.20. Future research might contribute to the study of how firm demographic configurations affect firm SOs by increasing the number of demographic attributes from four to eight-to-ten. The present study contributes by being one of the first to address the issue of how firm demographics affect the firm's adoption of SOs.
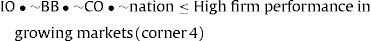
Findings from testing P2: Firm demographic configurations for the four-corner outcomesP2: Unique sets of firm demographic configurations indicate each of the four-corner firm performance outcomes. The findings provide limited support that demographic configurations are useful for indicating two of the four-corner outcomes: corner 4 (increasing firm sales in growing markets) and corner 1 (declining firm sales in declining markets). The details in Table 2 include two models with high consistencies for corner 4 and one model for high consistency for corner 1. The findings include no models with high consistency for corners 3 and 2.
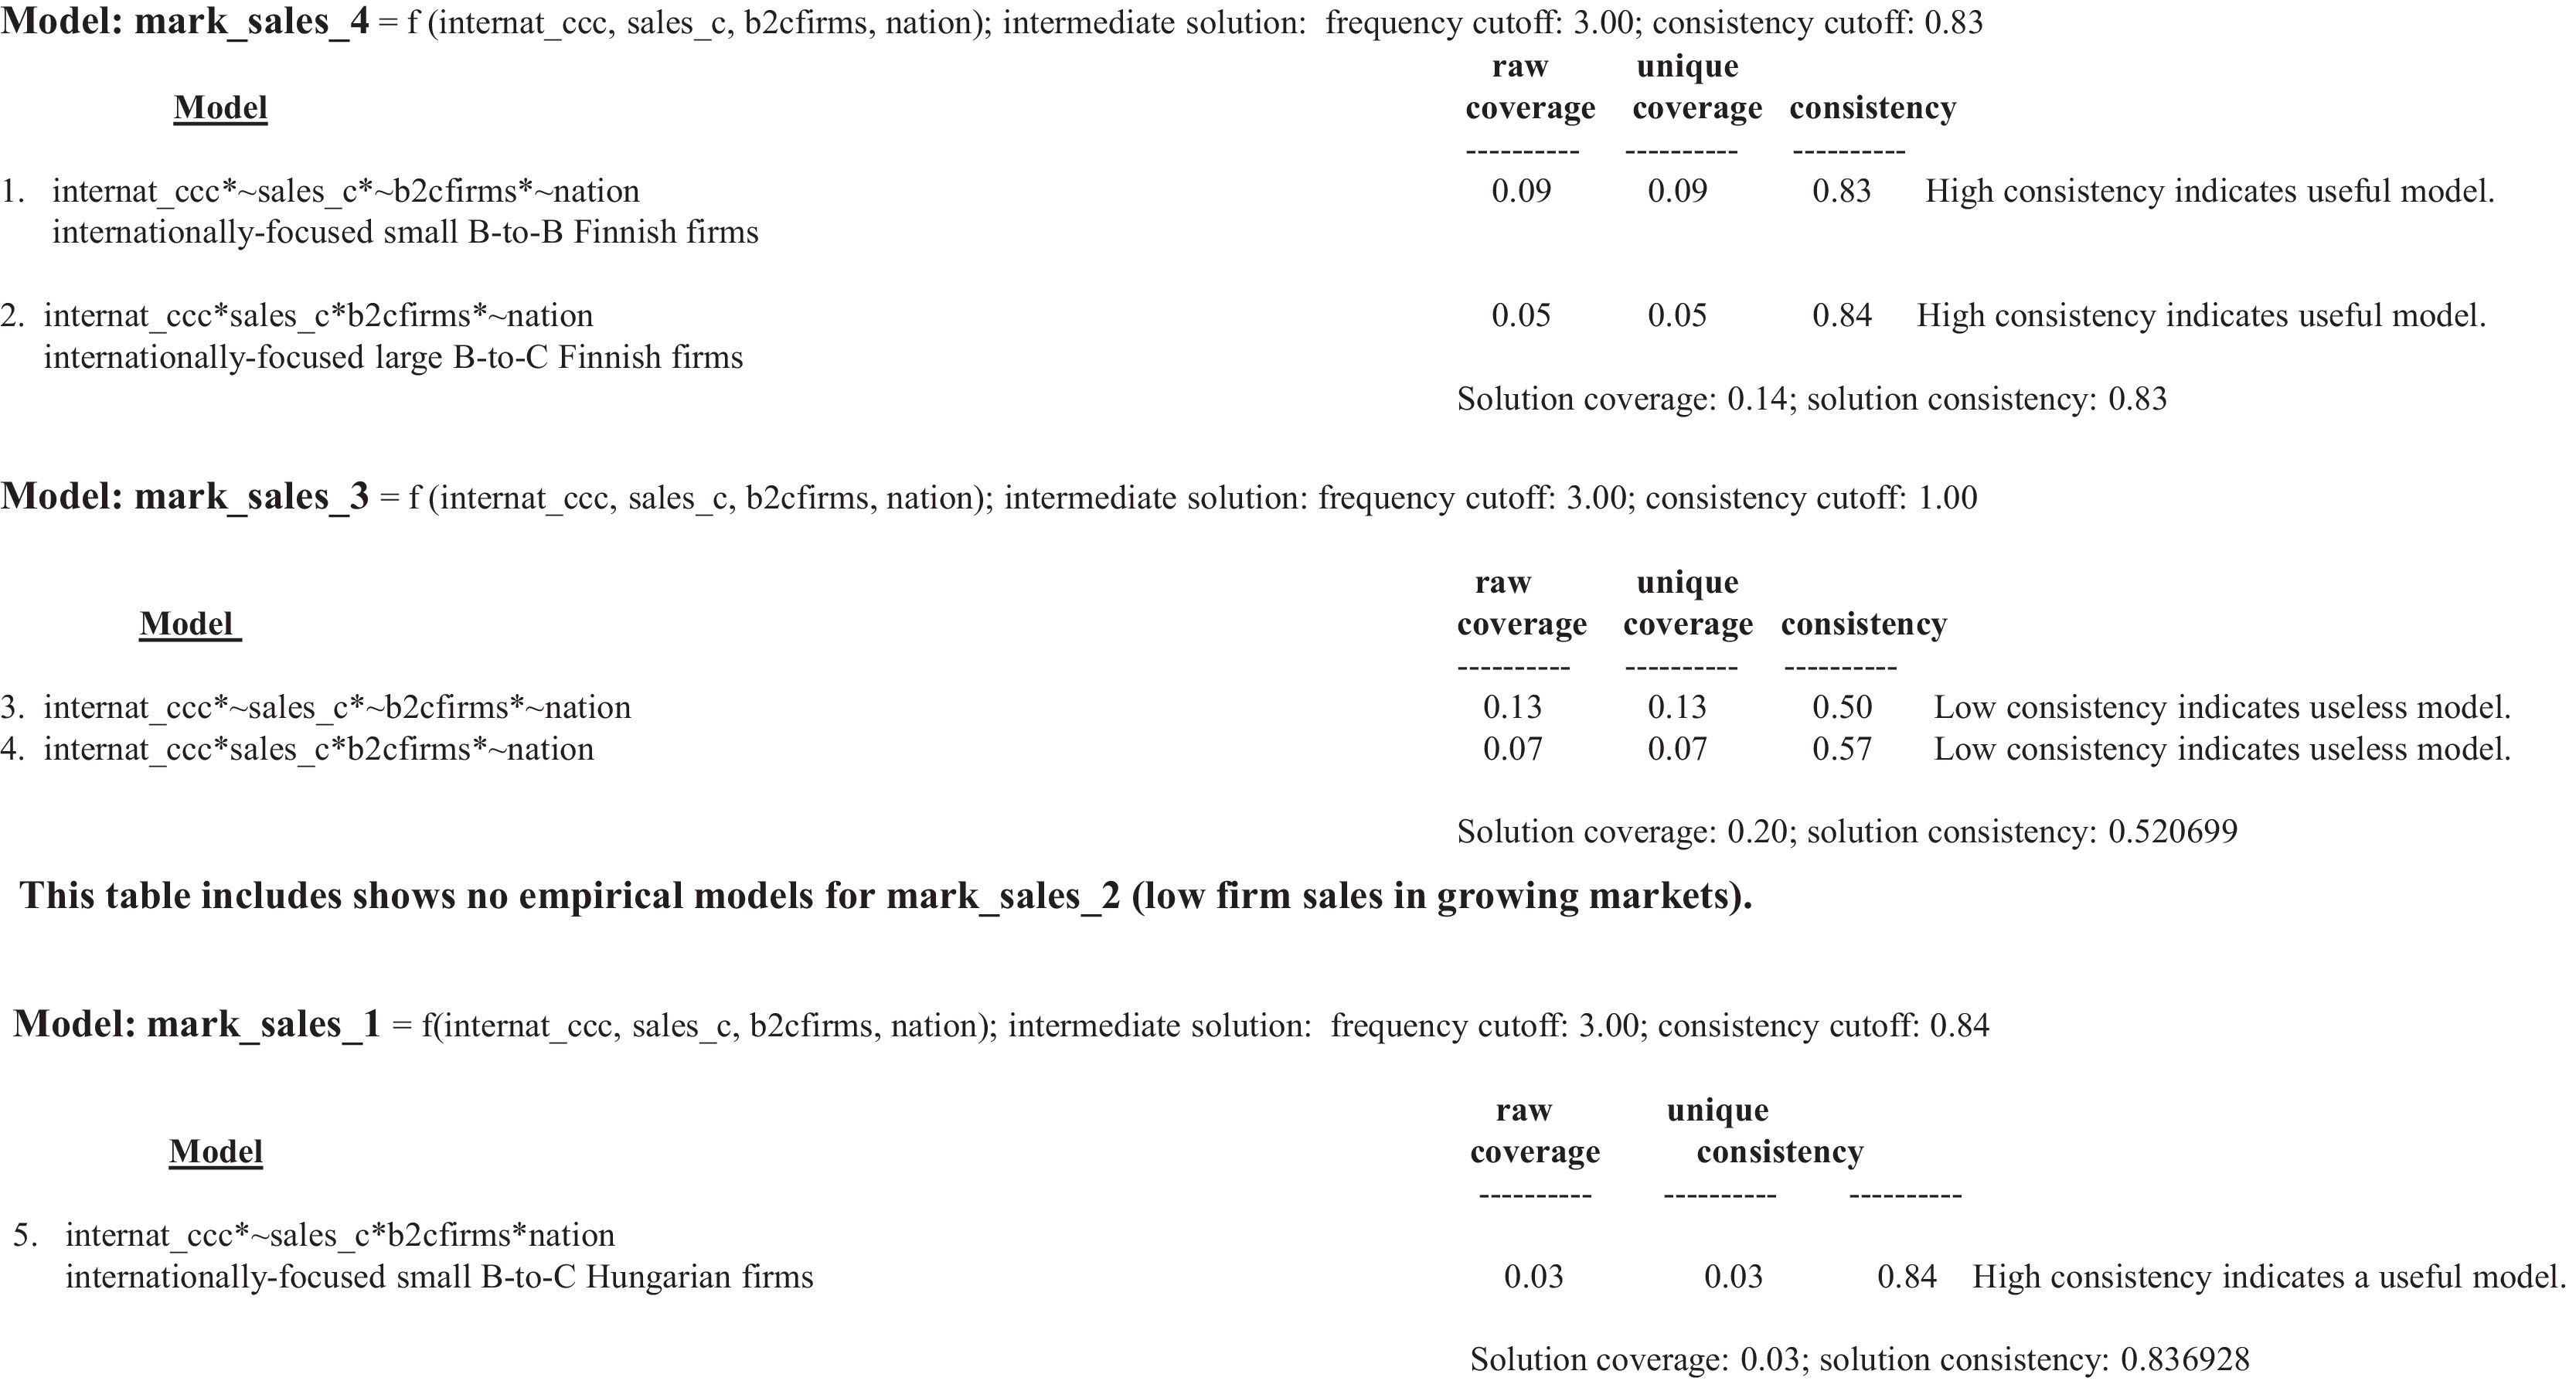
For corner 4 (increasing firm sales in increasing markets), the two models that indicate increasing firm performance in growing markets include internationally focused Finnish firms. The first of these two models includes small B-to-B firms. The second includes large B-to-C firms. Such findings indicate firm demographic models that are likely to be successful in the context of growing markets. For corner 1 (decreasing firm sales in decreasing markets), one demographic configuration indicates firms with high scores in this complex outcome condition: small B-to-C internationally focused Hungarian firms. This model has high accuracy in indicating decreasing firm sales in the context of declining markets.
The study includes finding no model solutions for corner 3 and corner 2 outcomes. Possibly, configurations of demographic ingredients and firm orientations are able to shed light on corner 3 and corner 2 outcomes, as well as additional light on corner 4 and corner 1 outcomes. These possibilities are the topic of the findings for P4 below.
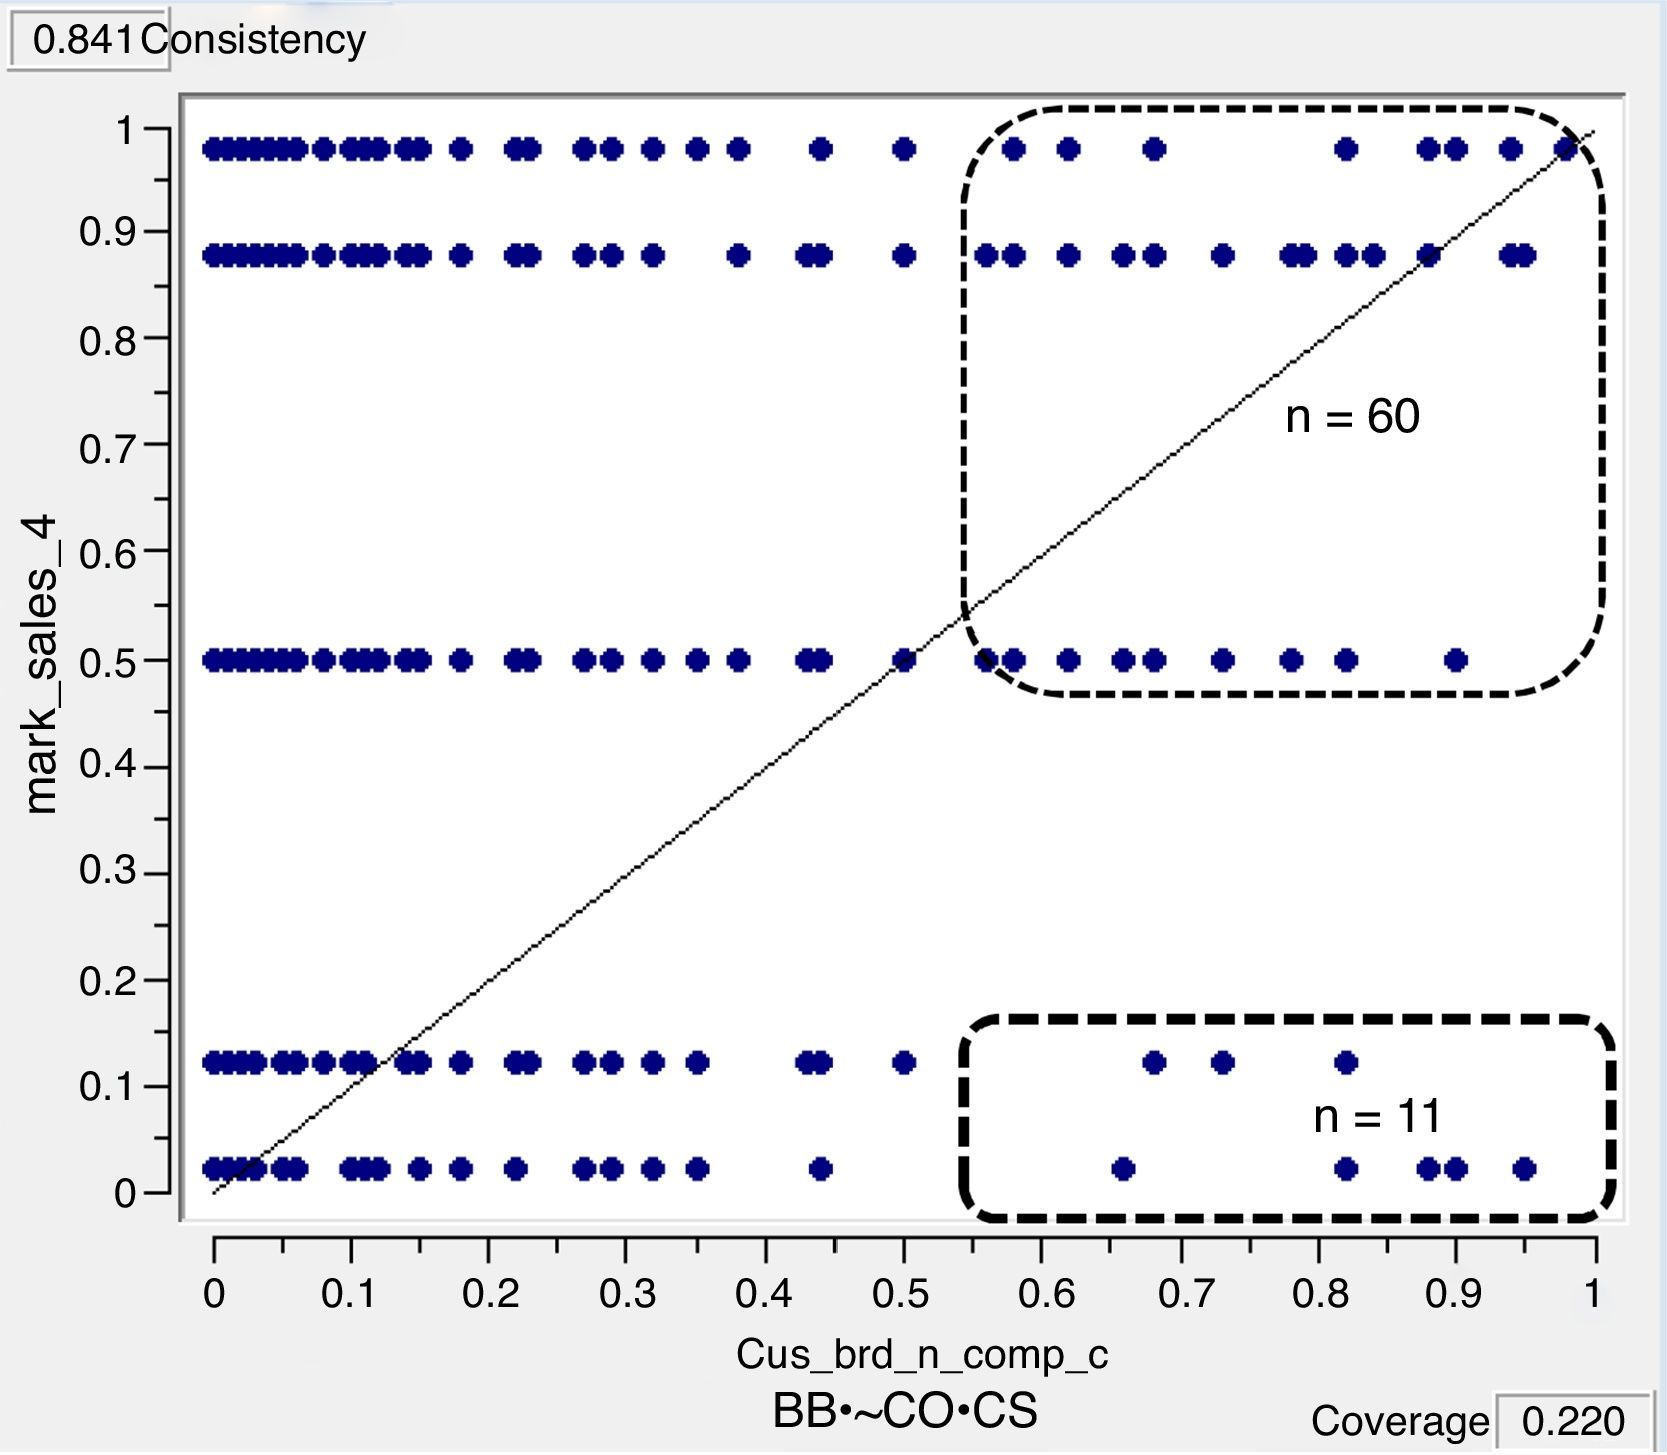
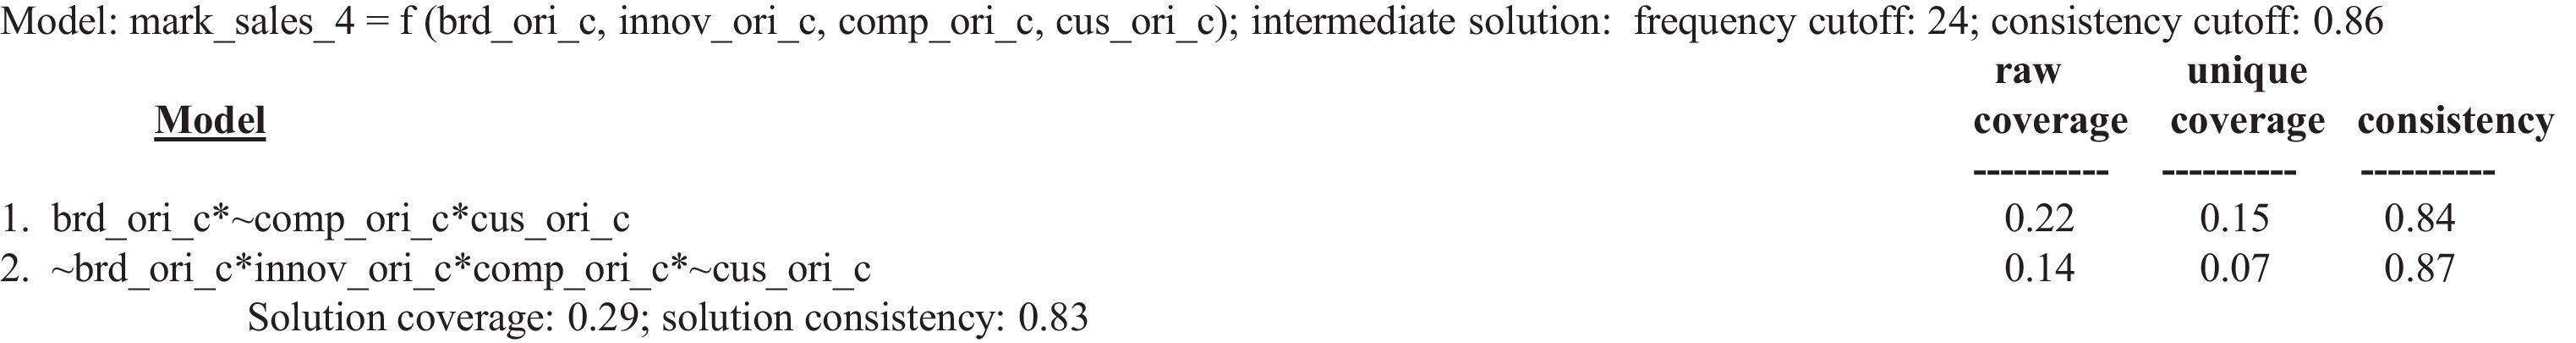
The findings provide limited support for P3: Strategic orientations and four-corner outcomesP3: Unique sets of firm strategic orientation configurations occur for each of the four-corner firm performance outcomes. Two SO configurations indicate high scores for corner 4 (high firm sales in increasing markets). These two models appear in Table 3. The findings for the first of these two models appear in Fig. 3. Model 1 in Table 3 includes firms high in brand orientation AND low in competitor orientation AND high in customer orientation. Model 2 includes firms low brand orientation AND high in innovation orientation AND high competitor orientation AND low in customer orientation.
Findings for firm orientation cases and four corner outcomes: Corner 4 (high firm sales in growing markets).

Notes. Only two firm orientation models indicate complex outcome condition corner 4 (high firm sales AND high market growth). The findings for the other three corner outcomes do not include models with high consistency indexes.

Firm orientations predicting firms with high sales in growing markets. XY plot for model listed in Table 3 appears here in this figure. Finding in this figure for the XY plot: Odds are close to 6/1 that firms high in brand orientation AND high in customer orientation AND low in competitor orientation will have moderate to high market sales.
Such findings suggest that knowledge of complex firm SOs is necessary for predicting specific outcomes (e.g., high sales performance in increasing markets). The finding that both high and low CS associate with high corner 4 outcomes supports the claim that complexity theory tenets are highly relevant for modeling firm orientations and firm outcomes. Strategic management researchers need to put an end to expecting simple directional relationships and reporting “mixed” findings when some studies report a positive relationship while other studies report a negative relationship between X and Y. Both positive and negative relationships occur in almost all studies between X and Y. Moving out of the shallows, the substantial issue is to report on the configurations in which positive X is an ingredient in predicting high Y outcomes and the configurations in which negative X is an ingredient in predicting low Y outcomes. The research focus needs to shift to predicting the oomph of outcomes and not statistical significance of directional relationships.
Fig. 3 reports the oomph that model 1 provides in predicting corner 4 outcomes. The consistency of the first model (BB•∼CO•CS) equals 0.84. The odds are 6 to 1 that cases with membership scores equal to or above 0.55 on this complex antecedent SO condition will have scores equal to or above 0.50 on the corner 4 outcome. Of course, these findings are statistically significant by a sign-test but case-based modelers rely on reporting the oomph rather than NHST findings.
Complex statements of firm orientations alone are insufficient for accurately predicting cases with high scores in the other three corner outcomes. Possibly, the combining of orientations by demographic configurations (arrow 4) in Fig. 1 is sufficient for such tasks. The findings for P4 support this hunch: Configurations that include both SOs and firm demographic conditions result in useful models for all four-corner outcomes.
The findings for P4: SOs with firm demographic configurations are sufficient for identifying cases in all four cornersSeveral configurational models containing SOs and firm demographics identify firms having firm sales growth operating in markets increasing in size. These models achieve consistent high accuracy. Nine such models appear in Table 4. A note appears below the first model as an example for “computing with words” (Zadeh, 1996, 2010) for all nine models. Model 1 in Table 4 describes small-size firms, high in customer orientation, low in competitor orientation, low in innovation orientation, and high in serving international markets. Nation is not an ingredient in the model 1 recipe—the model applies to both Finnish and Hungarian firms. Innovation orientation (IO) is not an ingredient in the model 1 recipe—the model applies to firms high and low in innovation. The ingredient, high IO appears in models 4 and 6 in Table 4.
Models for firms with growing sales in growing markets (complex outcome condition corner 4).
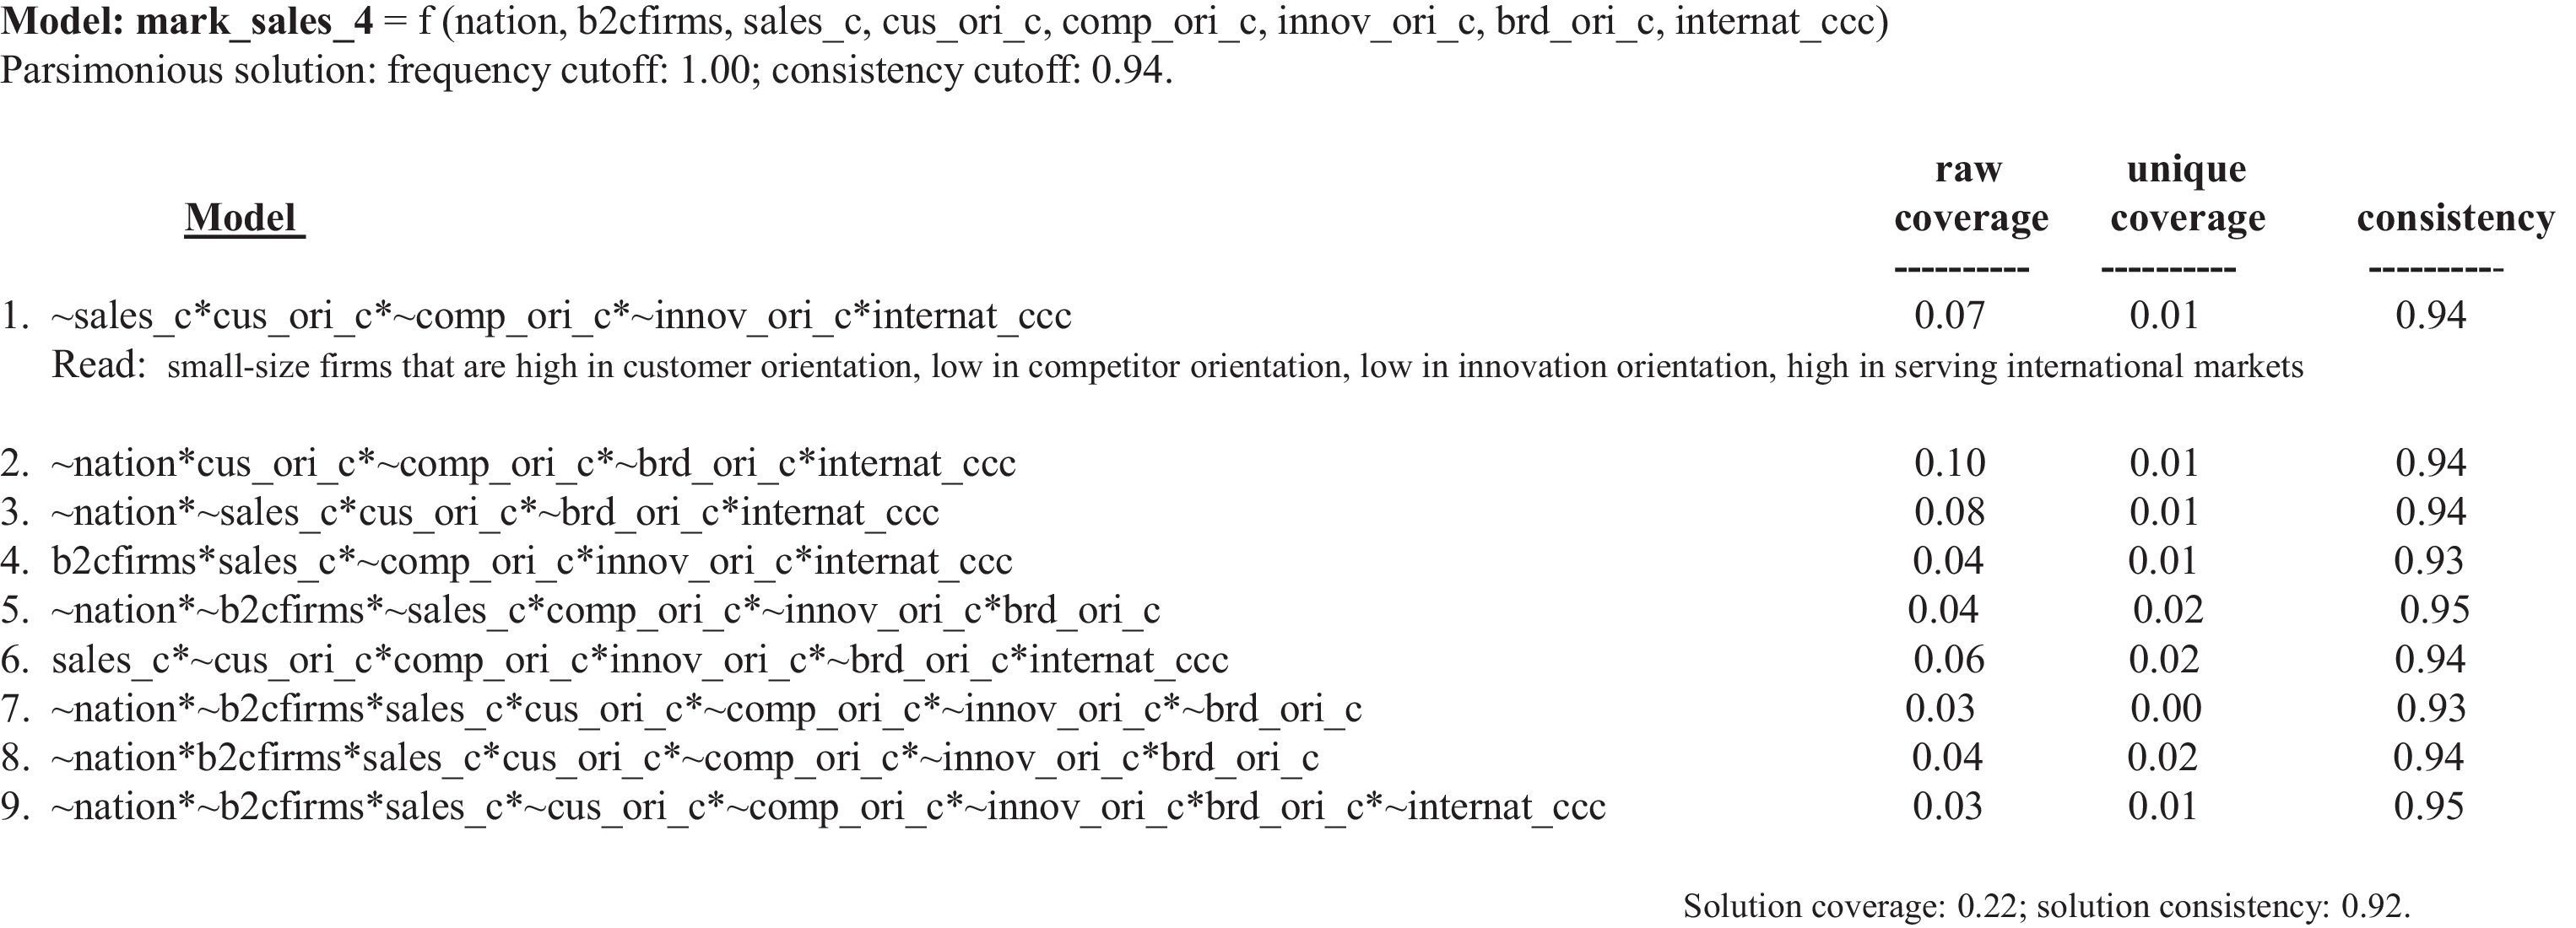
Notes. “Nation” is not an ingredient in models 1, 4, and 6; six of these nine models include Finland as a condition; thus, Finland as a condition is neither necessary or sufficient by itself to indicate outcome condition 4 (high firm sales in growing markets). Do firms with outcome condition 4 occur that focus on international markets? Yes, firms operating mostly in international markets include firms indicated by models 1–4 and 6. Firms with outcome condition 4 that do not focus on international markets occur as well (model 9). Model 9 includes firms achieving condition 4 that serve local markets in Finland—these firms are B-to-B firms that are high in brand orientation and low in the other three firm orientations.
Low IO appears in models 5, 7, 8, and 9 in Table 4. Such findings illustrate the shallowness in focusing on the issue of one directional relationship between IO and firm performance: IO associated positively, negatively, and not at all with an outcome condition. This perspective applies to all antecedent conditions and contributes empirical evidence to Hubbard's (2016, pp. 192–193) dictum, “In principle, there is no reason why theories in the management and social sciences cannot yield precise (or interval) predictions. … However, this line of thinking flies in the face of conventional wisdom that theories in these areas are unable to specify point predictions.” (A short visit to Hubbard's dictum (2016, p. 193) and a day or two with his entire book is highly illuminating.)
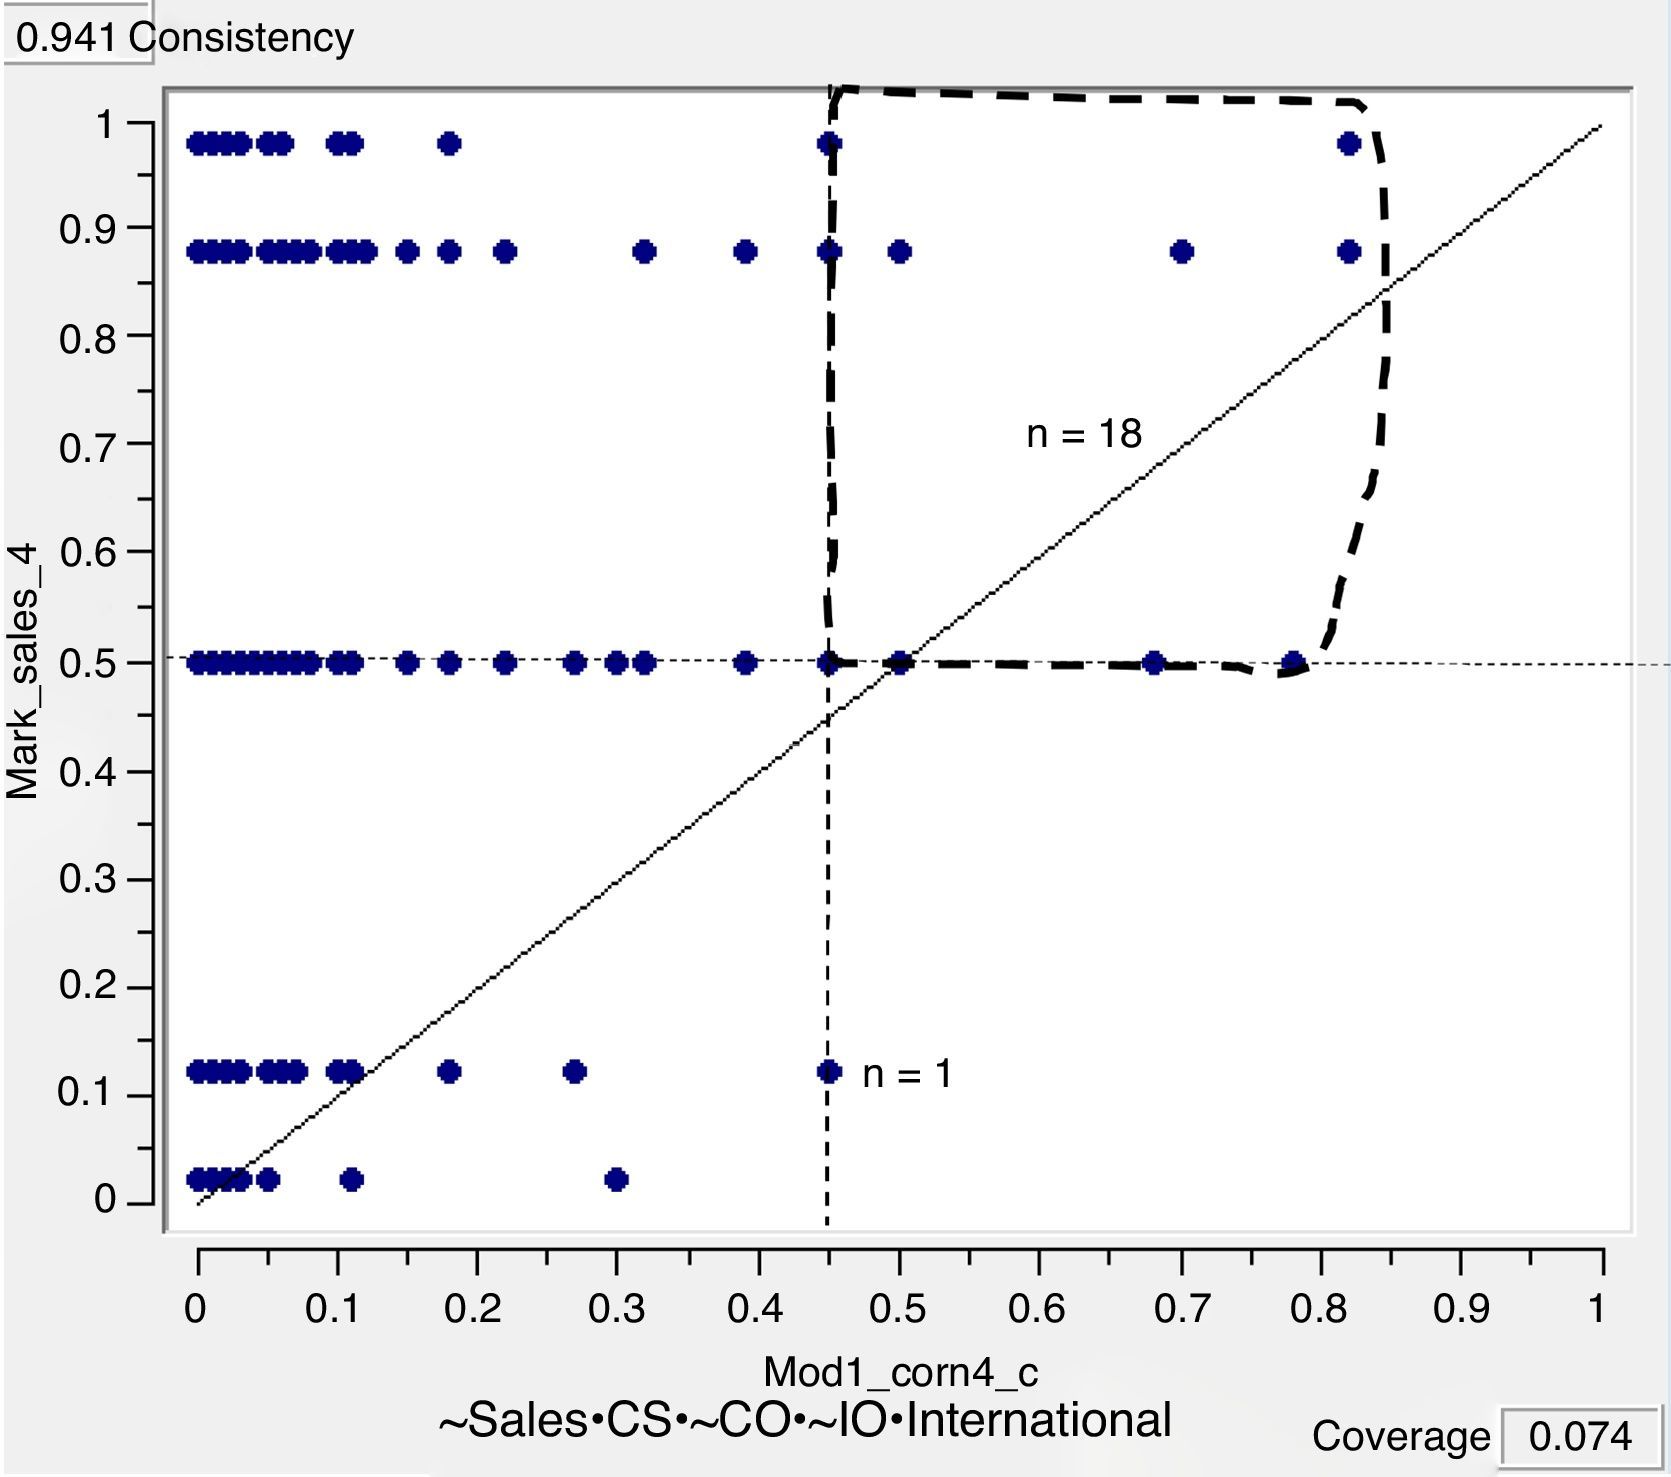
Fig. 4 is an XY plot of the findings for model 1 in Table 4. Fig. 4 illustrates the “somewhat precise outcome test” (SPOT) findings for model 1. While not achieving perfect accuracy, a membership score equal to or above 0.45 on model 1 indicates that firm sales will be moderately high to very high in markets with increasing sales. Looking at XY plots is usually highly informative as Anscombe (1973) illustrates for four sets of data having the same correlation, means for both X and Y, sample variance, and regression model but very different XY plots. Two case-based asymmetric models (screens) can have identical consistency and coverage indexes but very different clumps of cases high in Y for high X memberships. And, of course, the specific cases high in X and Y will overlap but also differ. While not shown in this essay, the specific cases represented by the specific dots in the XY plots are identified in the fsQCA.com program by clicking on each dot. Isaksson and Woodside (2016) and Woodside, Mir Bernal, and Coduras (2016) provide examples of identifying cases with in XY plots.

XY plot of model 1 for corner 4 outcome: Firms high in small-size firms that are high in customer orientation, low in competitor orientation, low in innovation orientation, high in serving international markets are high in sales in increasing markets. Notes: Most dots represent two or more cases. The odds are 18-to-1 that firms with membership scores equal or above 0.45 have scores at or above the main diagonal—have membership ≥0.50 in high firm sales in growing markets.
Models 4 and 8 are applicable to B-to-C firms only. Models 5, 7, and 9 are applicable to B-to-B firms only. The general customer industry category is irrelevant in models 1, 2, 3, and 6. Again, these findings illustrate the perspective that focusing exclusively or mostly on simple directional relationships (e.g., correlations and regression analyses) of independent and dependent variables is embracing a shallow research stance.
Findings for corner 3 cases: Firms increasing in firm sales in declining marketsTable 5 includes the findings for corner 3 outcomes: Firms with increasing sales operating in declining markets. Note that only one of the models in Table 5 surpasses the arbitrary 0.80 consistency threshold. Configurations that include SOs and firm demographics are only marginally capable of identifying firms capable of swimming upstream—generating increasing sales in declining markets.
Models for firms with growing sales in declining markets (complex outcome condition 3).
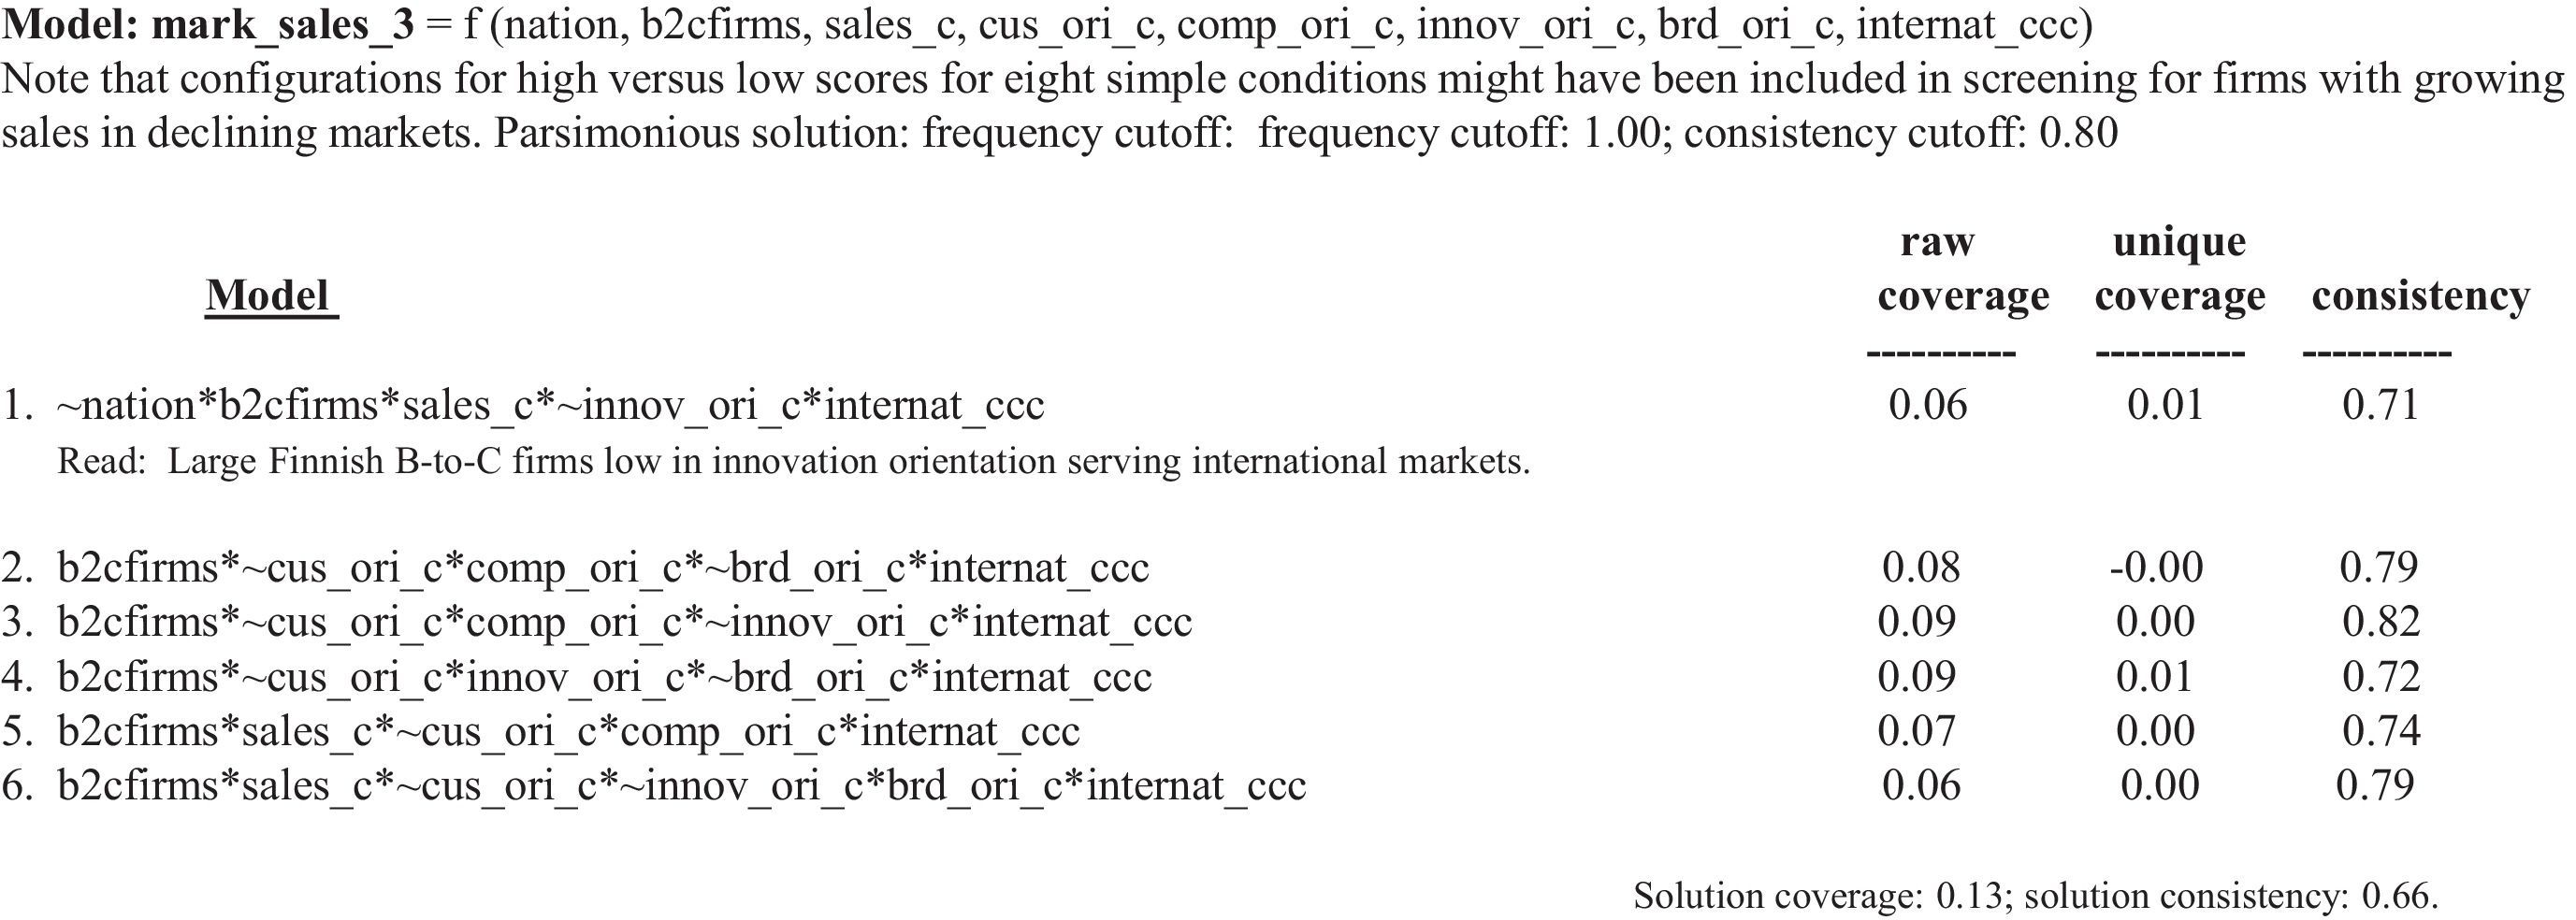
Notes. Nation as an ingredient appears only in model 1. Note that all six models indicating complex outcome condition 3 serve international markets. International markets are a “local necessity condition” for firms achieving high sales in declining markets. All six models include B-to-C firms as an ingredient in their configurations. B-to-C is a local necessity condition. Low in customer-orientation appears in five of the six models; no model includes high customer-orientation. Low brand orientation is a condition in appearing in two models and high brand orientation does not appear in any of the models.
Five of the six models include the negation of customer satisfaction (CS) and are B-to-C firms focusing on international markets, and three of the six models include high membership in competitor orientation (CO) and three models include the negation in innovation orientation (IO). Nation (Finland versus Hungary) does not appear in five of the six models. These findings suggest that large firms capable of serving international markets with B-to-C products, but not necessarily achieving the highest levels of customer satisfaction, are the firms that grow in downward trending markets.
Findings for corner 2: Firms with decreasing sales in growing marketsTable 6 includes the models with firms with high membership scores in models indicating decreasing sales in growing markets. Model 2 in Table 6 provides a consistency index above the arbitrary threshold (0.80). General industry orientation and international focus are not ingredients in the second model in Table 6. Model 2 includes small Hungarian firms, high in customer satisfaction (CS) orientation, low in competitor orientation (CO), high in innovation orientation (IO), and low in brand-building (BB) orientation. For corners 3 and 2, ∼CS is an ingredient in models indicating increasing firm sales in declining markets and CS is an ingredient in models indicating declining firm sales in growing markets. Such findings do not support the perspective that achieving high market (CS) orientation is “critical” for firm success. The need to achieve high CS depends very likely on the contexts in which firms operate.
Models for firms with declining sales in growing markets (complex outcome condition corner 2).
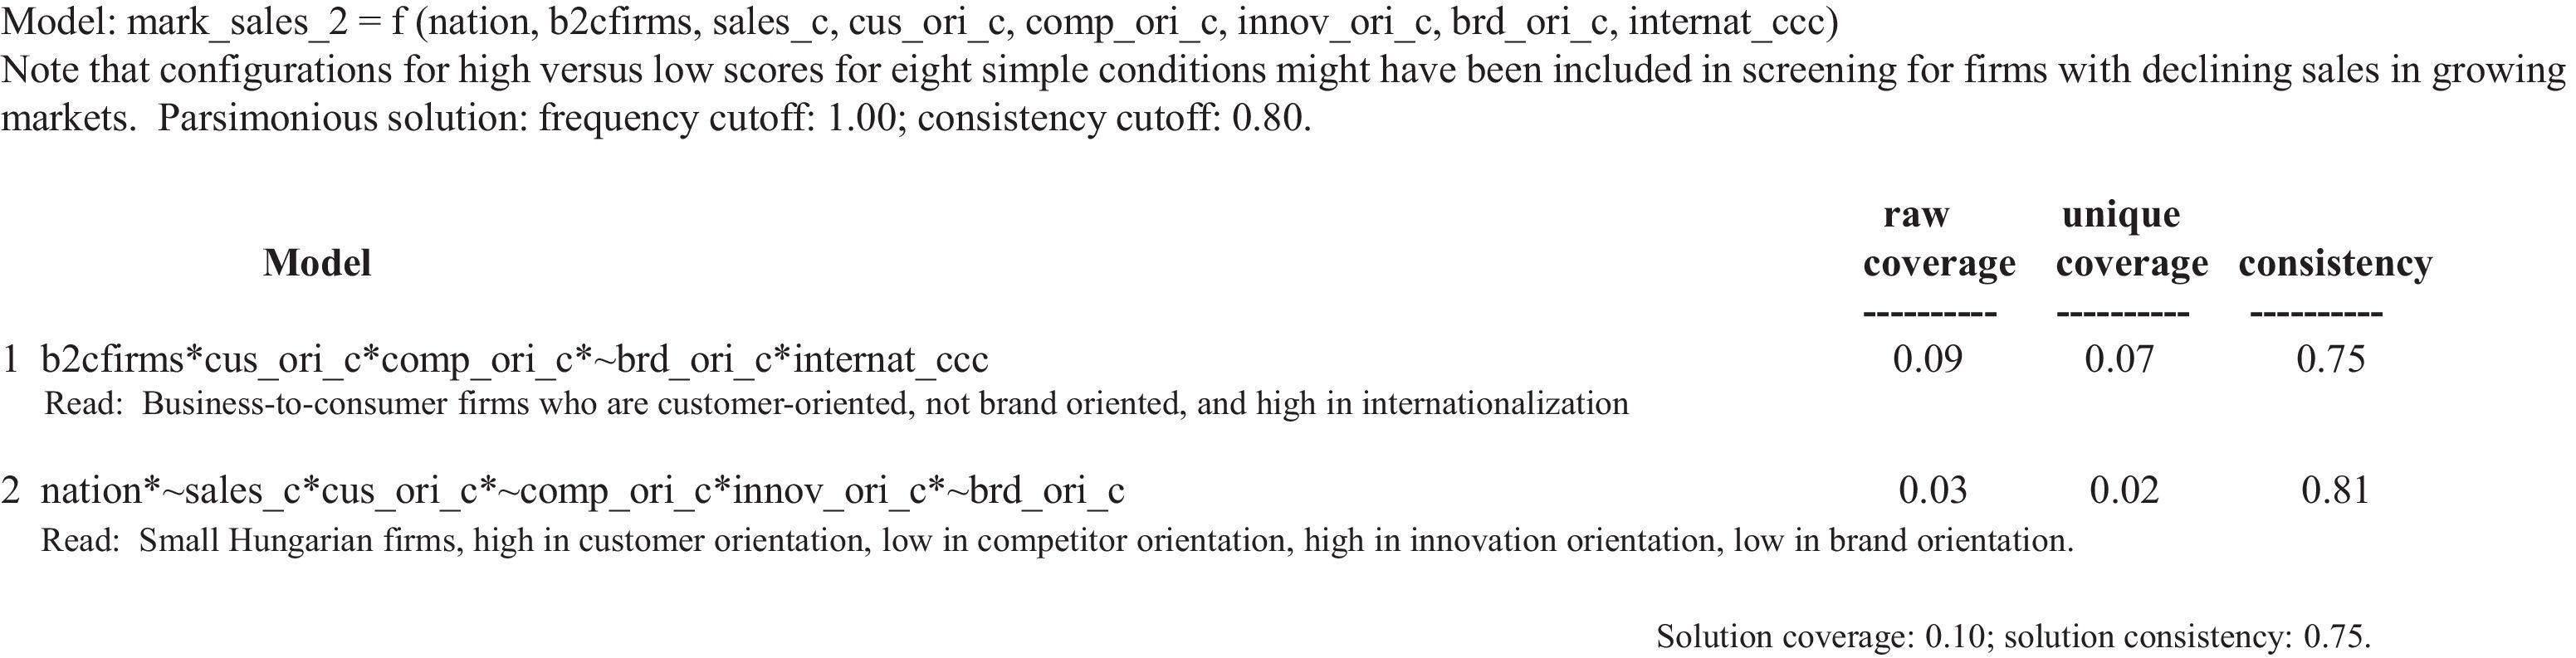
Notes. Generating only two models is in keeping with the relative rarity of firms declining in sales in growing markets. These firms are exceptions to the adage, rising tide lifts all boats. Both models include high scores in customer orientation. Size of firm is not a condition in the first configuration; size of firm (small firms) is a condition in the second model. Only the second model has a consistency index above the arbitrary cut-off of 0.81—the odds are 4-to-1 that firms with high scores for this model have high scores for the outcome of declining sales in growing markets.
Table 7 includes eight models able to indicate firms with declining sales in declining markets. All models in Table 7 include Hungary as an ingredient. Hungary is a local necessary but insufficient ingredient for identifying firms with declining sales in declining markets. Given Hungary's more than four decades (1945–1989) of dismal firm performances via experiencing a planned economy system versus Finland's high-tech, thriving, decades of free-market experiences, Hungary as an ingredient in indicating firms having decreasing sales in declining market conditions may not be surprising.
Models for firms with declining sales in declining markets (complex outcome condition corner 1).
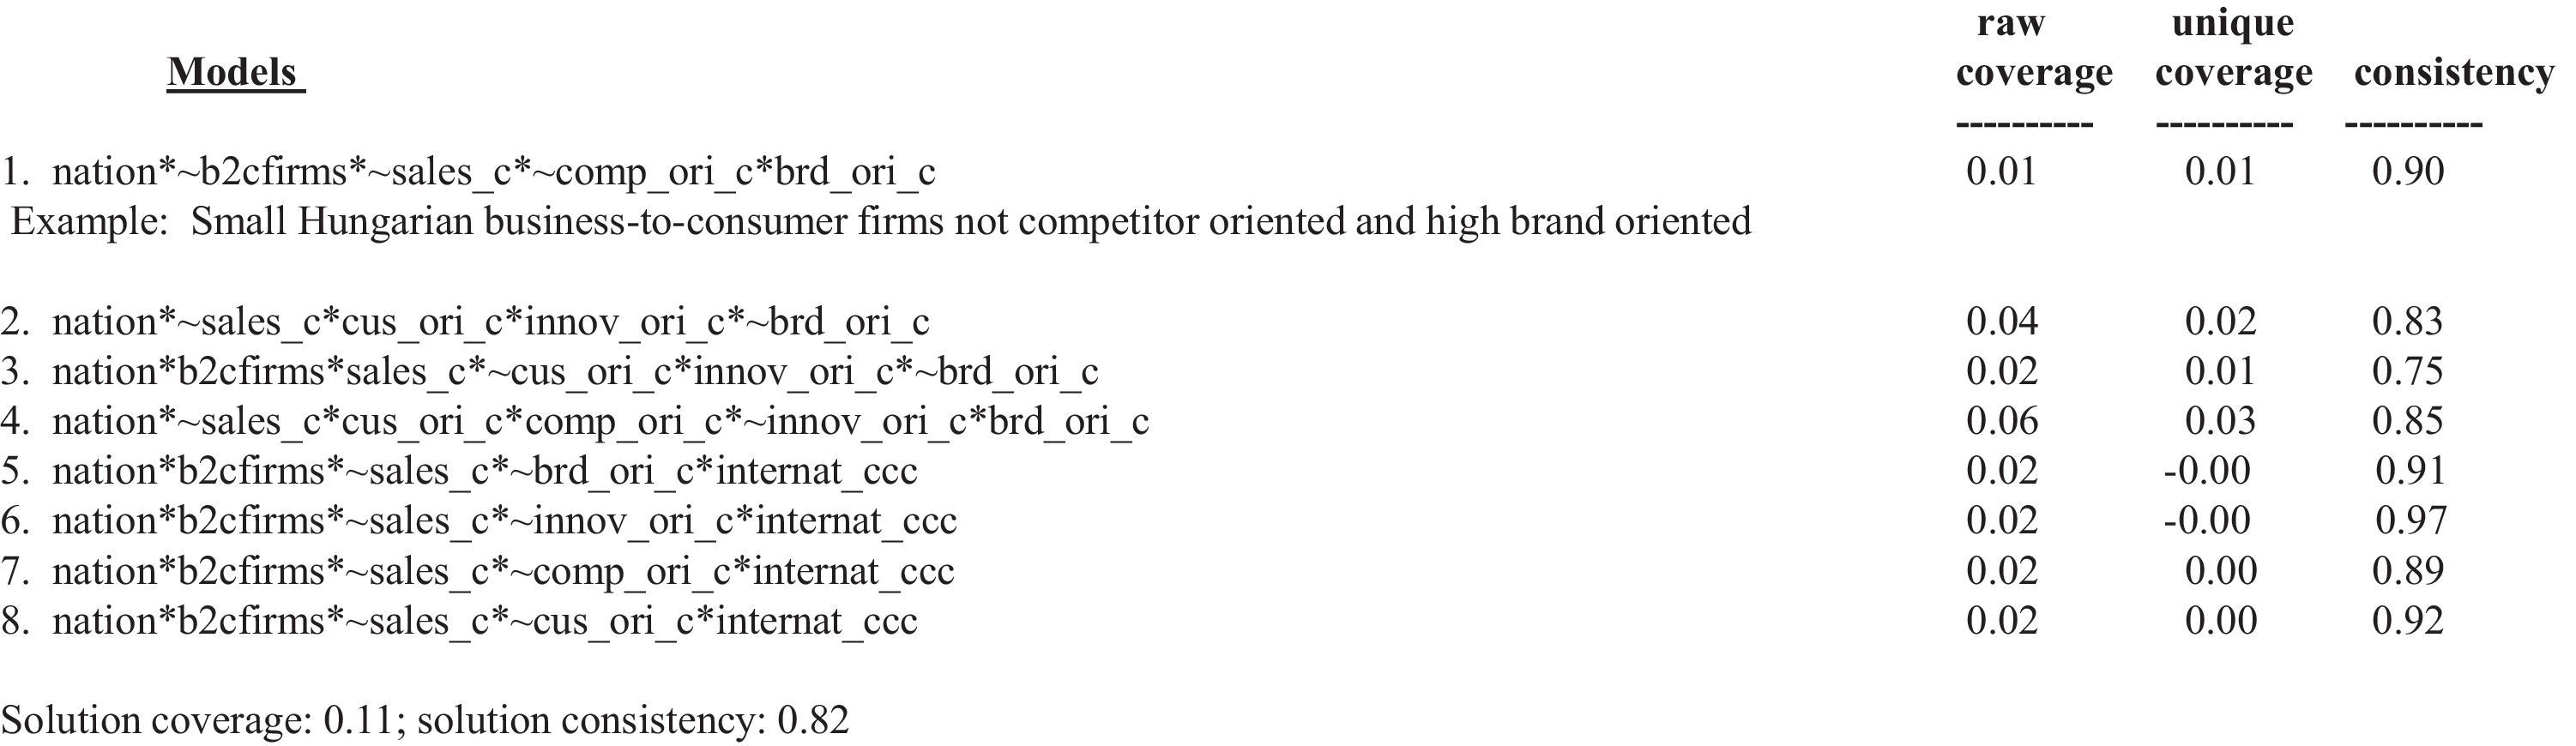
Notes. All models refer to Hungarian firms—“Hungarian firms” is a local necessity but insufficient condition in these models. Seven of the eight models refer to small size (i.e., ∼sales_c, “not sales” is small size firms and “c” is calibrated data). Firms in these models have high scores in one firm orientation but never two firm orientations. No one specific orientation is high or low consistently across the eight models. Four of the eight models include high internationalization.
These findings complement Finland being an ingredient in six of nine models indicating firms increasing in sales in growing markets (Table 4). The general observation receives confirmation: Context matters a lot. A firm operating in Hungary early in the 21st century faces a less nurturing environment than a firm operating in Finland. Yes, most international managers may be aware of this contextual influence on firm growth/decline but the findings here provide nitty-gritty details in the models that few managers could know explicitly.
Five of the eight models include B-to-C as an ingredient and two models include B-to-B as an ingredient. Six of the eight models include the negation of sales (i.e., small size firms). Four of the eight models include focusing on international markets as an ingredient. The negation of international markets (i.e., serving local markets) does not appear in any of the four remaining models.
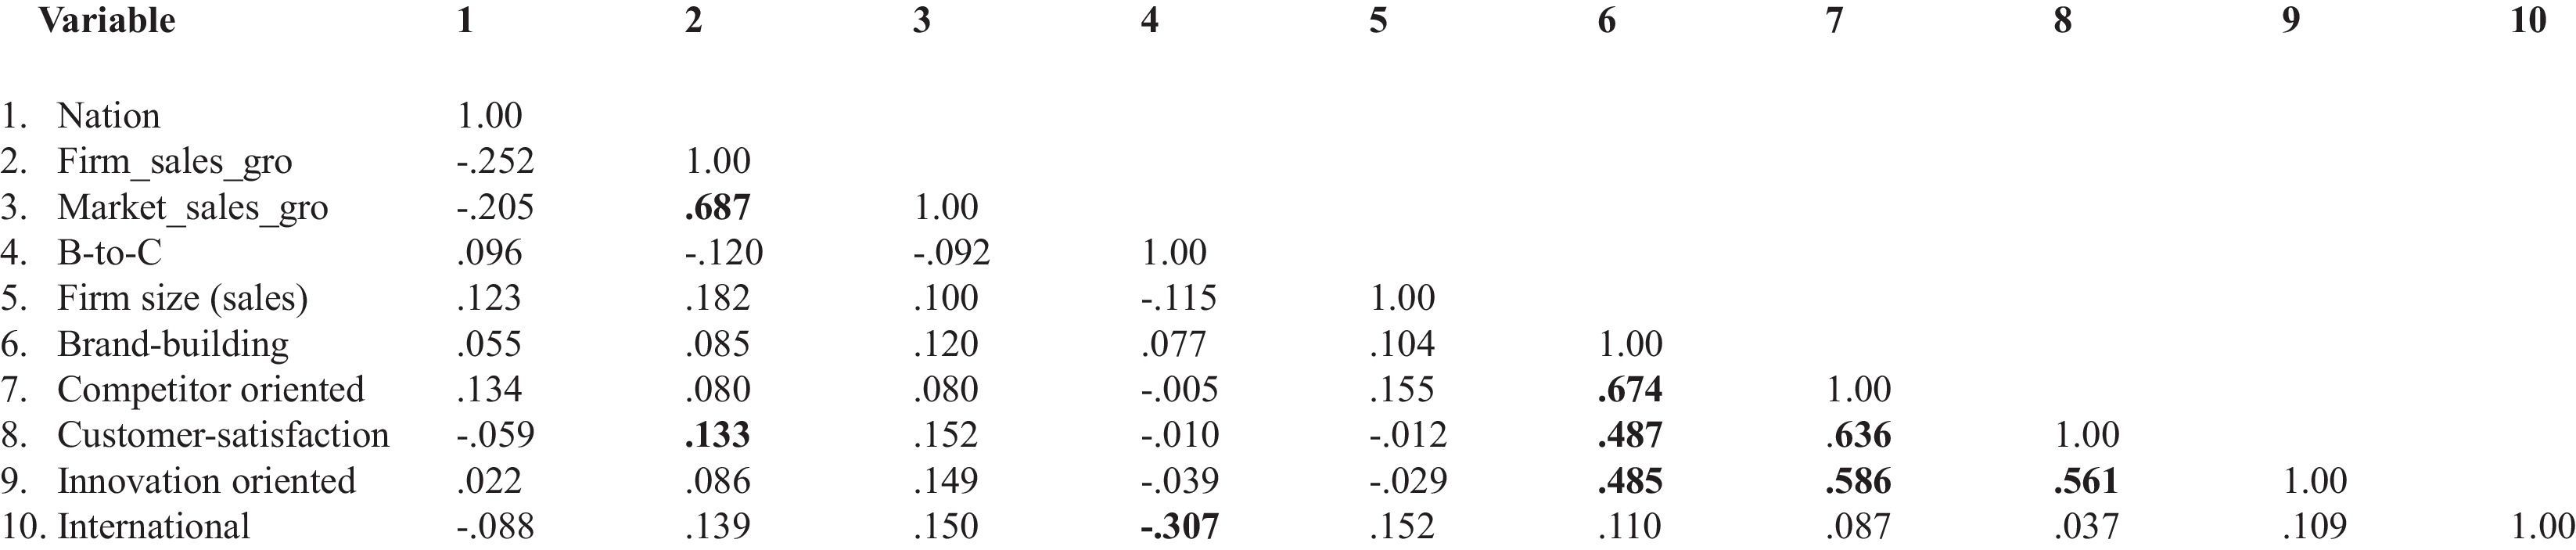
Findings for the symmetric analysis and NHSTsTable 8 is the correlation coefficient matrix for all 10 variables in the study. Particularly noteworthy findings appear in bold. For example, the largest correlation (0.687) directs attention to the positive relationship between market sales growth and firm sales growth. The phi coefficient equal to 1.00 for the 5 by 5 cells in Table 1 is for the same relationship. Such high relationship indexes might suggest that we can ignore contrarian cases. Yet, the present study focuses much attention on contrarian cases—the 48 cases appearing in areas 3 and 2 in Table 1. Most studies include 3 times the proportion (4.3%) of the contrarian cases appearing in Table 1; this observation and the fact that contrarian cases are observable even when phi=1.00 supports the argument to go beyond just measuring the directionality of relationships.
Correlations.

Notes. All double-digit correlations are statistically significant (p<0.01). Nation: Finland=0; Hungary=1. b2b=0; b2c=1. For nation and market sales growth, the −0.205 correlation indicates the share of firms in growing sales markets is greater in Finland than in Hungary. A greater share of Finnish versus Hungary firms experienced firm sales growth (r=−0.252).
The four orientations associate positively with each other: their correlations appear in bold.
The findings indicate that the four SOs associate statistically significantly positively with each other. Yet, the correlations are not so high as to indicate that they are measuring the same dimension. The findings from the asymmetric case-based models described earlier support the perspective that the four SO measures tap unique dimensions. One SO measure, customer-satisfaction (market orientation) has a statistically significant association with firm sales growth (r=0.133, p<0.001). The prior case-based asymmetric models are suggestive of the shallowness of such symmetric test reporting and the inaccuracy of viewing the other three SOs as being unrelated to firms’ sales growth.
Multiple regression analysis.Table 9 includes the symmetric test, multiple regression analysis (MRA), findings for the impact of nine variables on firm sales growth. The multiple regression analysis indicates three variables alone impact firm sales growth: firm size, market sales growth, and nation. All three have a positive impact on firm sales growth. The findings include non-significant statistical test findings for the other six variables. Researchers relying on regression analyses (which is the dominant logic) and NHST (also the dominant logic) reach shallow and inaccurate conclusions about the likely causal mechanisms and the available deeper information via asymmetric analysis that can be extracted from the same data.
Symmetric analysis findings: Multiple regression analysis for dependent variable firm sales growth for total sample.
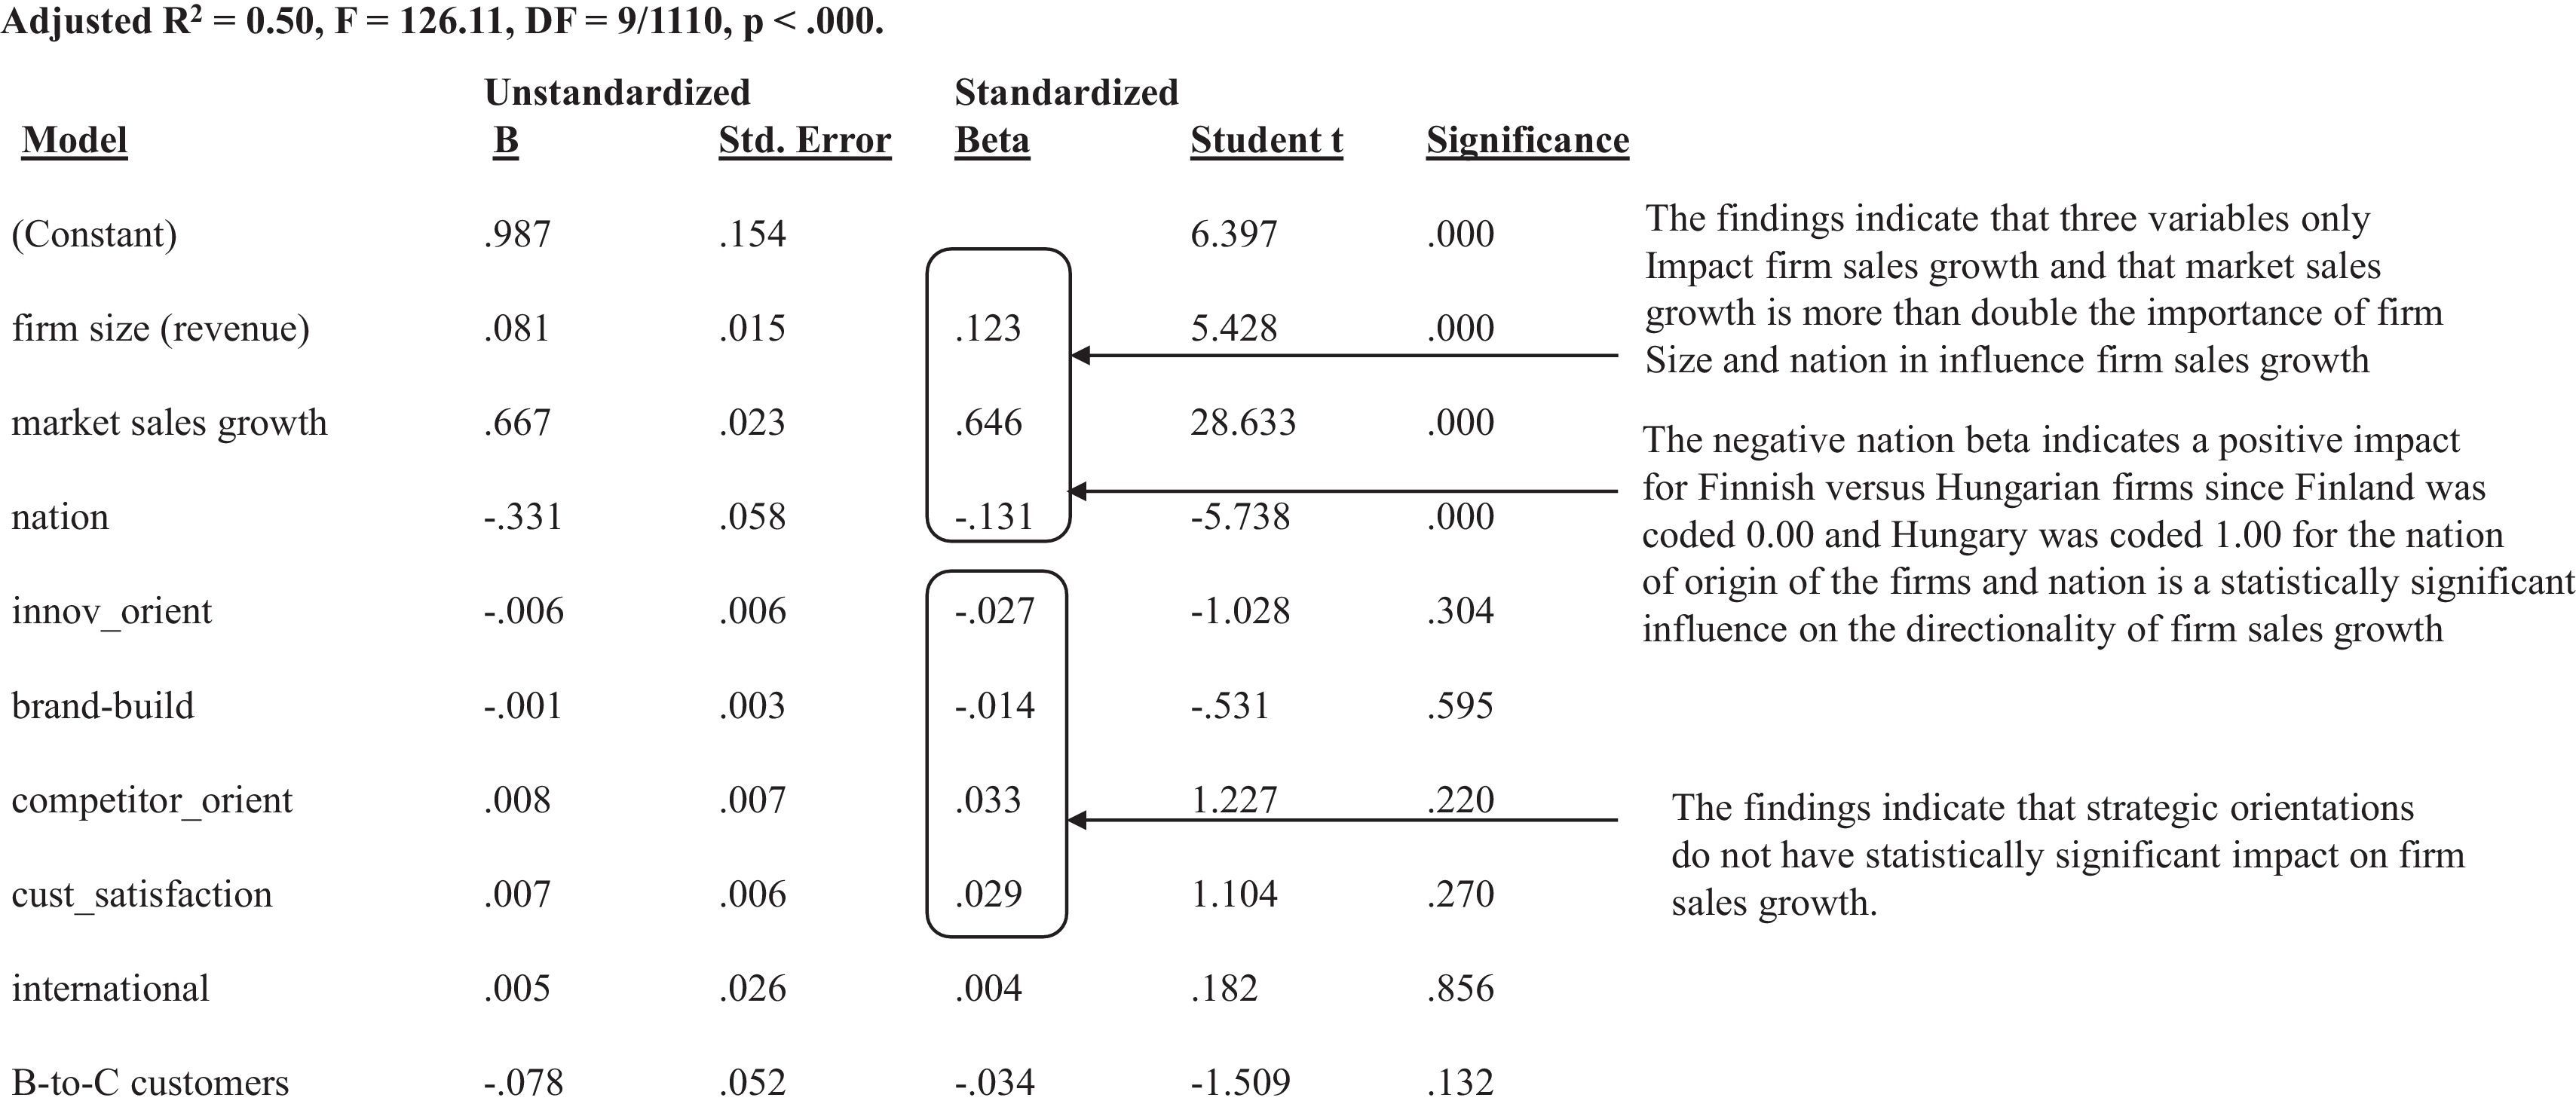
Notes. Testing a model including just the three statistically significant terms does not reduce the adjusted R2 below 0.50. Adding in one SO variable at a time to the reduced model does not result in a large beta for each SO. No matter what variations in regression analysis models are used, only three variables are statistically significant: firm size, market sales growth, and nation.
Fiss (2007, p. 1181) states the problems succinctly with relying on symmetric tests such as MRA. “But while theoretical discussions of configurational theory … stress nonlinearity, synergistic effects, and equifinality, empirical research has so far largely drawn on econometric methods that by their very nature … imply linearity, additive effects, and unifinality. This mismatch has caused a number of problems. For example the classic linear regression model treats variables as competing in explaining variation in outcomes rather than showing how variables combine to create outcomes. By focusing on the relative importance of rival variables, a correlational approach has difficulty treating cases as configurations and examining combinations of variables…regression analysis focuses on the unique contribution of a variable while holding constant the values of all other variables in the equation.” What Fiss (2007) expresses, and the poor performance of symmetric tests in identifying specific cases of particular interest for a researcher versus the good performance in doing so by asymmetric tests, are the reasons for the shift toward case-based asymmetric testing done by Gigerenzer and Brighton (2009), Montgomery (1975), and McClelland (1998). Thus, the rather harsh assessments by Hubbard (2016), Woodside (2017), and Ziliak and McCloskey (2008) become understandable especially when reviewing the extra-ordinary pervasive dominance of symmetric testing and NHST into the second decade of the 21st century.
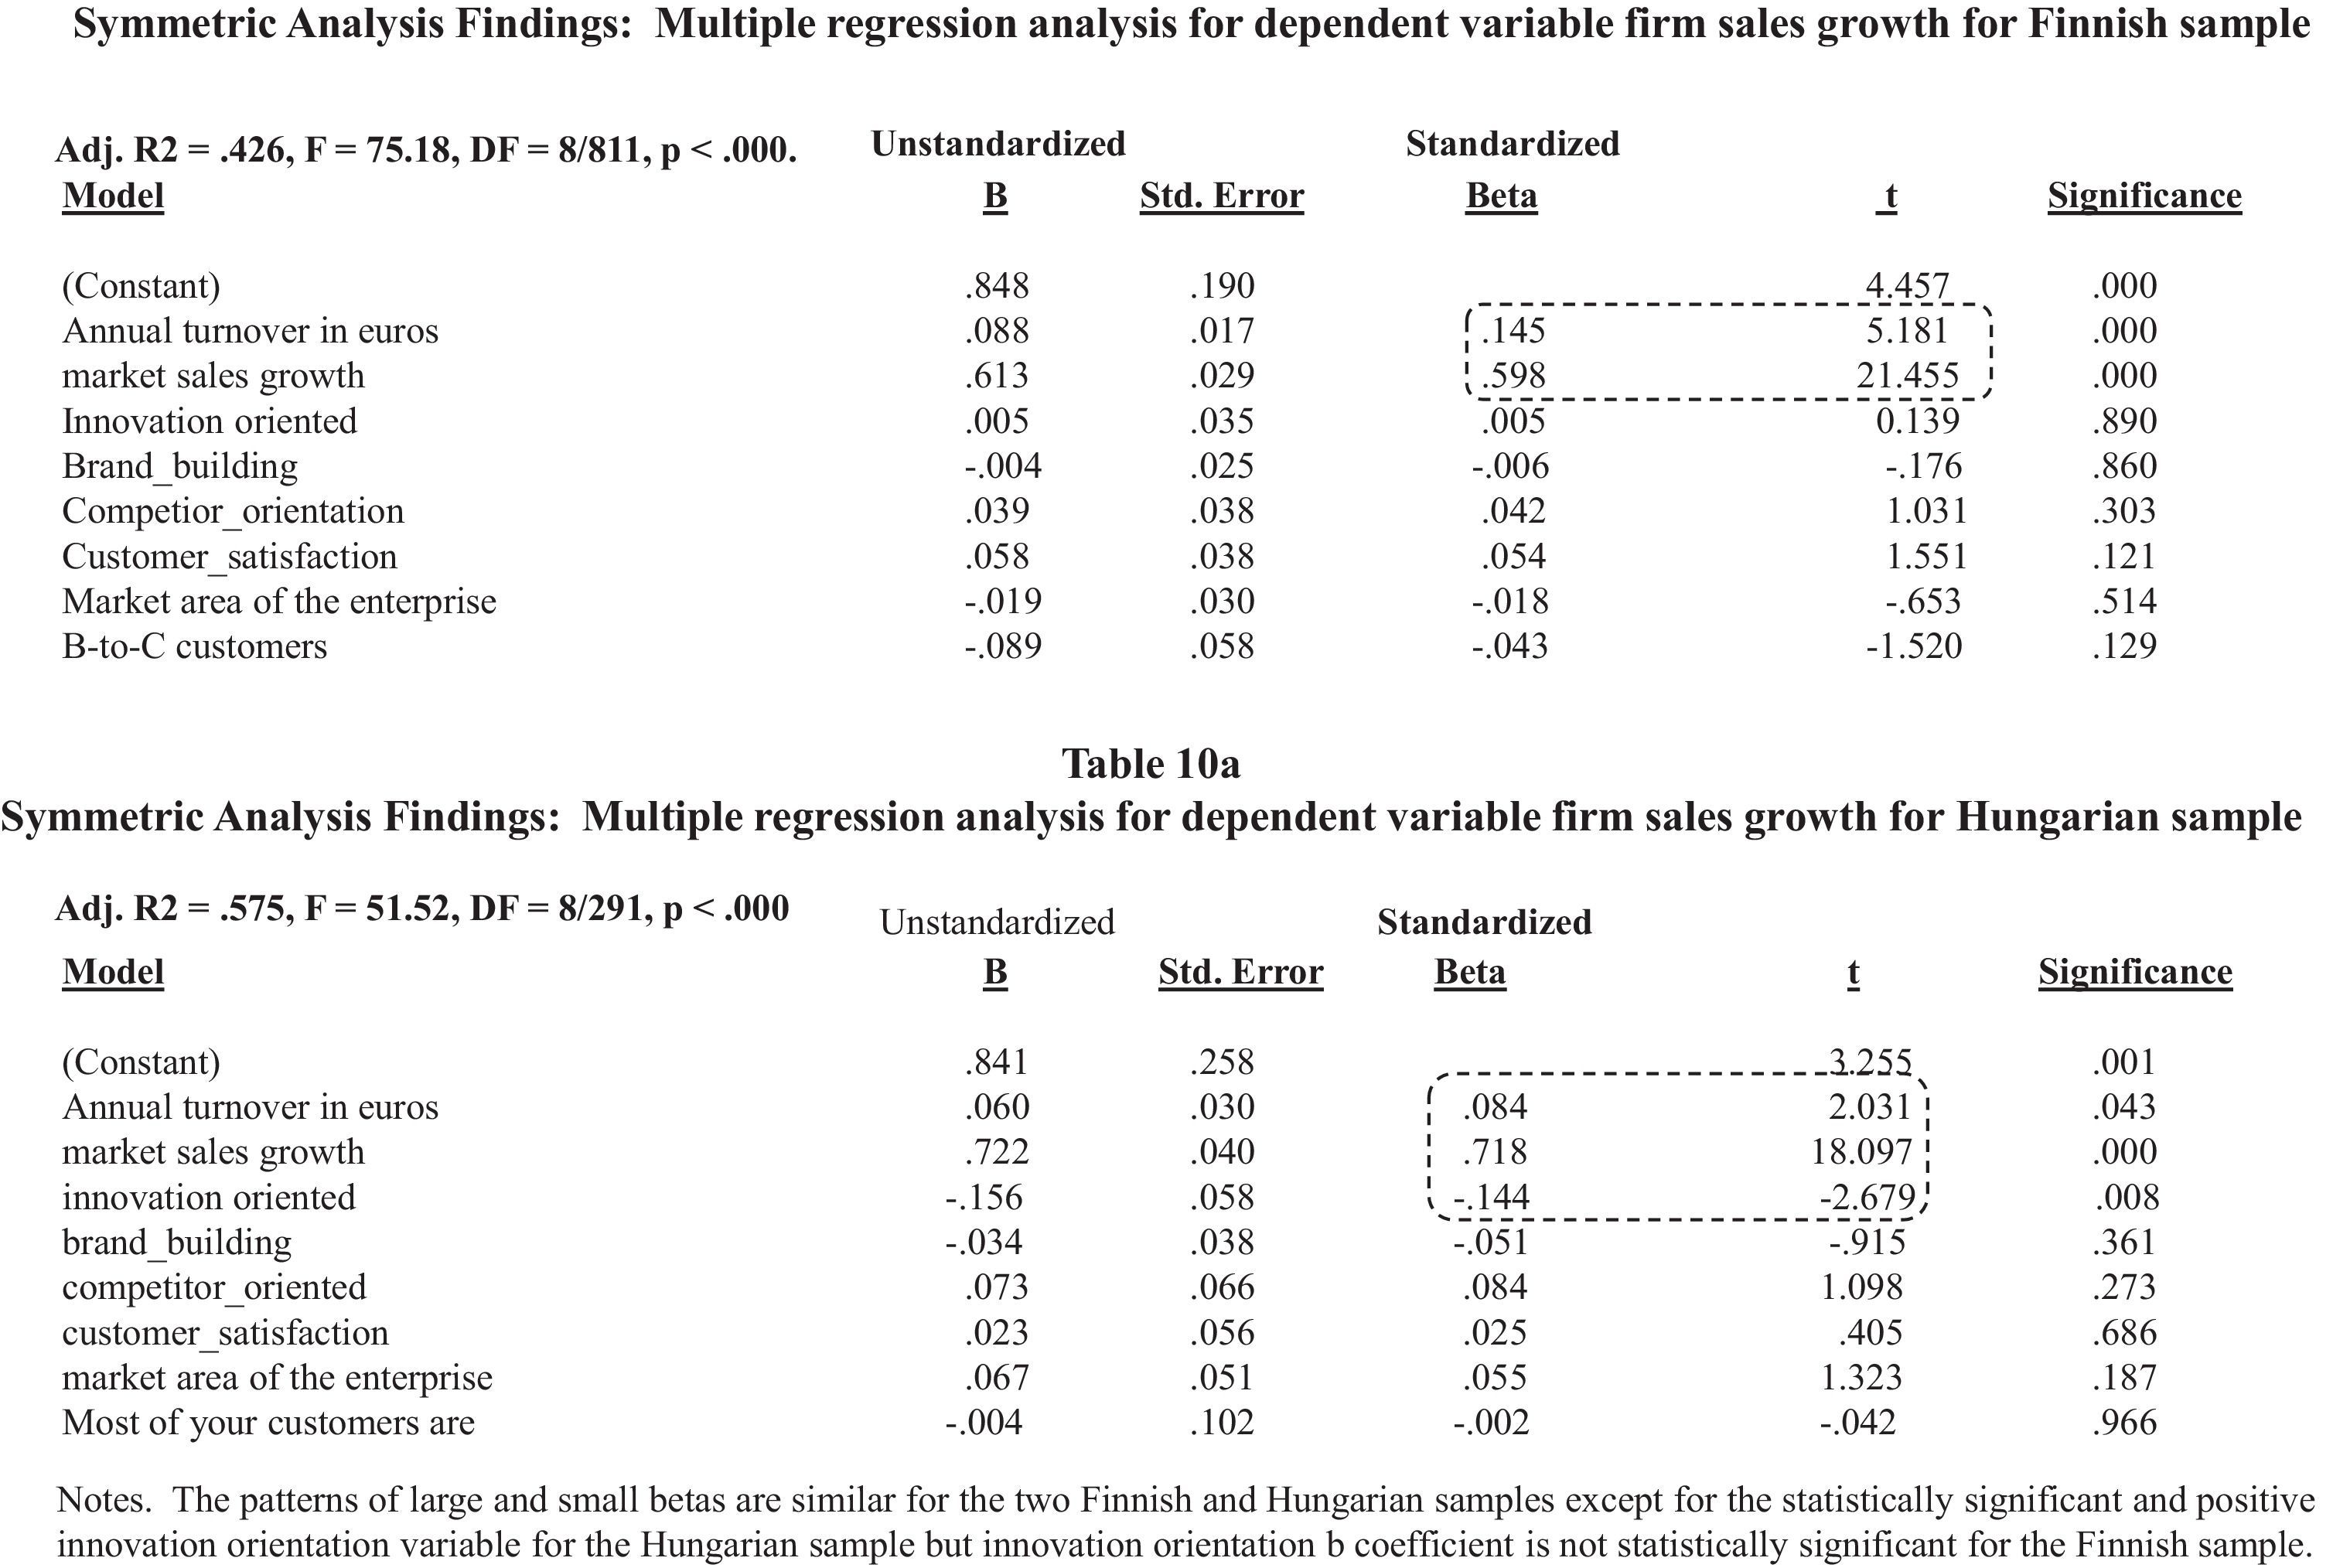
The findings in Table 10a and b are the regression models separately for the Finnish and Hungarian firm samples. The core findings are very similar: the largest beta in both models indicate a large positive impact for market sales conditions on firm sales conditions. Size of firm has a positive impact on firm sales decline/growth in both nations. Innovation orientation has negative effect on firm sales in the Hungarian but is not statistically significant for the Finnish sample. None of the other variables are statistically significant in either sample.
Symmetric analysis findings: Multiple regression analysis for dependent variable firm sales growth for Finnish and Hungarian sample.

Notes. The patterns of large and small betas are similar for the two Finnish and Hungarian samples except for the statistically significant and positive innovation orientation variable for the Hungarian sample but innovation orientation B coefficient is not statistically significant for the Finnish sample.
Of course, the shallow nature of such symmetric tests findings is misleading because of the nature of the test. Attempting to the independent directional effect of each variable in a symmetric model lacks the requisite variety gained by asking what configurations of high versus low states in what conditions indicates high firm sales accurately? The same issue applies for explaining and predicting low firm sales.
Discussion and limitationsAnomalies happen! Discretizing data using quintiles and cross-tabulating relevant variables by 5×5 (or 5×5×5, for three variables) is a simple and useful step for identifying anomalies. As the example in the present essay shows, anomalies to hypothesized main effects occur even when the correlation between two variables indicates a large effect size. The study of anomalies represents a subtle implicit shift away from hypothesizing an XY directional relationship—a shallow issue—to asking what sets of conditions lead to each of the possible corner associations between X and Y—a deep issue. Since researchers can almost always find cases in the four corners of an XY quintile cross-tabulation, asking when (configurations) supporting cases in each corner occur theoretically trumps the question of if X associates with Y positively. Anomalies represent puzzles that are solvable by theoretical modeling and testing/revising and additional testing of the revised models.
In his research on identifying highly competent managers, McClelland's (1998) frustration with the low predictive accuracies of models from MRA lead him to construct algorithms using configurations of cases in the top quintiles across 5–7 variables. Predictive validity (accuracy) is a separate issue from fit validity (accuracy). Fit validity is the “coefficient of determination” (R2) output on testing an empirical model on the same set of data from which the model is constructed. Predictive validity is testing the model with empirical cases from a second sample. Gigerenzer and Brighton (2009) report that empirical models from MRA have higher fit validities than algorithm models but models from algorithms have higher predictive validities than models from MRA. Regression models over-determine—they use all available information in the data—in comparison to algorithms. Algorithms’ use of less information produces more predictive accuracy than MRA models. McClelland (1998) created “simple heuristics that make us smart”—an expression Gigerenzer and colleagues crafted as a title of one of their books (Gigerenzer, Todd, & the ABC Research Group, 2000). McClelland constructed an algorithm (i.e., a smarts-generating heuristic) by building screens identifying managers that were in the top quintiles for all five (or seven) antecedent variables. He then asked two questions: (1) Does this screening model accurately identify exceptionally competent managers (“exceptionally competent” was measured on an eighth variable)? (2) If yes, he used the screening model in attempting to identify exceptionally competent managers in a second sample of managers—does the model predict exceptionally competent managers? While his models from MRA performed poorly, McClelland (1998) reported high success (high predictive validity) for his screening models. While McClelland's (1998) findings have received much attention (1014 citations at Google.com/scholar by July 2017), his construction of algorithms has been ignored widely.
Because of a convergence of forces (e.g., Armstrong, 2012; Hubbard, 2016; publications of articles using algorithms in elite ranking journals, the introduction of complexity theory in management theory), Woodside (2016b) suggests the occurrence of a true, paradigm shift, tipping-point in the late teen-years of the 21st century—causing a shift-away from NHST and MRA to SPOT and algorithms. Krauss, Ribeiro-Soriano, and Schüssler (2018) and Roig-Tierno, Gonzalez-Cruz, and Llopis-Martinez (2017) provide evidence on the present locations (i.e., bibliographic reviews of articles in journals) and magnitude of this paradigm shift.
The present study provides substantial support for the applicability of complexity theory tenets in strategic management. For achieving substantial results, applications of complexity theory in strategic management requires shifting away from MRA and NHST to algorithms and SPOT—an embrace of new theory and analytics (cf. Misangyi et al., 2016; Woodside, 2014). The study of outcomes-in-contexts such as the four-corner analyses in the present study, along with constructing and testing asymmetric models vis “computing with words” and fsQCA.com software, are means to achieve the richness necessary for achieving requisite variety. Thus, as Weick (2007) proclaims, “In other words, richness has power but we are not powerless to evoke it.”
While harsh to read, but as Ziliak and McCloskey (2008) and others (e.g., Armstrong, 2012; Hubbard, 2016) confirm, most studies reporting MRA empirical models offer more rubbish than substance. The use of such harsh assessments may be necessary in the near term to overcome the powerful forces of inertia and resistance that arise to attack superior theory and analytics. However, harsh statements are likely to have scant impact on overcoming the powerful forces against superior new theory and analytics (Armstrong & Green, 2007; Hubbard, 2016; and especially Barber, 1961). For example, Hubbard (2016, p. 231) reviews Schmidt's (1996) assessment of the protests of faculty members on dropping the use of NHST. “They did not claim that these new methods were erroneous, but were concerned their graduate students would not be able to publish their work unless it used statistical significance testing.” Given that NHST is integral to research in management and marketing textbooks, faculty members teaching these course frequently express the view, “I can’t change just because it's wrong!” (Source's name withheld by request.)
However, a few researchers offer strategies to break-through the barriers preventing the reporting of complexity theory applications and algorithms. Gigerenzer and his colleagues and others (Ferguson, Megehee, & Woodside, 2017; Frösén, Luoma, Jaakkola, Tikkanen, & Aspara, 2016; McClelland, 1998; Montgomery, 1975; Ordanini, Parasuraman, & Rubera, 2014) include two sets of findings—symmetric (e.g., MRA) and asymmetric (algorithms) and do so usually without resorting to harsh criticism about the NHST analytics and findings. Such dual theory and analytic presentations will likely continue into the third decade of current century. “The trick to publishing one's work is to make the submission appear to be different, but certainly not too different” (Hubbard, 2016, p. 241). Or, report how your study's MRA and NHST findings complement the existing published literature and your algorithm and SPOT findings provide additional information and contributions to theory and practice.
LimitationsThe present study does not include a report on the predictive validities of the algorithm or the MRA model. At the very least, predictive validations should be done by dividing the cases for each nation into two sub-samples and constructing models for each sub-sample. The models should be the same or the tests in using the model from sub-sample A to predict the scores of outcomes for cases on sub-sample B should achieve high accuracies, and vice versa. Examples of such testing are available in the relevant literature (e.g., Brenes, Ciravegna, & Woodside, 2016). Predictive validation can include testing models constructed and found useful for firms in one nation on samples of firms in additional countries. The present study is limited to firms in two nations. Additional research would be helpful for testing the generalizability and the predictive validities of the models appearing in the present study. The present study does not include predictive validity findings mainly due to space limitations and the expository focus of this essay on embracing complexity theory and analysis by algorithms.
Additional limitations include the reliance on survey data of fixed-point scales with one respondent per firm. The mushy nature of fixed-point surveys and lack of confirmation by second respondents per firm limit the value of information extracted from the models. Field surveys incorporating interviews of three persons per firm and presenting separate models for sub-samples of executives who agree versus disagree in their responses within firms is possible—the findings are strikingly differently among samples for executives who provide the same versus different answers to questions (Cheng, Chang, & Li, 2013). Mintzberg and Campbell (1979) and Woodside (2016a) direct attention to the mushy nature of fixed-point survey questions. Valid attempts to overcome the low amount of substance of 1–5 or 1–7 scaled responses likely requires making a trade-off of large samples (n≥100) with self-report data to a small number of cases (n≤30) with direct-observation data.
ConclusionEmbracing complexity theory, creating four-corner outcomes-in-contexts, explicitly recognizing the occurrence of cases of anomalies to main effects, constructing asymmetric algorithm versus symmetric linear models to explain and predict each corner, and testing for substantive findings by SPOT rather than using NHST are beneficial steps forward in research in strategic management and innovation and knowledge. The pervasive hold of the current dominant logic of testing and reporting the independent sizes of impact of independent variables on a dependent variable and the bad science practice of relying on NSHT will end—possibly before 2030. The long list of brilliant contributions in configurations of theory, method, and findings by J. Scott Armstrong, Gerd Gigerenzer, David C. McClelland, Karl E. Weick, and Lotfi A. Zadeh deserve special recognition and the reading of their contributions by new scholars in the coming decades.
The authors thank the research team in Finland and Hungary for providing the data for the reanalysis the present study describes. Members of the research team at Eastern Finland University include Tommi Laukkanen, Suku Hirvonen, and Helen Reijonen. Gábor Nagy, INSEEC, Paris, headed data collection in Hungary.