


The number of innovation studies with a management perspective has grown considerably over the last 25 years. This study identified the universities that are most productive and influential in innovation research. The leading innovation research journals were also studied individually to identify the most productive universities for each journal. Data from the Web of Science were analyzed. Studies that were published between 1989 and 2013 were filtered first by the keyword “innovation” and second by 18 management-related research areas. The results indicate that US universities are the most productive and influential because they account for the most publications with a high number of citations and high h-index. Following advances in the productivity of numerous European journals, however, universities from the UK and the Netherlands are the most involved in publishing in journals that specialize in innovation research.
Una de las disciplinas que ha mostrado mayor crecimiento en los últimos 25 años es la investigación científica sobre innovación bajo una perspectiva de gestión. El objetivo de este estudio es identificar las universidades más productivas e influyentes en la investigación sobre innovación. Las principales revistas en el campo también se estudian individualmente identificando las universidades más productivas en cada una de las revistas. Los datos obtenidos son de la Web of Science, filtrando primero por la palabra clave “innovation” entre los años de 1989 y 2013 y el segundo filtrado por dieciocho áreas de investigación de WoS relacionadas con la perspectiva de gestión. Nuestros resultados indican que las universidades de los Estados Unidos son las más productivas e influyentes, dado el mayor número de publicaciones que muestran mayores citas y mayor índice h. Sin embargo, ante los avances en la productividad de un gran número de revistas europeas, las universidades británicas y holandesas aparecen como las más implicadas en la publicación de revistas más especializadas en investigación sobre innovación.
Many scholars, especially in recent decades, have focused on innovation research, confirming a substantial growth in the discipline (Chen, Damanpour, & Reilly, 2010). This is demonstrated not only by the quantity of items published daily on the matter, but also by the number of new research centers that are appearing. These centers bring together specialists looking to evaluate deeper the explanatory factors of innovative business development (Cancino, Merigó, & Palacios-Marqués, 2015; Fagerberg, Fosaas, & Sapprasert, 2012).
Insofar as the number of publications on innovation continue to grow, it becomes necessary to investigate more about who the most productive and influential researchers are, and identify the major journals, and universities that are leading the development in this discipline. While some studies on this matter have been developed (Fagerberg et al., 2012; Linton, 2004; Shafique, 2013; Yang & Tao, 2012) not all explain which universities are investigating more on innovation.
In this paper we analyze deeper to identify the top 100 most influential and productive universities worldwide in innovation research, and at the same time analyze which universities are publishing most in journals specialized in innovation. To achieve this, we use bibliometric analysis (Broadus, 1987; Pritchard, 1969) in order to quantitatively analyze the bibliographic material developed by various universities in innovation research between 1989 and 2013. We obtained the data by considering all articles published in present academic journals in the Web of Science (WoS), first filtering by keyword innovation, second for the time period between 1989 and 2013, and third filtering by eighteen research areas of WoS related with managerial perspective, presenting the information with the university affiliation of the authors.
The results of the study show that USA and UK universities are the most productive and influential institutions in innovation research. In particular, American universities excel in the ranking representing more than eighty percent of the papers published on the subject. This is consistent with other rankings of the best universities in economics and business (QS, Shanghai ARWU). Also, the study analyzed the leading universities in seven specialized journals that are very influential in innovation research and some other leading management journals. While there are many European universities presenting an important advancement in the number of publications, particularly given that the establishment of European journals specializing in innovation research, American universities appear in the first places publishing in leading management journals. Clearly, the discipline of innovation is one that is drawing more interest among many researchers in the world, therefore explaining its rapid growth.
The rest of the article is as follows. “Literature review” section shows the literature review about innovation studies. Methods section briefly reviews the bibliometric methods. Results section presents the publication evolution by universities, the citation structure and the university analysis. Conclusions section summarizes the main findings and conclusions of the study.
Literature reviewFor many decades, bibliometric studies have been very common in literature, due to its state of art contribution in making certain areas of interest known. In order to understand the relevance of these studies, diverse definitions of the concept bibliometrics can be found. According to Pritchard (1969), it is a method of applying mathematics and statistics to the media of written communication in order to understand the nature and course of development of a discipline. Also, Broadus (1987) states that bibliometrics is the quantitative study of physically published units, or bibliographic units, or surrogates of either. More simply Norton (2001) defines bibliometrics as the measurement of texts and information. Furthermore, in the last few years new uses have been given to bibliometrics. According to Daim, Rueda, Martin, and Gerdsri (2006), it helps to explore, organize and analyze large amounts of historical data helping to identify hidden patterns that may help researchers in the decision making process.
Several disciplines on economics and management have used bibliometric studies, to either help us understand the data previously analyzed or show us possible hidden patterns that could be very interesting to address (Bonilla, Merigó, & Torres-Abad, 2015; Carvalho, Fleury, & Lopes, 2013; Chun-Hao & Jian-Min, 2012; Neely, 2005; Wagstaff & Culyer, 2012). Focusing on innovation research, and given that scholarly literature on innovation is now rapidly growing, it is possible to find some studies that have developed analysis through bibliometric methodologies (Martin, 2012). Fagerberg and Verspagen (2009) show that there are several thousand scholars worldwide that identify with innovation studies. The field has long passed the stage of an invisible college and now the field consists of a large number of groups of interacting scholars. In this sense, they show that a core literature in innovation studies has emerged, centered around a small number of leading academics.
One of the most recent works about bibliometrics on innovation studies belongs to Fagerberg et al. (2012). Among its results, this paper shows that a sizeable quantity of literature on innovation has developed, mostly from the 1950s onwards, with a particularly strong growth in recent years. In which, it is possible to find three stages in the evolution of the field. The first stage, up to 1970, constitutes the early childhood of the studies on innovation, mainly focused on the study of economic and sociologic aspects, where there is a limited interaction with other fields. The second phase, after 1970 approximately, was developed through the work of a limited number of researchers from research centers in Stanford, Yale and Sussex (Dosi, Malerba, Ramello, & Silva, 2006). According to Fagerberg et al. (2012), a number of important contributions to the core literature emerged during the 1970s and 1980s that developed to shape the cognitive platforms of researchers in innovation for years to come. In this second phase, a distinctive characteristic of innovation studies was a strong emphasis on multi and inter-disciplinarity, not only with regard to the social sciences, but also in relation to other parts of the scientific world such as engineering science. The third phase referred to by Fagerberg et al. (2012) is called the mature phase. In this phase, specialized professional associations were created and were involved in the development of innovation discipline (created in 1986; created in 1987). Among the most influential scholars in the discipline, there are outstanding works from (on the basis of their total contributions as assessed by the experts, adjusting for co-authorship): R. Nelson, C. Freeman, N. Rosenberg, J.A. Schumpeter, M. Porter, Z. Griliches, E. Von Hippel, B-A. Lundvall, K. Pavitt, A.D. Chandler, among others.
Finally, different studies on innovation are currently under development, which are addressing a variety of problems, the particularities of regions and its multidisciplinary nature (Ball & Rigby, 2006; Thieme, 2007; Yang & Tao, 2012). Some examples are those developed by Seol and Park (2008), who present an investigation of the knowledge sources of Korean innovation studies using citation analysis. At a country level, Rafols, Leydesdorff, O’Hare1, Nightingale, and Stirling (2012) conducted a bibliometric study to compare the degree of inter-disciplinarity and the research performance of a number of innovation study units with that of leading business and management schools in the UK. Also Linton (2004) identified the centers of active research on the management of technology and innovation through the use of a publication-based study. This paper determined that schools with capabilities in innovation research are distributed across the world. Yang and Tao (2012) investigated general topics that have been studied and identify as the most popular research topics in the field of innovation management. In particular, they developed a bibliometric analyses to find the world's top 10 innovation management universities.
With the aspiration of expanding on the previous studies, and increasing the number of universities studied, in this paper we hope to contribute to the literature analyzing the productivity and the influence of the top 100 universities that do the most research on innovation, analyzing not only the universities from USA, but also looking at universities throughout the world.
MethodsAccording to Broadus (1987), bibliometrics is a research field that quantitatively studies bibliographic material, providing a general overview of a research field according to a wide range of indicators (publications, citations, h-index, etc.). Some studies focus on the number of publications, as this measures the author's or university's productivity (Trieschmann, Dennis, Northcraft, & Niemi, 2000). Podsakoff, MacKenzie, Podsakoff, and Bachrach (2008) argue that citation analysis is the optimal way of evaluating research because it measures the influence of a set of articles written by an author or a university. In addition, the h-index (Hirsch, 2005) is an indicator which combines articles with citations, indicating the number of studies X that have received X or more citations. For example, if a set of publications have an h-index of 10, inside the set, there are 10 articles that have received 10 citations or more; but there are not 11 studies or more with at least 11 citations.
Bibliometric studies – by means of number of publications, citation or h-index analysis – are becoming very popular in the literature, especially due to the development of specialized databases, such as Web of Science (WoS), which greatly facilitate the acquisition of research information (Merigó, Gil-Lafuente, & Yager, 2015).
The WoS is the database we used to collect the information on innovation research at universities. Currently, WoS includes more than 50,000,000 articles classified into roughly 250 categories and 150 research areas.
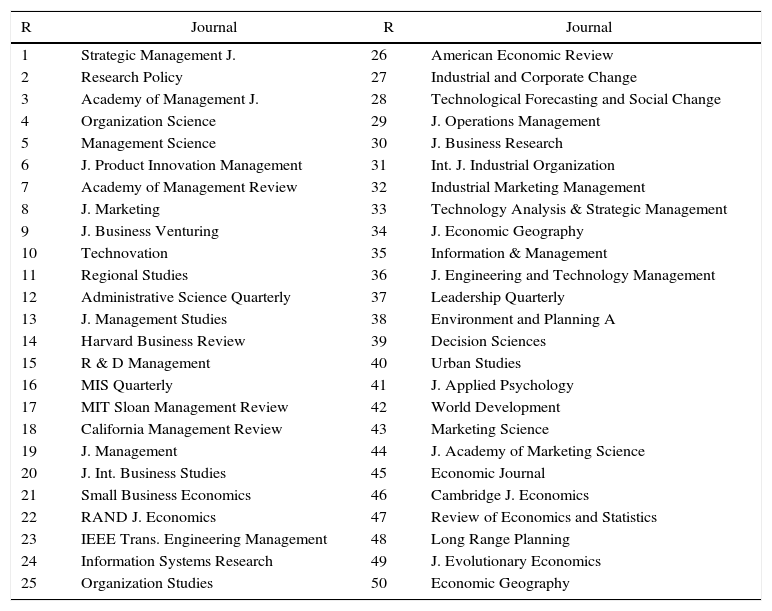
The information for this paper was collected between March and April of 2015. The data was obtained by considering all articles published in academic journals presently in WoS. We first filtered by keyword innovation, second by the time period of 1989–2013, third filtering by eighteen research areas of WoS related with managerial perspective (Business & Economics, Public Administration, Government & Law, Geography, Urban Studies, Area Studies, Sociology, History and Philosophy of Science, Social Work, Social Issues, Behavioral Sciences, Asian Studies, Social Sciences and Other Topics, Transportation, Operations Research & Management Science, and Computer Science), and presented the information according to university affiliation of the authors of each article. According to Cancino et al. (2015) there are many journals that publish papers in innovation research. Table 1 presents a list with the fifty journals with the highest h-index in innovation research.
Most influential journals in innovation research.
| R | Journal | R | Journal |
|---|---|---|---|
| 1 | Strategic Management J. | 26 | American Economic Review |
| 2 | Research Policy | 27 | Industrial and Corporate Change |
| 3 | Academy of Management J. | 28 | Technological Forecasting and Social Change |
| 4 | Organization Science | 29 | J. Operations Management |
| 5 | Management Science | 30 | J. Business Research |
| 6 | J. Product Innovation Management | 31 | Int. J. Industrial Organization |
| 7 | Academy of Management Review | 32 | Industrial Marketing Management |
| 8 | J. Marketing | 33 | Technology Analysis & Strategic Management |
| 9 | J. Business Venturing | 34 | J. Economic Geography |
| 10 | Technovation | 35 | Information & Management |
| 11 | Regional Studies | 36 | J. Engineering and Technology Management |
| 12 | Administrative Science Quarterly | 37 | Leadership Quarterly |
| 13 | J. Management Studies | 38 | Environment and Planning A |
| 14 | Harvard Business Review | 39 | Decision Sciences |
| 15 | R & D Management | 40 | Urban Studies |
| 16 | MIS Quarterly | 41 | J. Applied Psychology |
| 17 | MIT Sloan Management Review | 42 | World Development |
| 18 | California Management Review | 43 | Marketing Science |
| 19 | J. Management | 44 | J. Academy of Marketing Science |
| 20 | J. Int. Business Studies | 45 | Economic Journal |
| 21 | Small Business Economics | 46 | Cambridge J. Economics |
| 22 | RAND J. Economics | 47 | Review of Economics and Statistics |
| 23 | IEEE Trans. Engineering Management | 48 | Long Range Planning |
| 24 | Information Systems Research | 49 | J. Evolutionary Economics |
| 25 | Organization Studies | 50 | Economic Geography |
The requirement to be considered in the ranking is to have at least 80 papers on innovation research and an h-index of 20.
Source: Based on Cancino et al. (2015).
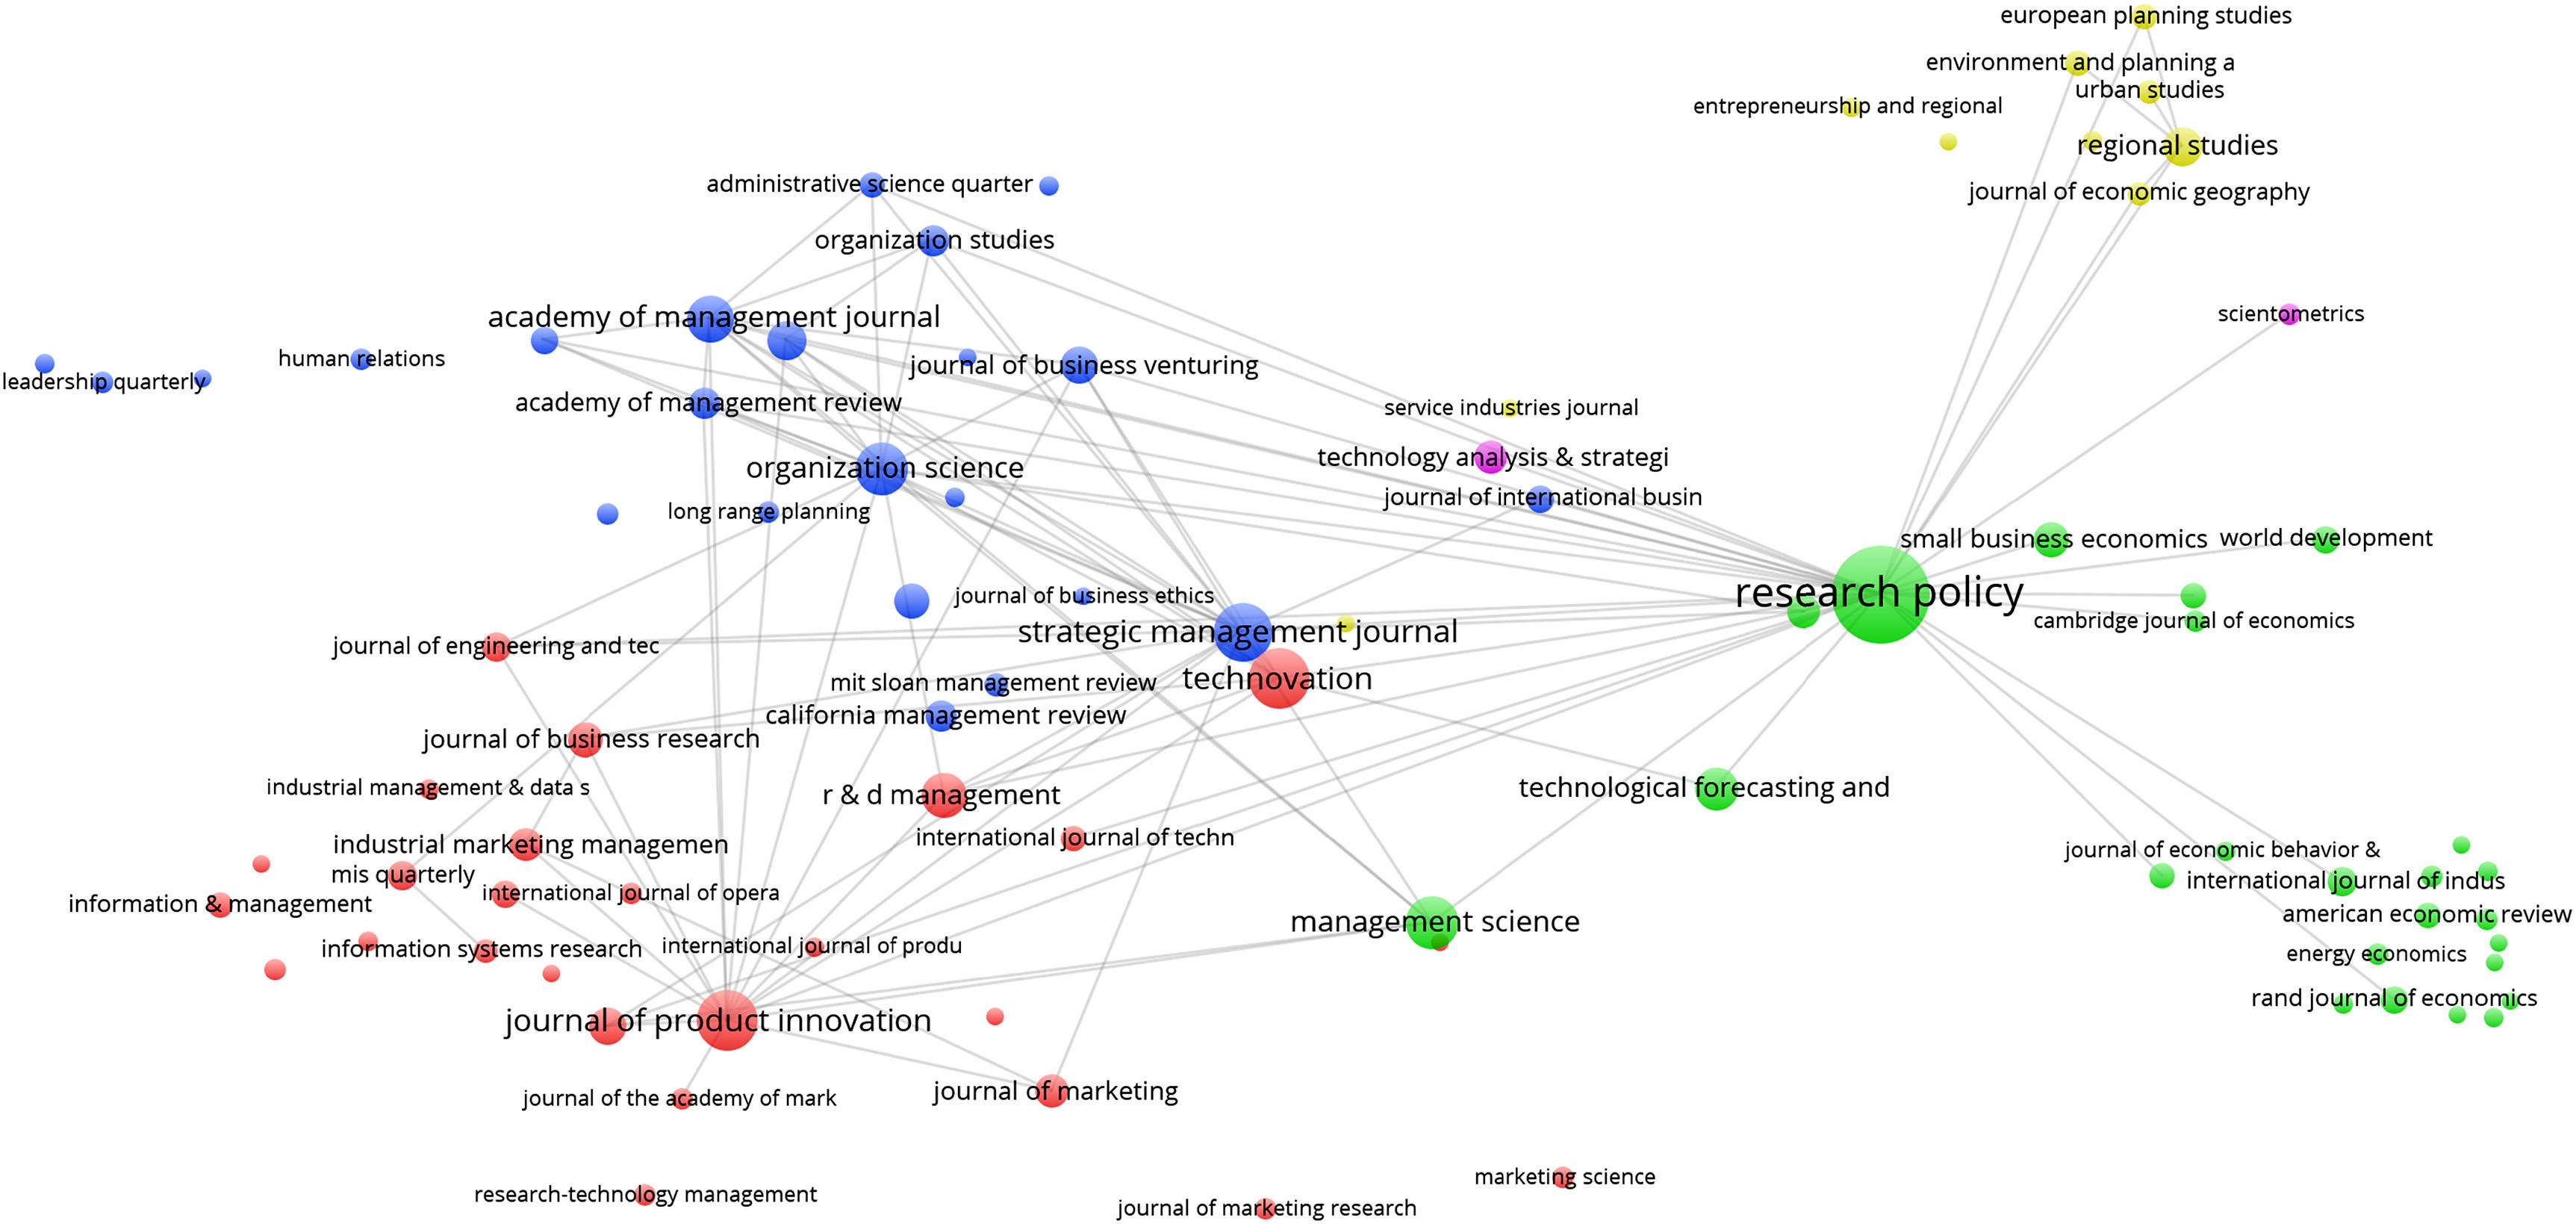
If we analyze the citation structure of the most productive and influential innovation research journals using bibliographic coupling (Martyn, 1964) methodology (see Fig. 1), we can see that Research Policy, Strategic Management Journal, Technovation, Journal of Product Innovation Management and Organization Science are the most relevant journals with a very huge bibliographic network. The most productive journals have the highest influence in the analysis because they have more articles and therefore they also generate more citations. By defining the top 100 universities that publish the most about innovation topics in present journals in WoS we came up with 18806 articles published between 1989 and 2013, comprising a total of 716955 citations.

Moreover, the study takes into consideration the analysis of publications, citations and h-index of the top 100 universities mentioned above, in relation to that which was published in the 7 journals most specialized in innovation research (see Table 2). These specialized journals are characterized by having more than 90% of papers published in them dealing with innovation topics. This will not only allow us to identify the most influential universities in this field but also those that are publishing most about innovation research.
List of top 7 journal in innovation research according TPI.
| Abbreviation | Journal name |
|---|---|
| RP | Research Policy |
| IJTM | International Journal of Technology Management |
| TECH | Technovation |
| TFSC | Technological Forecasting and Social Change |
| JPIM | Journal of Product Innovation Management |
| TASM | Technology Analysis & Strategic Management |
| RDM | R&D Management |
TPI=total number of publications in innovation research.
Source: Based on Cancino et al. (2015)
This section presents the results of the paper. First, the study analyzed the leading research universities in innovation from 1989 to 2013 followed by the most productive universities based on publication in the top-7 innovation research journals. Second, the paper presented an analysis of leading universities by comparing the results obtained from previous studies. Third, the article analyzed the most influential universities in innovation research by periods of time. Fourth, the study presented a bibliographic coupling and co-authorship analysis between the most productive and influential universities in innovation research. Finally, the study analyze the leading universities in seven specialized journals that are very influential in innovation research and some other leading management journals.
Leading universities in innovation researchThere are many universities publishing papers about innovation research. Among them all, within the period of 1989–2013, we can single out the most important in terms of their h-index (HI), the most productive in terms of the total number of papers published on the subject (TPI), and finally the most influential universities based on the total citations their publications are receiving (TCI).
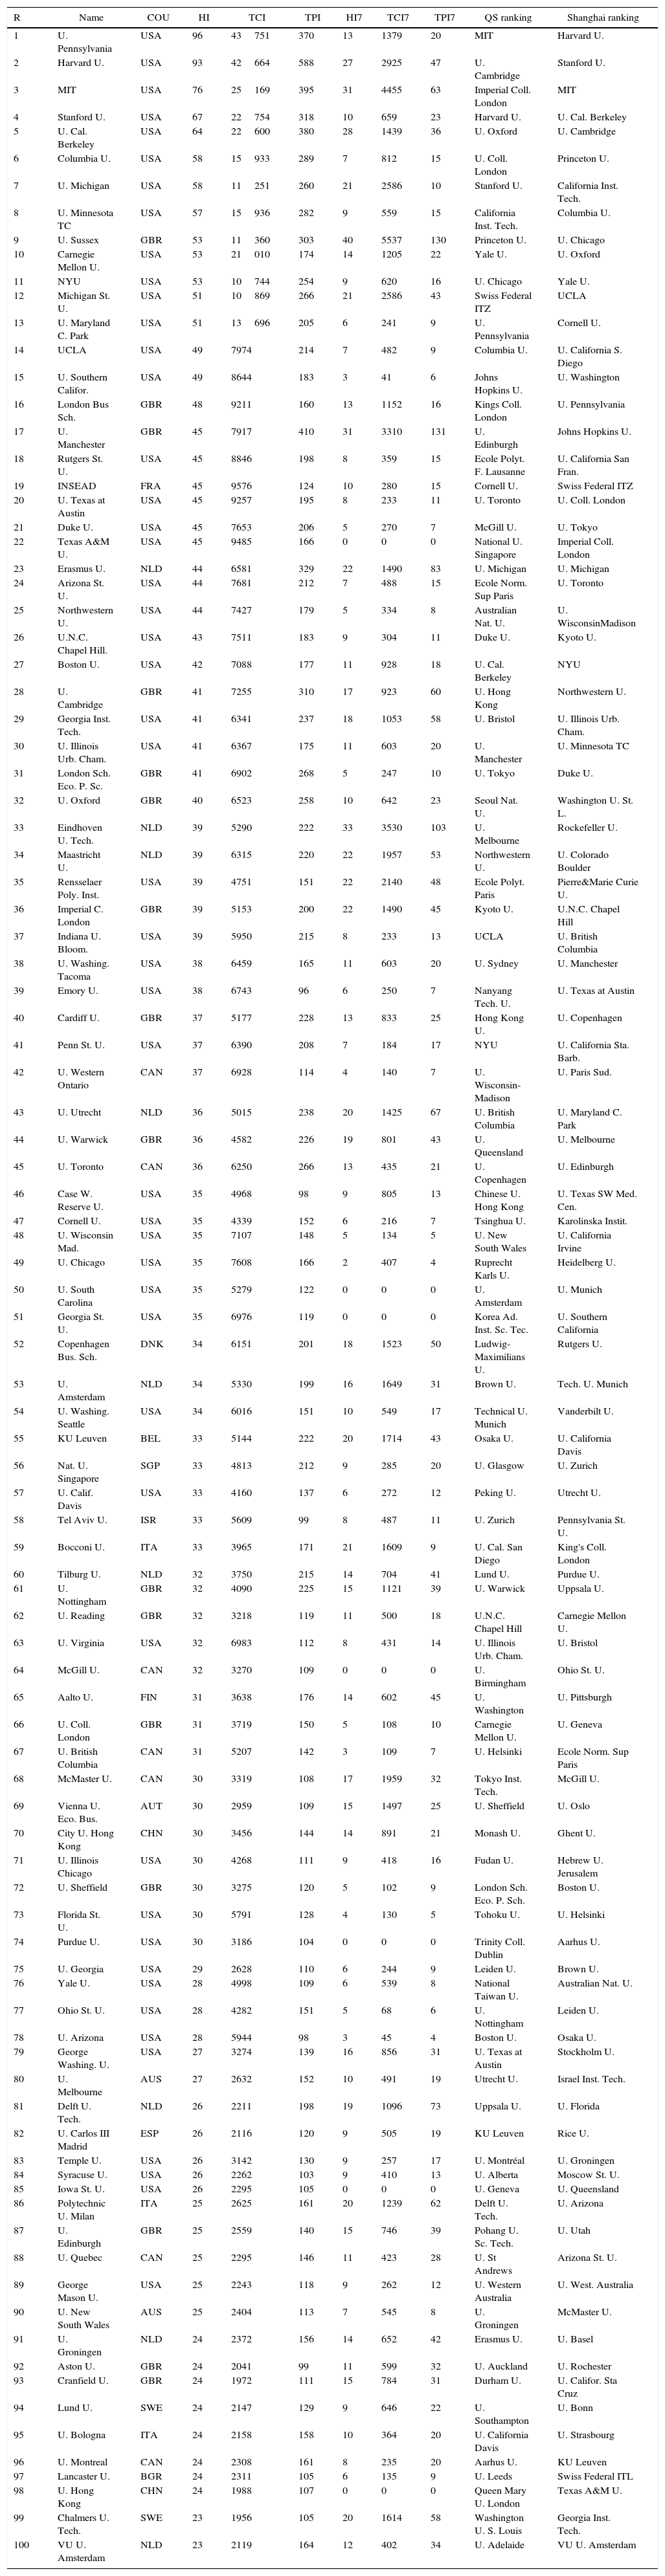
Table 3 shows three important analysis to consider: 1) presents the HI, TCI and TPI indicators for the 100 universities with the highest h-index in innovation research; 2) presents HI7, TCI7 and TPI7 indicators for the 100 universities that publish in the 7 journals specialized in innovation research (see Table 2); and Table 3) compares the ranking of universities on their productivity in innovation research in relation to two other international rankings of universities: QS and Shanghai Ranking.
Most influential universities in innovation research.
| R | Name | COU | HI | TCI | TPI | HI7 | TCI7 | TPI7 | QS ranking | Shanghai ranking |
|---|---|---|---|---|---|---|---|---|---|---|
| 1 | U. Pennsylvania | USA | 96 | 43751 | 370 | 13 | 1379 | 20 | MIT | Harvard U. |
| 2 | Harvard U. | USA | 93 | 42664 | 588 | 27 | 2925 | 47 | U. Cambridge | Stanford U. |
| 3 | MIT | USA | 76 | 25169 | 395 | 31 | 4455 | 63 | Imperial Coll. London | MIT |
| 4 | Stanford U. | USA | 67 | 22754 | 318 | 10 | 659 | 23 | Harvard U. | U. Cal. Berkeley |
| 5 | U. Cal. Berkeley | USA | 64 | 22600 | 380 | 28 | 1439 | 36 | U. Oxford | U. Cambridge |
| 6 | Columbia U. | USA | 58 | 15933 | 289 | 7 | 812 | 15 | U. Coll. London | Princeton U. |
| 7 | U. Michigan | USA | 58 | 11251 | 260 | 21 | 2586 | 10 | Stanford U. | California Inst. Tech. |
| 8 | U. Minnesota TC | USA | 57 | 15936 | 282 | 9 | 559 | 15 | California Inst. Tech. | Columbia U. |
| 9 | U. Sussex | GBR | 53 | 11360 | 303 | 40 | 5537 | 130 | Princeton U. | U. Chicago |
| 10 | Carnegie Mellon U. | USA | 53 | 21010 | 174 | 14 | 1205 | 22 | Yale U. | U. Oxford |
| 11 | NYU | USA | 53 | 10744 | 254 | 9 | 620 | 16 | U. Chicago | Yale U. |
| 12 | Michigan St. U. | USA | 51 | 10869 | 266 | 21 | 2586 | 43 | Swiss Federal ITZ | UCLA |
| 13 | U. Maryland C. Park | USA | 51 | 13696 | 205 | 6 | 241 | 9 | U. Pennsylvania | Cornell U. |
| 14 | UCLA | USA | 49 | 7974 | 214 | 7 | 482 | 9 | Columbia U. | U. California S. Diego |
| 15 | U. Southern Califor. | USA | 49 | 8644 | 183 | 3 | 41 | 6 | Johns Hopkins U. | U. Washington |
| 16 | London Bus Sch. | GBR | 48 | 9211 | 160 | 13 | 1152 | 16 | Kings Coll. London | U. Pennsylvania |
| 17 | U. Manchester | GBR | 45 | 7917 | 410 | 31 | 3310 | 131 | U. Edinburgh | Johns Hopkins U. |
| 18 | Rutgers St. U. | USA | 45 | 8846 | 198 | 8 | 359 | 15 | Ecole Polyt. F. Lausanne | U. California San Fran. |
| 19 | INSEAD | FRA | 45 | 9576 | 124 | 10 | 280 | 15 | Cornell U. | Swiss Federal ITZ |
| 20 | U. Texas at Austin | USA | 45 | 9257 | 195 | 8 | 233 | 11 | U. Toronto | U. Coll. London |
| 21 | Duke U. | USA | 45 | 7653 | 206 | 5 | 270 | 7 | McGill U. | U. Tokyo |
| 22 | Texas A&M U. | USA | 45 | 9485 | 166 | 0 | 0 | 0 | National U. Singapore | Imperial Coll. London |
| 23 | Erasmus U. | NLD | 44 | 6581 | 329 | 22 | 1490 | 83 | U. Michigan | U. Michigan |
| 24 | Arizona St. U. | USA | 44 | 7681 | 212 | 7 | 488 | 15 | Ecole Norm. Sup Paris | U. Toronto |
| 25 | Northwestern U. | USA | 44 | 7427 | 179 | 5 | 334 | 8 | Australian Nat. U. | U. WisconsinMadison |
| 26 | U.N.C. Chapel Hill. | USA | 43 | 7511 | 183 | 9 | 304 | 11 | Duke U. | Kyoto U. |
| 27 | Boston U. | USA | 42 | 7088 | 177 | 11 | 928 | 18 | U. Cal. Berkeley | NYU |
| 28 | U. Cambridge | GBR | 41 | 7255 | 310 | 17 | 923 | 60 | U. Hong Kong | Northwestern U. |
| 29 | Georgia Inst. Tech. | USA | 41 | 6341 | 237 | 18 | 1053 | 58 | U. Bristol | U. Illinois Urb. Cham. |
| 30 | U. Illinois Urb. Cham. | USA | 41 | 6367 | 175 | 11 | 603 | 20 | U. Manchester | U. Minnesota TC |
| 31 | London Sch. Eco. P. Sc. | GBR | 41 | 6902 | 268 | 5 | 247 | 10 | U. Tokyo | Duke U. |
| 32 | U. Oxford | GBR | 40 | 6523 | 258 | 10 | 642 | 23 | Seoul Nat. U. | Washington U. St. L. |
| 33 | Eindhoven U. Tech. | NLD | 39 | 5290 | 222 | 33 | 3530 | 103 | U. Melbourne | Rockefeller U. |
| 34 | Maastricht U. | NLD | 39 | 6315 | 220 | 22 | 1957 | 53 | Northwestern U. | U. Colorado Boulder |
| 35 | Rensselaer Poly. Inst. | USA | 39 | 4751 | 151 | 22 | 2140 | 48 | Ecole Polyt. Paris | Pierre&Marie Curie U. |
| 36 | Imperial C. London | GBR | 39 | 5153 | 200 | 22 | 1490 | 45 | Kyoto U. | U.N.C. Chapel Hill |
| 37 | Indiana U. Bloom. | USA | 39 | 5950 | 215 | 8 | 233 | 13 | UCLA | U. British Columbia |
| 38 | U. Washing. Tacoma | USA | 38 | 6459 | 165 | 11 | 603 | 20 | U. Sydney | U. Manchester |
| 39 | Emory U. | USA | 38 | 6743 | 96 | 6 | 250 | 7 | Nanyang Tech. U. | U. Texas at Austin |
| 40 | Cardiff U. | GBR | 37 | 5177 | 228 | 13 | 833 | 25 | Hong Kong U. | U. Copenhagen |
| 41 | Penn St. U. | USA | 37 | 6390 | 208 | 7 | 184 | 17 | NYU | U. California Sta. Barb. |
| 42 | U. Western Ontario | CAN | 37 | 6928 | 114 | 4 | 140 | 7 | U. Wisconsin-Madison | U. Paris Sud. |
| 43 | U. Utrecht | NLD | 36 | 5015 | 238 | 20 | 1425 | 67 | U. British Columbia | U. Maryland C. Park |
| 44 | U. Warwick | GBR | 36 | 4582 | 226 | 19 | 801 | 43 | U. Queensland | U. Melbourne |
| 45 | U. Toronto | CAN | 36 | 6250 | 266 | 13 | 435 | 21 | U. Copenhagen | U. Edinburgh |
| 46 | Case W. Reserve U. | USA | 35 | 4968 | 98 | 9 | 805 | 13 | Chinese U. Hong Kong | U. Texas SW Med. Cen. |
| 47 | Cornell U. | USA | 35 | 4339 | 152 | 6 | 216 | 7 | Tsinghua U. | Karolinska Instit. |
| 48 | U. Wisconsin Mad. | USA | 35 | 7107 | 148 | 5 | 134 | 5 | U. New South Wales | U. California Irvine |
| 49 | U. Chicago | USA | 35 | 7608 | 166 | 2 | 407 | 4 | Ruprecht Karls U. | Heidelberg U. |
| 50 | U. South Carolina | USA | 35 | 5279 | 122 | 0 | 0 | 0 | U. Amsterdam | U. Munich |
| 51 | Georgia St. U. | USA | 35 | 6976 | 119 | 0 | 0 | 0 | Korea Ad. Inst. Sc. Tec. | U. Southern California |
| 52 | Copenhagen Bus. Sch. | DNK | 34 | 6151 | 201 | 18 | 1523 | 50 | Ludwig-Maximilians U. | Rutgers U. |
| 53 | U. Amsterdam | NLD | 34 | 5330 | 199 | 16 | 1649 | 31 | Brown U. | Tech. U. Munich |
| 54 | U. Washing. Seattle | USA | 34 | 6016 | 151 | 10 | 549 | 17 | Technical U. Munich | Vanderbilt U. |
| 55 | KU Leuven | BEL | 33 | 5144 | 222 | 20 | 1714 | 43 | Osaka U. | U. California Davis |
| 56 | Nat. U. Singapore | SGP | 33 | 4813 | 212 | 9 | 285 | 20 | U. Glasgow | U. Zurich |
| 57 | U. Calif. Davis | USA | 33 | 4160 | 137 | 6 | 272 | 12 | Peking U. | Utrecht U. |
| 58 | Tel Aviv U. | ISR | 33 | 5609 | 99 | 8 | 487 | 11 | U. Zurich | Pennsylvania St. U. |
| 59 | Bocconi U. | ITA | 33 | 3965 | 171 | 21 | 1609 | 9 | U. Cal. San Diego | King's Coll. London |
| 60 | Tilburg U. | NLD | 32 | 3750 | 215 | 14 | 704 | 41 | Lund U. | Purdue U. |
| 61 | U. Nottingham | GBR | 32 | 4090 | 225 | 15 | 1121 | 39 | U. Warwick | Uppsala U. |
| 62 | U. Reading | GBR | 32 | 3218 | 119 | 11 | 500 | 18 | U.N.C. Chapel Hill | Carnegie Mellon U. |
| 63 | U. Virginia | USA | 32 | 6983 | 112 | 8 | 431 | 14 | U. Illinois Urb. Cham. | U. Bristol |
| 64 | McGill U. | CAN | 32 | 3270 | 109 | 0 | 0 | 0 | U. Birmingham | Ohio St. U. |
| 65 | Aalto U. | FIN | 31 | 3638 | 176 | 14 | 602 | 45 | U. Washington | U. Pittsburgh |
| 66 | U. Coll. London | GBR | 31 | 3719 | 150 | 5 | 108 | 10 | Carnegie Mellon U. | U. Geneva |
| 67 | U. British Columbia | CAN | 31 | 5207 | 142 | 3 | 109 | 7 | U. Helsinki | Ecole Norm. Sup Paris |
| 68 | McMaster U. | CAN | 30 | 3319 | 108 | 17 | 1959 | 32 | Tokyo Inst. Tech. | McGill U. |
| 69 | Vienna U. Eco. Bus. | AUT | 30 | 2959 | 109 | 15 | 1497 | 25 | U. Sheffield | U. Oslo |
| 70 | City U. Hong Kong | CHN | 30 | 3456 | 144 | 14 | 891 | 21 | Monash U. | Ghent U. |
| 71 | U. Illinois Chicago | USA | 30 | 4268 | 111 | 9 | 418 | 16 | Fudan U. | Hebrew U. Jerusalem |
| 72 | U. Sheffield | GBR | 30 | 3275 | 120 | 5 | 102 | 9 | London Sch. Eco. P. Sch. | Boston U. |
| 73 | Florida St. U. | USA | 30 | 5791 | 128 | 4 | 130 | 5 | Tohoku U. | U. Helsinki |
| 74 | Purdue U. | USA | 30 | 3186 | 104 | 0 | 0 | 0 | Trinity Coll. Dublin | Aarhus U. |
| 75 | U. Georgia | USA | 29 | 2628 | 110 | 6 | 244 | 9 | Leiden U. | Brown U. |
| 76 | Yale U. | USA | 28 | 4998 | 109 | 6 | 539 | 8 | National Taiwan U. | Australian Nat. U. |
| 77 | Ohio St. U. | USA | 28 | 4282 | 151 | 5 | 68 | 6 | U. Nottingham | Leiden U. |
| 78 | U. Arizona | USA | 28 | 5944 | 98 | 3 | 45 | 4 | Boston U. | Osaka U. |
| 79 | George Washing. U. | USA | 27 | 3274 | 139 | 16 | 856 | 31 | U. Texas at Austin | Stockholm U. |
| 80 | U. Melbourne | AUS | 27 | 2632 | 152 | 10 | 491 | 19 | Utrecht U. | Israel Inst. Tech. |
| 81 | Delft U. Tech. | NLD | 26 | 2211 | 198 | 19 | 1096 | 73 | Uppsala U. | U. Florida |
| 82 | U. Carlos III Madrid | ESP | 26 | 2116 | 120 | 9 | 505 | 19 | KU Leuven | Rice U. |
| 83 | Temple U. | USA | 26 | 3142 | 130 | 9 | 257 | 17 | U. Montréal | U. Groningen |
| 84 | Syracuse U. | USA | 26 | 2262 | 103 | 9 | 410 | 13 | U. Alberta | Moscow St. U. |
| 85 | Iowa St. U. | USA | 26 | 2295 | 105 | 0 | 0 | 0 | U. Geneva | U. Queensland |
| 86 | Polytechnic U. Milan | ITA | 25 | 2625 | 161 | 20 | 1239 | 62 | Delft U. Tech. | U. Arizona |
| 87 | U. Edinburgh | GBR | 25 | 2559 | 140 | 15 | 746 | 39 | Pohang U. Sc. Tech. | U. Utah |
| 88 | U. Quebec | CAN | 25 | 2295 | 146 | 11 | 423 | 28 | U. St Andrews | Arizona St. U. |
| 89 | George Mason U. | USA | 25 | 2243 | 118 | 9 | 262 | 12 | U. Western Australia | U. West. Australia |
| 90 | U. New South Wales | AUS | 25 | 2404 | 113 | 7 | 545 | 8 | U. Groningen | McMaster U. |
| 91 | U. Groningen | NLD | 24 | 2372 | 156 | 14 | 652 | 42 | Erasmus U. | U. Basel |
| 92 | Aston U. | GBR | 24 | 2041 | 99 | 11 | 599 | 32 | U. Auckland | U. Rochester |
| 93 | Cranfield U. | GBR | 24 | 1972 | 111 | 15 | 784 | 31 | Durham U. | U. Califor. Sta Cruz |
| 94 | Lund U. | SWE | 24 | 2147 | 129 | 9 | 646 | 22 | U. Southampton | U. Bonn |
| 95 | U. Bologna | ITA | 24 | 2158 | 158 | 10 | 364 | 20 | U. California Davis | U. Strasbourg |
| 96 | U. Montreal | CAN | 24 | 2308 | 161 | 8 | 235 | 20 | Aarhus U. | KU Leuven |
| 97 | Lancaster U. | BGR | 24 | 2311 | 105 | 6 | 135 | 9 | U. Leeds | Swiss Federal ITL |
| 98 | U. Hong Kong | CHN | 24 | 1988 | 107 | 0 | 0 | 0 | Queen Mary U. London | Texas A&M U. |
| 99 | Chalmers U. Tech. | SWE | 23 | 1956 | 105 | 20 | 1614 | 58 | Washington U. S. Louis | Georgia Inst. Tech. |
| 100 | VU U. Amsterdam | NLD | 23 | 2119 | 164 | 12 | 402 | 34 | U. Adelaide | VU U. Amsterdam |
Abbreviations: R=Rank; COU=Country; HI=h-index (only in innovation research); TPI and TCI=total number of publications and citations (only in innovation research). Countries abbreviations (According to Codes – ISO 3166). QS ranking: QS world university rankings 2015. Shanghai ranking: Academic Ranking of World Universities – ARWU 2015.
As can be seen in Table 3, the most influential institutions worldwide are mainly American, accompanied by some of the most prestigious universities in the UK. In fact, 54% of the top 100 universities are located in USA, 16% in UK, 8% in Netherlands, and 7% in Canada. The rest of the universities are mainly in Europe, with particular exceptions being the universities of Singapore, Israel and China.
If we look at the top 10 leading universities in the theme, ninety percent are American institutions, with the University of Sussex standing out as the only British university appearing at the top.
When we advance in our analysis to the top 20 leaders in innovation research universities, American institutions maintain a high percentage, with 16 of the 20 listed. With this group of universities 3 are now from the UK and 1 from France.
Of the top 50 universities in the ranking it can been seen that 34 are USA universities, followed by 9 from the UK, 4 from the Netherlands, 2 from Canada and finally 1 from France.
As for the number of citations, the first 26 ranking universities accumulate the same number of citations as the rest of the universities ranking, which explains the high impact it has on innovation research. However, in as much as productivity is concerned, only the sum of what was published in the first 40 universities equals the sum of that which is published by the rest of the universities. This implies that while the top universities are very influential in the field in terms of research innovation, they are not necessarily the ones publishing more articles on innovation research. Distinctive cases are certain universities in the UK and Netherlands such as U. Manchester, U. Cambridge and Erasmus U. Rotterdam, which although being highly productive, do not necessarily have the highest h-index. This may be because there are many, mainly European journals, that have specialized in innovation research and which publish numerous articles from mainly European universities.
If we analyze the information HI7, TCI7 and TPI7, referring to that published by the universities in the ranking and the 7 journals most specialized in innovation research (see Table 2), we see that the top 15 American universities, which are also part of the first in the ranking, represent only 15% of what is published in seven specialized journals and 25% of the citations in the same journals. This implies that as far as at the level of journals specialized in innovation research, the influence of American universities is not as strong as it is at the level of a global journal, with the universities in the UK and Netherlands being the most influential in specialized journals.
In Table 3 the last two columns show two of the most famous university rankings which rank according to various indicators. For example, the QS Ranking column shows the list of the 2015 QS World University Rankings. Likewise, the last column in Table 3 shows the Shanghai Ranking, also known as the Academic Ranking of World Universities – ARWU. The ranking of universities in this paper has some similarities as well as a few differences with the QS and Shanghai rankings. In terms of similarities, we see that the top 20 universities in innovation research also appear in important positions in the other two rankings. The most prestigious universities in the world, particularly located in the USA, are usually present in all of the university rankings. Even though they might not necessarily occupy the same location in the rankings, they still appear at the top. As for the differences, we see that after this group of highly recognized universities, QS and Shanghai rankings tend to look less like that presented in this paper. This is evident when we see that 50% of the present universities in Shanghai Ranking do not appear in our Innovation Research Ranking. In the case of QS Ranking 46% of universities do not appear. This may be due to the methodology used for selecting the universities, which in the case of ranking for this paper depends on the highest h-index, which is calculated by the papers published on innovation research by each university.
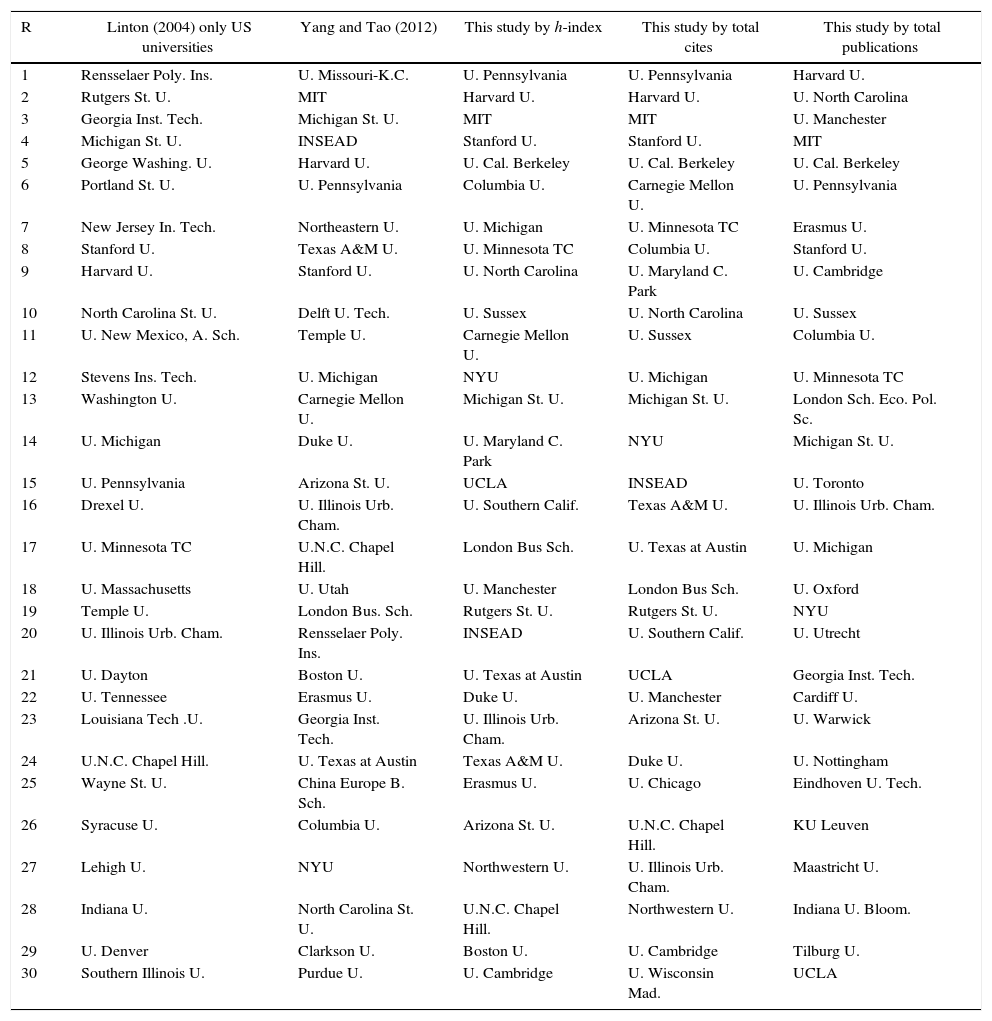
Comparative analysis of leading universities according to different rankingsEven though they use different methodologies, at least two other rankings of the influence of universities on innovation research can be found in the literature. The following Table 4 shows a comparison of the top 30 universities of each ranking as developed by Linton (2004) and Yang and Tao (2012) in relation to those presented in this paper (sorted by HI, TCI and TPI).
Comparative analysis of leading universities according to different rankings.
| R | Linton (2004) only US universities | Yang and Tao (2012) | This study by h-index | This study by total cites | This study by total publications |
|---|---|---|---|---|---|
| 1 | Rensselaer Poly. Ins. | U. Missouri-K.C. | U. Pennsylvania | U. Pennsylvania | Harvard U. |
| 2 | Rutgers St. U. | MIT | Harvard U. | Harvard U. | U. North Carolina |
| 3 | Georgia Inst. Tech. | Michigan St. U. | MIT | MIT | U. Manchester |
| 4 | Michigan St. U. | INSEAD | Stanford U. | Stanford U. | MIT |
| 5 | George Washing. U. | Harvard U. | U. Cal. Berkeley | U. Cal. Berkeley | U. Cal. Berkeley |
| 6 | Portland St. U. | U. Pennsylvania | Columbia U. | Carnegie Mellon U. | U. Pennsylvania |
| 7 | New Jersey In. Tech. | Northeastern U. | U. Michigan | U. Minnesota TC | Erasmus U. |
| 8 | Stanford U. | Texas A&M U. | U. Minnesota TC | Columbia U. | Stanford U. |
| 9 | Harvard U. | Stanford U. | U. North Carolina | U. Maryland C. Park | U. Cambridge |
| 10 | North Carolina St. U. | Delft U. Tech. | U. Sussex | U. North Carolina | U. Sussex |
| 11 | U. New Mexico, A. Sch. | Temple U. | Carnegie Mellon U. | U. Sussex | Columbia U. |
| 12 | Stevens Ins. Tech. | U. Michigan | NYU | U. Michigan | U. Minnesota TC |
| 13 | Washington U. | Carnegie Mellon U. | Michigan St. U. | Michigan St. U. | London Sch. Eco. Pol. Sc. |
| 14 | U. Michigan | Duke U. | U. Maryland C. Park | NYU | Michigan St. U. |
| 15 | U. Pennsylvania | Arizona St. U. | UCLA | INSEAD | U. Toronto |
| 16 | Drexel U. | U. Illinois Urb. Cham. | U. Southern Calif. | Texas A&M U. | U. Illinois Urb. Cham. |
| 17 | U. Minnesota TC | U.N.C. Chapel Hill. | London Bus Sch. | U. Texas at Austin | U. Michigan |
| 18 | U. Massachusetts | U. Utah | U. Manchester | London Bus Sch. | U. Oxford |
| 19 | Temple U. | London Bus. Sch. | Rutgers St. U. | Rutgers St. U. | NYU |
| 20 | U. Illinois Urb. Cham. | Rensselaer Poly. Ins. | INSEAD | U. Southern Calif. | U. Utrecht |
| 21 | U. Dayton | Boston U. | U. Texas at Austin | UCLA | Georgia Inst. Tech. |
| 22 | U. Tennessee | Erasmus U. | Duke U. | U. Manchester | Cardiff U. |
| 23 | Louisiana Tech .U. | Georgia Inst. Tech. | U. Illinois Urb. Cham. | Arizona St. U. | U. Warwick |
| 24 | U.N.C. Chapel Hill. | U. Texas at Austin | Texas A&M U. | Duke U. | U. Nottingham |
| 25 | Wayne St. U. | China Europe B. Sch. | Erasmus U. | U. Chicago | Eindhoven U. Tech. |
| 26 | Syracuse U. | Columbia U. | Arizona St. U. | U.N.C. Chapel Hill. | KU Leuven |
| 27 | Lehigh U. | NYU | Northwestern U. | U. Illinois Urb. Cham. | Maastricht U. |
| 28 | Indiana U. | North Carolina St. U. | U.N.C. Chapel Hill. | Northwestern U. | Indiana U. Bloom. |
| 29 | U. Denver | Clarkson U. | Boston U. | U. Cambridge | Tilburg U. |
| 30 | Southern Illinois U. | Purdue U. | U. Cambridge | U. Wisconsin Mad. | UCLA |
In general the results of our rankings, be they for the h-index, TCI or TPI, are more similar to Yang and Tao's list (2012) in comparison to Linton's list (2004). The first set coincides in two thirds of the institutions classified, while the second only matches with one in three universities in the list. As is to be expected to observe, in both cases there is no relationship in the position each university takes in the ranking. This may be due to several reasons. First, the work of Linton (2004) is much older than that of Yang and Tao, and in nearly 10 years, many universities have increased their efforts in publishing in areas of innovation. The rotation in the top 30 is also much higher. Second, Linton's list (2004) only considers American universities, leaving out of the ranking a number of internationally renowned universities, mainly from the UK and Netherlands. In this sense, it can be noted that the Yang and Tao's list is much more complete in classifying the top 30 research universities in innovation, as it assesses universities from around the world, without focusing solely on the US universities. Thus our rankings match best.
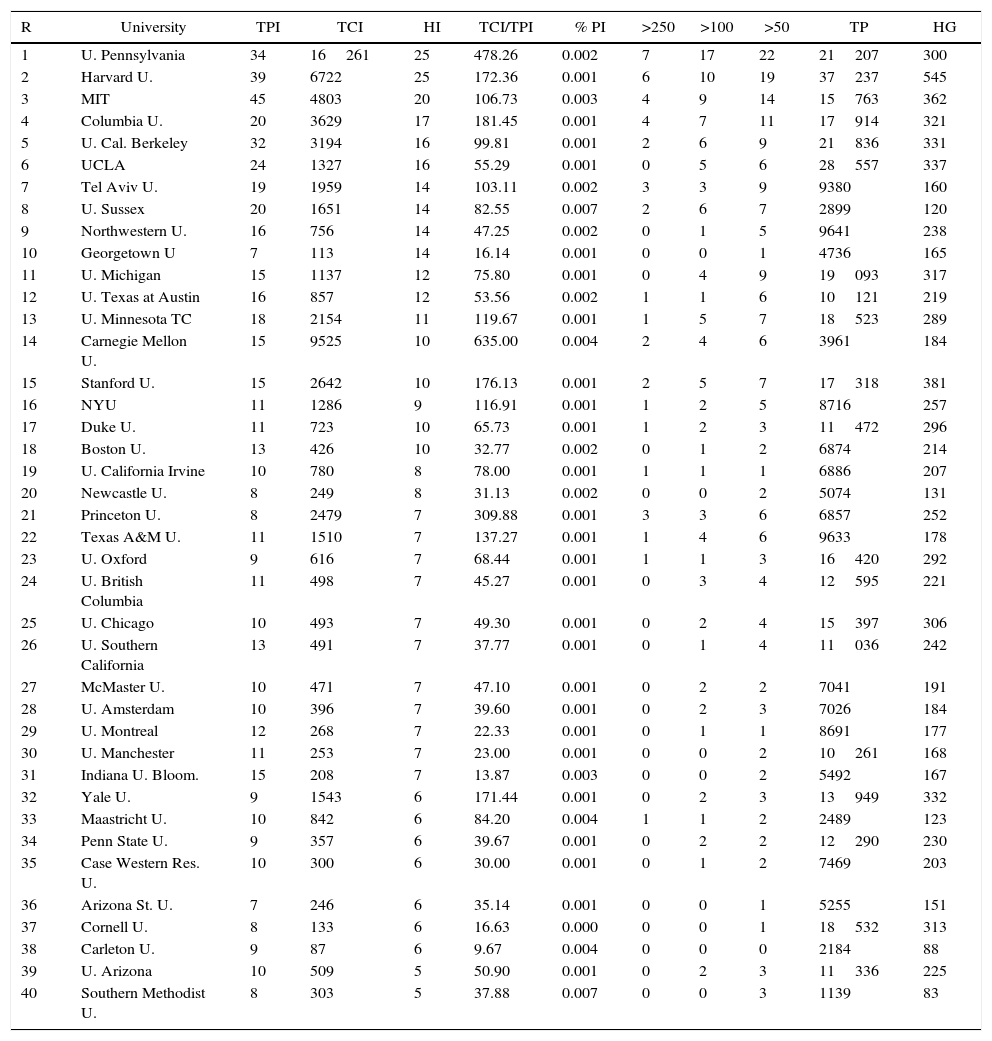
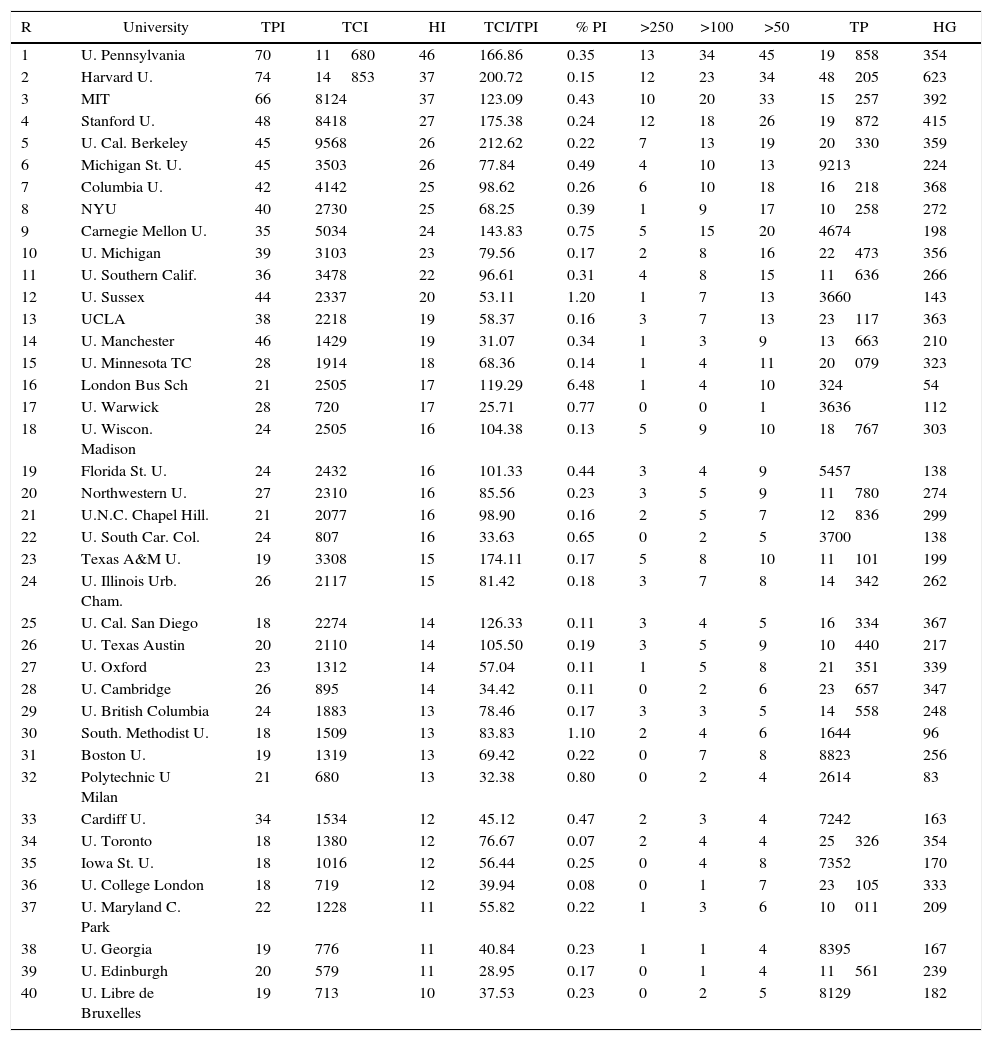
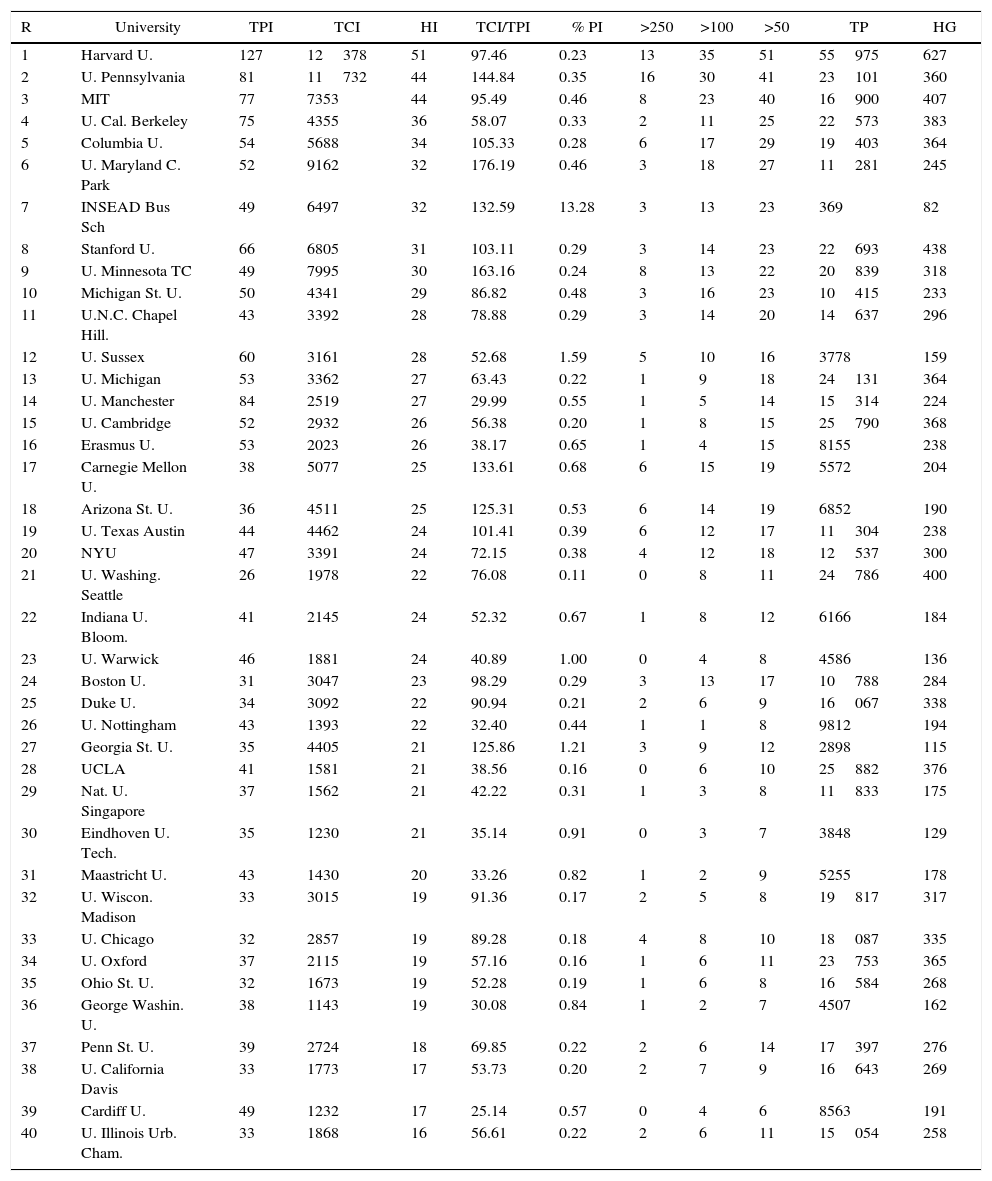
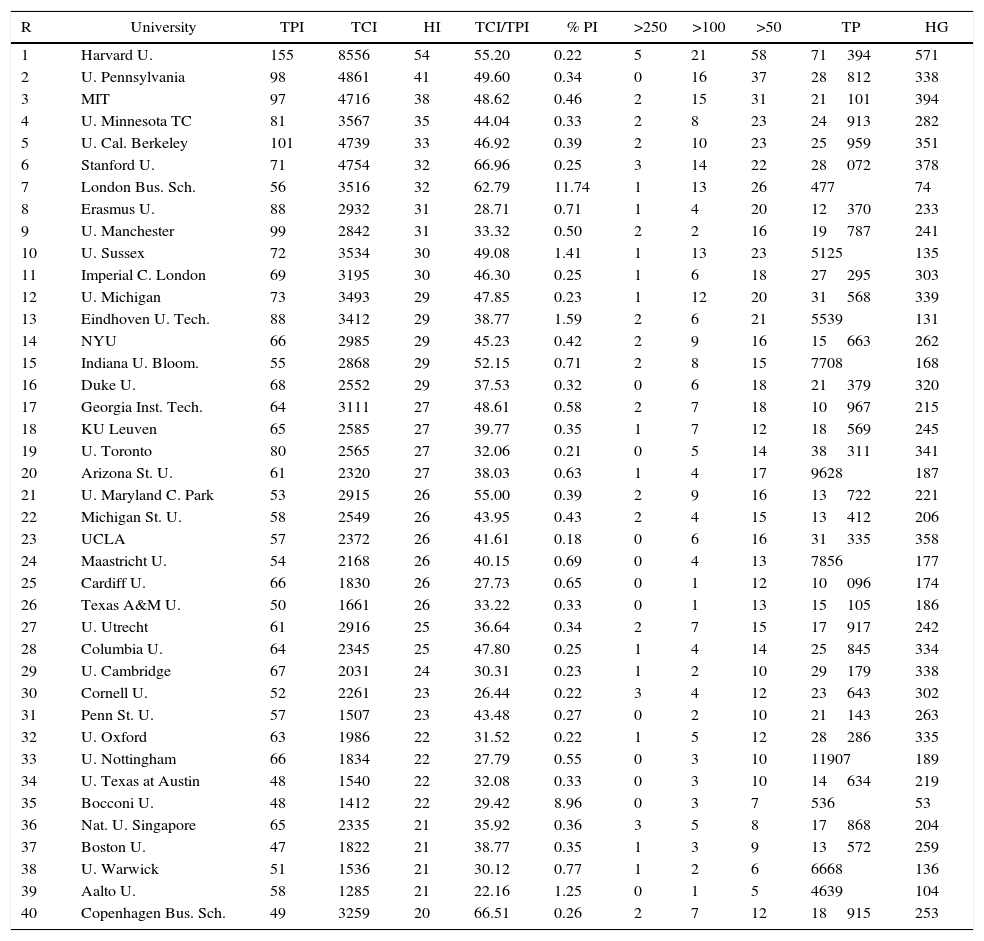
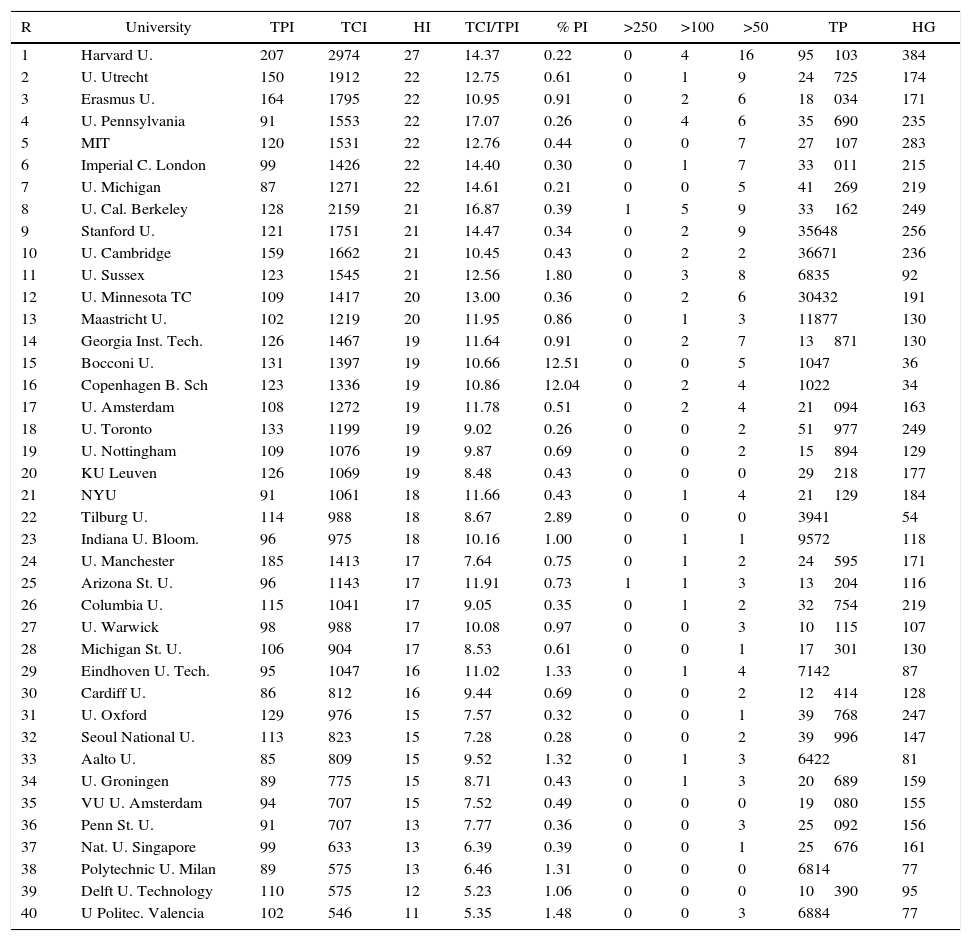
Leading universities in innovation research by periods of timeIn this section, let us focus on the evolution of leading universities in innovation research throughout time. For doing so, the study considers periods of five years between 1989 and 2013. In each period, a list with the universities that has published the highest number of articles in innovation is presented. The analysis uses similar indicators than Table 3. Tables 5–9 present the results.
Most influential universities in innovation research between 1989 and 1993.
| R | University | TPI | TCI | HI | TCI/TPI | % PI | >250 | >100 | >50 | TP | HG |
|---|---|---|---|---|---|---|---|---|---|---|---|
| 1 | U. Pennsylvania | 34 | 16261 | 25 | 478.26 | 0.002 | 7 | 17 | 22 | 21207 | 300 |
| 2 | Harvard U. | 39 | 6722 | 25 | 172.36 | 0.001 | 6 | 10 | 19 | 37237 | 545 |
| 3 | MIT | 45 | 4803 | 20 | 106.73 | 0.003 | 4 | 9 | 14 | 15763 | 362 |
| 4 | Columbia U. | 20 | 3629 | 17 | 181.45 | 0.001 | 4 | 7 | 11 | 17914 | 321 |
| 5 | U. Cal. Berkeley | 32 | 3194 | 16 | 99.81 | 0.001 | 2 | 6 | 9 | 21836 | 331 |
| 6 | UCLA | 24 | 1327 | 16 | 55.29 | 0.001 | 0 | 5 | 6 | 28557 | 337 |
| 7 | Tel Aviv U. | 19 | 1959 | 14 | 103.11 | 0.002 | 3 | 3 | 9 | 9380 | 160 |
| 8 | U. Sussex | 20 | 1651 | 14 | 82.55 | 0.007 | 2 | 6 | 7 | 2899 | 120 |
| 9 | Northwestern U. | 16 | 756 | 14 | 47.25 | 0.002 | 0 | 1 | 5 | 9641 | 238 |
| 10 | Georgetown U | 7 | 113 | 14 | 16.14 | 0.001 | 0 | 0 | 1 | 4736 | 165 |
| 11 | U. Michigan | 15 | 1137 | 12 | 75.80 | 0.001 | 0 | 4 | 9 | 19093 | 317 |
| 12 | U. Texas at Austin | 16 | 857 | 12 | 53.56 | 0.002 | 1 | 1 | 6 | 10121 | 219 |
| 13 | U. Minnesota TC | 18 | 2154 | 11 | 119.67 | 0.001 | 1 | 5 | 7 | 18523 | 289 |
| 14 | Carnegie Mellon U. | 15 | 9525 | 10 | 635.00 | 0.004 | 2 | 4 | 6 | 3961 | 184 |
| 15 | Stanford U. | 15 | 2642 | 10 | 176.13 | 0.001 | 2 | 5 | 7 | 17318 | 381 |
| 16 | NYU | 11 | 1286 | 9 | 116.91 | 0.001 | 1 | 2 | 5 | 8716 | 257 |
| 17 | Duke U. | 11 | 723 | 10 | 65.73 | 0.001 | 1 | 2 | 3 | 11472 | 296 |
| 18 | Boston U. | 13 | 426 | 10 | 32.77 | 0.002 | 0 | 1 | 2 | 6874 | 214 |
| 19 | U. California Irvine | 10 | 780 | 8 | 78.00 | 0.001 | 1 | 1 | 1 | 6886 | 207 |
| 20 | Newcastle U. | 8 | 249 | 8 | 31.13 | 0.002 | 0 | 0 | 2 | 5074 | 131 |
| 21 | Princeton U. | 8 | 2479 | 7 | 309.88 | 0.001 | 3 | 3 | 6 | 6857 | 252 |
| 22 | Texas A&M U. | 11 | 1510 | 7 | 137.27 | 0.001 | 1 | 4 | 6 | 9633 | 178 |
| 23 | U. Oxford | 9 | 616 | 7 | 68.44 | 0.001 | 1 | 1 | 3 | 16420 | 292 |
| 24 | U. British Columbia | 11 | 498 | 7 | 45.27 | 0.001 | 0 | 3 | 4 | 12595 | 221 |
| 25 | U. Chicago | 10 | 493 | 7 | 49.30 | 0.001 | 0 | 2 | 4 | 15397 | 306 |
| 26 | U. Southern California | 13 | 491 | 7 | 37.77 | 0.001 | 0 | 1 | 4 | 11036 | 242 |
| 27 | McMaster U. | 10 | 471 | 7 | 47.10 | 0.001 | 0 | 2 | 2 | 7041 | 191 |
| 28 | U. Amsterdam | 10 | 396 | 7 | 39.60 | 0.001 | 0 | 2 | 3 | 7026 | 184 |
| 29 | U. Montreal | 12 | 268 | 7 | 22.33 | 0.001 | 0 | 1 | 1 | 8691 | 177 |
| 30 | U. Manchester | 11 | 253 | 7 | 23.00 | 0.001 | 0 | 0 | 2 | 10261 | 168 |
| 31 | Indiana U. Bloom. | 15 | 208 | 7 | 13.87 | 0.003 | 0 | 0 | 2 | 5492 | 167 |
| 32 | Yale U. | 9 | 1543 | 6 | 171.44 | 0.001 | 0 | 2 | 3 | 13949 | 332 |
| 33 | Maastricht U. | 10 | 842 | 6 | 84.20 | 0.004 | 1 | 1 | 2 | 2489 | 123 |
| 34 | Penn State U. | 9 | 357 | 6 | 39.67 | 0.001 | 0 | 2 | 2 | 12290 | 230 |
| 35 | Case Western Res. U. | 10 | 300 | 6 | 30.00 | 0.001 | 0 | 1 | 2 | 7469 | 203 |
| 36 | Arizona St. U. | 7 | 246 | 6 | 35.14 | 0.001 | 0 | 0 | 1 | 5255 | 151 |
| 37 | Cornell U. | 8 | 133 | 6 | 16.63 | 0.000 | 0 | 0 | 1 | 18532 | 313 |
| 38 | Carleton U. | 9 | 87 | 6 | 9.67 | 0.004 | 0 | 0 | 0 | 2184 | 88 |
| 39 | U. Arizona | 10 | 509 | 5 | 50.90 | 0.001 | 0 | 2 | 3 | 11336 | 225 |
| 40 | Southern Methodist U. | 8 | 303 | 5 | 37.88 | 0.007 | 0 | 0 | 3 | 1139 | 83 |
Most influential universities in innovation research between 1994 and 1998.
| R | University | TPI | TCI | HI | TCI/TPI | % PI | >250 | >100 | >50 | TP | HG |
|---|---|---|---|---|---|---|---|---|---|---|---|
| 1 | U. Pennsylvania | 70 | 11680 | 46 | 166.86 | 0.35 | 13 | 34 | 45 | 19858 | 354 |
| 2 | Harvard U. | 74 | 14853 | 37 | 200.72 | 0.15 | 12 | 23 | 34 | 48205 | 623 |
| 3 | MIT | 66 | 8124 | 37 | 123.09 | 0.43 | 10 | 20 | 33 | 15257 | 392 |
| 4 | Stanford U. | 48 | 8418 | 27 | 175.38 | 0.24 | 12 | 18 | 26 | 19872 | 415 |
| 5 | U. Cal. Berkeley | 45 | 9568 | 26 | 212.62 | 0.22 | 7 | 13 | 19 | 20330 | 359 |
| 6 | Michigan St. U. | 45 | 3503 | 26 | 77.84 | 0.49 | 4 | 10 | 13 | 9213 | 224 |
| 7 | Columbia U. | 42 | 4142 | 25 | 98.62 | 0.26 | 6 | 10 | 18 | 16218 | 368 |
| 8 | NYU | 40 | 2730 | 25 | 68.25 | 0.39 | 1 | 9 | 17 | 10258 | 272 |
| 9 | Carnegie Mellon U. | 35 | 5034 | 24 | 143.83 | 0.75 | 5 | 15 | 20 | 4674 | 198 |
| 10 | U. Michigan | 39 | 3103 | 23 | 79.56 | 0.17 | 2 | 8 | 16 | 22473 | 356 |
| 11 | U. Southern Calif. | 36 | 3478 | 22 | 96.61 | 0.31 | 4 | 8 | 15 | 11636 | 266 |
| 12 | U. Sussex | 44 | 2337 | 20 | 53.11 | 1.20 | 1 | 7 | 13 | 3660 | 143 |
| 13 | UCLA | 38 | 2218 | 19 | 58.37 | 0.16 | 3 | 7 | 13 | 23117 | 363 |
| 14 | U. Manchester | 46 | 1429 | 19 | 31.07 | 0.34 | 1 | 3 | 9 | 13663 | 210 |
| 15 | U. Minnesota TC | 28 | 1914 | 18 | 68.36 | 0.14 | 1 | 4 | 11 | 20079 | 323 |
| 16 | London Bus Sch | 21 | 2505 | 17 | 119.29 | 6.48 | 1 | 4 | 10 | 324 | 54 |
| 17 | U. Warwick | 28 | 720 | 17 | 25.71 | 0.77 | 0 | 0 | 1 | 3636 | 112 |
| 18 | U. Wiscon. Madison | 24 | 2505 | 16 | 104.38 | 0.13 | 5 | 9 | 10 | 18767 | 303 |
| 19 | Florida St. U. | 24 | 2432 | 16 | 101.33 | 0.44 | 3 | 4 | 9 | 5457 | 138 |
| 20 | Northwestern U. | 27 | 2310 | 16 | 85.56 | 0.23 | 3 | 5 | 9 | 11780 | 274 |
| 21 | U.N.C. Chapel Hill. | 21 | 2077 | 16 | 98.90 | 0.16 | 2 | 5 | 7 | 12836 | 299 |
| 22 | U. South Car. Col. | 24 | 807 | 16 | 33.63 | 0.65 | 0 | 2 | 5 | 3700 | 138 |
| 23 | Texas A&M U. | 19 | 3308 | 15 | 174.11 | 0.17 | 5 | 8 | 10 | 11101 | 199 |
| 24 | U. Illinois Urb. Cham. | 26 | 2117 | 15 | 81.42 | 0.18 | 3 | 7 | 8 | 14342 | 262 |
| 25 | U. Cal. San Diego | 18 | 2274 | 14 | 126.33 | 0.11 | 3 | 4 | 5 | 16334 | 367 |
| 26 | U. Texas Austin | 20 | 2110 | 14 | 105.50 | 0.19 | 3 | 5 | 9 | 10440 | 217 |
| 27 | U. Oxford | 23 | 1312 | 14 | 57.04 | 0.11 | 1 | 5 | 8 | 21351 | 339 |
| 28 | U. Cambridge | 26 | 895 | 14 | 34.42 | 0.11 | 0 | 2 | 6 | 23657 | 347 |
| 29 | U. British Columbia | 24 | 1883 | 13 | 78.46 | 0.17 | 3 | 3 | 5 | 14558 | 248 |
| 30 | South. Methodist U. | 18 | 1509 | 13 | 83.83 | 1.10 | 2 | 4 | 6 | 1644 | 96 |
| 31 | Boston U. | 19 | 1319 | 13 | 69.42 | 0.22 | 0 | 7 | 8 | 8823 | 256 |
| 32 | Polytechnic U Milan | 21 | 680 | 13 | 32.38 | 0.80 | 0 | 2 | 4 | 2614 | 83 |
| 33 | Cardiff U. | 34 | 1534 | 12 | 45.12 | 0.47 | 2 | 3 | 4 | 7242 | 163 |
| 34 | U. Toronto | 18 | 1380 | 12 | 76.67 | 0.07 | 2 | 4 | 4 | 25326 | 354 |
| 35 | Iowa St. U. | 18 | 1016 | 12 | 56.44 | 0.25 | 0 | 4 | 8 | 7352 | 170 |
| 36 | U. College London | 18 | 719 | 12 | 39.94 | 0.08 | 0 | 1 | 7 | 23105 | 333 |
| 37 | U. Maryland C. Park | 22 | 1228 | 11 | 55.82 | 0.22 | 1 | 3 | 6 | 10011 | 209 |
| 38 | U. Georgia | 19 | 776 | 11 | 40.84 | 0.23 | 1 | 1 | 4 | 8395 | 167 |
| 39 | U. Edinburgh | 20 | 579 | 11 | 28.95 | 0.17 | 0 | 1 | 4 | 11561 | 239 |
| 40 | U. Libre de Bruxelles | 19 | 713 | 10 | 37.53 | 0.23 | 0 | 2 | 5 | 8129 | 182 |
Most influential universities in innovation research between 1999 and 2003.
| R | University | TPI | TCI | HI | TCI/TPI | % PI | >250 | >100 | >50 | TP | HG |
|---|---|---|---|---|---|---|---|---|---|---|---|
| 1 | Harvard U. | 127 | 12378 | 51 | 97.46 | 0.23 | 13 | 35 | 51 | 55975 | 627 |
| 2 | U. Pennsylvania | 81 | 11732 | 44 | 144.84 | 0.35 | 16 | 30 | 41 | 23101 | 360 |
| 3 | MIT | 77 | 7353 | 44 | 95.49 | 0.46 | 8 | 23 | 40 | 16900 | 407 |
| 4 | U. Cal. Berkeley | 75 | 4355 | 36 | 58.07 | 0.33 | 2 | 11 | 25 | 22573 | 383 |
| 5 | Columbia U. | 54 | 5688 | 34 | 105.33 | 0.28 | 6 | 17 | 29 | 19403 | 364 |
| 6 | U. Maryland C. Park | 52 | 9162 | 32 | 176.19 | 0.46 | 3 | 18 | 27 | 11281 | 245 |
| 7 | INSEAD Bus Sch | 49 | 6497 | 32 | 132.59 | 13.28 | 3 | 13 | 23 | 369 | 82 |
| 8 | Stanford U. | 66 | 6805 | 31 | 103.11 | 0.29 | 3 | 14 | 23 | 22693 | 438 |
| 9 | U. Minnesota TC | 49 | 7995 | 30 | 163.16 | 0.24 | 8 | 13 | 22 | 20839 | 318 |
| 10 | Michigan St. U. | 50 | 4341 | 29 | 86.82 | 0.48 | 3 | 16 | 23 | 10415 | 233 |
| 11 | U.N.C. Chapel Hill. | 43 | 3392 | 28 | 78.88 | 0.29 | 3 | 14 | 20 | 14637 | 296 |
| 12 | U. Sussex | 60 | 3161 | 28 | 52.68 | 1.59 | 5 | 10 | 16 | 3778 | 159 |
| 13 | U. Michigan | 53 | 3362 | 27 | 63.43 | 0.22 | 1 | 9 | 18 | 24131 | 364 |
| 14 | U. Manchester | 84 | 2519 | 27 | 29.99 | 0.55 | 1 | 5 | 14 | 15314 | 224 |
| 15 | U. Cambridge | 52 | 2932 | 26 | 56.38 | 0.20 | 1 | 8 | 15 | 25790 | 368 |
| 16 | Erasmus U. | 53 | 2023 | 26 | 38.17 | 0.65 | 1 | 4 | 15 | 8155 | 238 |
| 17 | Carnegie Mellon U. | 38 | 5077 | 25 | 133.61 | 0.68 | 6 | 15 | 19 | 5572 | 204 |
| 18 | Arizona St. U. | 36 | 4511 | 25 | 125.31 | 0.53 | 6 | 14 | 19 | 6852 | 190 |
| 19 | U. Texas Austin | 44 | 4462 | 24 | 101.41 | 0.39 | 6 | 12 | 17 | 11304 | 238 |
| 20 | NYU | 47 | 3391 | 24 | 72.15 | 0.38 | 4 | 12 | 18 | 12537 | 300 |
| 21 | U. Washing. Seattle | 26 | 1978 | 22 | 76.08 | 0.11 | 0 | 8 | 11 | 24786 | 400 |
| 22 | Indiana U. Bloom. | 41 | 2145 | 24 | 52.32 | 0.67 | 1 | 8 | 12 | 6166 | 184 |
| 23 | U. Warwick | 46 | 1881 | 24 | 40.89 | 1.00 | 0 | 4 | 8 | 4586 | 136 |
| 24 | Boston U. | 31 | 3047 | 23 | 98.29 | 0.29 | 3 | 13 | 17 | 10788 | 284 |
| 25 | Duke U. | 34 | 3092 | 22 | 90.94 | 0.21 | 2 | 6 | 9 | 16067 | 338 |
| 26 | U. Nottingham | 43 | 1393 | 22 | 32.40 | 0.44 | 1 | 1 | 8 | 9812 | 194 |
| 27 | Georgia St. U. | 35 | 4405 | 21 | 125.86 | 1.21 | 3 | 9 | 12 | 2898 | 115 |
| 28 | UCLA | 41 | 1581 | 21 | 38.56 | 0.16 | 0 | 6 | 10 | 25882 | 376 |
| 29 | Nat. U. Singapore | 37 | 1562 | 21 | 42.22 | 0.31 | 1 | 3 | 8 | 11833 | 175 |
| 30 | Eindhoven U. Tech. | 35 | 1230 | 21 | 35.14 | 0.91 | 0 | 3 | 7 | 3848 | 129 |
| 31 | Maastricht U. | 43 | 1430 | 20 | 33.26 | 0.82 | 1 | 2 | 9 | 5255 | 178 |
| 32 | U. Wiscon. Madison | 33 | 3015 | 19 | 91.36 | 0.17 | 2 | 5 | 8 | 19817 | 317 |
| 33 | U. Chicago | 32 | 2857 | 19 | 89.28 | 0.18 | 4 | 8 | 10 | 18087 | 335 |
| 34 | U. Oxford | 37 | 2115 | 19 | 57.16 | 0.16 | 1 | 6 | 11 | 23753 | 365 |
| 35 | Ohio St. U. | 32 | 1673 | 19 | 52.28 | 0.19 | 1 | 6 | 8 | 16584 | 268 |
| 36 | George Washin. U. | 38 | 1143 | 19 | 30.08 | 0.84 | 1 | 2 | 7 | 4507 | 162 |
| 37 | Penn St. U. | 39 | 2724 | 18 | 69.85 | 0.22 | 2 | 6 | 14 | 17397 | 276 |
| 38 | U. California Davis | 33 | 1773 | 17 | 53.73 | 0.20 | 2 | 7 | 9 | 16643 | 269 |
| 39 | Cardiff U. | 49 | 1232 | 17 | 25.14 | 0.57 | 0 | 4 | 6 | 8563 | 191 |
| 40 | U. Illinois Urb. Cham. | 33 | 1868 | 16 | 56.61 | 0.22 | 2 | 6 | 11 | 15054 | 258 |
Most influential universities in innovation research between 2004 and 2008.
| R | University | TPI | TCI | HI | TCI/TPI | % PI | >250 | >100 | >50 | TP | HG |
|---|---|---|---|---|---|---|---|---|---|---|---|
| 1 | Harvard U. | 155 | 8556 | 54 | 55.20 | 0.22 | 5 | 21 | 58 | 71394 | 571 |
| 2 | U. Pennsylvania | 98 | 4861 | 41 | 49.60 | 0.34 | 0 | 16 | 37 | 28812 | 338 |
| 3 | MIT | 97 | 4716 | 38 | 48.62 | 0.46 | 2 | 15 | 31 | 21101 | 394 |
| 4 | U. Minnesota TC | 81 | 3567 | 35 | 44.04 | 0.33 | 2 | 8 | 23 | 24913 | 282 |
| 5 | U. Cal. Berkeley | 101 | 4739 | 33 | 46.92 | 0.39 | 2 | 10 | 23 | 25959 | 351 |
| 6 | Stanford U. | 71 | 4754 | 32 | 66.96 | 0.25 | 3 | 14 | 22 | 28072 | 378 |
| 7 | London Bus. Sch. | 56 | 3516 | 32 | 62.79 | 11.74 | 1 | 13 | 26 | 477 | 74 |
| 8 | Erasmus U. | 88 | 2932 | 31 | 28.71 | 0.71 | 1 | 4 | 20 | 12370 | 233 |
| 9 | U. Manchester | 99 | 2842 | 31 | 33.32 | 0.50 | 2 | 2 | 16 | 19787 | 241 |
| 10 | U. Sussex | 72 | 3534 | 30 | 49.08 | 1.41 | 1 | 13 | 23 | 5125 | 135 |
| 11 | Imperial C. London | 69 | 3195 | 30 | 46.30 | 0.25 | 1 | 6 | 18 | 27295 | 303 |
| 12 | U. Michigan | 73 | 3493 | 29 | 47.85 | 0.23 | 1 | 12 | 20 | 31568 | 339 |
| 13 | Eindhoven U. Tech. | 88 | 3412 | 29 | 38.77 | 1.59 | 2 | 6 | 21 | 5539 | 131 |
| 14 | NYU | 66 | 2985 | 29 | 45.23 | 0.42 | 2 | 9 | 16 | 15663 | 262 |
| 15 | Indiana U. Bloom. | 55 | 2868 | 29 | 52.15 | 0.71 | 2 | 8 | 15 | 7708 | 168 |
| 16 | Duke U. | 68 | 2552 | 29 | 37.53 | 0.32 | 0 | 6 | 18 | 21379 | 320 |
| 17 | Georgia Inst. Tech. | 64 | 3111 | 27 | 48.61 | 0.58 | 2 | 7 | 18 | 10967 | 215 |
| 18 | KU Leuven | 65 | 2585 | 27 | 39.77 | 0.35 | 1 | 7 | 12 | 18569 | 245 |
| 19 | U. Toronto | 80 | 2565 | 27 | 32.06 | 0.21 | 0 | 5 | 14 | 38311 | 341 |
| 20 | Arizona St. U. | 61 | 2320 | 27 | 38.03 | 0.63 | 1 | 4 | 17 | 9628 | 187 |
| 21 | U. Maryland C. Park | 53 | 2915 | 26 | 55.00 | 0.39 | 2 | 9 | 16 | 13722 | 221 |
| 22 | Michigan St. U. | 58 | 2549 | 26 | 43.95 | 0.43 | 2 | 4 | 15 | 13412 | 206 |
| 23 | UCLA | 57 | 2372 | 26 | 41.61 | 0.18 | 0 | 6 | 16 | 31335 | 358 |
| 24 | Maastricht U. | 54 | 2168 | 26 | 40.15 | 0.69 | 0 | 4 | 13 | 7856 | 177 |
| 25 | Cardiff U. | 66 | 1830 | 26 | 27.73 | 0.65 | 0 | 1 | 12 | 10096 | 174 |
| 26 | Texas A&M U. | 50 | 1661 | 26 | 33.22 | 0.33 | 0 | 1 | 13 | 15105 | 186 |
| 27 | U. Utrecht | 61 | 2916 | 25 | 36.64 | 0.34 | 2 | 7 | 15 | 17917 | 242 |
| 28 | Columbia U. | 64 | 2345 | 25 | 47.80 | 0.25 | 1 | 4 | 14 | 25845 | 334 |
| 29 | U. Cambridge | 67 | 2031 | 24 | 30.31 | 0.23 | 1 | 2 | 10 | 29179 | 338 |
| 30 | Cornell U. | 52 | 2261 | 23 | 26.44 | 0.22 | 3 | 4 | 12 | 23643 | 302 |
| 31 | Penn St. U. | 57 | 1507 | 23 | 43.48 | 0.27 | 0 | 2 | 10 | 21143 | 263 |
| 32 | U. Oxford | 63 | 1986 | 22 | 31.52 | 0.22 | 1 | 5 | 12 | 28286 | 335 |
| 33 | U. Nottingham | 66 | 1834 | 22 | 27.79 | 0.55 | 0 | 3 | 10 | 11907 | 189 |
| 34 | U. Texas at Austin | 48 | 1540 | 22 | 32.08 | 0.33 | 0 | 3 | 10 | 14634 | 219 |
| 35 | Bocconi U. | 48 | 1412 | 22 | 29.42 | 8.96 | 0 | 3 | 7 | 536 | 53 |
| 36 | Nat. U. Singapore | 65 | 2335 | 21 | 35.92 | 0.36 | 3 | 5 | 8 | 17868 | 204 |
| 37 | Boston U. | 47 | 1822 | 21 | 38.77 | 0.35 | 1 | 3 | 9 | 13572 | 259 |
| 38 | U. Warwick | 51 | 1536 | 21 | 30.12 | 0.77 | 1 | 2 | 6 | 6668 | 136 |
| 39 | Aalto U. | 58 | 1285 | 21 | 22.16 | 1.25 | 0 | 1 | 5 | 4639 | 104 |
| 40 | Copenhagen Bus. Sch. | 49 | 3259 | 20 | 66.51 | 0.26 | 2 | 7 | 12 | 18915 | 253 |
Most influential universities in innovation research between 2009 and 2013.
| R | University | TPI | TCI | HI | TCI/TPI | % PI | >250 | >100 | >50 | TP | HG |
|---|---|---|---|---|---|---|---|---|---|---|---|
| 1 | Harvard U. | 207 | 2974 | 27 | 14.37 | 0.22 | 0 | 4 | 16 | 95103 | 384 |
| 2 | U. Utrecht | 150 | 1912 | 22 | 12.75 | 0.61 | 0 | 1 | 9 | 24725 | 174 |
| 3 | Erasmus U. | 164 | 1795 | 22 | 10.95 | 0.91 | 0 | 2 | 6 | 18034 | 171 |
| 4 | U. Pennsylvania | 91 | 1553 | 22 | 17.07 | 0.26 | 0 | 4 | 6 | 35690 | 235 |
| 5 | MIT | 120 | 1531 | 22 | 12.76 | 0.44 | 0 | 0 | 7 | 27107 | 283 |
| 6 | Imperial C. London | 99 | 1426 | 22 | 14.40 | 0.30 | 0 | 1 | 7 | 33011 | 215 |
| 7 | U. Michigan | 87 | 1271 | 22 | 14.61 | 0.21 | 0 | 0 | 5 | 41269 | 219 |
| 8 | U. Cal. Berkeley | 128 | 2159 | 21 | 16.87 | 0.39 | 1 | 5 | 9 | 33162 | 249 |
| 9 | Stanford U. | 121 | 1751 | 21 | 14.47 | 0.34 | 0 | 2 | 9 | 35648 | 256 |
| 10 | U. Cambridge | 159 | 1662 | 21 | 10.45 | 0.43 | 0 | 2 | 2 | 36671 | 236 |
| 11 | U. Sussex | 123 | 1545 | 21 | 12.56 | 1.80 | 0 | 3 | 8 | 6835 | 92 |
| 12 | U. Minnesota TC | 109 | 1417 | 20 | 13.00 | 0.36 | 0 | 2 | 6 | 30432 | 191 |
| 13 | Maastricht U. | 102 | 1219 | 20 | 11.95 | 0.86 | 0 | 1 | 3 | 11877 | 130 |
| 14 | Georgia Inst. Tech. | 126 | 1467 | 19 | 11.64 | 0.91 | 0 | 2 | 7 | 13871 | 130 |
| 15 | Bocconi U. | 131 | 1397 | 19 | 10.66 | 12.51 | 0 | 0 | 5 | 1047 | 36 |
| 16 | Copenhagen B. Sch | 123 | 1336 | 19 | 10.86 | 12.04 | 0 | 2 | 4 | 1022 | 34 |
| 17 | U. Amsterdam | 108 | 1272 | 19 | 11.78 | 0.51 | 0 | 2 | 4 | 21094 | 163 |
| 18 | U. Toronto | 133 | 1199 | 19 | 9.02 | 0.26 | 0 | 0 | 2 | 51977 | 249 |
| 19 | U. Nottingham | 109 | 1076 | 19 | 9.87 | 0.69 | 0 | 0 | 2 | 15894 | 129 |
| 20 | KU Leuven | 126 | 1069 | 19 | 8.48 | 0.43 | 0 | 0 | 0 | 29218 | 177 |
| 21 | NYU | 91 | 1061 | 18 | 11.66 | 0.43 | 0 | 1 | 4 | 21129 | 184 |
| 22 | Tilburg U. | 114 | 988 | 18 | 8.67 | 2.89 | 0 | 0 | 0 | 3941 | 54 |
| 23 | Indiana U. Bloom. | 96 | 975 | 18 | 10.16 | 1.00 | 0 | 1 | 1 | 9572 | 118 |
| 24 | U. Manchester | 185 | 1413 | 17 | 7.64 | 0.75 | 0 | 1 | 2 | 24595 | 171 |
| 25 | Arizona St. U. | 96 | 1143 | 17 | 11.91 | 0.73 | 1 | 1 | 3 | 13204 | 116 |
| 26 | Columbia U. | 115 | 1041 | 17 | 9.05 | 0.35 | 0 | 1 | 2 | 32754 | 219 |
| 27 | U. Warwick | 98 | 988 | 17 | 10.08 | 0.97 | 0 | 0 | 3 | 10115 | 107 |
| 28 | Michigan St. U. | 106 | 904 | 17 | 8.53 | 0.61 | 0 | 0 | 1 | 17301 | 130 |
| 29 | Eindhoven U. Tech. | 95 | 1047 | 16 | 11.02 | 1.33 | 0 | 1 | 4 | 7142 | 87 |
| 30 | Cardiff U. | 86 | 812 | 16 | 9.44 | 0.69 | 0 | 0 | 2 | 12414 | 128 |
| 31 | U. Oxford | 129 | 976 | 15 | 7.57 | 0.32 | 0 | 0 | 1 | 39768 | 247 |
| 32 | Seoul National U. | 113 | 823 | 15 | 7.28 | 0.28 | 0 | 0 | 2 | 39996 | 147 |
| 33 | Aalto U. | 85 | 809 | 15 | 9.52 | 1.32 | 0 | 1 | 3 | 6422 | 81 |
| 34 | U. Groningen | 89 | 775 | 15 | 8.71 | 0.43 | 0 | 1 | 3 | 20689 | 159 |
| 35 | VU U. Amsterdam | 94 | 707 | 15 | 7.52 | 0.49 | 0 | 0 | 0 | 19080 | 155 |
| 36 | Penn St. U. | 91 | 707 | 13 | 7.77 | 0.36 | 0 | 0 | 3 | 25092 | 156 |
| 37 | Nat. U. Singapore | 99 | 633 | 13 | 6.39 | 0.39 | 0 | 0 | 1 | 25676 | 161 |
| 38 | Polytechnic U. Milan | 89 | 575 | 13 | 6.46 | 1.31 | 0 | 0 | 0 | 6814 | 77 |
| 39 | Delft U. Technology | 110 | 575 | 12 | 5.23 | 1.06 | 0 | 0 | 0 | 10390 | 95 |
| 40 | U Politec. Valencia | 102 | 546 | 11 | 5.35 | 1.48 | 0 | 0 | 3 | 6884 | 77 |
Again, we can see that American universities are those that appear on the list of leading institutions in innovation research in the five periods described. Pennsylvania U., Harvard U. and MIT have been the main leaders during the last twenty-five years. Nevertheless, in recent years it is possible to see how other universities, other than those from the USA, have developed a significant increase in the number of publications in innovation research. It is noteworthy that in the first quinquennium analyzed, 1989–1993, only 9 universities are not from the USA. Furthermore, the periods between 1994–1998, 1999–2003 and 2004–2008, 11, 12 and 18 universities respectively, are neither from the USA. Finally, in the period 2009–2013, a total of 40 universities with the highest number of publications on innovation, 24 are not from the United States. That is because in this last period, only 40% of universities leading publications in innovation come from the USA, different than nearly 80% in the 1989–1993 period. Without doubt, the increased participation of universities, mainly European, from the UK and the Netherlands, which contain a high number of publications is due to the greater number of scientific journals that have focused on the study of innovation research, possibly allowing a higher number of scientists across the world can to publish their work in these journals, many of which are European.
This allows us to understand the progress universities outside the US have had, as the largest number of research publications in developing innovation. Nevertheless, this greater productivity is not necessarily associated with greater influence in the scientific realm, where universities from the USA continue to excel.
Bibliographic coupling and co-citation between the most productive and influential universities in innovation researchFinally, the study presents an analysis about the citation structure of innovation research by universities through the concepts of bibliographic coupling and co-citation. While, bibliographic coupling appears when two different studies reference a common third study in their bibliographies (Martyn, 1964), co-citation measures the frequency with which two documents are cited together by other documents (Small, 1973).
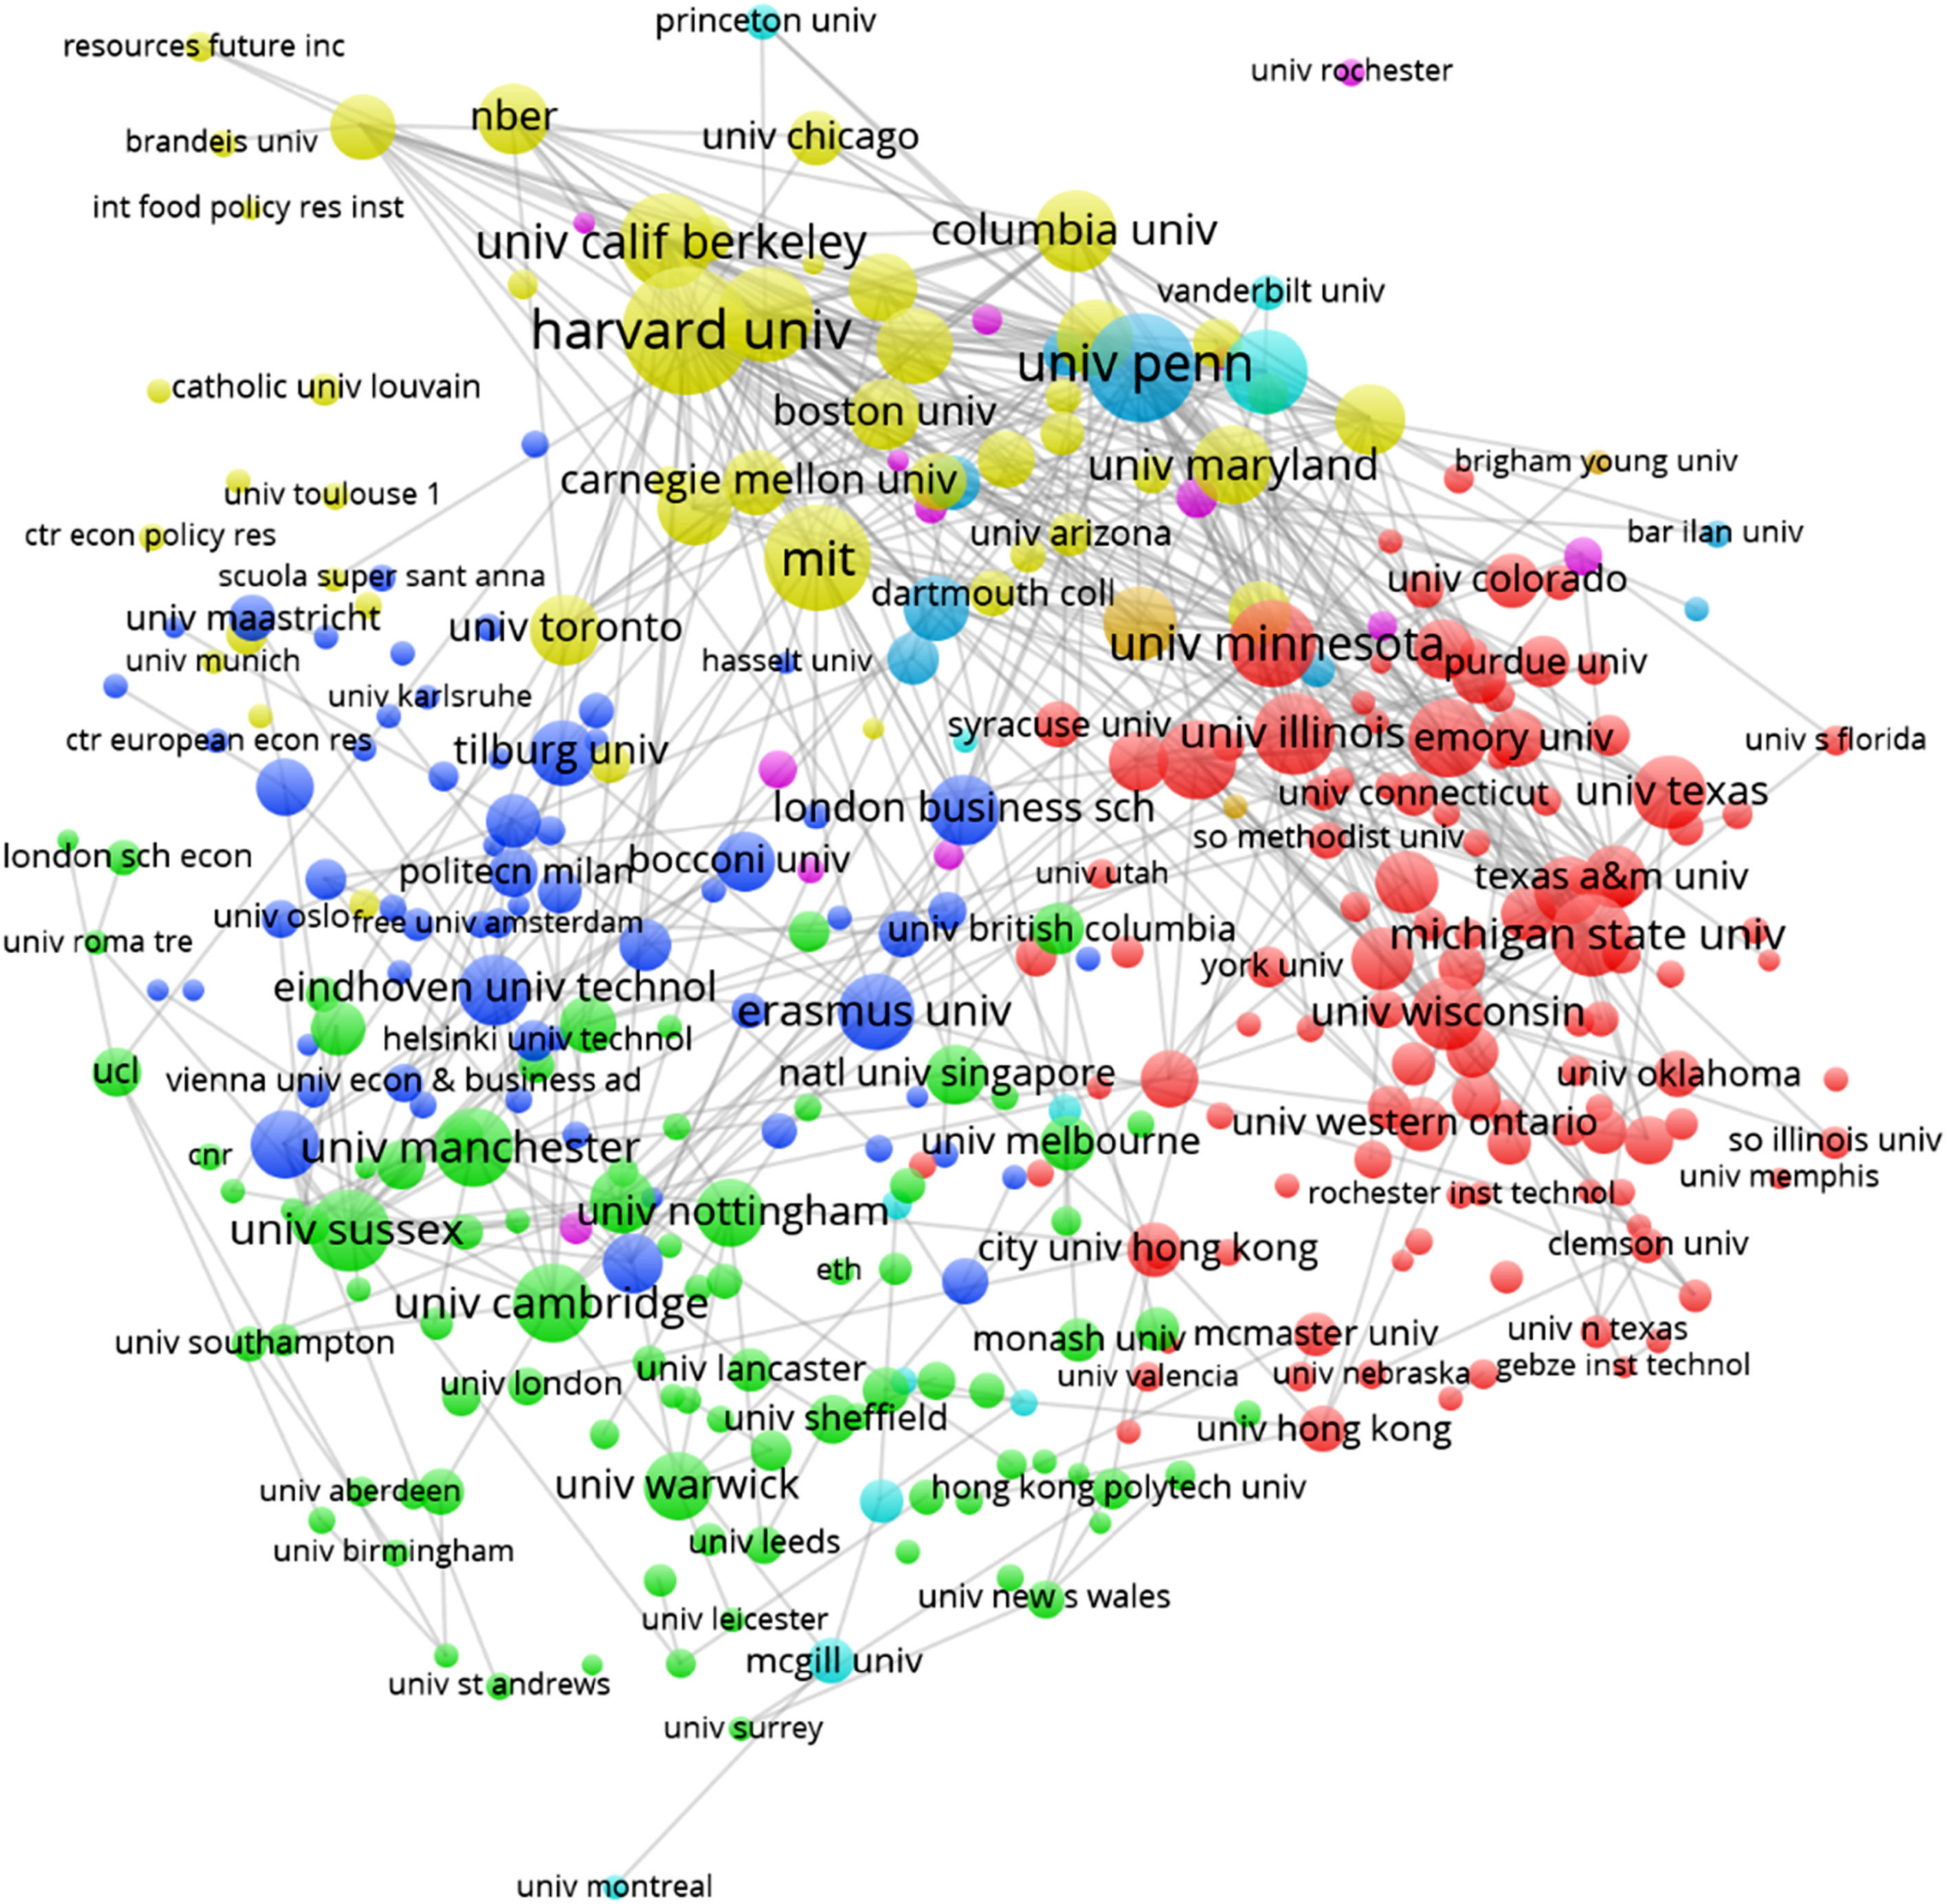
On the one hand, Fig. 2 shows the bibliographic coupling between the most productive and influential universities in innovation research.

Both, American and European universities, show important influence in the analysis because they publish more articles and therefore they also generate more citations. It is possible to observe the existence of several groups of universities bibliographically coupled, presenting a very huge bibliographic network. For example, Harvard U., U. Columbia, MIT, U. California Berkeley, and Boston U. can be called a premium network of American universities. A second group of American universities can be associated with U. Texas-Austin, Texas A&M U., Michigan St. U., U. Wisconsin, and U. Minnesota, which are bibliographically coupled as well. In the context of European universities, it is possible to find another two groups. The first one, related only with UK universities, including U. Sussex, U. Cambridge, U. Manchester, and U. Warwick, among others. A second group of European universities that show a huge bibliographic network is formed by London Business School, Bocconi U., Erasmus U., and Eindhoven U. Technology, among others. All these groups, that cite papers in common, show a high bibliographic network, allowing that within each group there are universities with research focused on related topics. Note that Fig. 2 shows the 500 most significant connections between universities through the bibliographic coupling methodology.
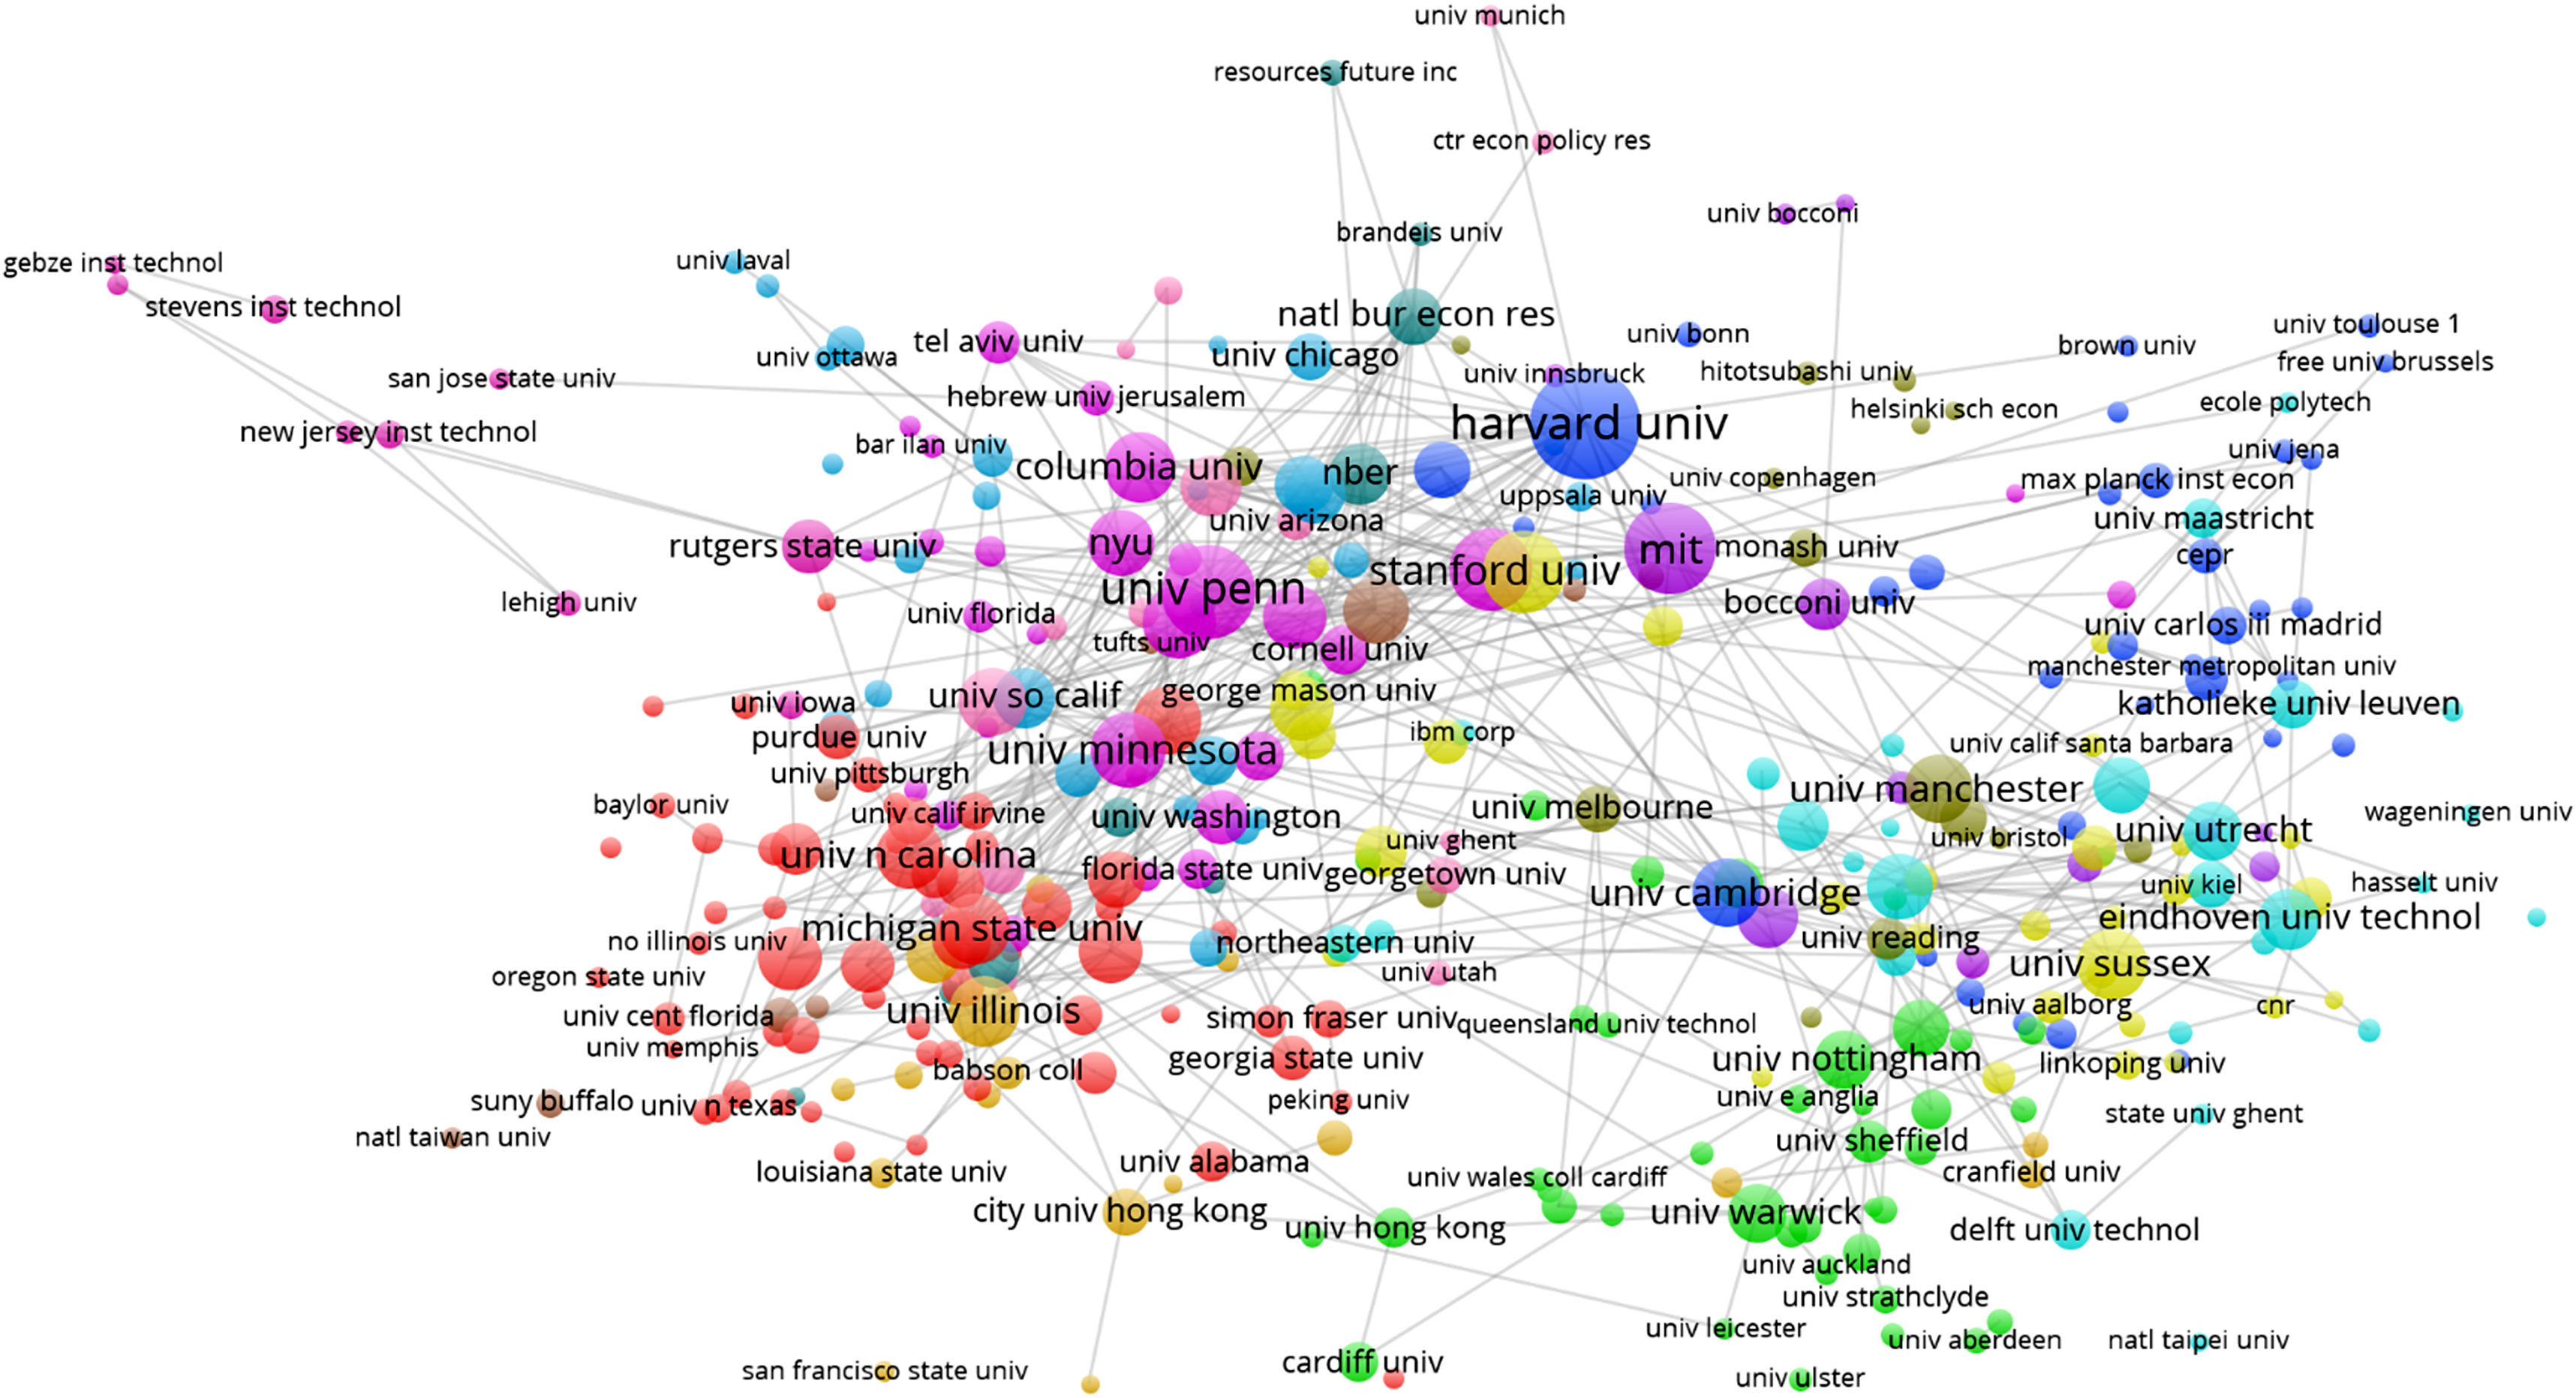
On the other hand, Fig. 3 presents the co-citation structure of the most productive and influential universities in innovation research.

The most productive universities have the highest influence in the co-citation analysis. In this case, very important universities from the US – such as Harvard U., U. Pennsylvania, MIT, Stanford U., U. Minnesota, NYU and Columbia U. – form a special group of universities that receive more citations with respect to other universities in the world. Particularly, the cites that they receive publications from not only come from American universities, but also from different worldwide universities like Bocconi U., Monash U., Uppsala U., among others. Also, Fig. 3 shows a second group of European universities with the highest influence in the co-citation analysis (U. Cambridge, U. Manchester, U. Sussex, among others). This European group has more citations among themselves than citations with US universities. Please, observe that Fig. 3 also presents the 500 strongest co-citation connections.
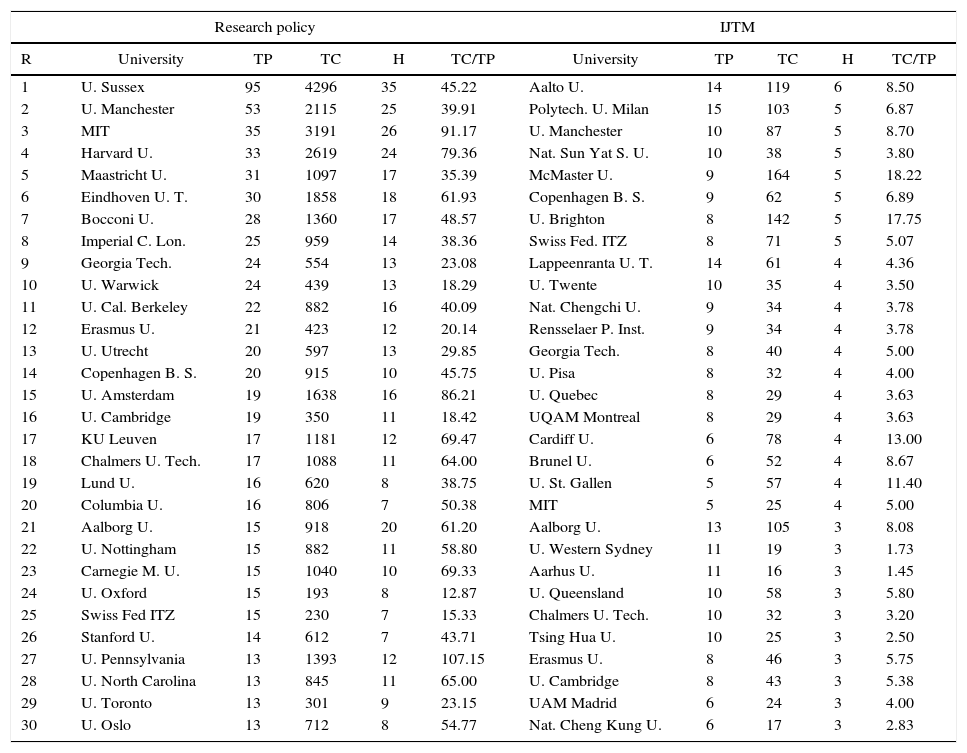
Individual journal analysis of the leading universitiesA different issue to analyze is the importance of the universities in the leading journals of innovation. In this field, there are specialized (Table 2) and leading management journals where the articles are published (Table 1). Table 10 presents the leading universities in two most specialized journals in innovation: Research Policy and International Journal of Technology Management.
Leading universities in innovation in research policy and International Journal of Technology Management (IJTM).
| Research policy | IJTM | |||||||||
|---|---|---|---|---|---|---|---|---|---|---|
| R | University | TP | TC | H | TC/TP | University | TP | TC | H | TC/TP |
| 1 | U. Sussex | 95 | 4296 | 35 | 45.22 | Aalto U. | 14 | 119 | 6 | 8.50 |
| 2 | U. Manchester | 53 | 2115 | 25 | 39.91 | Polytech. U. Milan | 15 | 103 | 5 | 6.87 |
| 3 | MIT | 35 | 3191 | 26 | 91.17 | U. Manchester | 10 | 87 | 5 | 8.70 |
| 4 | Harvard U. | 33 | 2619 | 24 | 79.36 | Nat. Sun Yat S. U. | 10 | 38 | 5 | 3.80 |
| 5 | Maastricht U. | 31 | 1097 | 17 | 35.39 | McMaster U. | 9 | 164 | 5 | 18.22 |
| 6 | Eindhoven U. T. | 30 | 1858 | 18 | 61.93 | Copenhagen B. S. | 9 | 62 | 5 | 6.89 |
| 7 | Bocconi U. | 28 | 1360 | 17 | 48.57 | U. Brighton | 8 | 142 | 5 | 17.75 |
| 8 | Imperial C. Lon. | 25 | 959 | 14 | 38.36 | Swiss Fed. ITZ | 8 | 71 | 5 | 5.07 |
| 9 | Georgia Tech. | 24 | 554 | 13 | 23.08 | Lappeenranta U. T. | 14 | 61 | 4 | 4.36 |
| 10 | U. Warwick | 24 | 439 | 13 | 18.29 | U. Twente | 10 | 35 | 4 | 3.50 |
| 11 | U. Cal. Berkeley | 22 | 882 | 16 | 40.09 | Nat. Chengchi U. | 9 | 34 | 4 | 3.78 |
| 12 | Erasmus U. | 21 | 423 | 12 | 20.14 | Rensselaer P. Inst. | 9 | 34 | 4 | 3.78 |
| 13 | U. Utrecht | 20 | 597 | 13 | 29.85 | Georgia Tech. | 8 | 40 | 4 | 5.00 |
| 14 | Copenhagen B. S. | 20 | 915 | 10 | 45.75 | U. Pisa | 8 | 32 | 4 | 4.00 |
| 15 | U. Amsterdam | 19 | 1638 | 16 | 86.21 | U. Quebec | 8 | 29 | 4 | 3.63 |
| 16 | U. Cambridge | 19 | 350 | 11 | 18.42 | UQAM Montreal | 8 | 29 | 4 | 3.63 |
| 17 | KU Leuven | 17 | 1181 | 12 | 69.47 | Cardiff U. | 6 | 78 | 4 | 13.00 |
| 18 | Chalmers U. Tech. | 17 | 1088 | 11 | 64.00 | Brunel U. | 6 | 52 | 4 | 8.67 |
| 19 | Lund U. | 16 | 620 | 8 | 38.75 | U. St. Gallen | 5 | 57 | 4 | 11.40 |
| 20 | Columbia U. | 16 | 806 | 7 | 50.38 | MIT | 5 | 25 | 4 | 5.00 |
| 21 | Aalborg U. | 15 | 918 | 20 | 61.20 | Aalborg U. | 13 | 105 | 3 | 8.08 |
| 22 | U. Nottingham | 15 | 882 | 11 | 58.80 | U. Western Sydney | 11 | 19 | 3 | 1.73 |
| 23 | Carnegie M. U. | 15 | 1040 | 10 | 69.33 | Aarhus U. | 11 | 16 | 3 | 1.45 |
| 24 | U. Oxford | 15 | 193 | 8 | 12.87 | U. Queensland | 10 | 58 | 3 | 5.80 |
| 25 | Swiss Fed ITZ | 15 | 230 | 7 | 15.33 | Chalmers U. Tech. | 10 | 32 | 3 | 3.20 |
| 26 | Stanford U. | 14 | 612 | 7 | 43.71 | Tsing Hua U. | 10 | 25 | 3 | 2.50 |
| 27 | U. Pennsylvania | 13 | 1393 | 12 | 107.15 | Erasmus U. | 8 | 46 | 3 | 5.75 |
| 28 | U. North Carolina | 13 | 845 | 11 | 65.00 | U. Cambridge | 8 | 43 | 3 | 5.38 |
| 29 | U. Toronto | 13 | 301 | 9 | 23.15 | UAM Madrid | 6 | 24 | 3 | 4.00 |
| 30 | U. Oslo | 13 | 712 | 8 | 54.77 | Nat. Cheng Kung U. | 6 | 17 | 3 | 2.83 |
In both journals European universities are the most productive and influential institutions. For example, in Research Policy the UK and Netherlands universities obtain the best positions in the ranking. Then, USA universities represent less than a third of the leading universities in Research Policy. Also in the case of International Journal of Technology Management, universities from different European countries (Netherlands, Italy, UK, Switzerland, Spain, among others) represents more than two third of the leading institution. In the case of USA universities, they represent less than the 10% of the leading institutions in International Journal of Technology Management. Note that the table is ranked according to the h-index. In the case of a tie, the ranking is based on the number of publications and if another tie occurs, according to the number of citations.
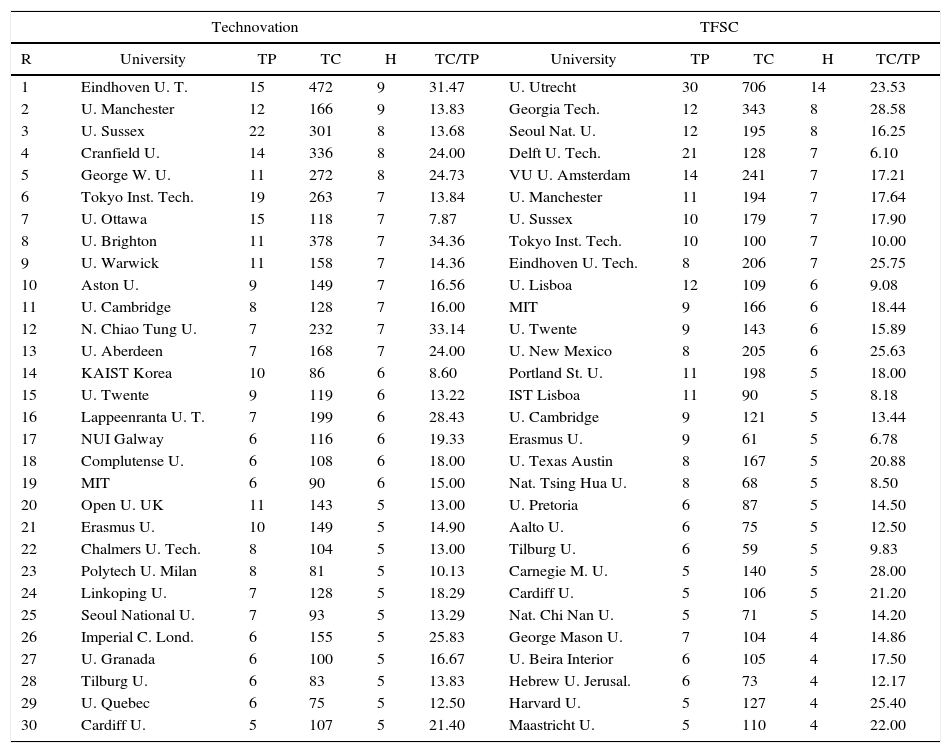
In Table 11 it is possible to analyze other two leading specialized journals in innovation, Technovation and Technological Forecasting and Social Change.
Leading universities in innovation in Technovation and Technological Forecasting and Social Change (TFSC).
| Technovation | TFSC | |||||||||
|---|---|---|---|---|---|---|---|---|---|---|
| R | University | TP | TC | H | TC/TP | University | TP | TC | H | TC/TP |
| 1 | Eindhoven U. T. | 15 | 472 | 9 | 31.47 | U. Utrecht | 30 | 706 | 14 | 23.53 |
| 2 | U. Manchester | 12 | 166 | 9 | 13.83 | Georgia Tech. | 12 | 343 | 8 | 28.58 |
| 3 | U. Sussex | 22 | 301 | 8 | 13.68 | Seoul Nat. U. | 12 | 195 | 8 | 16.25 |
| 4 | Cranfield U. | 14 | 336 | 8 | 24.00 | Delft U. Tech. | 21 | 128 | 7 | 6.10 |
| 5 | George W. U. | 11 | 272 | 8 | 24.73 | VU U. Amsterdam | 14 | 241 | 7 | 17.21 |
| 6 | Tokyo Inst. Tech. | 19 | 263 | 7 | 13.84 | U. Manchester | 11 | 194 | 7 | 17.64 |
| 7 | U. Ottawa | 15 | 118 | 7 | 7.87 | U. Sussex | 10 | 179 | 7 | 17.90 |
| 8 | U. Brighton | 11 | 378 | 7 | 34.36 | Tokyo Inst. Tech. | 10 | 100 | 7 | 10.00 |
| 9 | U. Warwick | 11 | 158 | 7 | 14.36 | Eindhoven U. Tech. | 8 | 206 | 7 | 25.75 |
| 10 | Aston U. | 9 | 149 | 7 | 16.56 | U. Lisboa | 12 | 109 | 6 | 9.08 |
| 11 | U. Cambridge | 8 | 128 | 7 | 16.00 | MIT | 9 | 166 | 6 | 18.44 |
| 12 | N. Chiao Tung U. | 7 | 232 | 7 | 33.14 | U. Twente | 9 | 143 | 6 | 15.89 |
| 13 | U. Aberdeen | 7 | 168 | 7 | 24.00 | U. New Mexico | 8 | 205 | 6 | 25.63 |
| 14 | KAIST Korea | 10 | 86 | 6 | 8.60 | Portland St. U. | 11 | 198 | 5 | 18.00 |
| 15 | U. Twente | 9 | 119 | 6 | 13.22 | IST Lisboa | 11 | 90 | 5 | 8.18 |
| 16 | Lappeenranta U. T. | 7 | 199 | 6 | 28.43 | U. Cambridge | 9 | 121 | 5 | 13.44 |
| 17 | NUI Galway | 6 | 116 | 6 | 19.33 | Erasmus U. | 9 | 61 | 5 | 6.78 |
| 18 | Complutense U. | 6 | 108 | 6 | 18.00 | U. Texas Austin | 8 | 167 | 5 | 20.88 |
| 19 | MIT | 6 | 90 | 6 | 15.00 | Nat. Tsing Hua U. | 8 | 68 | 5 | 8.50 |
| 20 | Open U. UK | 11 | 143 | 5 | 13.00 | U. Pretoria | 6 | 87 | 5 | 14.50 |
| 21 | Erasmus U. | 10 | 149 | 5 | 14.90 | Aalto U. | 6 | 75 | 5 | 12.50 |
| 22 | Chalmers U. Tech. | 8 | 104 | 5 | 13.00 | Tilburg U. | 6 | 59 | 5 | 9.83 |
| 23 | Polytech U. Milan | 8 | 81 | 5 | 10.13 | Carnegie M. U. | 5 | 140 | 5 | 28.00 |
| 24 | Linkoping U. | 7 | 128 | 5 | 18.29 | Cardiff U. | 5 | 106 | 5 | 21.20 |
| 25 | Seoul National U. | 7 | 93 | 5 | 13.29 | Nat. Chi Nan U. | 5 | 71 | 5 | 14.20 |
| 26 | Imperial C. Lond. | 6 | 155 | 5 | 25.83 | George Mason U. | 7 | 104 | 4 | 14.86 |
| 27 | U. Granada | 6 | 100 | 5 | 16.67 | U. Beira Interior | 6 | 105 | 4 | 17.50 |
| 28 | Tilburg U. | 6 | 83 | 5 | 13.83 | Hebrew U. Jerusal. | 6 | 73 | 4 | 12.17 |
| 29 | U. Quebec | 6 | 75 | 5 | 12.50 | Harvard U. | 5 | 127 | 4 | 25.40 |
| 30 | Cardiff U. | 5 | 107 | 5 | 21.40 | Maastricht U. | 5 | 110 | 4 | 22.00 |
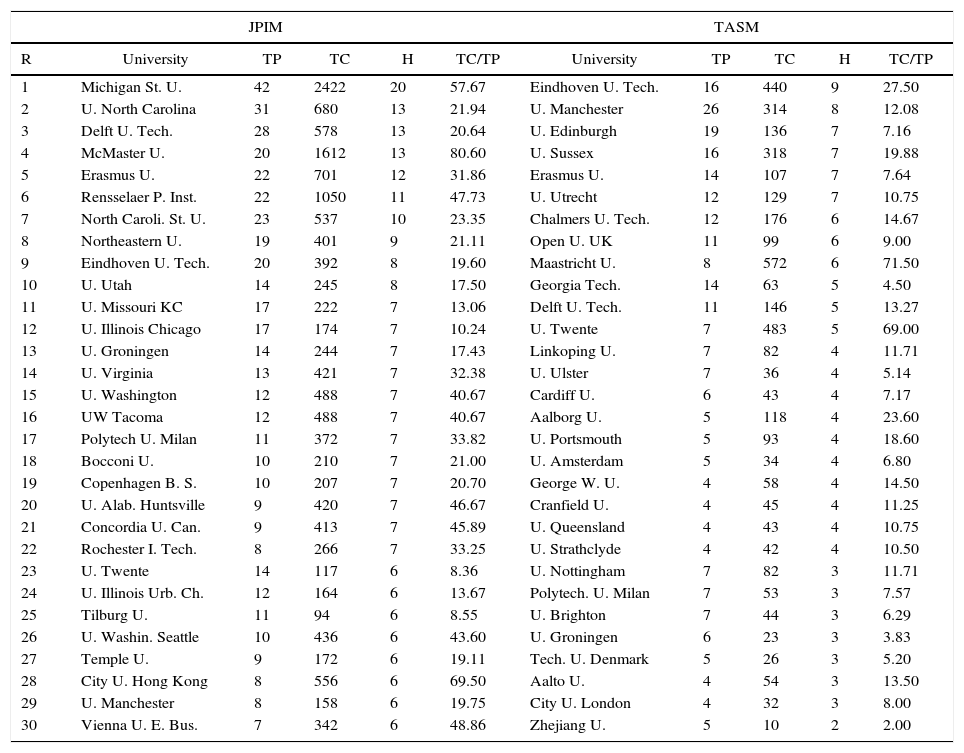
In Technovation, the UK and Netherlands universities are clearly leading the journal. However, different universities from different countries (Finland, Japan, Korea, Spain and Italy) publish in this journal. The USA universities do not publish so much in this journal although George Washington U. and MIT are some exceptions. In Technological Forecasting and Social Change it is possible to observe that this journal is more diverse and many universities, not only from UK, USA or Netherlands, regularly publish their research. However, according to the number of publications and citations, Netherlands universities are leading institutions in this journal. Table 12 shows the results for Journal of Product Innovation Management and Technology Analysis & Strategic Management.
Leading universities in innovation in Journal of Product Innovation Management (JPIM) and Technology Analysis & Strategic Management (TASM).
| JPIM | TASM | |||||||||
|---|---|---|---|---|---|---|---|---|---|---|
| R | University | TP | TC | H | TC/TP | University | TP | TC | H | TC/TP |
| 1 | Michigan St. U. | 42 | 2422 | 20 | 57.67 | Eindhoven U. Tech. | 16 | 440 | 9 | 27.50 |
| 2 | U. North Carolina | 31 | 680 | 13 | 21.94 | U. Manchester | 26 | 314 | 8 | 12.08 |
| 3 | Delft U. Tech. | 28 | 578 | 13 | 20.64 | U. Edinburgh | 19 | 136 | 7 | 7.16 |
| 4 | McMaster U. | 20 | 1612 | 13 | 80.60 | U. Sussex | 16 | 318 | 7 | 19.88 |
| 5 | Erasmus U. | 22 | 701 | 12 | 31.86 | Erasmus U. | 14 | 107 | 7 | 7.64 |
| 6 | Rensselaer P. Inst. | 22 | 1050 | 11 | 47.73 | U. Utrecht | 12 | 129 | 7 | 10.75 |
| 7 | North Caroli. St. U. | 23 | 537 | 10 | 23.35 | Chalmers U. Tech. | 12 | 176 | 6 | 14.67 |
| 8 | Northeastern U. | 19 | 401 | 9 | 21.11 | Open U. UK | 11 | 99 | 6 | 9.00 |
| 9 | Eindhoven U. Tech. | 20 | 392 | 8 | 19.60 | Maastricht U. | 8 | 572 | 6 | 71.50 |
| 10 | U. Utah | 14 | 245 | 8 | 17.50 | Georgia Tech. | 14 | 63 | 5 | 4.50 |
| 11 | U. Missouri KC | 17 | 222 | 7 | 13.06 | Delft U. Tech. | 11 | 146 | 5 | 13.27 |
| 12 | U. Illinois Chicago | 17 | 174 | 7 | 10.24 | U. Twente | 7 | 483 | 5 | 69.00 |
| 13 | U. Groningen | 14 | 244 | 7 | 17.43 | Linkoping U. | 7 | 82 | 4 | 11.71 |
| 14 | U. Virginia | 13 | 421 | 7 | 32.38 | U. Ulster | 7 | 36 | 4 | 5.14 |
| 15 | U. Washington | 12 | 488 | 7 | 40.67 | Cardiff U. | 6 | 43 | 4 | 7.17 |
| 16 | UW Tacoma | 12 | 488 | 7 | 40.67 | Aalborg U. | 5 | 118 | 4 | 23.60 |
| 17 | Polytech U. Milan | 11 | 372 | 7 | 33.82 | U. Portsmouth | 5 | 93 | 4 | 18.60 |
| 18 | Bocconi U. | 10 | 210 | 7 | 21.00 | U. Amsterdam | 5 | 34 | 4 | 6.80 |
| 19 | Copenhagen B. S. | 10 | 207 | 7 | 20.70 | George W. U. | 4 | 58 | 4 | 14.50 |
| 20 | U. Alab. Huntsville | 9 | 420 | 7 | 46.67 | Cranfield U. | 4 | 45 | 4 | 11.25 |
| 21 | Concordia U. Can. | 9 | 413 | 7 | 45.89 | U. Queensland | 4 | 43 | 4 | 10.75 |
| 22 | Rochester I. Tech. | 8 | 266 | 7 | 33.25 | U. Strathclyde | 4 | 42 | 4 | 10.50 |
| 23 | U. Twente | 14 | 117 | 6 | 8.36 | U. Nottingham | 7 | 82 | 3 | 11.71 |
| 24 | U. Illinois Urb. Ch. | 12 | 164 | 6 | 13.67 | Polytech. U. Milan | 7 | 53 | 3 | 7.57 |
| 25 | Tilburg U. | 11 | 94 | 6 | 8.55 | U. Brighton | 7 | 44 | 3 | 6.29 |
| 26 | U. Washin. Seattle | 10 | 436 | 6 | 43.60 | U. Groningen | 6 | 23 | 3 | 3.83 |
| 27 | Temple U. | 9 | 172 | 6 | 19.11 | Tech. U. Denmark | 5 | 26 | 3 | 5.20 |
| 28 | City U. Hong Kong | 8 | 556 | 6 | 69.50 | Aalto U. | 4 | 54 | 3 | 13.50 |
| 29 | U. Manchester | 8 | 158 | 6 | 19.75 | City U. London | 4 | 32 | 3 | 8.00 |
| 30 | Vienna U. E. Bus. | 7 | 342 | 6 | 48.86 | Zhejiang U. | 5 | 10 | 2 | 2.00 |
In both, Journal of Product Innovation Management and Technology Analysis & Strategic Management, UK and Netherlands universities continue as leading institutions in each ranking. Particularly, in Journal of Product Innovation Management USA universities represent almost a third of the leading institution. In the case Technology Analysis & Strategic Management, the USA universities do not participate a lot.
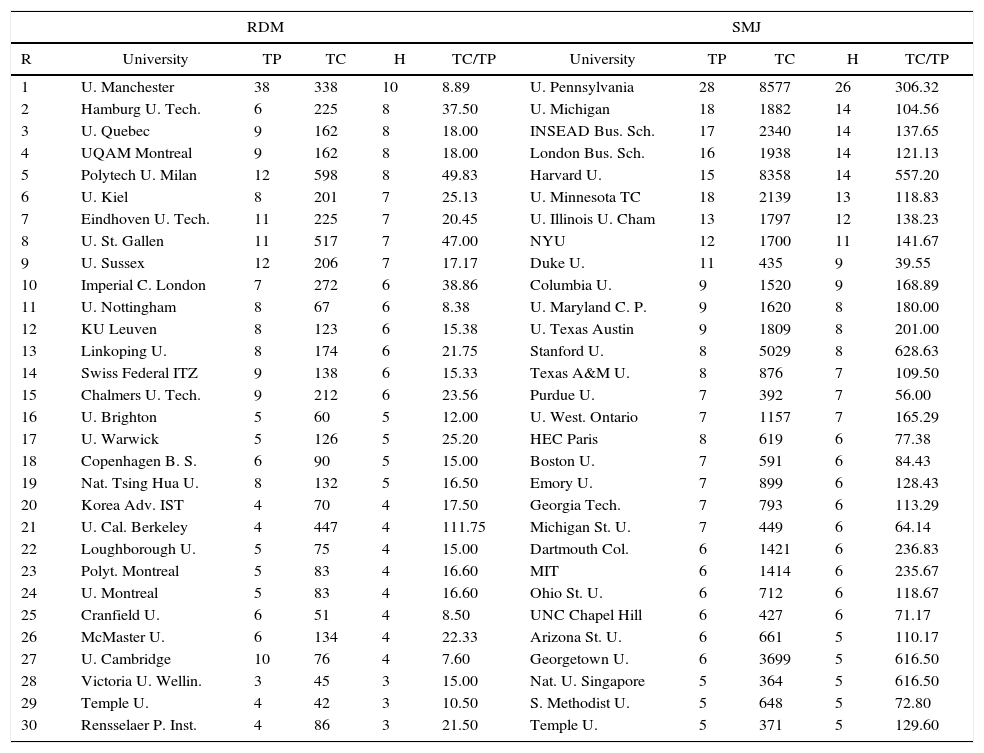
Next, Table 13 shows both, universities in the last specialized journals in innovation (according to Table 2, R&D Management) and universities in the first leading management journal (according to Table 1, Strategic Management Journal).
Leading universities in innovation in R&D Management (RDM) and Strategic Management Journal (SMJ).
| RDM | SMJ | |||||||||
|---|---|---|---|---|---|---|---|---|---|---|
| R | University | TP | TC | H | TC/TP | University | TP | TC | H | TC/TP |
| 1 | U. Manchester | 38 | 338 | 10 | 8.89 | U. Pennsylvania | 28 | 8577 | 26 | 306.32 |
| 2 | Hamburg U. Tech. | 6 | 225 | 8 | 37.50 | U. Michigan | 18 | 1882 | 14 | 104.56 |
| 3 | U. Quebec | 9 | 162 | 8 | 18.00 | INSEAD Bus. Sch. | 17 | 2340 | 14 | 137.65 |
| 4 | UQAM Montreal | 9 | 162 | 8 | 18.00 | London Bus. Sch. | 16 | 1938 | 14 | 121.13 |
| 5 | Polytech U. Milan | 12 | 598 | 8 | 49.83 | Harvard U. | 15 | 8358 | 14 | 557.20 |
| 6 | U. Kiel | 8 | 201 | 7 | 25.13 | U. Minnesota TC | 18 | 2139 | 13 | 118.83 |
| 7 | Eindhoven U. Tech. | 11 | 225 | 7 | 20.45 | U. Illinois U. Cham | 13 | 1797 | 12 | 138.23 |
| 8 | U. St. Gallen | 11 | 517 | 7 | 47.00 | NYU | 12 | 1700 | 11 | 141.67 |
| 9 | U. Sussex | 12 | 206 | 7 | 17.17 | Duke U. | 11 | 435 | 9 | 39.55 |
| 10 | Imperial C. London | 7 | 272 | 6 | 38.86 | Columbia U. | 9 | 1520 | 9 | 168.89 |
| 11 | U. Nottingham | 8 | 67 | 6 | 8.38 | U. Maryland C. P. | 9 | 1620 | 8 | 180.00 |
| 12 | KU Leuven | 8 | 123 | 6 | 15.38 | U. Texas Austin | 9 | 1809 | 8 | 201.00 |
| 13 | Linkoping U. | 8 | 174 | 6 | 21.75 | Stanford U. | 8 | 5029 | 8 | 628.63 |
| 14 | Swiss Federal ITZ | 9 | 138 | 6 | 15.33 | Texas A&M U. | 8 | 876 | 7 | 109.50 |
| 15 | Chalmers U. Tech. | 9 | 212 | 6 | 23.56 | Purdue U. | 7 | 392 | 7 | 56.00 |
| 16 | U. Brighton | 5 | 60 | 5 | 12.00 | U. West. Ontario | 7 | 1157 | 7 | 165.29 |
| 17 | U. Warwick | 5 | 126 | 5 | 25.20 | HEC Paris | 8 | 619 | 6 | 77.38 |
| 18 | Copenhagen B. S. | 6 | 90 | 5 | 15.00 | Boston U. | 7 | 591 | 6 | 84.43 |
| 19 | Nat. Tsing Hua U. | 8 | 132 | 5 | 16.50 | Emory U. | 7 | 899 | 6 | 128.43 |
| 20 | Korea Adv. IST | 4 | 70 | 4 | 17.50 | Georgia Tech. | 7 | 793 | 6 | 113.29 |
| 21 | U. Cal. Berkeley | 4 | 447 | 4 | 111.75 | Michigan St. U. | 7 | 449 | 6 | 64.14 |
| 22 | Loughborough U. | 5 | 75 | 4 | 15.00 | Dartmouth Col. | 6 | 1421 | 6 | 236.83 |
| 23 | Polyt. Montreal | 5 | 83 | 4 | 16.60 | MIT | 6 | 1414 | 6 | 235.67 |
| 24 | U. Montreal | 5 | 83 | 4 | 16.60 | Ohio St. U. | 6 | 712 | 6 | 118.67 |
| 25 | Cranfield U. | 6 | 51 | 4 | 8.50 | UNC Chapel Hill | 6 | 427 | 6 | 71.17 |
| 26 | McMaster U. | 6 | 134 | 4 | 22.33 | Arizona St. U. | 6 | 661 | 5 | 110.17 |
| 27 | U. Cambridge | 10 | 76 | 4 | 7.60 | Georgetown U. | 6 | 3699 | 5 | 616.50 |
| 28 | Victoria U. Wellin. | 3 | 45 | 3 | 15.00 | Nat. U. Singapore | 5 | 364 | 5 | 616.50 |
| 29 | Temple U. | 4 | 42 | 3 | 10.50 | S. Methodist U. | 5 | 648 | 5 | 72.80 |
| 30 | Rensselaer P. Inst. | 4 | 86 | 3 | 21.50 | Temple U. | 5 | 371 | 5 | 129.60 |
In R&D Management, last specialized journals of Table 2, some universities from UK, Germany, Canada, Italy and Netherlands are in the best position of the ranking. For us, the more interesting case is the Italy universities position, particularly Polytechnic University of Milan, which is ranked as the most influential institution in the journal. On the other hand, Strategic Management Journal is the first leading management journals that Table 1 shows. Here, several USA universities get very good positions in the ranking, being Pennsylvania U. not only the most productive institution, but also the most influential university in this journal. Note that for the leading management journals that start in Table 13 and continues in Tables 14 and 15, the ranking is based also on the h-index. But now, in the case of a tie, the ranking depends first on the number of citations.
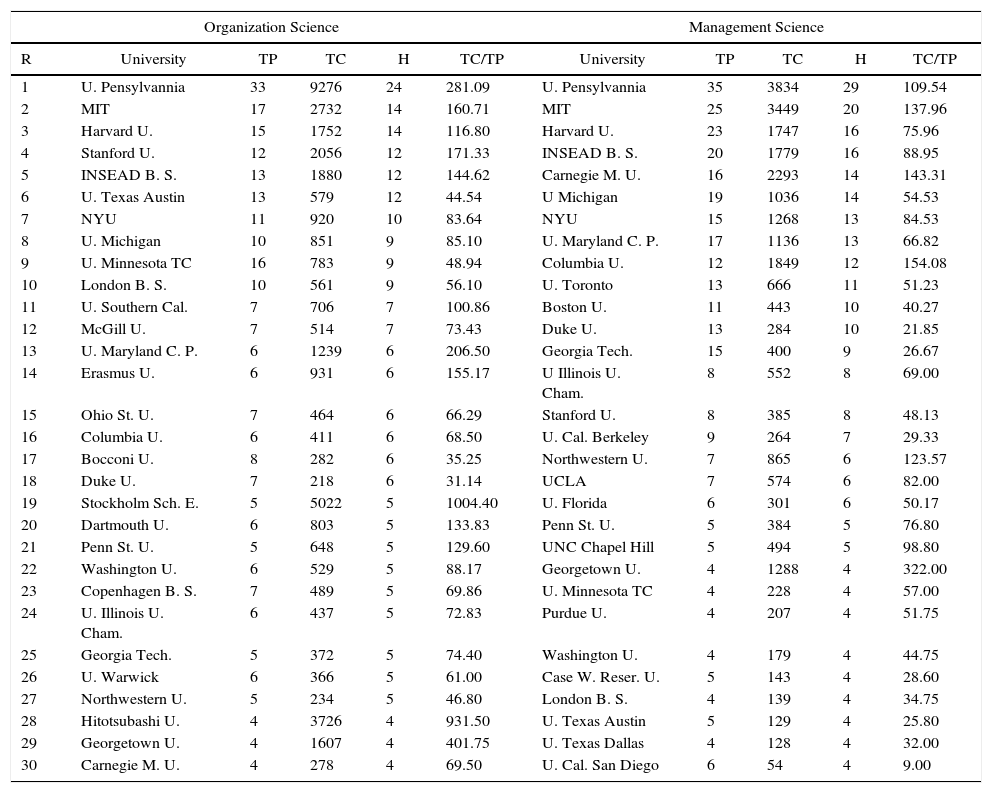
Leading universities in innovation in Organization Science and Management Science.
| Organization Science | Management Science | |||||||||
|---|---|---|---|---|---|---|---|---|---|---|
| R | University | TP | TC | H | TC/TP | University | TP | TC | H | TC/TP |
| 1 | U. Pensylvannia | 33 | 9276 | 24 | 281.09 | U. Pensylvannia | 35 | 3834 | 29 | 109.54 |
| 2 | MIT | 17 | 2732 | 14 | 160.71 | MIT | 25 | 3449 | 20 | 137.96 |
| 3 | Harvard U. | 15 | 1752 | 14 | 116.80 | Harvard U. | 23 | 1747 | 16 | 75.96 |
| 4 | Stanford U. | 12 | 2056 | 12 | 171.33 | INSEAD B. S. | 20 | 1779 | 16 | 88.95 |
| 5 | INSEAD B. S. | 13 | 1880 | 12 | 144.62 | Carnegie M. U. | 16 | 2293 | 14 | 143.31 |
| 6 | U. Texas Austin | 13 | 579 | 12 | 44.54 | U Michigan | 19 | 1036 | 14 | 54.53 |
| 7 | NYU | 11 | 920 | 10 | 83.64 | NYU | 15 | 1268 | 13 | 84.53 |
| 8 | U. Michigan | 10 | 851 | 9 | 85.10 | U. Maryland C. P. | 17 | 1136 | 13 | 66.82 |
| 9 | U. Minnesota TC | 16 | 783 | 9 | 48.94 | Columbia U. | 12 | 1849 | 12 | 154.08 |
| 10 | London B. S. | 10 | 561 | 9 | 56.10 | U. Toronto | 13 | 666 | 11 | 51.23 |
| 11 | U. Southern Cal. | 7 | 706 | 7 | 100.86 | Boston U. | 11 | 443 | 10 | 40.27 |
| 12 | McGill U. | 7 | 514 | 7 | 73.43 | Duke U. | 13 | 284 | 10 | 21.85 |
| 13 | U. Maryland C. P. | 6 | 1239 | 6 | 206.50 | Georgia Tech. | 15 | 400 | 9 | 26.67 |
| 14 | Erasmus U. | 6 | 931 | 6 | 155.17 | U Illinois U. Cham. | 8 | 552 | 8 | 69.00 |
| 15 | Ohio St. U. | 7 | 464 | 6 | 66.29 | Stanford U. | 8 | 385 | 8 | 48.13 |
| 16 | Columbia U. | 6 | 411 | 6 | 68.50 | U. Cal. Berkeley | 9 | 264 | 7 | 29.33 |
| 17 | Bocconi U. | 8 | 282 | 6 | 35.25 | Northwestern U. | 7 | 865 | 6 | 123.57 |
| 18 | Duke U. | 7 | 218 | 6 | 31.14 | UCLA | 7 | 574 | 6 | 82.00 |
| 19 | Stockholm Sch. E. | 5 | 5022 | 5 | 1004.40 | U. Florida | 6 | 301 | 6 | 50.17 |
| 20 | Dartmouth U. | 6 | 803 | 5 | 133.83 | Penn St. U. | 5 | 384 | 5 | 76.80 |
| 21 | Penn St. U. | 5 | 648 | 5 | 129.60 | UNC Chapel Hill | 5 | 494 | 5 | 98.80 |
| 22 | Washington U. | 6 | 529 | 5 | 88.17 | Georgetown U. | 4 | 1288 | 4 | 322.00 |
| 23 | Copenhagen B. S. | 7 | 489 | 5 | 69.86 | U. Minnesota TC | 4 | 228 | 4 | 57.00 |
| 24 | U. Illinois U. Cham. | 6 | 437 | 5 | 72.83 | Purdue U. | 4 | 207 | 4 | 51.75 |
| 25 | Georgia Tech. | 5 | 372 | 5 | 74.40 | Washington U. | 4 | 179 | 4 | 44.75 |
| 26 | U. Warwick | 6 | 366 | 5 | 61.00 | Case W. Reser. U. | 5 | 143 | 4 | 28.60 |
| 27 | Northwestern U. | 5 | 234 | 5 | 46.80 | London B. S. | 4 | 139 | 4 | 34.75 |
| 28 | Hitotsubashi U. | 4 | 3726 | 4 | 931.50 | U. Texas Austin | 5 | 129 | 4 | 25.80 |
| 29 | Georgetown U. | 4 | 1607 | 4 | 401.75 | U. Texas Dallas | 4 | 128 | 4 | 32.00 |
| 30 | Carnegie M. U. | 4 | 278 | 4 | 69.50 | U. Cal. San Diego | 6 | 54 | 4 | 9.00 |
Leading universities in innovation in Academy of Management Journal (AMJ) and Review (AMR) and other selected journals (OSJ).
| AMJ & AMR | OSJa | |||||||||
|---|---|---|---|---|---|---|---|---|---|---|
| R | University | TP | TC | H | TC/TP | University | TP | TC | H | TC/TP |
| 1 | U. Pennsylvania | 16 | 2660 | 15 | 166.25 | U. Minnesota TC | 28 | 5594 | 19 | 199.79 |
| 2 | Stanford U. | 13 | 2583 | 12 | 198.69 | U. Maryland C. P. | 19 | 4247 | 19 | 223.53 |
| 3 | Texas A&M U. | 11 | 3905 | 11 | 161.08 | Erasmus U. | 22 | 814 | 18 | 37.00 |
| 4 | Arizona St. U. | 12 | 1933 | 11 | 355.00 | Texas A&M U. | 16 | 1958 | 16 | 70.50 |
| 5 | UW Tacoma | 11 | 1643 | 11 | 149.36 | Michigan St. U. | 20 | 2430 | 15 | 121.50 |
| 6 | Harvard U. | 12 | 2881 | 10 | 240.08 | Georgia St. U. | 15 | 2288 | 14 | 152.53 |
| 7 | London Bus. Sch. | 9 | 2013 | 9 | 223.67 | Indiana U. Bloom. | 17 | 1451 | 13 | 85.35 |
| 8 | U. Washin. Seattle | 9 | 1426 | 9 | 158.44 | U. Texas Austin | 13 | 1244 | 13 | 95.69 |
| 9 | U. Maryland C. P. | 8 | 1730 | 8 | 216.25 | U. Pennsylvania | 16 | 2099 | 12 | 131.19 |
| 10 | U. Michigan | 9 | 2189 | 7 | 243.22 | U. Southern Cal. | 14 | 1594 | 12 | 79.71 |
| 11 | Columbia U. | 7 | 1798 | 7 | 256.86 | U. South Car. Colu. | 15 | 1020 | 11 | 68.00 |
| 12 | NYU | 7 | 1499 | 7 | 214.14 | U. West. Ontario | 12 | 1010 | 11 | 43.08 |
| 13 | U. Southern Cal. | 7 | 1488 | 7 | 212.57 | U. Connecticut | 12 | 585 | 11 | 41.00 |
| 14 | Emory U. | 7 | 1293 | 7 | 184.71 | Rensselaer P. Inst. | 13 | 560 | 11 | 48.75 |
| 15 | U. Minnesota TC | 7 | 1151 | 7 | 164.43 | Imperial C. Lond. | 12 | 492 | 11 | 84.17 |
| 16 | INSEAD B. S. | 8 | 627 | 7 | 78.38 | UNC Chapel Hill | 12 | 1357 | 10 | 49.67 |
| 17 | UNC Chapel Hill | 6 | 1190 | 6 | 198.33 | U. Georgia | 10 | 1038 | 10 | 81.50 |
| 18 | Carnegie M. U. | 6 | 937 | 6 | 156.17 | Clemson U. | 12 | 978 | 10 | 113.08 |
| 19 | Boston U. | 6 | 680 | 6 | 113.33 | Case W. Reser. U. | 12 | 596 | 10 | 103.80 |
| 20 | U. Illinois U. Cham. | 6 | 474 | 6 | 79.00 | London B. S. | 9 | 931 | 9 | 66.36 |
| 21 | U. Texas Austin | 7 | 332 | 6 | 47.43 | Temple U. | 10 | 903 | 9 | 37.82 |
| 22 | U. Wisconsin Mad. | 5 | 2164 | 5 | 432.80 | Georgia Tech. | 10 | 771 | 9 | 77.10 |
| 23 | U. South Car. Colu. | 5 | 1786 | 5 | 357.20 | City U. London | 11 | 730 | 9 | 90.30 |
| 24 | U. Oklahoma | 5 | 1064 | 5 | 212.80 | York U. Canada | 11 | 416 | 9 | 103.44 |
| 25 | George Wash. U. | 5 | 894 | 5 | 178.80 | U. Washington | 9 | 1638 | 8 | 182.00 |
| 26 | Purdue U. | 6 | 704 | 5 | 117.33 | U. Illinois Chicago | 9 | 1117 | 8 | 124.11 |
| 27 | Imperial C. Lond. | 5 | 223 | 5 | 44.60 | Arizona St. U. | 10 | 778 | 8 | 77.80 |
| 28 | Hong Kong UST | 5 | 206 | 5 | 41.20 | U. British Columbia | 9 | 728 | 8 | 80.89 |
| 29 | Georgia Tech. | 4 | 1101 | 4 | 275.25 | Penn St. U. | 9 | 695 | 8 | 77.22 |
| 30 | Clemson U. | 4 | 567 | 4 | 141.75 | Duke U. | 8 | 734 | 7 | 33.90 |
In the following Tables, we continue our analysis with the focus on leading management journals. Table 14 presents the leading universities in innovation research in Organization Science and Management Science.
The USA universities get the first position in both journals. Now, Organization Science and Management Science are journals dominated by USA institutions than represent more than the 75% and 90% of their total number of publications, respectively. However, INSEAD Business School and London Business School, are two interesting cases in both journals. For example, INSEAD obtains very good results in both journals being in the fifth and fourth position, respectively. London Bus. Sch., obtains good results too being in the tenth in Organization Science and twenty-seventh in Management Science. With respect to the leading university of Organization Science and Management Science, Pennsylvania U. continues as the most productive and influential university in both journals.
Finally, Table 15 presents the results for two groups of journals. The first one includes the Academy of Management Journal and the Academy of Management Review. The second group includes the Journal of Business Venturing, Journal of International Business Studies, Journal of Management, Journal of Management Studies, Journal of Marketing, and MIS Quarterly.
In the Academy of Management Journals, the USA universities are clearly the leading universities and the rest of the universities from Europe or Asia do no publish many papers (some exceptions come from UK, Netherlands and France). In the other selected journals the results are also similar although the differences between the USA universities and the rest are not important.
ConclusionsThis article provides a general bibliometric overview of the most influential and productive universities in innovation research between 1989 and 2013. The number of publications, citation structure and h-index during this period are considered. The results show that the most prestigious American universities are not only the most influential, taking into account the number of citations of their publications, but are also highly productive universities in this area, given the greater number of publications that they have accumulated on innovation research in the last twenty five years. There are also some universities in the UK, France and the Netherlands which are worth mentioning. They not only appear in the top 20 of our ranking, but their presence increases as we reach the list of top 100 universities, especially those in the UK and Netherlands. The influence of these universities in research innovation primarily comes from publishing in specialized journals that have been created in Europe.
The novelty of this paper, unlike other rankings developed, is that in its methodology it analyzes the h-index of each university in terms of their publications on innovation. The h-index is an indicator which combines articles with citations, indicating the number of studies X that have received X or more citations. The results of this paper, as per the h-index analysis show that the most influential universities in the field of innovation are: the University of Pennsylvania, Harvard University, MIT, Stanford University, University of California Berkeley and Columbia University, all located in the USA. The most influential universities in UK would be the University of Sussex, London Business School and The University of Manchester. In France, the most influential would be INSEAD Business School. Finally, the most influential universities in the Netherlands are Erasmus University, Eindhoven University of Technology and Maastricht University.
The ranking presented in this paper, aside from the h-index, offers a few additional indicators, such as the total number of publications in Innovation (TPI) and the total number of citations accumulated in innovation (TCI). This permits us to see that universities with the highest h-index are not always those that produce the largest number of publications. It is possible to say that universities with higher h-index are more influential, but not necessarily those with the highest number of publications in innovation. Still, in many cases it does occur, mainly with the universities in the top 10 ranking.
In order to deepen the above analysis, the ranking presented also shows the analysis of the h-index, productivity and citations pertaining to the publications in the seven specialized journals on innovation research of each public university. In this regard, it is notable that although US universities have published a significant number of papers, European universities have been making strong efforts to publish on innovation in the last 25 years. In general terms, effort from universities in the UK and Netherlands to publish in the more specialized journals on innovation research has been greater. This could be biased due to the origin of the more specialized journals such as Research Policy, International Journal of Technology Management and Technovation, which are mainly European.
The results of this paper are particularly different from those earlier studies, such as by Linton (2004), which only considered American institutions in its analysis. The differences found are natural, particularly because the effort certain European universities are making in the study of innovation research has been very important and have therefore come a long way in terms of the number of publications on the subject. At the same time, the fact that we use the h-index as a leading indicator, instead of just considering the number of publications to do the ranking, as suggested by Yang and Tao (2012), we can do a much more thorough analysis and discover not only the most productive universities in innovation research but also the most influential.
Although we believe the results found in this paper are valuable, we still see need to further develop studies to complement the analysis of what the most influential universities in innovation research are, who the most prominent authors are and which journals have greater impact and influence on the material. Furthermore, a comparison of variation of results over the years could be very important.