

Prior literature on corporate governance and performance provides mixed evidence on the impact of various corporate governance measures on performance indicators. However, most of literatures adopt the Ordinary Least Square (OLS). This method is based on the central tendency, which may not appropriately represent the reality in cases where the dependent variable ranges between upper and lower values and hence the relationship may not be homogenous across different percentiles of the dependent variables. A variable having a positive impact based on the central tendency for firms may not be the case for the firms in the upper or lower bounds. Thus, estimating the means using OLS may not reflect and represent the heterogeneity in the estimated relationship. Therefore, quantile regression estimates the relationship at any point conditional on the distribution of dependent variable. This would enable us to generate various estimated coefficient at certain quantile of dependent variable. Therefore, the objective of the study is twofold. First, this study aims to investigate the relationship between corporate governance and performance using OLS. Second, this work further explores the impact of corporate governance mechanisms on performance using quantile regression so as to compare and to shed light on whether there is heterogeneity in the influence of these variables on the performance of listed companies across quantiles. The results of the study provide evidence that quantile approach shows inconsistency in the result with OLS and hence indicating the impact depends on the scale size. This theoretically provides further support that OLS may represent a poor estimation approach for the reality of firms.
La literatura previa sobre gobierno corporativo y desempeño aporta una evidencia mixta del impacto de las diversas mediciones del mismo sobre los indicadores del desempeño. Sin embargo, gran parte de la literatura adopta el método de los mínimos cuadrados ordinarios (MCO). Dicho método se basa en la tendencia central, que puede no constituir una representación adecuada de la realidad en aquellos casos en los que la variable dependiente oscila entre los valores superior e inferior y, por tanto, la relación puede no ser homogénea a lo largo de los diferentes percentiles de las variables dependientes. Una variable que tenga un impacto positivo basado en la tendencia central para las empresas puede no ser el caso para aquellas posicionadas en los límites superior o inferior. Entonces, el cálculo de las medias con el uso del método MCO no reflejaría ni representaría la heterogeneidad en la relación estimada. Por ello, la regresión de cuantiles calcula la relación en cualquier punto, supeditado a la distribución de la variable dependiente. Esto nos permitiría generar diversos coeficientes estimados en cualquier cuantil de la variable dependiente. En consecuencia, el objetivo de este estudio es doble: investiga la relación entre el gobierno corporativo y el desempeño, utilizando el método MCO y explora el impacto de los mecanismos del gobierno corporativo sobre el desempeño, utilizando la regresión de cuantiles, a fin de comparar y arrojar luz sobre la posibilidad de que exista heterogeneidad en la influencia de dichas variables sobre el desempeño de las empresas cotizadas, a lo largo de los cuantiles. Los resultados del estudio aportan evidencia acerca de que el enfoque de los cuantiles es inconsistente con el método MCO y, por tanto, indica que el impacto depende del tamaño de la escala. Esto respalda, además, el hecho de que el método MCO puede representar un enfoque de cálculo más débil para la realidad de las empresas.
One of the most challenging issues for the managers of corporation is to create value for the shareholders through the enhancement of corporate performance. However, under the agency theory managers may not optimize the shareholders’ interests as they wish. Thus, for many, there is a firm belief that good corporate governance practices would enhance the performance and represents a check and balance on the managers’ behavior of non-optimization of the shareholders goals of value creation. Research provides evidence on such relationship in developed countries and emerging markets. Asian countries including Malaysia have paid more attention to the importance of corporate governance and it has gained its momentous since last two decades (Mak & Kusnadi, 2005). With their moving into international practice of corporate governance, many countries in Asian region have adopted the best practices so as to have the expected impact on their performance and maximization of their shareholders wealth. However, despite their commitment to implement good governance practices amid the international changes, the evidences revealed that corporate governance practices are more of window dressing rather than reality (Chuanrommanee & Swierczek, 2007) and provide a mixed evidence on the impact of corporate governance on firm performance (Ghazali, 2010; Sanni & Ahmed Haji, 2012; Har Sani Mohamed et al., 2012; Ahmed Haji, 2014; Shawtari et al., 2015). The possible reason for this trend is that the prior literature have examined the corporate governance and performance using Ordinary Least Square (OLS), which relies on the mean as measure of central tendency. This concept may not be properly addressing the situation whenever the performance has a various ranges between upper and lower magnitude. The implication of this is that the relationship between corporate governance index and performance might be differed from one range to another (Sánchez-Vidal, 2014; Kang & Liu, 2014; Chi et al., 2015; Chevapatrakul, 2015; Marrocu et al., 2015). In other words, as the dependent variable takes the ranges between upper and lower values, it will result in having a number of percentiles of dependent variable, in which its relationship with corporate governance varies from one percentile to another. Therefore, estimating the relationship based on the averaged figures or means may not reflect the reality and would hide some information due to heterogeneity of the data. As such using the quantile regression would provide a better estimate for the relationship between dependent and independent variables as the analysis estimate the relationship at any point conditional on the distribution of dependent variable. This study adds to the literature in the area of corporate governance adopting a unique approach to test the relationship with the performance. Furthermore, the paper explores the impact of intense monitoring on the performance of Malaysian listed companies, which is considered as a new avenue that has been overlooked in previous studies and hence adds value to the governance studies. Finding whether board's intensity of monitoring adds value to the corporate governance of firms or just follow the same patterns of a window dressing might offer a further insight on the effectiveness of board's committees. Intense monitoring refers to situation wherever any member of board sits on more than two board committees. We expect that setting on more board committees help to enhance performance as the ability of the directors to have a better oversight and look over the company's operation. The argument is that intense monitoring through setting on more than two committees would focus the directors’ attention to the performance more than the other function, which is advising function. So, consequences of directors being on more than committees are their ability to monitor better and hence enhance performance through their decisions taken as a result of wider knowledge gained from the commitment to the board committees and their exposure to various issues concerning company's performance.
Building on the above, this study aims to firstly explore the impact of corporate governance mechanisms on performance of Malaysia listed companies with specific focus on board characteristics that emphasize substance than forms. Second, how the intensity of monitoring may impact the performance of companies. Methodologically, this research examines the impact of these variables on market based performance using OLS method for the purpose of comparison with quantiles regression method. The findings of the study show that there is heterogeneity in the relationship between corporate governance and performance for the intense monitoring and directorships. This relationship relies to certain extent on the scale of performance.
The remainder of the paper is organized as follows: Section 2 reviews the literature and discusses the hypotheses development. Section 3 describes the sample and methodological design of the study. Section 4 presents the findings and Section 5 concludes the paper.
2Literature review and hypothesis developmentA myriad of literature have explored the impact of corporate governance and performance across the globe (Jensen, 1993; Yermack, 1996; Dalton et al., 1999; Coles & Hesterly, 2000; Elsayed, 2007; Bhagat & Bolton, 2008; Ghazali, 2010; Sanni & Ahmed Haji, 2012; Har Sani Mohamad et al., 2012; Ahmed Haji, 2014; Ahmed Haji & Mubaraq, 2015; Shawtari et al., 2015). Over the past decades, these studies provide inconclusive evidence on the relationship between corporate governance and performance across the countries and particularly for Malaysia. Several indicators might signal the mixed findings, some of which are the various governance structure, context and methodological approaches. This paper's argument is grounded on different estimation method which could produce different results. For the particular case of Malaysia, the extant literature have adopted various approaches and produced a mixed conclusions and most of them have some indications of ineffectiveness of the corporate governance, for example, Abdul Rahman and Haniffa (2005), Sanni and Ahmed Haji (2012), Har Sani Mohamed et al. (2012), Shawtari et al. (2015). Therefore, this paper attempts to provide evidence using another estimation approach with aim of providing reconciliation for the conflicting results.
Various governance measures have been used by prior literature in a link with corporate performance indicators. In this study, we highlight some of the corporate governance variables and the focus will be given to the committee intensity of monitoring, board meetings, directorships of the board members, ownership of the directors and board size, with firm size and leverage being as control variables.
Firstly, intense monitoring of directors (INTENSE) is measured by the number of committees each director setting on. It is argued that whenever the director is setting on more than two committees, it is considered as intense monitoring. Prior literature suggests that emphasizing more on monitoring function through more involvement in boards’ committee will shift the focus of directors to monitoring action rather than advising function (Faleye et al., 2011; Kim et al., 2014). These authors argued that monitoring performance comes at the expense of advising performance as both roles will compete for time and focus. Since board role has two functions, monitoring and advising, the more focus on monitoring may lead to more time devoted to and hence the advising function will be sacrificed. Setting on more committees would able directors to have a better knowledge regarding operational issues and this requires attention on these issues and hence deprives them from focusing on more strategic issues “advising role”. Therefore, we expect that intense monitoring will contribute more to better performance over advising function, therefore, following hypothesis:H1 There is a significant positive relationship between intensity of monitoring and firm's performance.
Second, directors’ equity ownership (DOSHIP) or board member equity ownership is measured by percentage of the ownership of directors out of total equity. Prior studies argued that with board ownership, the oversight of board of directors on management would increase and their monitoring activities on managers are more likely to be more diligent (Jensen, 1993, Chi et al., 2015). Bhagat and Bolton (2013) find that firm performance is positively related to stock ownership of board members. Therefore, we propose the following hypothesis:H2 There is a significant positive relationship between directors’ equity ownership and firm's performance.
Third, board meetings (BMEET) which measured by the average number of meeting of board members is another contributing factor that has been discussed in literature and is associated with firm performance and valuation. Vafeas (1999) and Adams et al. (2005) opine that board activity through their meeting is an important factor influencing the performance. Both studies provide support that past poor performance is related inversely with the board meetings. Brick and Chidambaran (2010) find that board activity has positive impact on firm valuation. In Malaysian context, While Sanni and Ahmed Haji (2012) find no association between board meeting and performance, Ahmed Haji (2014) finds a negative association with performance in a period of 2009. Despite the conflicting results, we expect the more meetings, the more involvement and discussion on various issues related to performance and other operations. Therefore, we propose the following hypothesis:H3 There is a significant positive relationship between board meeting and firm's performance.
Fourth, multiple directorship (DSHIP) is another important element that may have its contribution to the performance of firms. According to Pombo and Gutiérrez (2011), the multiple directorships occur when the director or the member of the board set on the board of more than one corporation and consequently generating interlock among the companies. Jiraporn et al. (2009) argue that serving on multiple boards can be explained by two different perspectives. The first perspective is the reputation hypothesis whereby the director develops expertise and hence becomes a signal or indicator of the ability of the director with outstanding and greater diversity of experience or extensive experience and knowledge. They further opine that this would lead to positive effect on firm behavior due to wide expertise gained from serving in various firms and industries. On the other hand, the other perspective is the busyness hypothesis in which serving on more than one board could be an indicator of inability of directors to monitor the company appropriately (Ferris et al., 2003). According to them, the ability of directors holding more than one seat to serve on different board committees will be reduced and the company willingness to assign different committees to those directors to serve on will be diminished, as their monitoring would be affected accordingly. In the Malaysian context, both Mak and Kusnadi (2005) and Ghazali (2010) find no association, which has been supported by Ahmed Haji (2014). Although evidence from prior research (Pombo & Gutiérrez, 2011, Jiraporn et al., 2009, Ferris et al., 2003) is mixed, we argue that holding more directorships will reduce the monitoring activities by directors and hence affecting performance negatively as the directors will be less committed and less time devoted to monitoring of the company, which is in line with the busyness hypothesis. Therefore, we propose the following hypothesis:H4 There is a significant negative relationship between directorships and firm's performance.
Fifth, board size (BSIZE) is measured by the number of board members on the board. Lipton and Lorsch (1992) and Jensen (1993) propose that board with large number tends to have a problem of communication and social loafing and require higher coordination costs. Empirically, Yermack (1996) provides evidence that market valuation is negatively related to board size. This lends support to the argument surrender by Lipton and Lorsch (1992) and Jensen (1993). Contrastly, other hold that larger board will be more efficient in monitoring as the members will be equipped with diversification in their expertise and also they are less likely to be dominated by management, consequently, their monitoring activities will be enhanced (Herman, 1981; Zahra & Pearce, 1989). Evidently, Zou and Adams (2008) support this argument with empirical finding showing that larger boards affect performance positively. In the context of Malaysia, Ghazali (2010) and Ahmed Haji (2014) find no association between board size and firm's performance.H5 There is a significant positive relationship between board size and firm's performance.
We control for firm size (total assets) and leverage. Munisi and Randoy (2013) argued that the characteristics of the companies can affect both financial performance and corporate governance structure and practices. It is expected that larger firms may perform better taking the advantages of economy of scales (Klapper & Love, 2004). Furthermore, larger firms would be able to adapt good practices stemming from the huge resources at hands. We use logarithm of total assets to proxy for the company size. Thus we propose the following hypothesis.H6 There is a significant positive relationship between firm size and corporate performance.
Similarly, leverage would be another important factor to affect the performance as the more debts, the high monitoring needed by the fund providers on the company so as to encourage them to adopt good practices of governance. In line with Sanni and Ahmed Haji (2012) and Ahmed Haji (2014) we propose the following hypothesis.H7 There is a significant negative relationship between firm size and corporate performance.
This section is devoted to discuss the data sources, sampling design and the empirical model tested in this study.
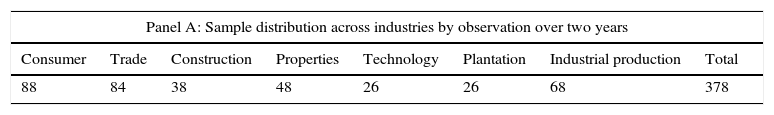
3.1Data collection and sourcesThe data for empirical analysis in this study is extracted from two sources. The first source is hand-collected data from annual report of the companies for the corporate governance variables or non-financial data, while the second source of the data is the Bloomberg database on the financial data. Overall, all sector have been included in the analysis except finance sector. The sampling process of this study follows the systematic stratified sampling, where the population is divided into different strata according to their homogeneity “i.e. industries”. Once the strata are determined, then systematic way of selection is adopted from each stratum (Cavana et al., 2001). Basically, the way is to sample every 1 in n from the sample frame. For instance, you may decide that you choose 1 in 5, where the starting point is specified. In order to make sure that the sample is adequately representative, we decide to select every 4th from the list in order to have a reasonable number of companies listed in the Bursa Malaysia. As the time of data collection, the total number of listed companies was 826 listed firms in the main market. Based on the industrial classification of Bursa Malaysia, the companies categorize into various industries namely plantation, mining, property, consumer products, industrial production, construction, trade/services, technology and finance. A sample of 210 companies is chosen, which represents 25% of Kuala Lumpur stock market for a period of 2010-2011. We filtered the data and all missing data was removed. Furthermore, observations in the financial sector were excluded as it is heavily regulated compared to other sectors as argued by Mak and Kusnadi (2005) and Har Sani Mohamad et al. (2012). This process produces a final sample with 378 observations. The distribution of the sample over sectors is shown in Table 1 Panel A. In addition, due to the adoption of quantile regression, we also show the cluster of the sample across quantiles in Table 1 Panel B.
Sample distribution.
| Panel A: Sample distribution across industries by observation over two years | |||||||
|---|---|---|---|---|---|---|---|
| Consumer | Trade | Construction | Properties | Technology | Plantation | Industrial production | Total |
| 88 | 84 | 38 | 48 | 26 | 26 | 68 | 378 |
| Panel B: Distribution of the observation across quantiles | |||||||
|---|---|---|---|---|---|---|---|
| Quantiles | 10 | 25 | 50 | 75 | 90 | Total | |
| No of observation | 65 | 87 | 80 | 89 | 57 | 378 | |
Authors’ tabulation.
The quantile regression approach is adopted in this study in a comparative manner with OLS to investigate the association between performance indicator (MARKET CAP) and corporate governance mechanisms and to establish on whether such link hold consistent or differ across the different percentile of performance. The following is the regression model for testing the relationship:

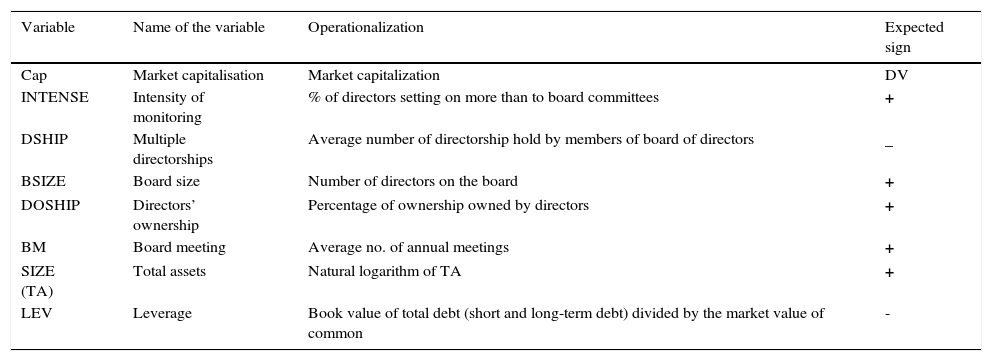
Q represents the percentile in the conditional distribution of the performance measure (CAP). The approach adopted to examine the proposed relationship is to regress the above model using OLS to obtain a relationship based on the average. It follows with the examination this relationship using five quantiles which are 10, 25, 50, 75, and 90 percent with adoption of quantile regression method and utilizing STATA package version 11 to examine the model. The dependent variable used in this study is the firm's financial performance as measured by market capitalization/market valuation. Following Chi et al. (2015), we investigate whether the governance variables may shape the performance of the company using quantile regression. Specific emphasize will be placed here on the characteristics that reflect the substance of the board of directors rather than the form. Mainly the focus will be here on the board meetings, directorships of the board members, ownership of the directors and the committee intensity of monitoring. The summary of the variables used in this model as shown in Table 2.
Summary of the variables.
| Variable | Name of the variable | Operationalization | Expected sign |
|---|---|---|---|
| Cap | Market capitalisation | Market capitalization | DV |
| INTENSE | Intensity of monitoring | % of directors setting on more than to board committees | + |
| DSHIP | Multiple directorships | Average number of directorship hold by members of board of directors | _ |
| BSIZE | Board size | Number of directors on the board | + |
| DOSHIP | Directors’ ownership | Percentage of ownership owned by directors | + |
| BM | Board meeting | Average no. of annual meetings | + |
| SIZE (TA) | Total assets | Natural logarithm of TA | + |
| LEV | Leverage | Book value of total debt (short and long-term debt) divided by the market value of common | - |
Authors’ tabulation.
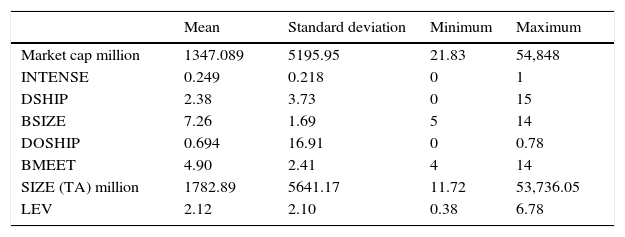
A descriptive statistics for variables are shown in Table 3. On average, Malaysian firms’ market capitalization revolves around million 1347.089 for the investigated period. On average, INTENSE variable shows that around 24.9% of directors are setting on more than two committees. The overall directorships (DSHIP) held by directors in other companies is approximately 2.38 seats, with a maximum 15 seats help by some of directors in other companies. As shown in the Table 3, a board size (BSIZE) ranges between 5 and 14 members, with an average of 7 directors. Ownership of directors (DOSHIP) shows that on average the directors have 69% of shareholding of the company, which emphasize again on the concentration of ownership as well as family ownership characterized the Malaysian stock markets. Board of directors is revealed to have around 5 meetings annually with a maximum of 14 and minimum of 4 meetings in some companies. Firm size is RM 1782.89 million, whereas the leverage of selected sample is 2.12.
Descriptive statistics.
| Mean | Standard deviation | Minimum | Maximum | |
|---|---|---|---|---|
| Market cap million | 1347.089 | 5195.95 | 21.83 | 54,848 |
| INTENSE | 0.249 | 0.218 | 0 | 1 |
| DSHIP | 2.38 | 3.73 | 0 | 15 |
| BSIZE | 7.26 | 1.69 | 5 | 14 |
| DOSHIP | 0.694 | 16.91 | 0 | 0.78 |
| BMEET | 4.90 | 2.41 | 4 | 14 |
| SIZE (TA) million | 1782.89 | 5641.17 | 11.72 | 53,736.05 |
| LEV | 2.12 | 2.10 | 0.38 | 6.78 |
Note: Market cap refers to market capitalization or valuation; INTENSE represents the intense monitoring of directors on committees; DSHIP indicates the multiple directorships; BSIZE measures the total number of directors on the board; DOSHIP refers to ownership of directors; BMEET represents average number of meetings held by the board of directors; SIZE (TA) refers to firm size and lastly, LEV represents the financial leverage.
Authors’ tabulation based on STATA output.
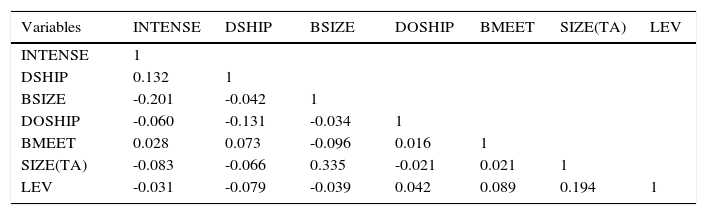
Table 4 shows that Pearson correlation matrix and Vector Inflation Factor (VIF) among the variables. The results indicate that all variables are far from being correlated. The maximum correlation coefficient is 33.5% between firm size and board size, which indicates positive and significant correlation. Board size and intensity of monitoring is negatively correlated at 20.1%, which indicates that whenever the board is getting larger, it is less likely that board members set on more than two committees. All other variables are correlated against each other with low level of correlation ranging from 2.3% to 19.4%. This suggests that it is more likely that multicollinearity is not an issue among variables. This result is supported further by VIF as shown in Table 4, where all variables VIF is less than two which is far from the threshold (10) that is suggested by literature.
Pearson correlation matrix.
| Variables | INTENSE | DSHIP | BSIZE | DOSHIP | BMEET | SIZE(TA) | LEV |
|---|---|---|---|---|---|---|---|
| INTENSE | 1 | ||||||
| DSHIP | 0.132 | 1 | |||||
| BSIZE | -0.201 | -0.042 | 1 | ||||
| DOSHIP | -0.060 | -0.131 | -0.034 | 1 | |||
| BMEET | 0.028 | 0.073 | -0.096 | 0.016 | 1 | ||
| SIZE(TA) | -0.083 | -0.066 | 0.335 | -0.021 | 0.021 | 1 | |
| LEV | -0.031 | -0.079 | -0.039 | 0.042 | 0.089 | 0.194 | 1 |
Note: INTENSE represents the intense monitoring of directors on committees; DSHIP indicates the multiple directorships; BSIZE measures the total number of directors on the board; DOSHIP refers to ownership of directors; BMEET represents average number of meetings held by the board of directors; SIZE(TA) refers to firm size and lastly, LEV represents the financial leverage.
Authors’ tabulation based on STATA output.
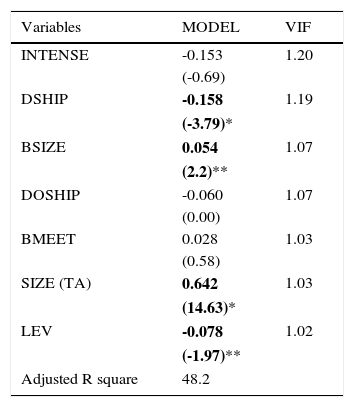
Initially, we estimate the regression model using OLS method. The results are reported in Table 5. The results as appeared in Table 5 are based the market measure (CAP). The model explains the relationship with 48.2 the value of adjusted R square. Table 5 shows that the results of the impact of corporate governance factors on performance tend to be evident in some of the variables in relation to market capitalization. The results shows that the coefficient of intense monitoring is negative, albeit is not significant suggesting that setting on more committees does not add value for the performance which is not consistent with the results of Faleye et al. (2011). Three plausible reasons might explain the results. First, prior literature suggests that corporate governance in Asian countries is not effective as its counterpart on other regions and it is more window dressing and illusion than fact (Chuanrommanee & Swierczek, 2007). Second, it could be that the directors who are having more chairs to set on are busy directors and are unable to perform their duties as monitors or it can be argued that those directors focus more advising function rather than monitoring activities. Third, this relationship might be due to heterogeneity in the data and therefore, we propose to use quantile regression to further test this relationship.
OLS estimation of the determinants of market cap.
| Variables | MODEL | VIF |
|---|---|---|
| INTENSE | -0.153 | 1.20 |
| (-0.69) | ||
| DSHIP | -0.158 | 1.19 |
| (-3.79)* | ||
| BSIZE | 0.054 | 1.07 |
| (2.2)** | ||
| DOSHIP | -0.060 | 1.07 |
| (0.00) | ||
| BMEET | 0.028 | 1.03 |
| (0.58) | ||
| SIZE (TA) | 0.642 | 1.03 |
| (14.63)* | ||
| LEV | -0.078 | 1.02 |
| (-1.97)** | ||
| Adjusted R square | 48.2 |
Note: Market cap refers to market capitalization or valuation; INTENSE represents the intense monitoring of directors on committees; DSHIP indicates the multiple directorships; BSIZE measures the total number of directors on the board; DOSHIP refers to ownership of directors; BMEET represents average number of meetings held by the board of directors; SIZE(TA) refers to firm size and lastly, LEV represents the financial leverage.
Numbers in brackets are standard errors.
*** Indicates significance at the 10% level, ** Indicates significance at the 5% level. * Indicates significance at the 1% level.
Authors’ tabulation based on STATA output.
Furthermore, we find that multiple directorships are negatively related to market capitalization. In line with prior literature which proposes that more directorships may reflect the busyness of directors in performing their duties and therefore, the spillover is negative on performance. Fich and Shivdasani (2006) support the results, in which they argue that firm value suffers when directors serve on multiple corporate boards. Inversely, size of the board is significantly (5%) and positively related to market capitalization supporting the results of Zou and Adams (2008) and inconsistent with results of Ghazali (2010) and Ahmed Haji (2014). The plausible reason for this results can be explained by the fact that larger board size tend to be equipped with more expertise, skills and the difficulty of CEO to control them. Board meetings and ownership of the directors are insignificant variables.
Our control variables are significantly related to performance measures. Size of the firms shows a significant a positive relationship with performance supporting the prior research (Ahmed Haji, 2014). Probably the larger firms may benefit from the economy of scale and their ability to produce at lower costs becomes apparent. Leverage on the other hands, reveals negative and significant relationship with performance which lent support to the results of Sanni and Ahmed Haji (2012) in which they argued that well performed companies are reluctant to seek addition funds.
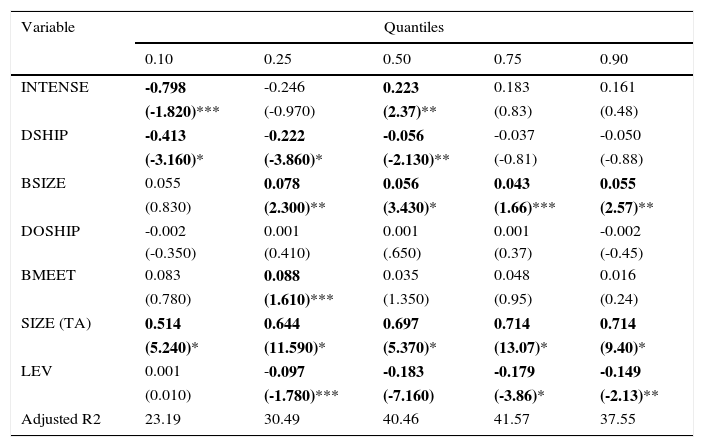
In the following step, we test the relationship in the above model using quantile regression to see whether the relationship between board characteristics and performance is unique across all scale of performance. We specify five quantiles to be tested at 10, 25, 50, 75 and 90 per cent. As it can be seen in Table 6, the various models for various quantiles with an explanatory power of all models that ranges 23.19 to 41.57. However, it can be argued that the model power are higher in the upper levels of the, which sounds reasonably justified as the larger firms are more keen to adopt the best practices of governance and hence their valuation in the market would be enhanced.
Quantiles regression of the determinants of market cap.
| Variable | Quantiles | ||||
|---|---|---|---|---|---|
| 0.10 | 0.25 | 0.50 | 0.75 | 0.90 | |
| INTENSE | -0.798 | -0.246 | 0.223 | 0.183 | 0.161 |
| (-1.820)*** | (-0.970) | (2.37)** | (0.83) | (0.48) | |
| DSHIP | -0.413 | -0.222 | -0.056 | -0.037 | -0.050 |
| (-3.160)* | (-3.860)* | (-2.130)** | (-0.81) | (-0.88) | |
| BSIZE | 0.055 | 0.078 | 0.056 | 0.043 | 0.055 |
| (0.830) | (2.300)** | (3.430)* | (1.66)*** | (2.57)** | |
| DOSHIP | -0.002 | 0.001 | 0.001 | 0.001 | -0.002 |
| (-0.350) | (0.410) | (.650) | (0.37) | (-0.45) | |
| BMEET | 0.083 | 0.088 | 0.035 | 0.048 | 0.016 |
| (0.780) | (1.610)*** | (1.350) | (0.95) | (0.24) | |
| SIZE (TA) | 0.514 | 0.644 | 0.697 | 0.714 | 0.714 |
| (5.240)* | (11.590)* | (5.370)* | (13.07)* | (9.40)* | |
| LEV | 0.001 | -0.097 | -0.183 | -0.179 | -0.149 |
| (0.010) | (-1.780)*** | (-7.160) | (-3.86)* | (-2.13)** | |
| Adjusted R2 | 23.19 | 30.49 | 40.46 | 41.57 | 37.55 |
Note: The dependent variable is market based Market which refers to market capitalization or valuation; INTENSE represents the intense monitoring of directors on committees; DSHIP indicates the multiple directorships; BSIZE measures the total number of directors on the board; DOSHIP refers to ownership of directors; BMEET represents average number of meetings held by the board of directors; SIZE (TA) refers to firm size and lastly, LEV represents the financial leverage.
The standard errors statistics are shown in parenthesis with each coefficient.
*** Indicates significance at the 10% level, ** Indicates significance at the 5% level. * Indicates significance at the 1% level.
Authors’ tabulation based on STATA output.
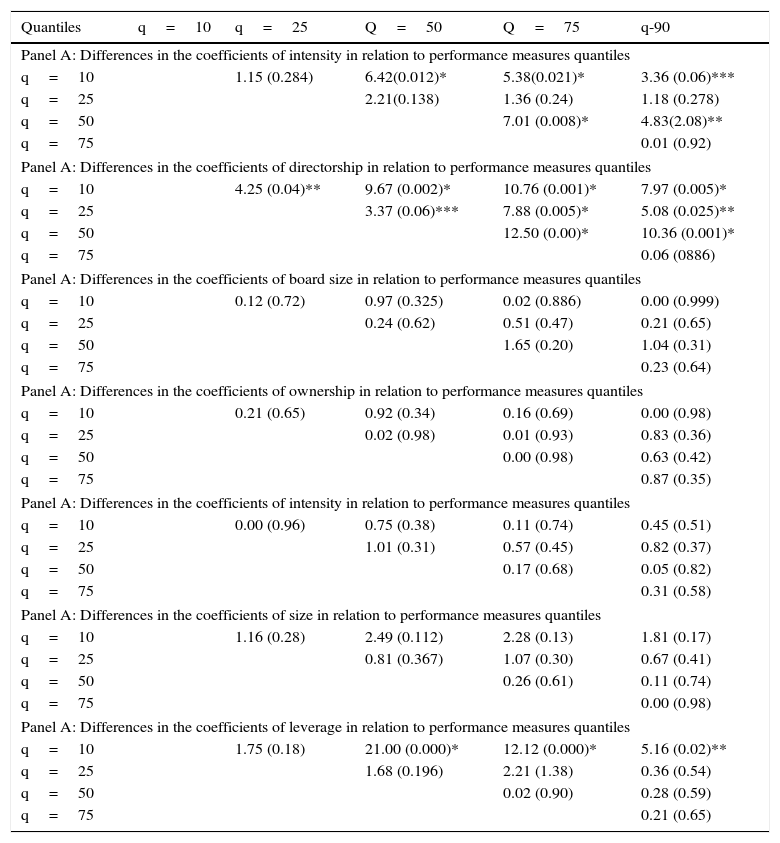
The finding in Table 6 presents that estimated coefficient for intensity of monitoring is not heterogeneous across different quantiles. While the coefficient is negative and significant (10% level of significant) at lower bound of quantiles (10% quantile), indicating that with lower bound of performance the intense monitoring leads to lower performance. Moving ahead to higher quantile (50% quantile) shows a reverse relationship indicating that intense monitoring matters positively for those companies whose performance lies at 50% quantile, after which the relationship maintains, albeit insignificant. Table 7 presents the tests of difference among different quantiles, where across the 5 quantiles, we generate 10 tests of difference.
Tests of differences in slopes of the coefficient across quantiles.
| Quantiles | q=10 | q=25 | Q=50 | Q=75 | q-90 |
|---|---|---|---|---|---|
| Panel A: Differences in the coefficients of intensity in relation to performance measures quantiles | |||||
| q=10 | 1.15 (0.284) | 6.42(0.012)* | 5.38(0.021)* | 3.36 (0.06)*** | |
| q=25 | 2.21(0.138) | 1.36 (0.24) | 1.18 (0.278) | ||
| q=50 | 7.01 (0.008)* | 4.83(2.08)** | |||
| q=75 | 0.01 (0.92) | ||||
| Panel A: Differences in the coefficients of directorship in relation to performance measures quantiles | |||||
| q=10 | 4.25 (0.04)** | 9.67 (0.002)* | 10.76 (0.001)* | 7.97 (0.005)* | |
| q=25 | 3.37 (0.06)*** | 7.88 (0.005)* | 5.08 (0.025)** | ||
| q=50 | 12.50 (0.00)* | 10.36 (0.001)* | |||
| q=75 | 0.06 (0886) | ||||
| Panel A: Differences in the coefficients of board size in relation to performance measures quantiles | |||||
| q=10 | 0.12 (0.72) | 0.97 (0.325) | 0.02 (0.886) | 0.00 (0.999) | |
| q=25 | 0.24 (0.62) | 0.51 (0.47) | 0.21 (0.65) | ||
| q=50 | 1.65 (0.20) | 1.04 (0.31) | |||
| q=75 | 0.23 (0.64) | ||||
| Panel A: Differences in the coefficients of ownership in relation to performance measures quantiles | |||||
| q=10 | 0.21 (0.65) | 0.92 (0.34) | 0.16 (0.69) | 0.00 (0.98) | |
| q=25 | 0.02 (0.98) | 0.01 (0.93) | 0.83 (0.36) | ||
| q=50 | 0.00 (0.98) | 0.63 (0.42) | |||
| q=75 | 0.87 (0.35) | ||||
| Panel A: Differences in the coefficients of intensity in relation to performance measures quantiles | |||||
| q=10 | 0.00 (0.96) | 0.75 (0.38) | 0.11 (0.74) | 0.45 (0.51) | |
| q=25 | 1.01 (0.31) | 0.57 (0.45) | 0.82 (0.37) | ||
| q=50 | 0.17 (0.68) | 0.05 (0.82) | |||
| q=75 | 0.31 (0.58) | ||||
| Panel A: Differences in the coefficients of size in relation to performance measures quantiles | |||||
| q=10 | 1.16 (0.28) | 2.49 (0.112) | 2.28 (0.13) | 1.81 (0.17) | |
| q=25 | 0.81 (0.367) | 1.07 (0.30) | 0.67 (0.41) | ||
| q=50 | 0.26 (0.61) | 0.11 (0.74) | |||
| q=75 | 0.00 (0.98) | ||||
| Panel A: Differences in the coefficients of leverage in relation to performance measures quantiles | |||||
| q=10 | 1.75 (0.18) | 21.00 (0.000)* | 12.12 (0.000)* | 5.16 (0.02)** | |
| q=25 | 1.68 (0.196) | 2.21 (1.38) | 0.36 (0.54) | ||
| q=50 | 0.02 (0.90) | 0.28 (0.59) | |||
| q=75 | 0.21 (0.65) | ||||
Note: numbers in brackets are two-tailed p-values of the F-statistics; *; **; ***indicate significance at 10%, 5% and 1%, respectively.
Authors’ tabulation based on STATA output.
Table 7 shows that heterogeneity for intense monitoring is significantly different in 5 pairs of differences suggesting that there is no homogeneity in the relationship between performance and intense monitoring across different quantiles. Next, the coefficient for directorship is consistent with OLS with a negative relationship with performance; however, the coefficient tends to be insignificant, though keeping negative sign as the performance quantiles increase. At the lower bounds of performance (10%, 25%, 50%) the multiple directorships negatively affects the performance. Table 7 Panel B shows 9 out of tens tests of difference across quantiles are significant revealing considerable amount of heterogeneity for the effects of directorships on performance. In other words, the directorship is more detrimental and more pronounced for companies at lower performance quantiles than companies in higher quantiles. Obviously, the OLS results do not present the whole picture of the impact of directorship on performance.Board size is shown to be positively and significantly related to performance in four out of five quantiles. Only firms lying at lower bounds of performance quantiles (10%) tend to not react to the board size. This suggests that larger board size does not influence companies with lower bound of performance. However, the differences in the coefficient estimates do not reveal any heterogeneity among the quantiles. Ownership of the directors shows insignificant relationship with performance. Moreover, board meetings seem to have insignificant impact on performance across four out of five quantiles. Control variables, firm size and leverage show significant relationship with performance across quantiles and consistent with the results of OLS.
5Conclusion and implicationsPast literature internationally utilizes the OLS to investigate the impact of corporate governance on firms’ performance and valuation. Studies provide mixed evidence on this relationship; however, the issue is that these studies have overlooked the fact that such relationship reflects mean effects of those variables. Therefore, we expect such relationship may vary as the dependent variable varies in its scale. This can be generated by using quantile regression approach, where a number of coefficients will be produced with each coefficient describing the relationship between corporate governance and performance at different points of performance. Therefore, thoroughly and rigorous analysis will be provided. The main objective of this paper is to determine the relationship between corporate governance and performance of Malaysian listed companies and whether such relationship is a heterogonous across various performance scales using quantile regression approach in a comparative way with OLS. A comparison with OLS demonstrates new evidence from Malaysia on the relationship between performance and governance indicators. The results of the study show that intensity of monitoring and its impact on performance is heterogeneous across the performance quantiles. Specifically, the coefficient of intense monitoring is significantly negative for the 10%, and positive and significant for 50% performance, but it becomes insignificant for other quantiles taking different signs for the upper and lower quantiles. Furthermore, the evidence shows that the effect of multiple directorships on performance is negative and significant at 10%, 25% and 50% quantiles, while it becomes insignificant at upper quantiles (75% and 90%) indicating the heterogeneity in the relationship between the performance and directorships. The implications of these results are that the importance of the adopted methodology in testing corporate governance and its relationship with performance. While OLS shows results based on their means, the quantiles regression shows better picture on the relationship, given that their unique feature of providing such relationship at different scales of performance. Furthermore, despite long time passed since the adoption of good corporate governance practices in Malaysia, it is very consistent with other previous studies and arguments that corporate governance in Malaysia follows the same patterns and its effectiveness still not to the expected level of developed markets, which require further enhancement and reconsideration. Despite the above implications, this study can be further enhanced by testing the impact of corporate governance on performance using the period after 2012, where a new improvements in other areas of governance were introduced. A further enhancement can look for the different periods and transitions in Malaysia corporate governance practices, for example the period of 2012 and above compared to the period before 2012 in a panel context, where the other weakness of the traditional methodological tests (i.e endogeneity and simultaneousity) observed recently in corporate governance studies can be overcome and thus produce a more robust and rigorous analysis.
