


The present work aims at investigating the effect of locally produced clay (Algeria), along with the effect of their size and rate on physical and mechanical properties of the composite material. This study is divided into two parts: The first one is devoted to the study of the composite material based on epoxy resin with kaolin, using different size fractions at rates ranging from 2% to 20%. The second part examines epoxy resin-based composite with calcined kaolin (metakaolin) with regard to the influence of the structure, the particle size and the charge rate on the properties of the material. It is shown that the clay fillers give the epoxy resin different properties compared to the epoxy resin alone and, additionally, reduce the cost of materials. It was also observed that the fillers enhance the mechanical properties by increasing the rigidity of the material. There is a maximum value of 2.4GPa to 18% kaolin, or more than 325% increase in the modulus of elasticity with respect to unfilled resin for the finer particle size. It was also found that the modulus of elasticity increases with increasing the loading rate. Indeed, the rigidity increases with increasing the filler rate. Moreover, for both fillers, lower fraction yields better results. Moreover, for both types of added fillers, lower fraction yields better results.
Performance optimization of materials is very important in providing a competitive advantage, which basically means improving properties while reducing cost (Bardonnet, 1992; Cho, Joshi, & Sun, 2006). Many modern technologies make use of new materials with properties that out perform traditional ones (metals, ceramics and polymers). The search for better alternatives to those materials has led to continuous improvement to ward either less expensive or more efficient materials. Yet, combining both remains the most desirable outcome.
A composite is a multiphase material that combines the properties of its constituents to acquire better properties than its parent components (Berthelot, 1996; Glossaire des matériaux, 2006). It consists of a reinforcement which contributes to the mechanical properties and a binder called matrix. The matrix ensures the cohesion between the elements of the reinforcement, transfers the strain and makes the material resistant to environmental elements (corrosion, aging) and temperature (Berthelot, 1996).
The properties of a composite material depend on the nature (Kornmann, Lindberg, & Berglund, 2001), the shape of the reinforcement, the input amounts, the quality of the matrix/fillers interface and finally, on the synthesis process. The integration of reinforcement into matrix to obtain new specific functions is a widely investigated topic (Antoon, Koenig, & Serafini, 1981; Bondioli, Cannillo, Fabbri, & Messori, 2005; Gerdinand, Budde, & Kurrat, 2004; Janssen, Seifert, & Karner, 1999).
Epoxy resins are flexible polymeric materials characterized by the presence of two epoxide groups or more in their molecular structure (Freddy, 2000).
Epoxy resins are thermosetting polymers, widely used in high performance composites in many industrial applications, such as high performance adhesives in airplanes, pipe coatings in the oil industry, printed circuit boards, and many other applications in construction, automotive and aerospace industries (Fu, Feng, Lauke, & Mai, 2008; Solihin, Tongamp, & Saito, 2011).
Their insulating electrical properties and their relatively high thermal resistance (Du & Yang, 2012; Galán & Martín Vivaldi, 1972) are the main reasons for using those materials in such applications. However, from a mechanical perspective, epoxy polymers show a brittle fracture mode.
Therefore, they usually fail by brittle fracture mechanisms under normal conditions of use. To address this issue and increase the properties of the brittle polymer, several approaches are possible. This can be achieved by firstly adding rubber particles (Castrillo, Olmos, Torkelson, & González-Benito, 2010; Du & Yang, 2012; Galán & Martín Vivaldi, 1972; Lee & Yee, 2001; Sue & Yee, 1993) and then a thermoplastic polymer in the epoxy matrix (Boo, Liu, & Sue, 2006; Boo et al., 2007). Yet another alternative is to modify epoxy resins by adding particles or inorganic fillers (silica, kaolin, montmorillonite) (Castrillo, Olmos, Sue, & González-Benito, 2015), which generally lead to lower costs without deteriorating the properties of the material, and sometimes it can also bring further improvements in the final material, such as barrier properties, flammability resistance, thermal stability and solvent absorbance (Fellahi, Chikhi, & Bakar, 2001; Garg & Mai, 1988).
The integration of inorganic fillers in polymer matrices is a subject extensively investigated (Irekti, 2011; Wang, Tian, Wang, & Han, 2005; Zapata-Massot, 2004).
The inorganic fillers are used as reinforcement in epoxy resin systems. They significantly increase the mechanical, electrical and thermal properties. These inorganic fillers are chosen for their availability. They are highly sought after as powders in several scientific fields as a way improving some of the features mentioned above and also to reduce the cost of the desired materials. The final properties of the composite depend on the intrinsic characteristics of each component, quantity, shape and size of loads and the nature of the interfaces many studies have been devoted to the study of loaded composite materials and several types of inorganic fillers were used in this work to improve certain characteristics of the matrix.
The role of charges is multiple, it can more cost effectively fill a volume if the load is much cheaper than the polymer, and it can modify the macroscopic properties as well.
The main objective of this work is to develop composite materials based on epoxy resin and inorganic fillers, in this case, treated (physical treatment) Tamazert kaolin (Algeria) and untreated kaolin (metakaolin) at different rates and with different particle sizes. The purpose is hence to highlight the influence of the structure, the rate and size of the fillers on the specific properties of the material (mechanical strength, thermal stability, dimensional stability).
2Experimental procedure2.1Materials used characterization2.1.1Matrices characterizationThe matrix consists of two elements, element A the monomer is the resin injected medapoxy 812 A, and element B called hardener is the hardener of the resin injected medapoxy 812 (aromatic amine) gives the mixture a cross linked resin.
In the present work, we used MEDAPOXY 812INJ from Granitex (ALGERIA), which is an efficient product with numerous qualities utilized in many advanced technology applications. The mass ratio (MR) between the monomer and the hardener provided by Granitex is MR=2.
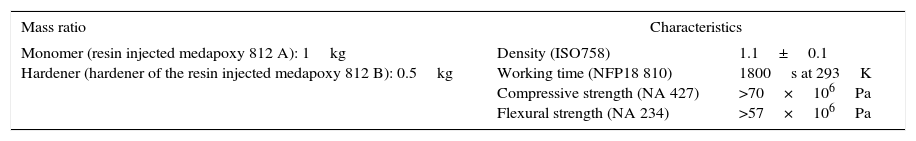
The resin characteristics MEDAPOXY 812INJ according to the supplier's data sheet are shown in Table 1.
The resin characteristics MEDAPOXY 812INJ according to the supplier's data sheet.
| Mass ratio | Characteristics | |
|---|---|---|
| Monomer (resin injected medapoxy 812 A): 1kg Hardener (hardener of the resin injected medapoxy 812 B): 0.5kg | Density (ISO758) Working time (NFP18 810) Compressive strength (NA 427) Flexural strength (NA 234) | 1.1±0.1 1800s at 293K >70×106Pa >57×106Pa |
The untreated kaolin and kaolin physically treated (metakaolin) were used as fillers in the present study. The powders were mechanically milled through a ball mill process. We obtained three ratios of different granulometry for both fillers.
The kaolin
Pre-treated Tamazert kaolin was used (deposit of Tamazert near MILA Algeria, 200km east of Constantine).
Metakaolin
The metakaolin was obtained by calcination of kaolin at high temperatures (500–550°C) for 5h. Calcination causes dehydroxylation and destruction of the initial crystalline structure of the kaolinite (Brindley & Nakahira, 1959; Brindley, Sharp, Patterson, & Narahari, 1967; Horvath & Kranz, 1980).
The obtained fillers were characterized using granulometry, X-ray diffraction (XRD), with X-ray fluorescence.
2.1.2.1GranulometriyThe particle size is crucial in mechanical and esthetic properties of composite resins and a key parameter in different classifications; the most commonly adopted classifications are indeed based on the shape and size of particles. The granulometry of kaolin and metakaolin was done by means of a Mastersizer 2000 laser particle type of URMPE research unit of Boumerdes Algeria.
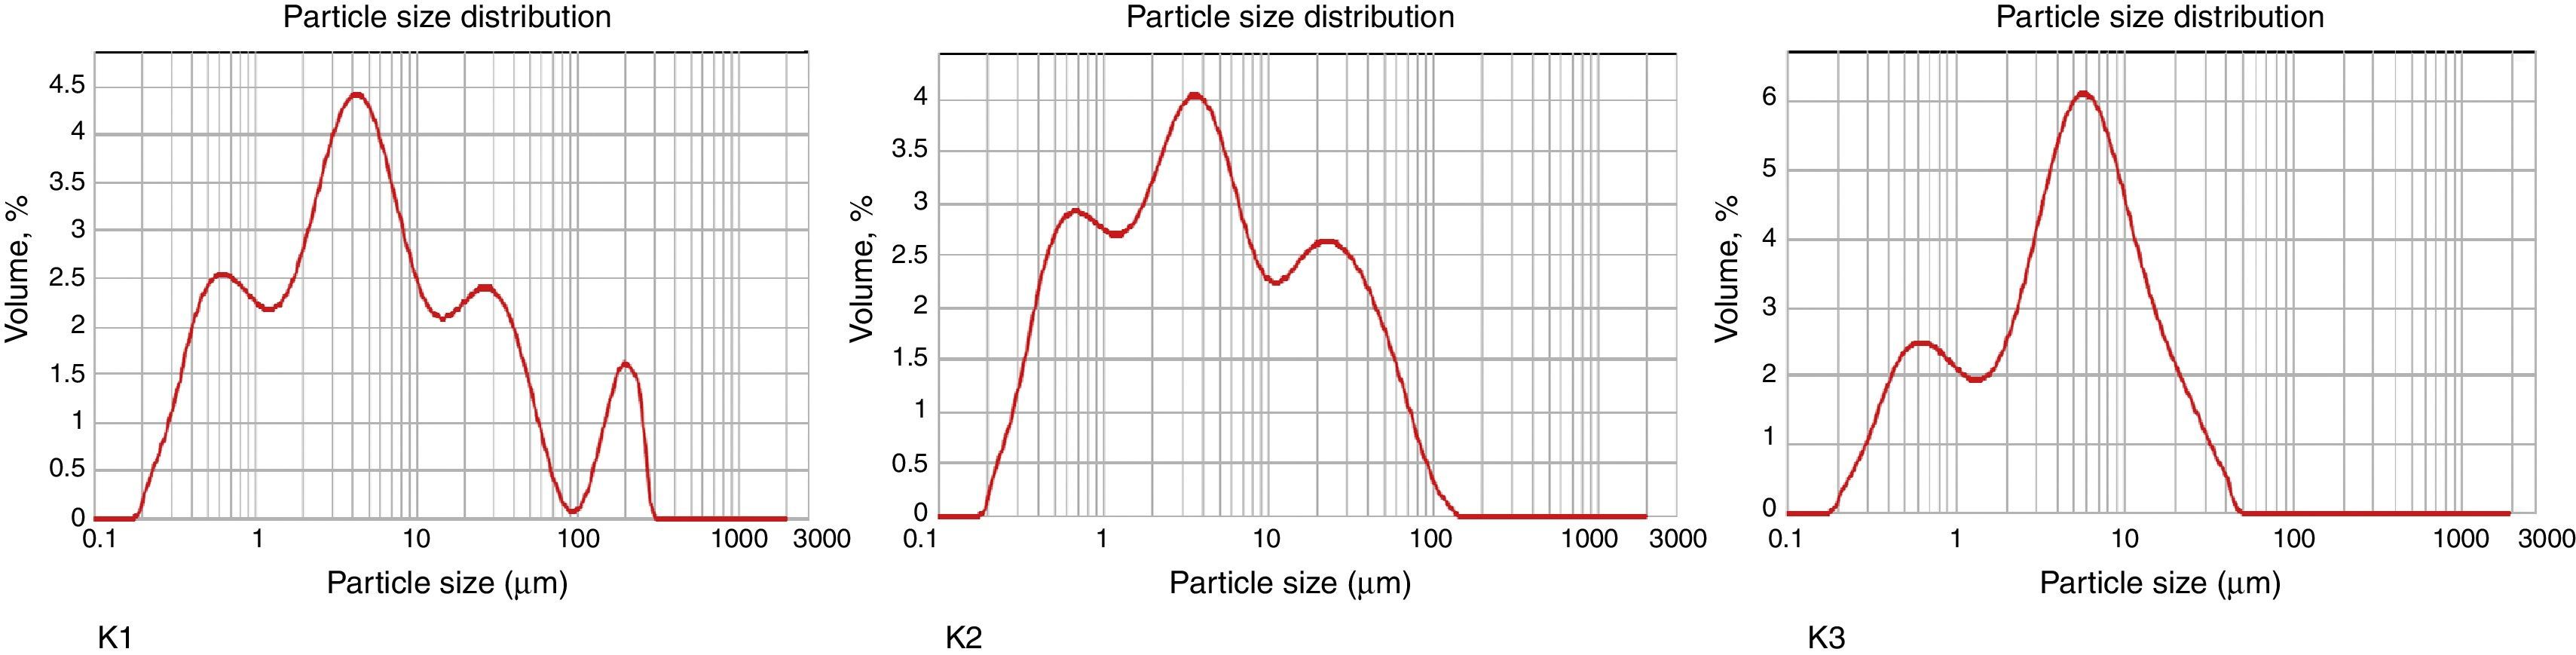
The results are shown in Figure 1 (K1). From these results we can see that the particle size distribution K1 (kaolin particles have the biggest size) varies between 0.1μm and 300μm.

The kaolin sample (K1) shows a multimodal distribution made up of 4 medium size fractions, (1) is <1μm with ∼20% of volume, (2) is 4μm with >40% of volume, (3) is 30μm with 20% of volume and (4) is 200μm with >15% of the volume. The whole volume is filled with particles <300μm.
This particle size curve shows that the particle size distribution of the load K2 (kaolin particles have an average particle size) is between 0.1μm and 100μm, the results are presented in Figure 1 (K2).
The kaolin sample K2 has a multi-modal distribution which is composed of 3fractions particle size, (1) a fraction of average size less than 1μm with about 25%, (2) a fraction of average size of 4μm with more than 40% by volume, and (3) a fraction of average size of 30μm with more than 20% by volume. The total volume is occupied by particles <100μm.
The results are shown in Figure 1 (K3 (kaolin particles have a fine particle size)). From these results we can see that the particle size distribution K3 varies between 0.1μm and 50μm.
The kaolin sample K3 has a bimodal distribution consisting of two size fractions, (1) a fraction of average size less than 1μm with about 25% and (2) a fraction of average size of 3μm with more 60% by volume. The total volume is occupied by particles <50μm.
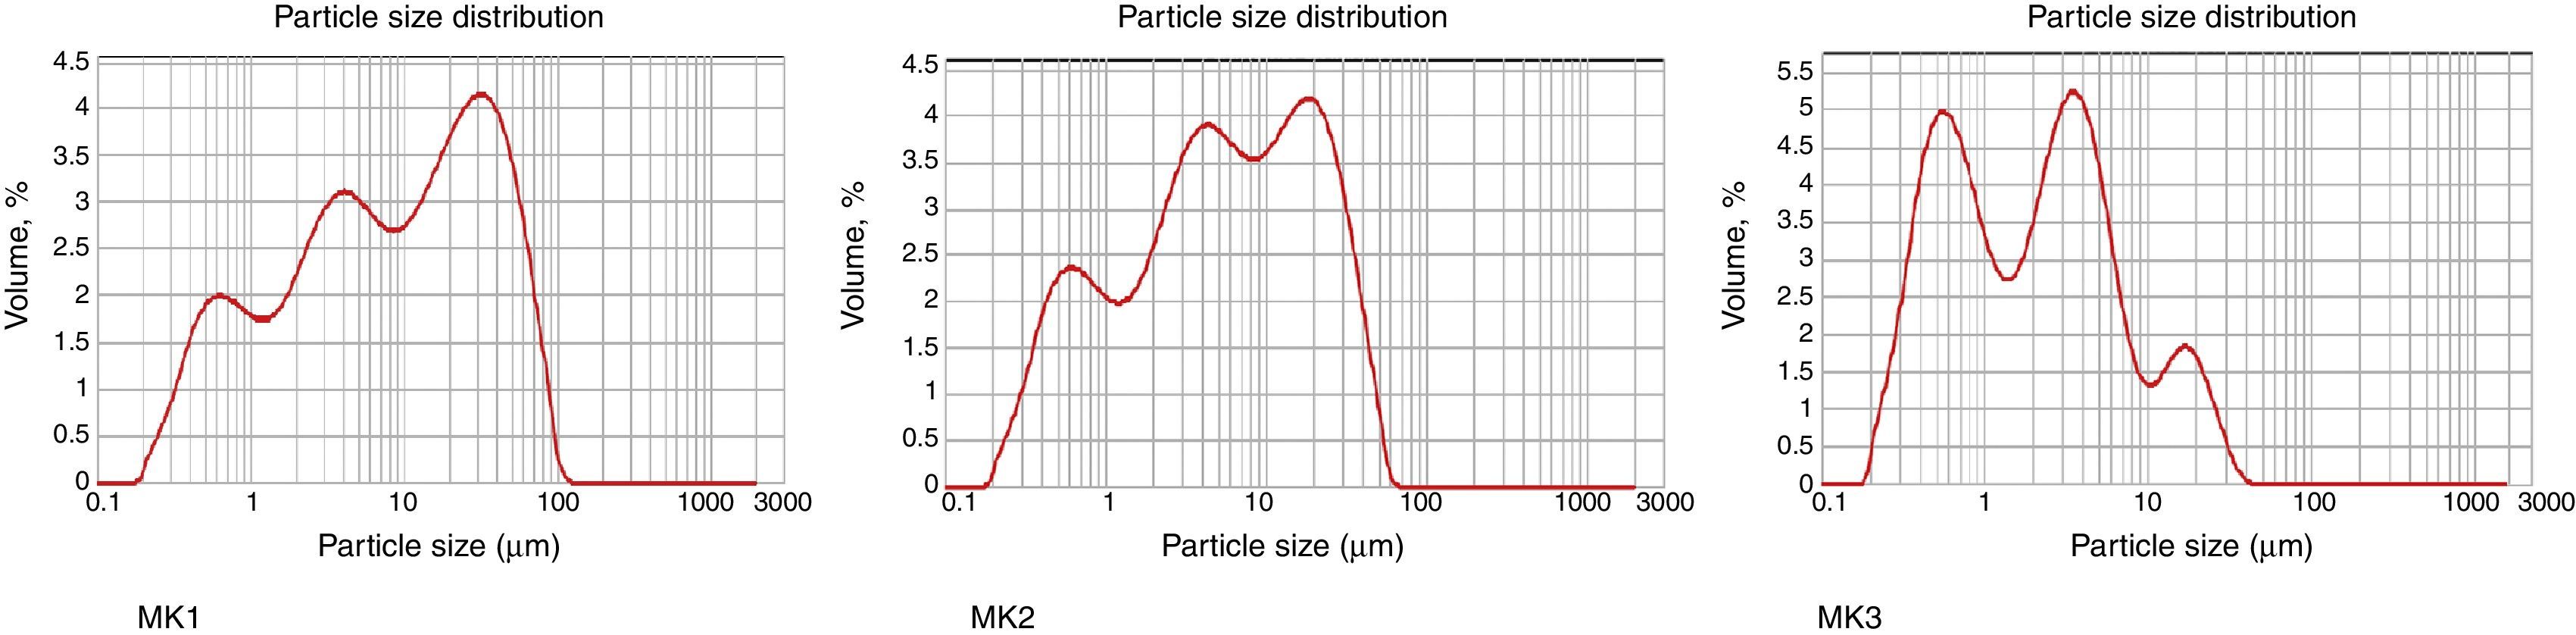
The results of particle size distribution metakaolin particles are shown in Figure 2.

This particle size curve shows that the particle size distribution of the load MK1 (metakaolin particles have the biggest size) is between 0.1μm and 100μm.
The sample of Metakaolin MK1 has a multi-modal distribution which is composed of three particle size fractions, (1) a fraction of average size less than 1μm with about 20%, (2) a fraction of average size of 4μm with more 30% by volume, and (3) a fraction of average size of 30μm with more than 40% by volume. The total volume is occupied by particles <100μm.
The particle size distribution of the load MK2 (Metakaolin particles have an average particle size) is between 0.1μm and 60μm.
The sample of Metakaolin MK2 has a multi-modal distribution which is composed of three particle size fractions, (1) a fraction of average size less than 1μm with about 20%, (2) a fraction of average size of 4μm with more 35% by volume, and (3) a fraction of average size of 20μm with more than 40% by volume. The total volume is occupied by particles <60μm.
From these results we can see that the particle size distribution MK3 (Metakaolin particles have a fine particle size) varies between 0.1μm and 40μm.
The sample of Metakaolin MK3 has a multi-modal distribution which is composed of three particle size fractions, (1) a fraction of average size less than 1μm with about 45%, (2) a fraction of average size of 3μm with more 45% by volume, and (3) a fraction of average size of 20μm with more than 10% by volume.
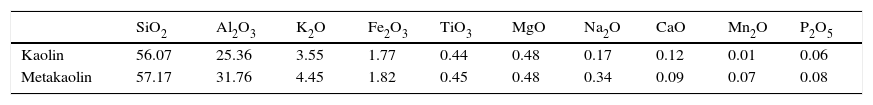
2.1.2.2Chemical compositionThe chemical composition of the mineral fillers was determined by X-ray fluorescence spectrometer X Panalytical Magix Pro of CRTSE method.
The results are shown in Table 2.
In our case, it was observed that the kaolin exhibits a loss on ignition of about 11.86% (H2O).
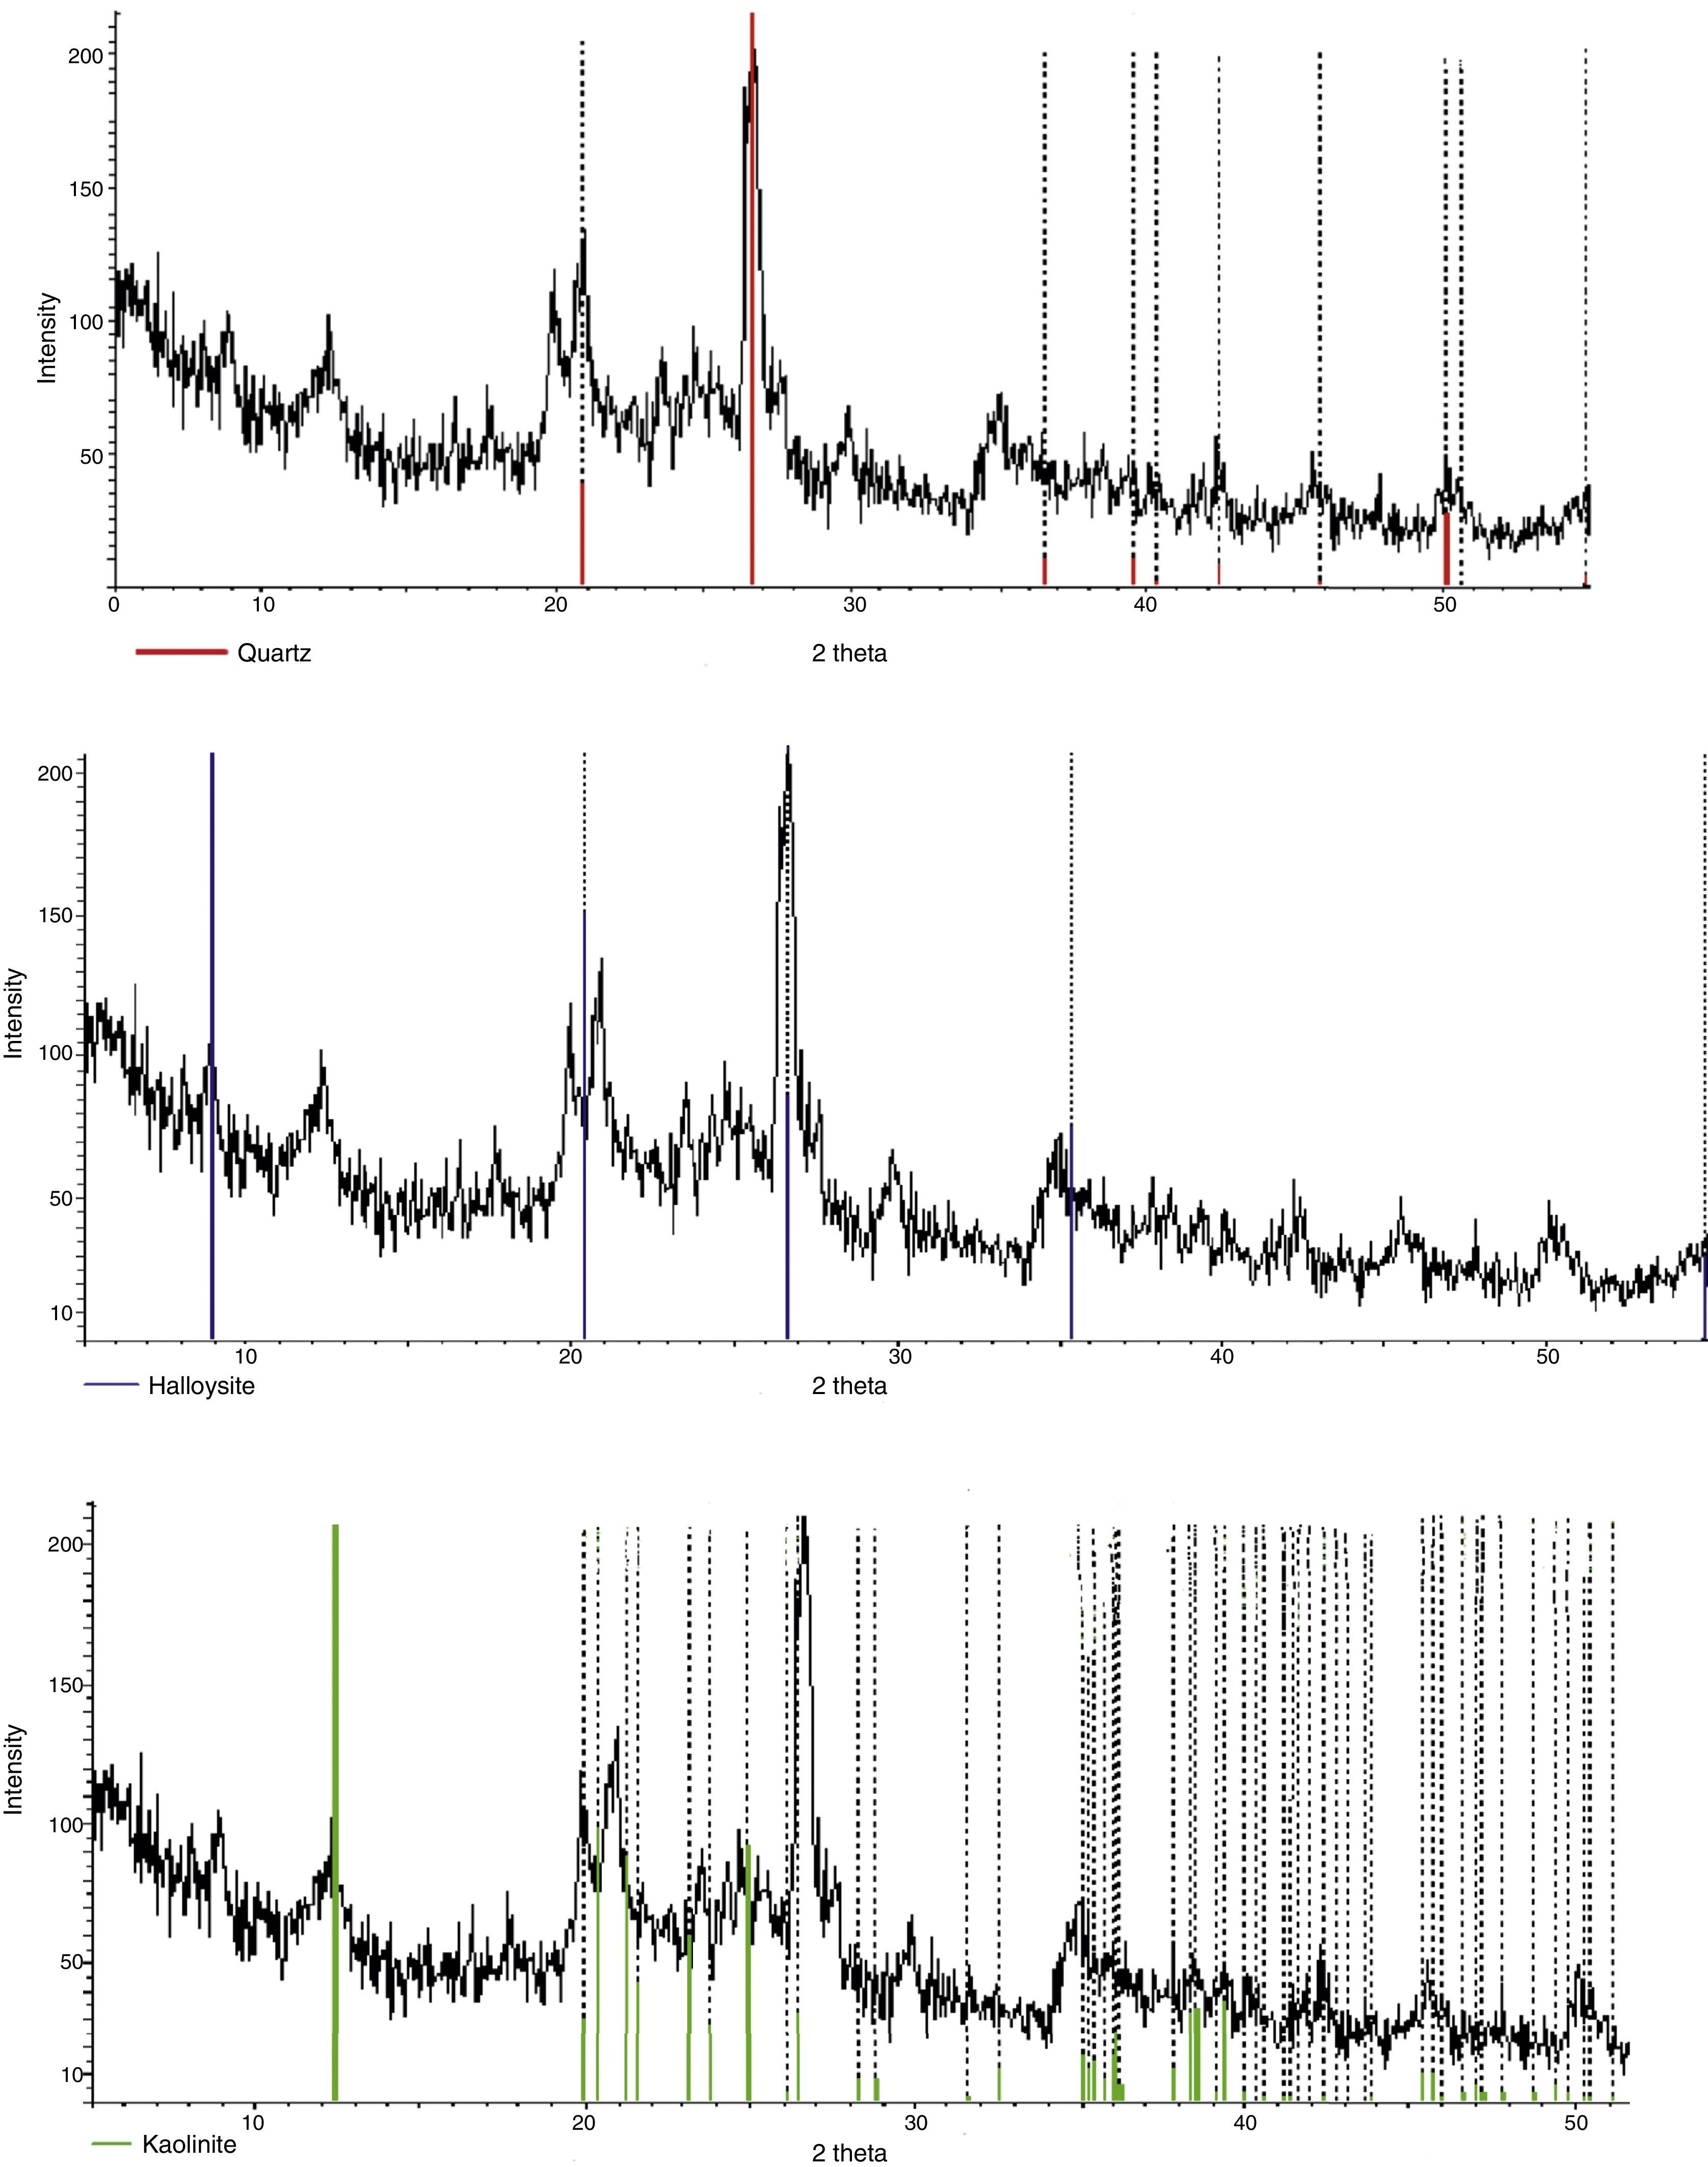
2.1.2.3Mineralogy composition by XRDThe structural investigation was carried out using an X-ray diffractometry (Philips diffractometer X’pert of URMPE).
From a mineralogical perspective, the XR diffraction shows that the used kaolin is essentially composed of kaolinite JCPDS card no: 83-971, halloysite JCPDS card no: 29-1489 and quartz JCPDS card no: 78-1252. The results are presented in Figure 3.

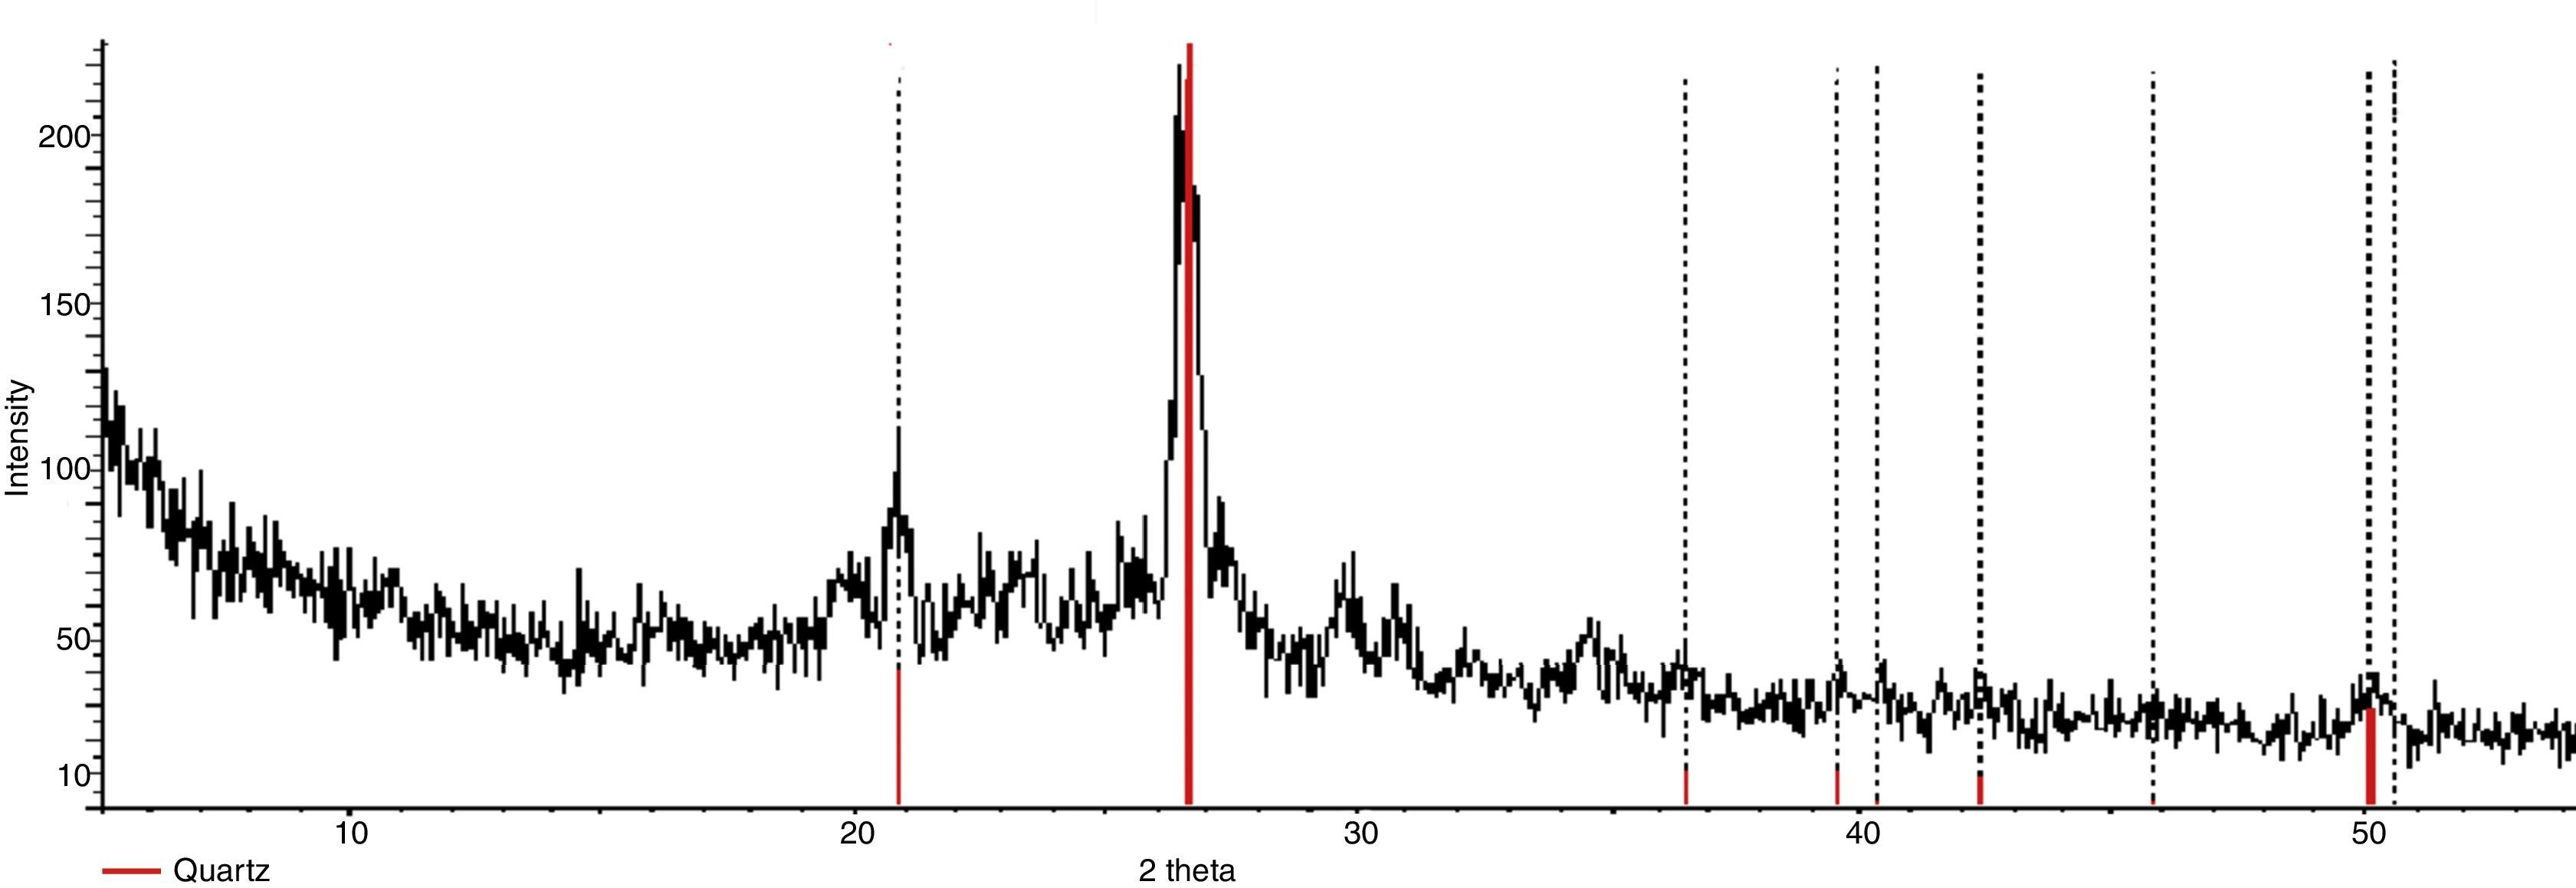
The presence of metakaolin resulting from the under-curing of kaolin, along with the dehydroxylation, can disturb the AL (O, OH) octahedral sheets, but no critical impact is observed for the SiO4 tetrahedral sheets, the results are presented in Figure 4.
2.2Composite material synthesis2.2.1Elaboration of the samples
The composite samples were prepared according to the weight ratio between the monomer and the hardener (MR=2). We mixed 100% of the injected resin, 50% of the hardener and a desired fuller's ratio. The rate of the fullers is measured according to the weight percent of the resin and dried at 80°C. First, the resin and the filler were mixed in an ultrasonic bath for 15min to achieve good dispersion and load distribution. We next incorporated the hardener and agitated during 15min to eliminate the bubbles formed during the mixing phase.
2.2.2Characterization of composite material2.2.2.1Density determinationTrue density was determined using a hydrostatic balance according to the NF T51-561 standard.
The densities of the samples were determined as the average of two samples, double weighing at 22°C using the following formula:
where ρ and ρe are, respectively, the densities of the sample and the liquid of immersion. We used water at 22°C with ρe≈1g/cm3.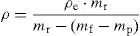
mr, mf and mp are, respectively, the masses of the sample in open air, the mass of the test tube together with the test tube holder and the mass of test tube holder in the liquid of immersion.
We used an analytical balance fitted with software that gives the density of the sample by introducing the mass values in open air and in water.
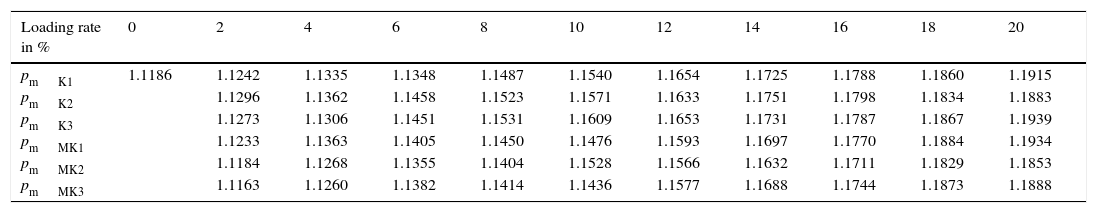
The experimental results for all samples of composites (resin injected/Kaolin, resin injected metakaolin) are given in Table 3.
Obtained density results.
| Loading rate in % | 0 | 2 | 4 | 6 | 8 | 10 | 12 | 14 | 16 | 18 | 20 |
|---|---|---|---|---|---|---|---|---|---|---|---|
| pmK1 | 1.1186 | 1.1242 | 1.1335 | 1.1348 | 1.1487 | 1.1540 | 1.1654 | 1.1725 | 1.1788 | 1.1860 | 1.1915 |
| pmK2 | 1.1296 | 1.1362 | 1.1458 | 1.1523 | 1.1571 | 1.1633 | 1.1751 | 1.1798 | 1.1834 | 1.1883 | |
| pmK3 | 1.1273 | 1.1306 | 1.1451 | 1.1531 | 1.1609 | 1.1653 | 1.1731 | 1.1787 | 1.1867 | 1.1939 | |
| pmMK1 | 1.1233 | 1.1363 | 1.1405 | 1.1450 | 1.1476 | 1.1593 | 1.1697 | 1.1770 | 1.1884 | 1.1934 | |
| pmMK2 | 1.1184 | 1.1268 | 1.1355 | 1.1404 | 1.1528 | 1.1566 | 1.1632 | 1.1711 | 1.1829 | 1.1853 | |
| pmMK3 | 1.1163 | 1.1260 | 1.1382 | 1.1414 | 1.1436 | 1.1577 | 1.1688 | 1.1744 | 1.1873 | 1.1888 |
From these results we observe that the density increase by the incorporation of kaolin and metakaolin into the resin. We can see that the density increases when the filler rates increase.
2.2.2.2Mechanical characterizationa. Tensile test
The tensile tests were performed by means of a Zwick/Rolle testing machine of the University of Boumerdes Algeria. The loading capacity is 10kN and the applied loading speed was 2mm/min. All measurements were taken at room temperature.
a.1. Specimens geometry
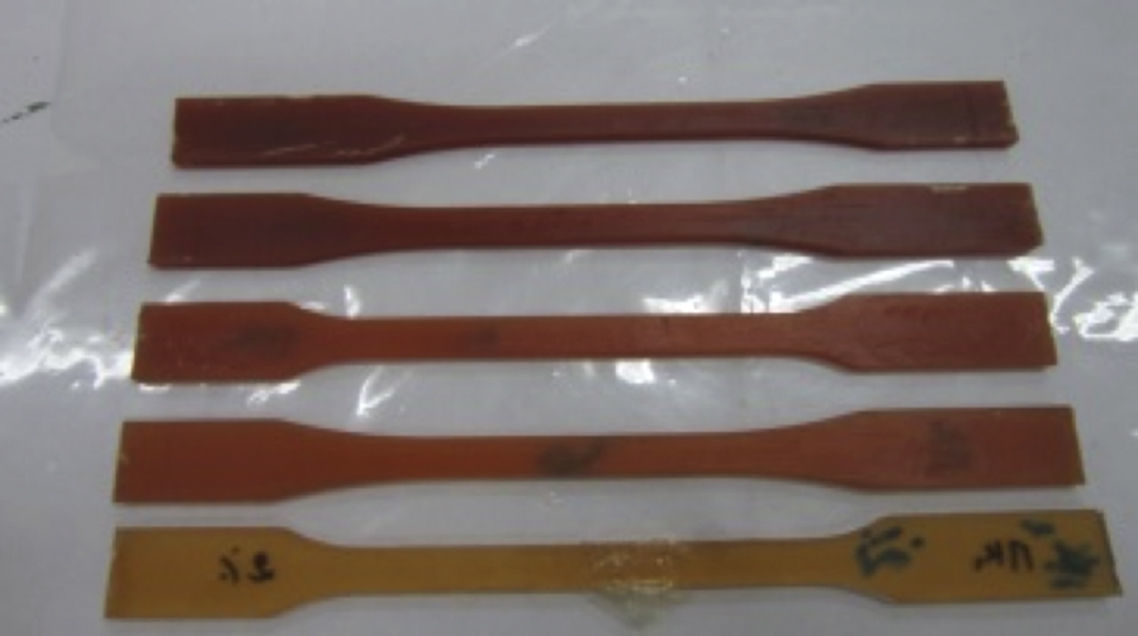
The specimens were dumbbell shaped in accordance with EN ISO 527-4 Type B standard. The samples were prepared in aluminum molds, Figure 5 shows the specimens used.

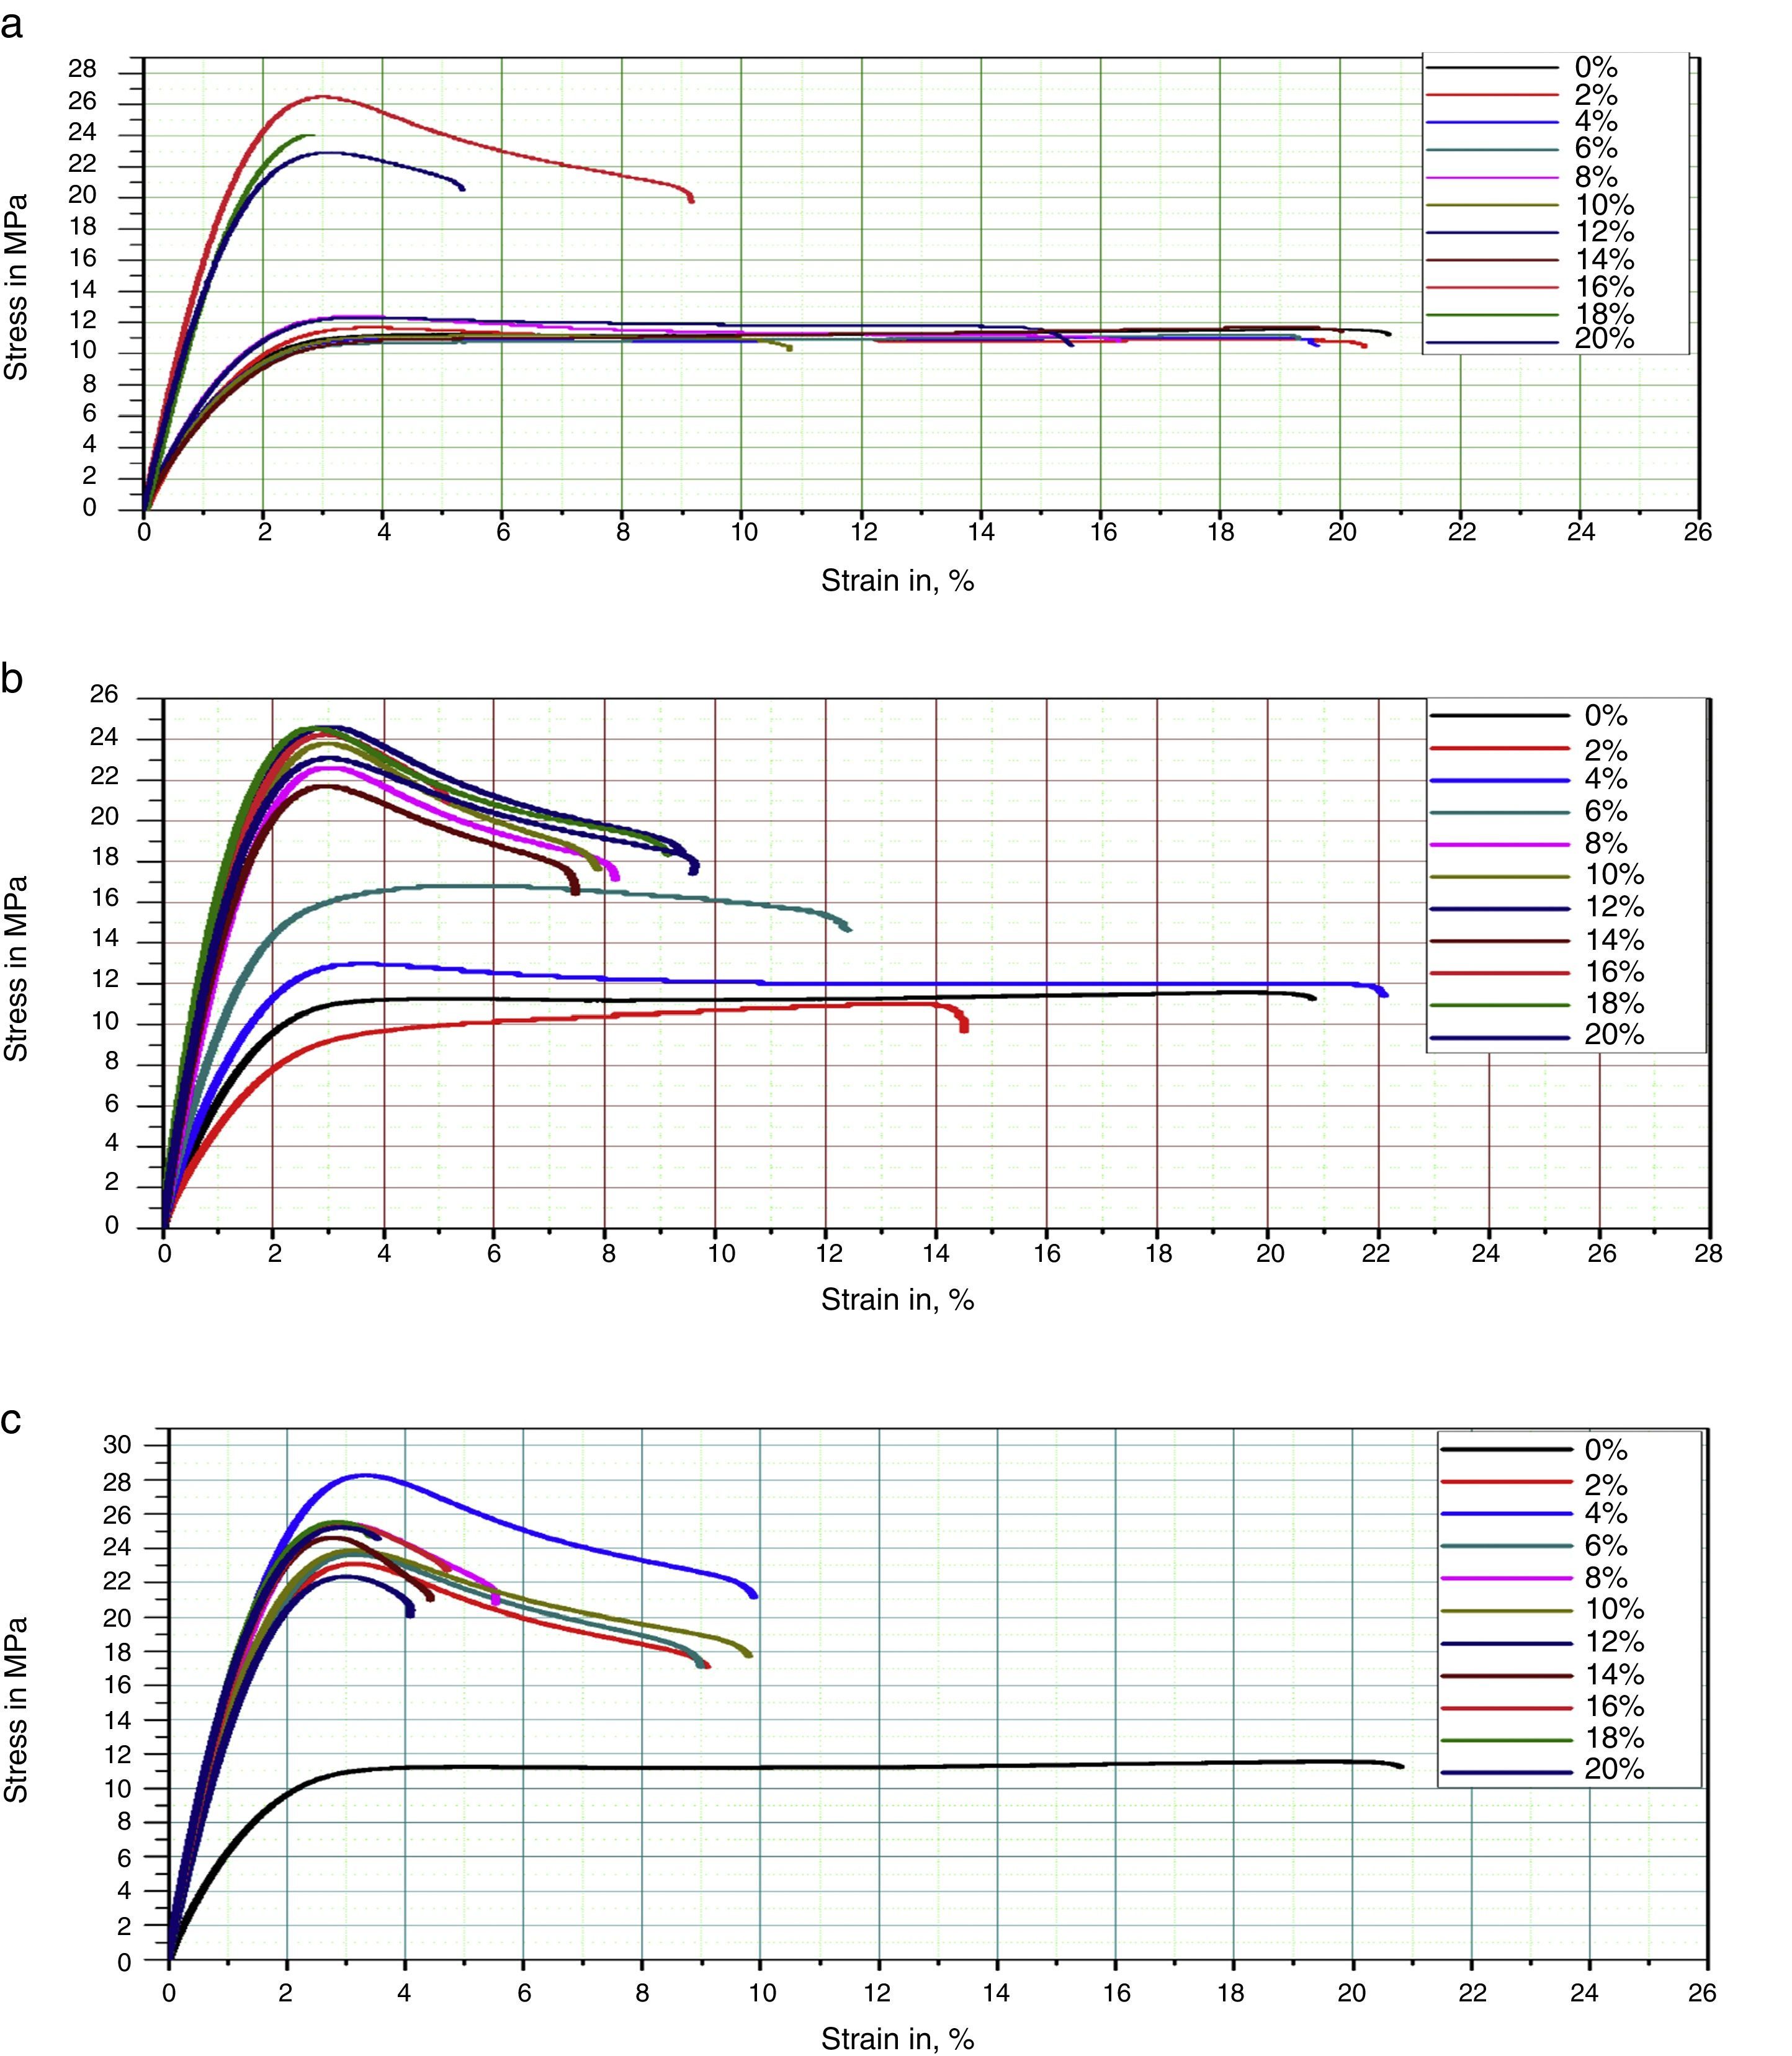
a.2. Mechanical tensile behavior of composite (resin injected/kaolin)
All measurements represent the changes in the stress versus elongation applied to the specimens. The Figure 6 represents the tensile mechanical behavior of resin loaded with kaolin a) inject /K1, b) inject /K2, c) inject /K3.
 inject/K1, (b) inject/K2, and (c) inject/K3.")
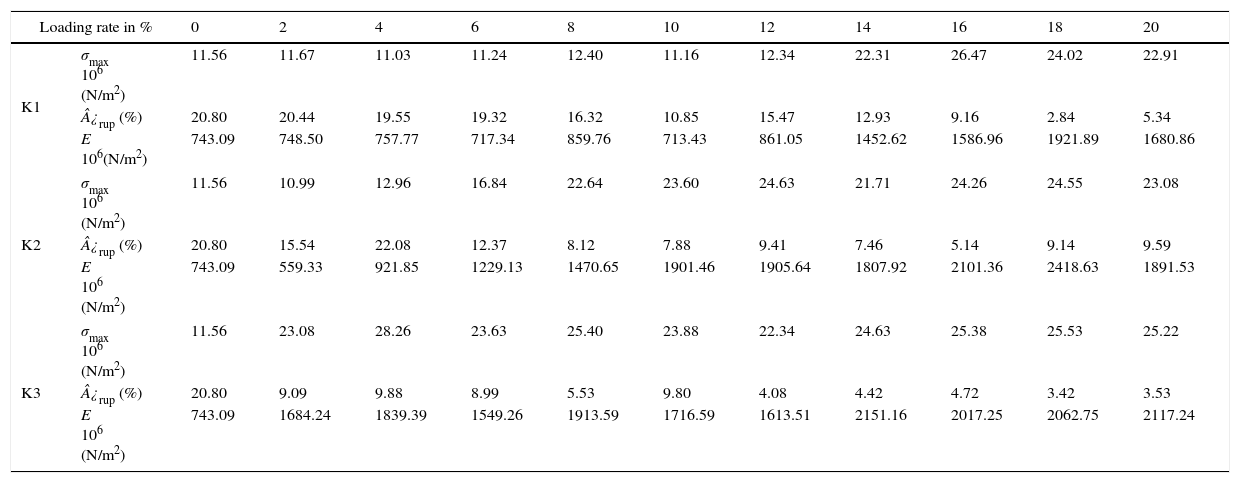
The mechanical properties of the resin loaded with kaolin are summarized in Table 4.
Mechanical characteristics of the resin loaded with kaolin.
| Loading rate in % | 0 | 2 | 4 | 6 | 8 | 10 | 12 | 14 | 16 | 18 | 20 | |
|---|---|---|---|---|---|---|---|---|---|---|---|---|
| K1 | σmax 106 (N/m2) | 11.56 | 11.67 | 11.03 | 11.24 | 12.40 | 11.16 | 12.34 | 22.31 | 26.47 | 24.02 | 22.91 |
| ¿rup (%) | 20.80 | 20.44 | 19.55 | 19.32 | 16.32 | 10.85 | 15.47 | 12.93 | 9.16 | 2.84 | 5.34 | |
| E 106(N/m2) | 743.09 | 748.50 | 757.77 | 717.34 | 859.76 | 713.43 | 861.05 | 1452.62 | 1586.96 | 1921.89 | 1680.86 | |
| K2 | σmax 106 (N/m2) | 11.56 | 10.99 | 12.96 | 16.84 | 22.64 | 23.60 | 24.63 | 21.71 | 24.26 | 24.55 | 23.08 |
| ¿rup (%) | 20.80 | 15.54 | 22.08 | 12.37 | 8.12 | 7.88 | 9.41 | 7.46 | 5.14 | 9.14 | 9.59 | |
| E 106 (N/m2) | 743.09 | 559.33 | 921.85 | 1229.13 | 1470.65 | 1901.46 | 1905.64 | 1807.92 | 2101.36 | 2418.63 | 1891.53 | |
| K3 | σmax 106 (N/m2) | 11.56 | 23.08 | 28.26 | 23.63 | 25.40 | 23.88 | 22.34 | 24.63 | 25.38 | 25.53 | 25.22 |
| ¿rup (%) | 20.80 | 9.09 | 9.88 | 8.99 | 5.53 | 9.80 | 4.08 | 4.42 | 4.72 | 3.42 | 3.53 | |
| E 106 (N/m2) | 743.09 | 1684.24 | 1839.39 | 1549.26 | 1913.59 | 1716.59 | 1613.51 | 2151.16 | 2017.25 | 2062.75 | 2117.24 | |
The results show an increase of the breaking stress and the modulus of elasticity with a decrease of the elongation at break as a function of the filler rates.
Compared to unfilled samples, an increase of the tensile strength and a decreased elongation at break are observed for filled resins. The tensile at break and the modulus of elasticity increase as a function of the fillers rate, concomitantly with a decrease of the elongation.
The maximum stress at break of loaded samples strongly increases with the increase of the fillers rate. A maximum value of 26.47×10⁶Pa was observed for 16% of the fillers rate, i.e. >207% of the unfilled.
Remarkably, a charging rate beyond 16% has a reverses effect on the increase of the tensile at break in traction.
The elongation at tensile breaking strength of the loaded samples significantly decreases with raising the filler rates, achieving a minimal value of 2.84% while it decreases by over 86% for rate filler of 18% compared to unfilled samples. The modulus of elasticity increases with increasing filler rates, a maximum value of 1.9×10⁹Pa for 18% of fillers was observed, i.e. >258% increase in modulus of elasticity compared to unfilled resin.
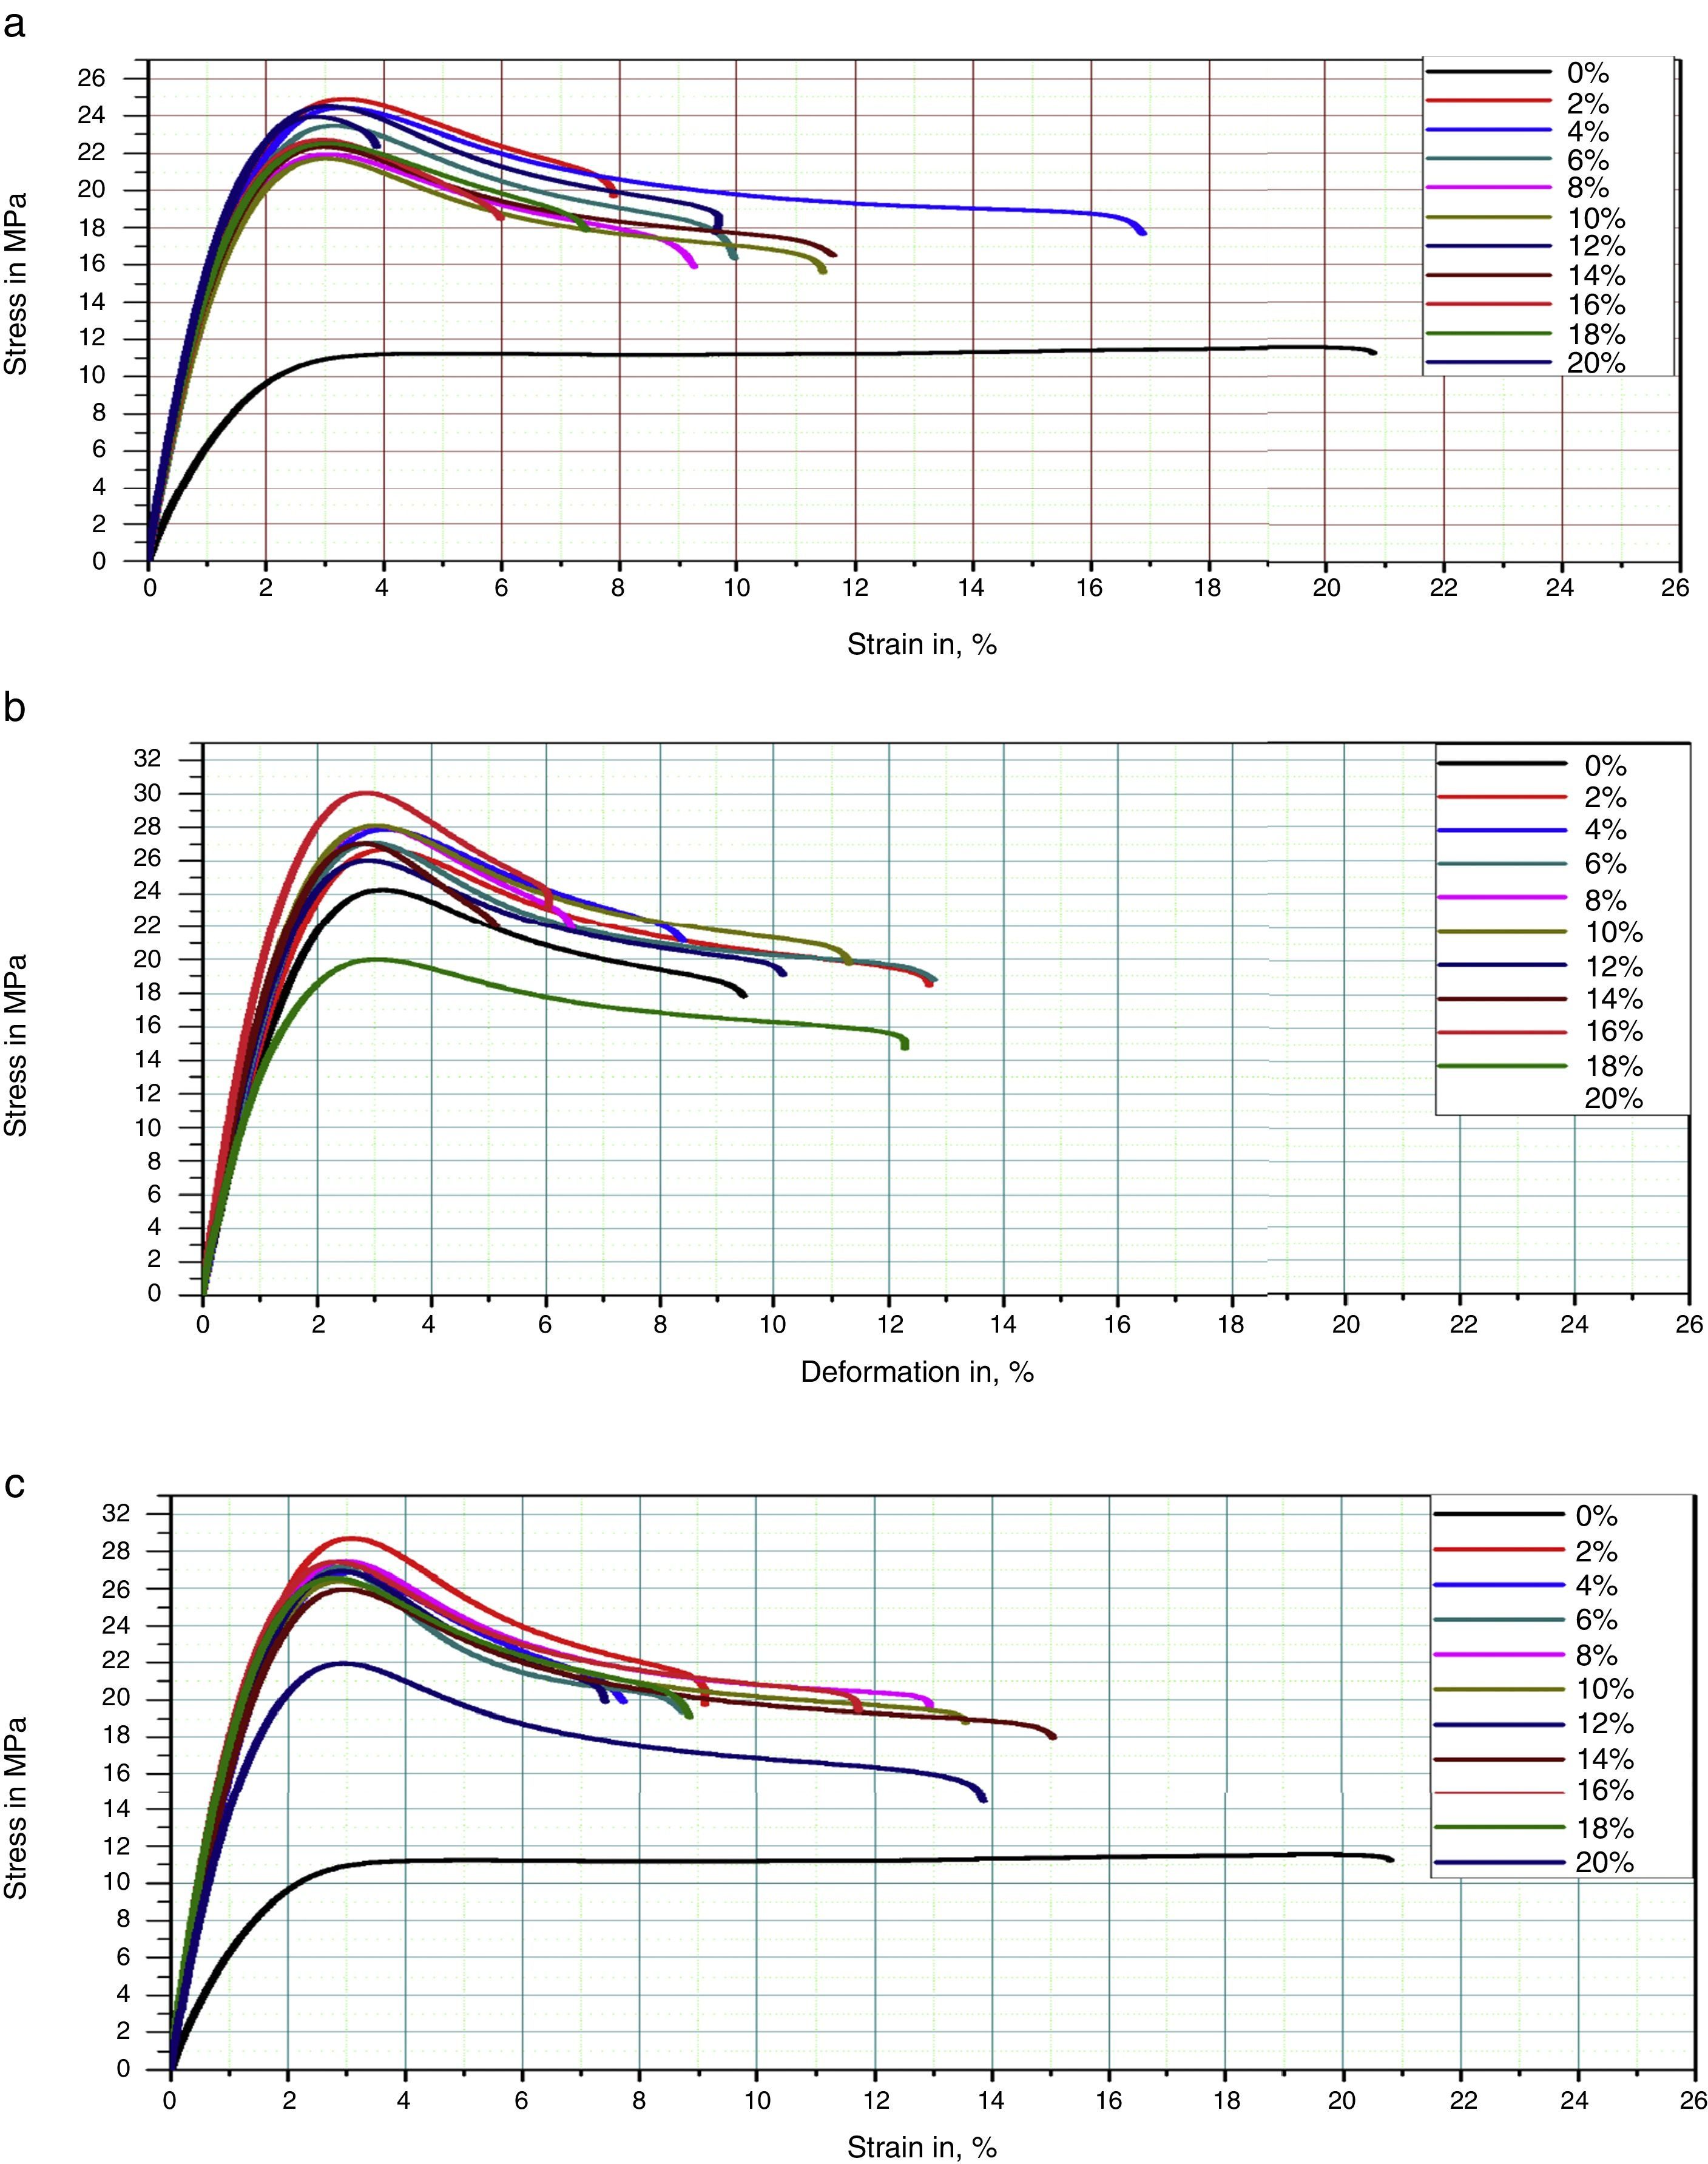
a.3. Mechanical tensile behavior of composite (resin injected/metakaolin)
Figure 7 represents the tensile mechanical behavior of resin loaded with metkaolin: (a) inject/MK1, (b) inject/MK2 and (c) inject/MK3.
 inject/MK1, (b) inject/MK2, and (c) inject/MK3.")
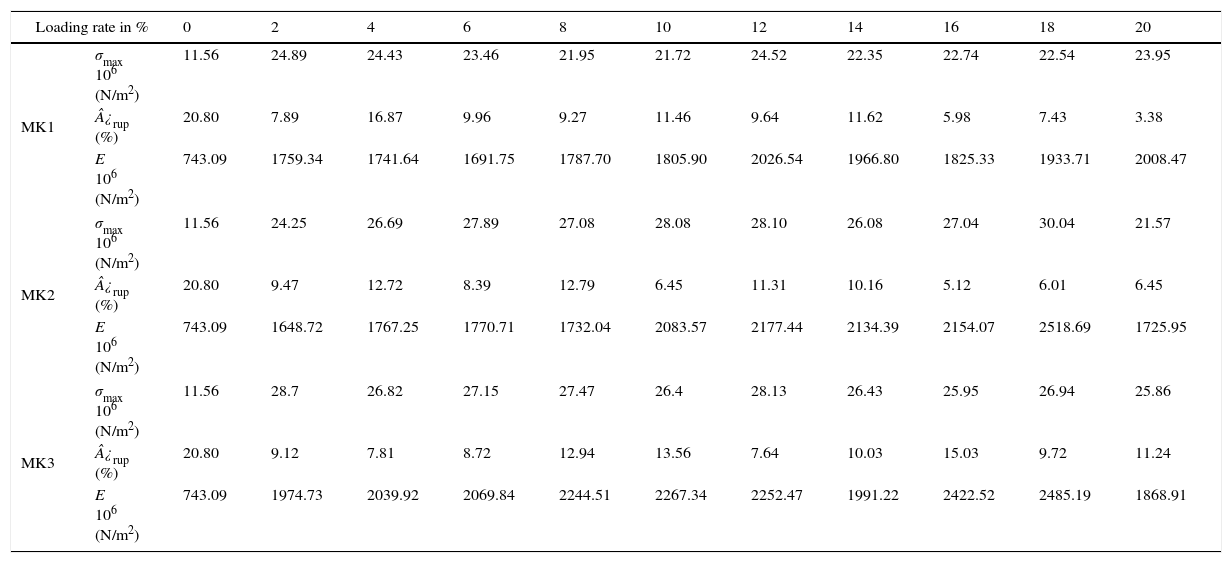
The mechanical properties of the resin loaded with metakaolin are summarized in Table 5.
Mechanical characteristics of the resin filled metakaolin.
| Loading rate in % | 0 | 2 | 4 | 6 | 8 | 10 | 12 | 14 | 16 | 18 | 20 | |
|---|---|---|---|---|---|---|---|---|---|---|---|---|
| MK1 | σmax 106 (N/m2) | 11.56 | 24.89 | 24.43 | 23.46 | 21.95 | 21.72 | 24.52 | 22.35 | 22.74 | 22.54 | 23.95 |
| ¿rup (%) | 20.80 | 7.89 | 16.87 | 9.96 | 9.27 | 11.46 | 9.64 | 11.62 | 5.98 | 7.43 | 3.38 | |
| E 106 (N/m2) | 743.09 | 1759.34 | 1741.64 | 1691.75 | 1787.70 | 1805.90 | 2026.54 | 1966.80 | 1825.33 | 1933.71 | 2008.47 | |
| MK2 | σmax 106 (N/m2) | 11.56 | 24.25 | 26.69 | 27.89 | 27.08 | 28.08 | 28.10 | 26.08 | 27.04 | 30.04 | 21.57 |
| ¿rup (%) | 20.80 | 9.47 | 12.72 | 8.39 | 12.79 | 6.45 | 11.31 | 10.16 | 5.12 | 6.01 | 6.45 | |
| E 106 (N/m2) | 743.09 | 1648.72 | 1767.25 | 1770.71 | 1732.04 | 2083.57 | 2177.44 | 2134.39 | 2154.07 | 2518.69 | 1725.95 | |
| MK3 | σmax 106 (N/m2) | 11.56 | 28.7 | 26.82 | 27.15 | 27.47 | 26.4 | 28.13 | 26.43 | 25.95 | 26.94 | 25.86 |
| ¿rup (%) | 20.80 | 9.12 | 7.81 | 8.72 | 12.94 | 13.56 | 7.64 | 10.03 | 15.03 | 9.72 | 11.24 | |
| E 106 (N/m2) | 743.09 | 1974.73 | 2039.92 | 2069.84 | 2244.51 | 2267.34 | 2252.47 | 1991.22 | 2422.52 | 2485.19 | 1868.91 | |
The effect of the filler rate is remarkable with increasing the tensile strength and Young's modulus with a decrease in deformation. The best result for Young's stress modulus is obtained at 18% filler rates, with a minimum value of elongation at break.
The maximum stress at break of loaded samples greatly increases with increasing the filler rates and a maximum value of 24.55×10⁶Pa was observed for 18% of the filler rates, i.e. >212% of the unfilled.
The elongation at tensile breaking strength of the filled samples significantly decreases with raising the filler rates to achieve a minimal value of 5.14%,and which decreases by ∼75% for a filler rate equal to 16% compared to unfilled samples.
The modulus of elasticity increases with increasing the filler rates, a maximum value of 2.4×10⁹Pa for 18% of fillers was observed, meaning that more than 325% increase in the modulus of elasticity compared to unfilled resin.
In conclusion, we have investigated the effect of fillers rate (kaolin and metakaolin) and the granulometry effect on the mechanical properties of epoxy resin. At low rate, fine particle sizes permit a good dispersion of the particles in the matrix, leading to improvements in the mechanical properties. On the other hand, particles with larger size exhibit poor dispersion of the filler because of its own weight, which in turn requires a high charging rate to achieve improvements.
Adding metakaolin to the resin yields the best results for Young's modulus, stress at break and elongation, compared to the low rate kaolin. The presence of water molecules in the kaolin can notably degrade the bonds at the interface, leading to a degradation of the mechanical properties of the composite (Vaddadi, Nakamura, & Singh, 2003).
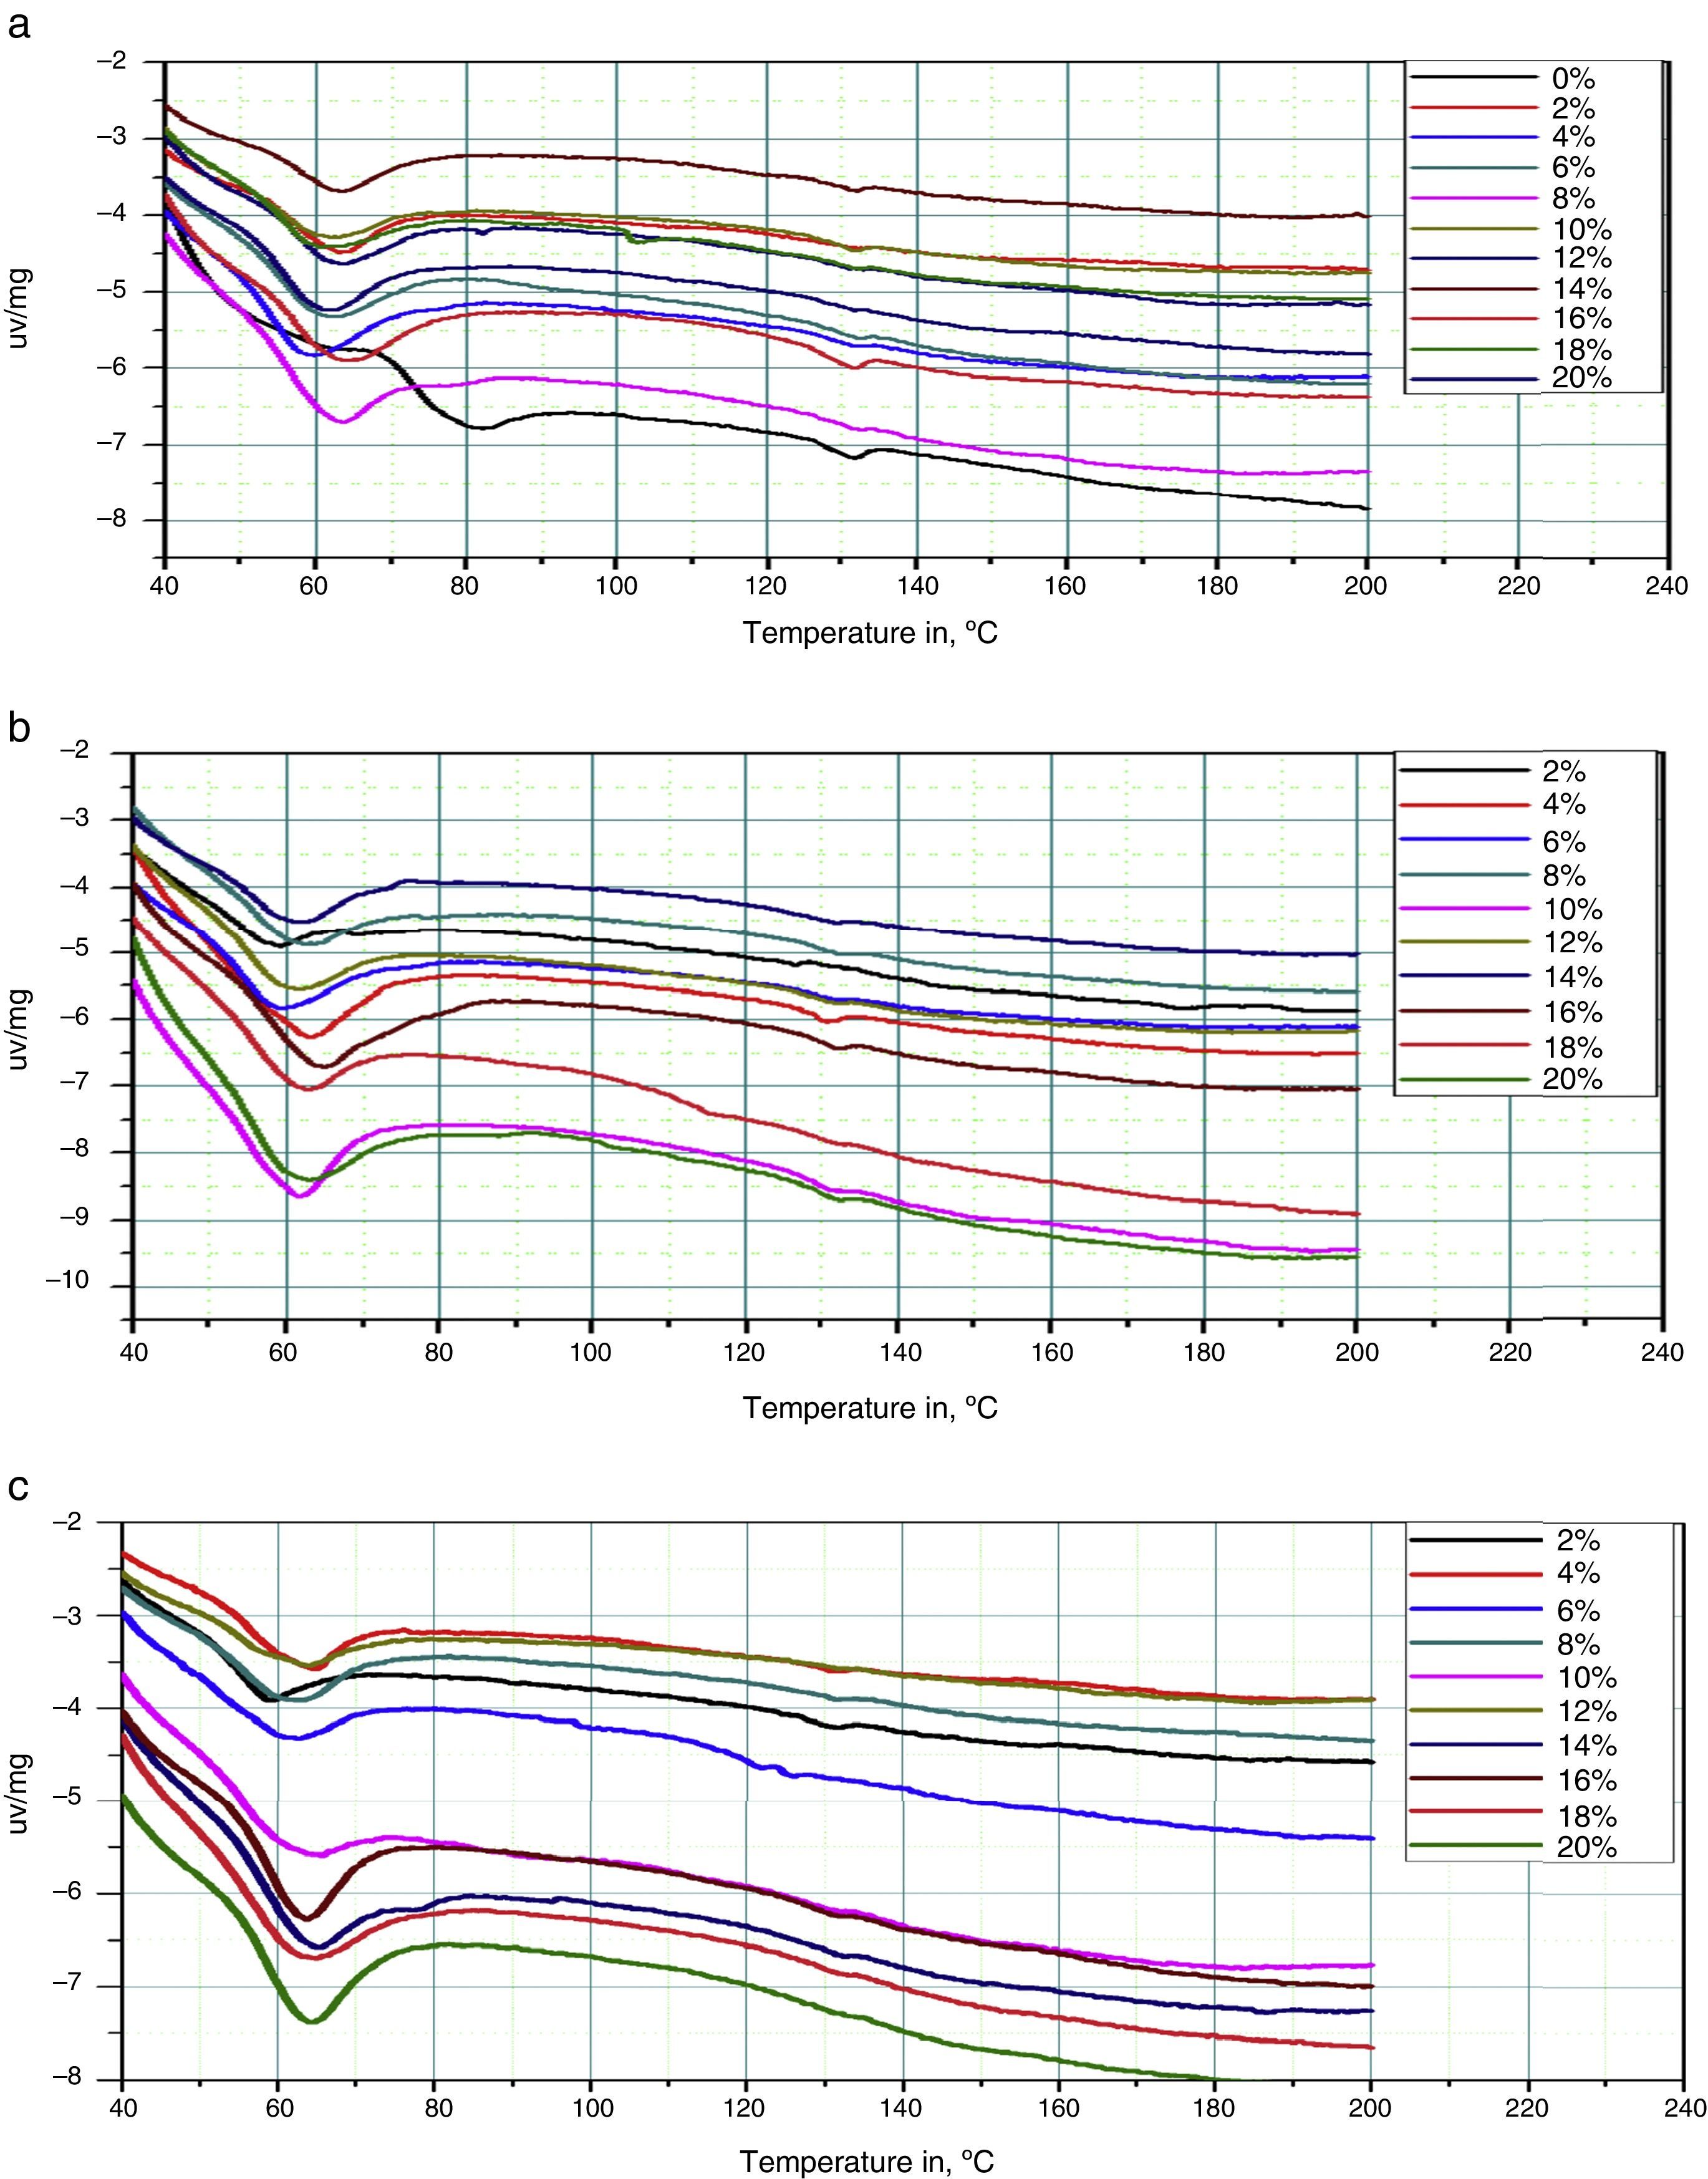
2.2.2.3Thermal analysis by DSC of filled compositesDifferential scanning calorimetery (DSC) was conducted using a STA 409 PC NETZSCH LUXX (Simultaneous Thermal Analysis) of URMPE. It is based on the differential determination of the thermal effect using two thermopiles and on the measurement of the mass drop under the effect of temperature. This analysis technique is part of the NF-EN31357-3 standard (plastic).
The different types of samples were analyzed by this technique. The samples were annealed at 353K for 28,800s. The heating rate during thermal analysis testing was 4.71K/s.
2.2.2.3.1Thermal analysis of samples filled by kaolin2.2.2.3.2Thermal analysis of samples filled by metkaolin inject/K1, (b) inject/K2, and (c) inject/K3.")
 inject/K1, (b) inject/K2, and (c) inject/K3.")
- a.
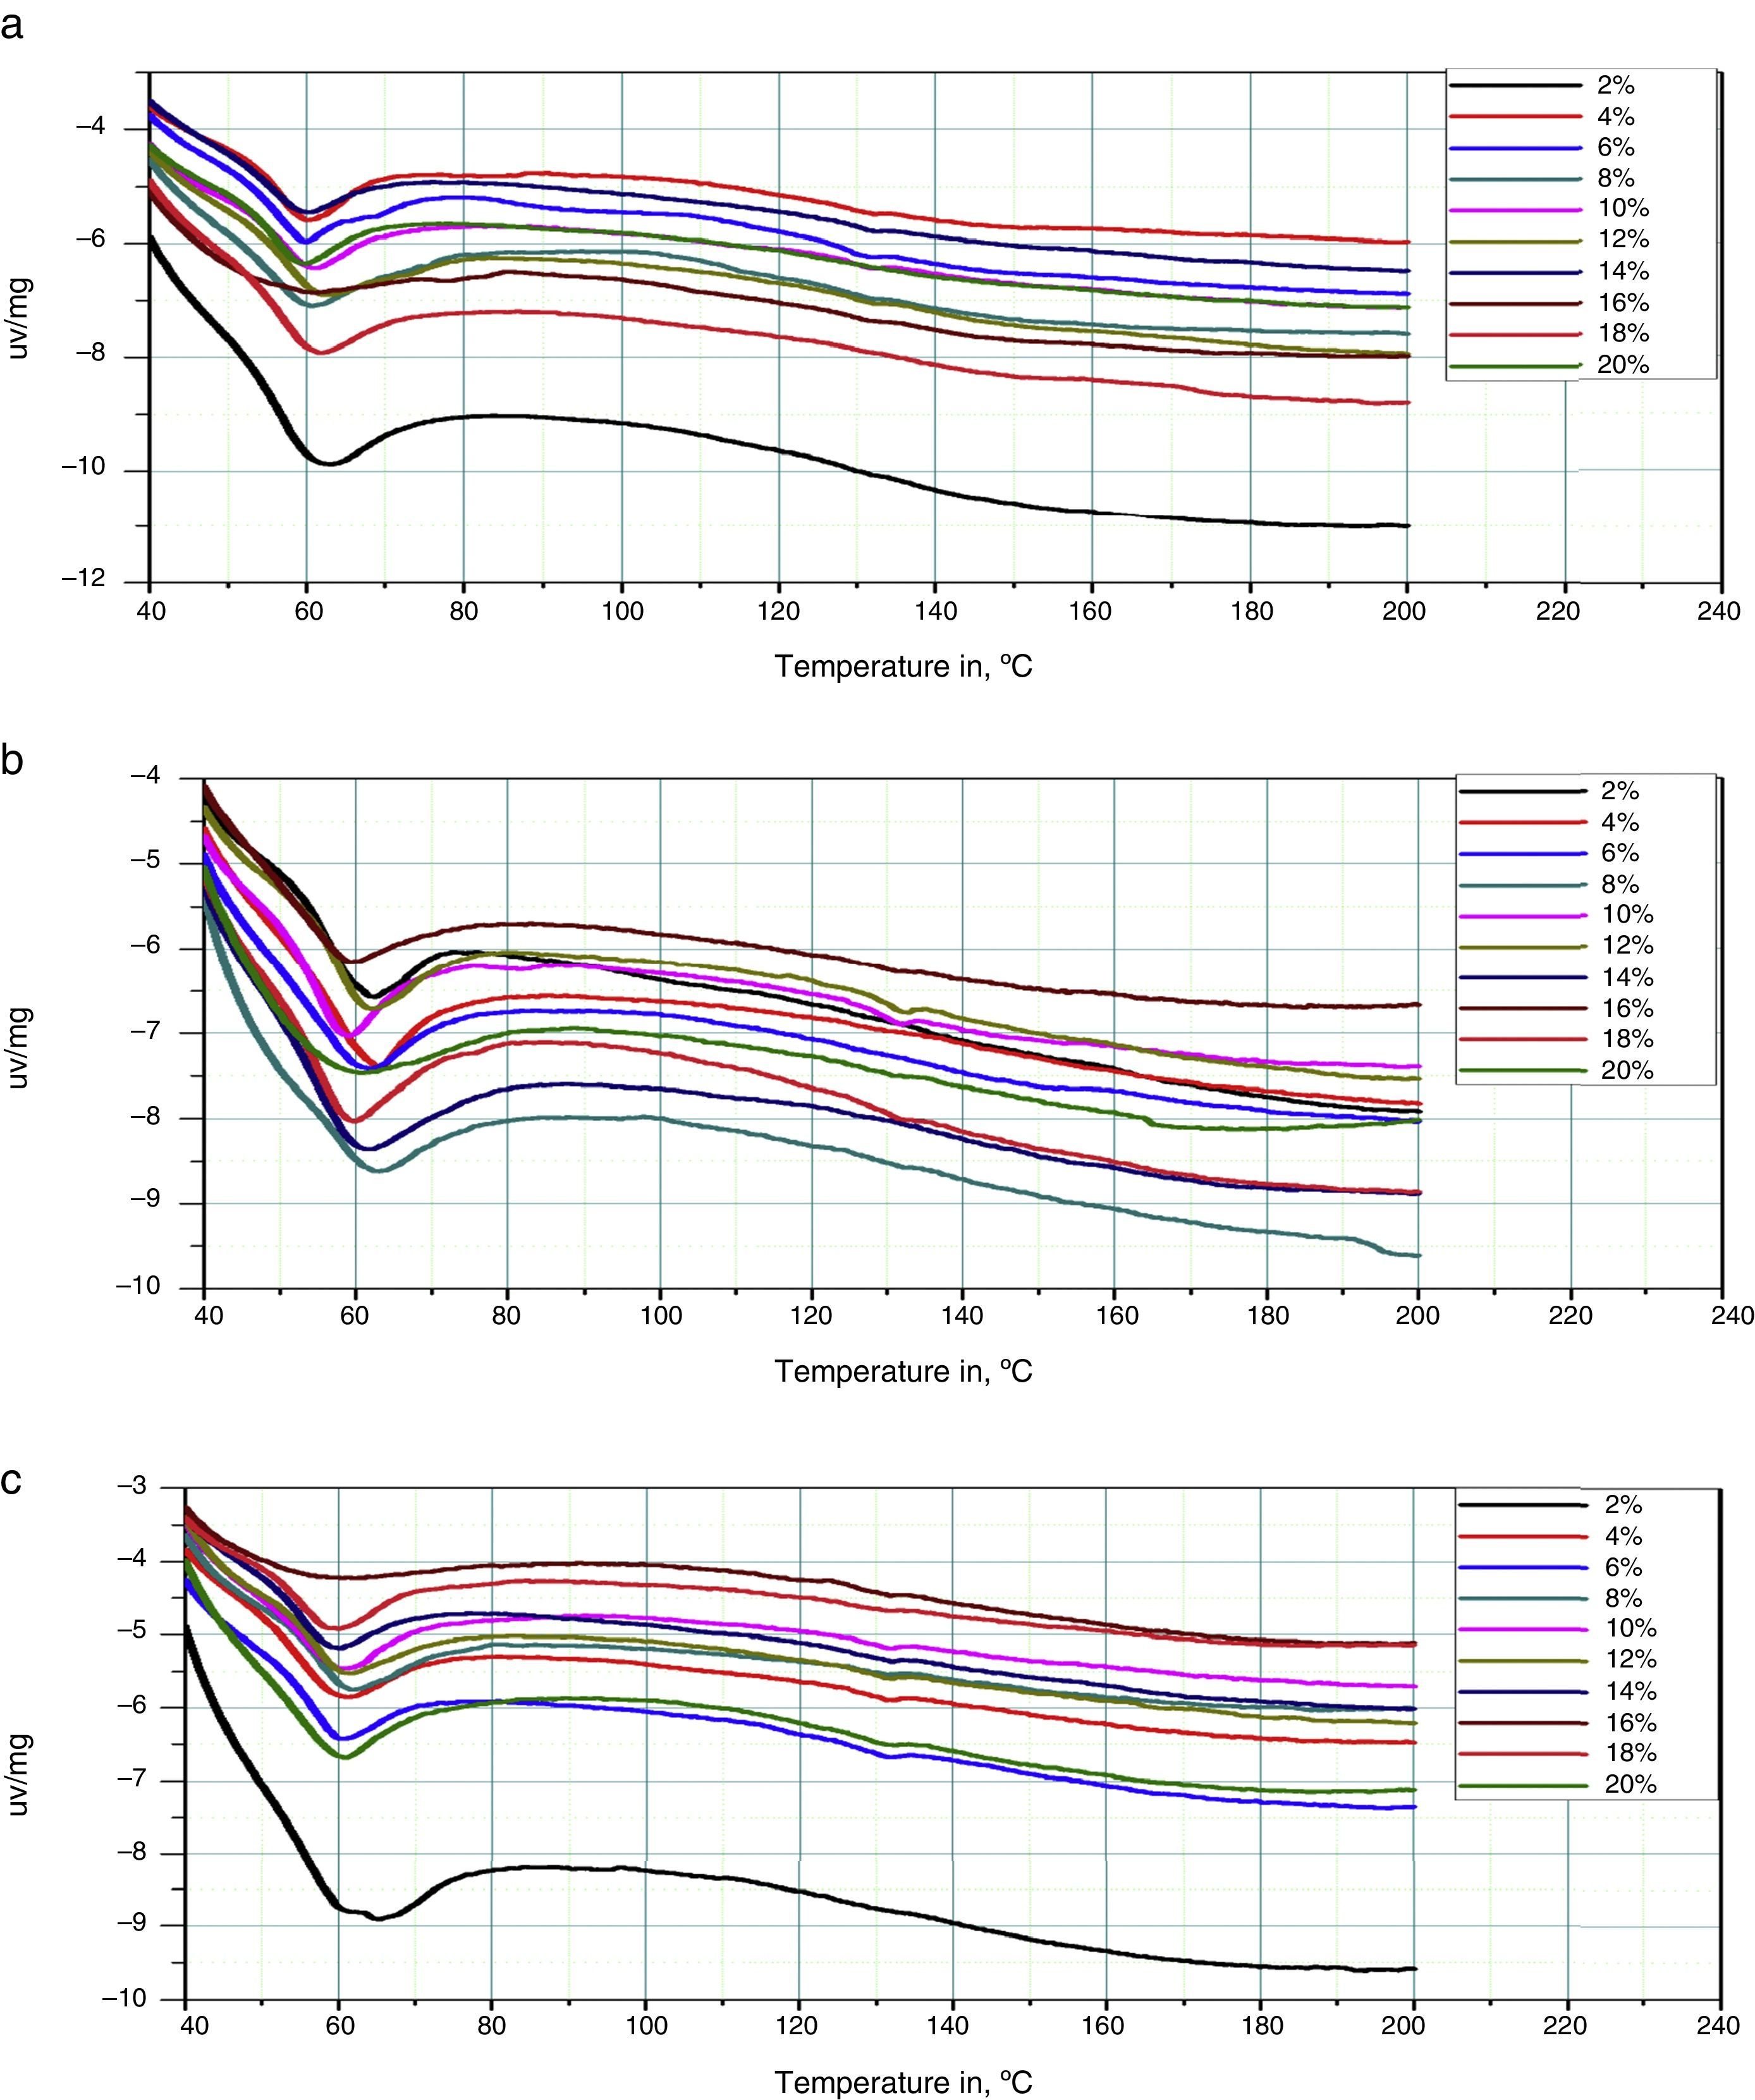
DTA results
The resin filled by metakaolin DTA results is shown in Figure 10.
- b.
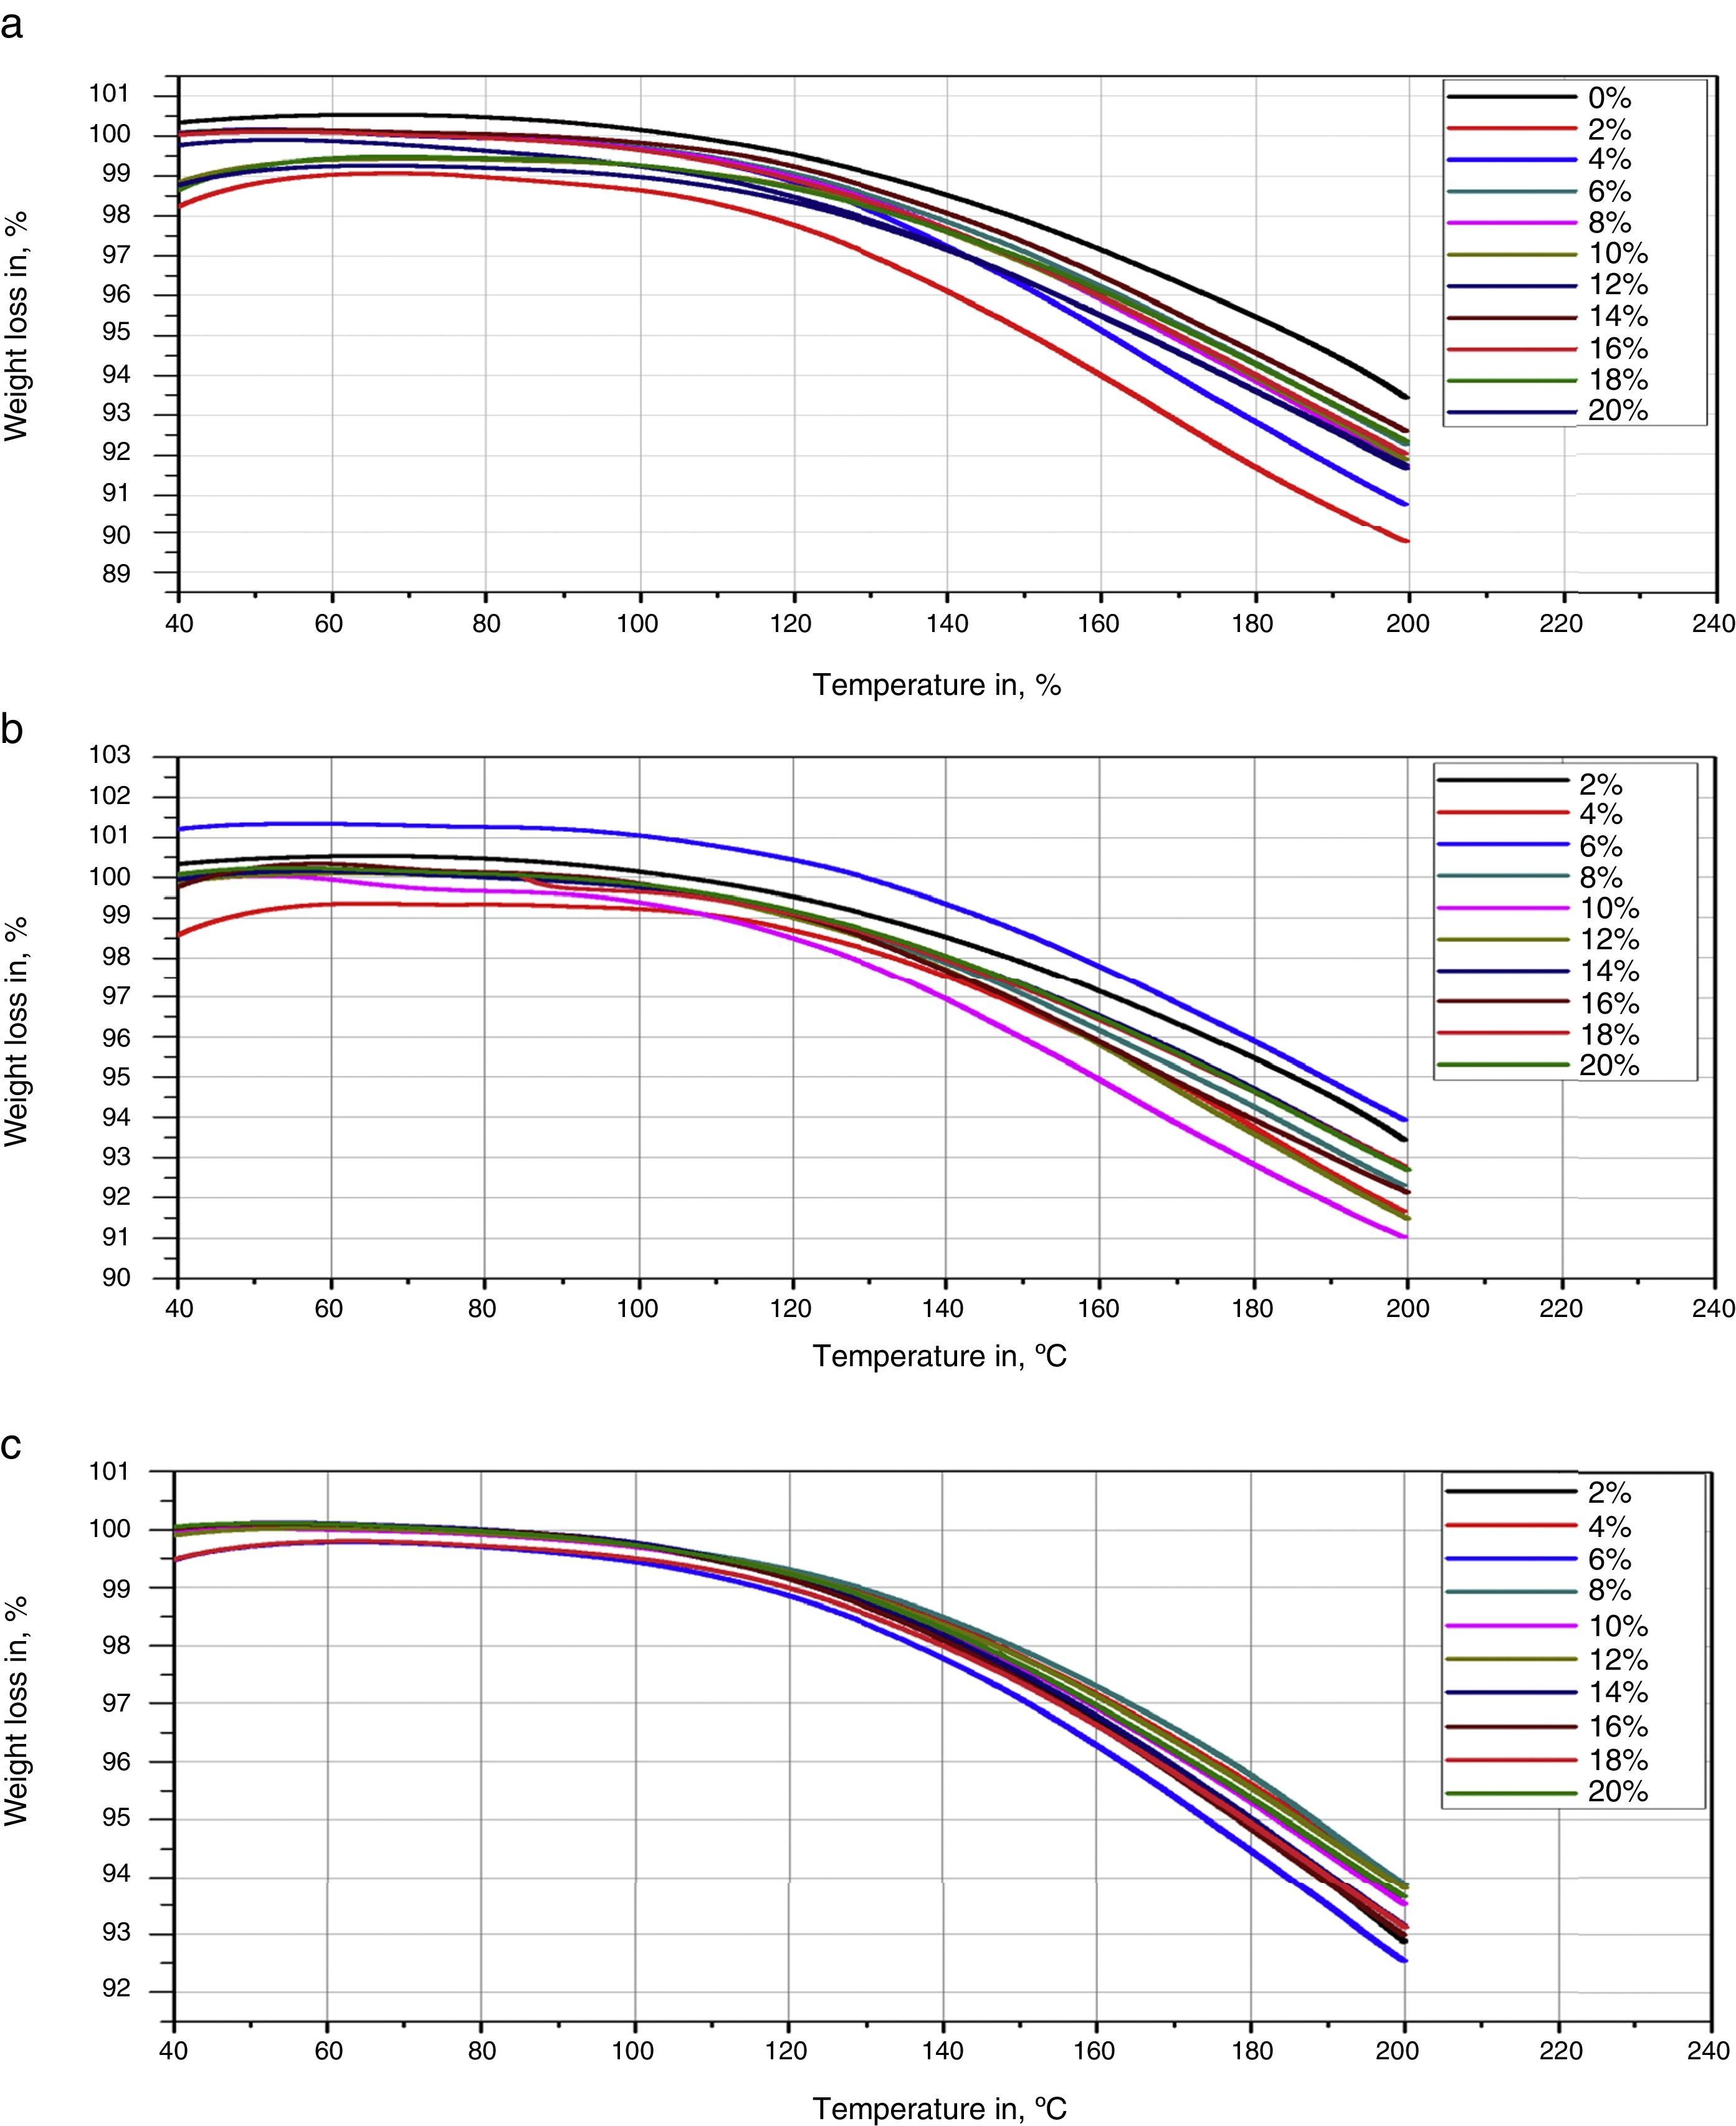
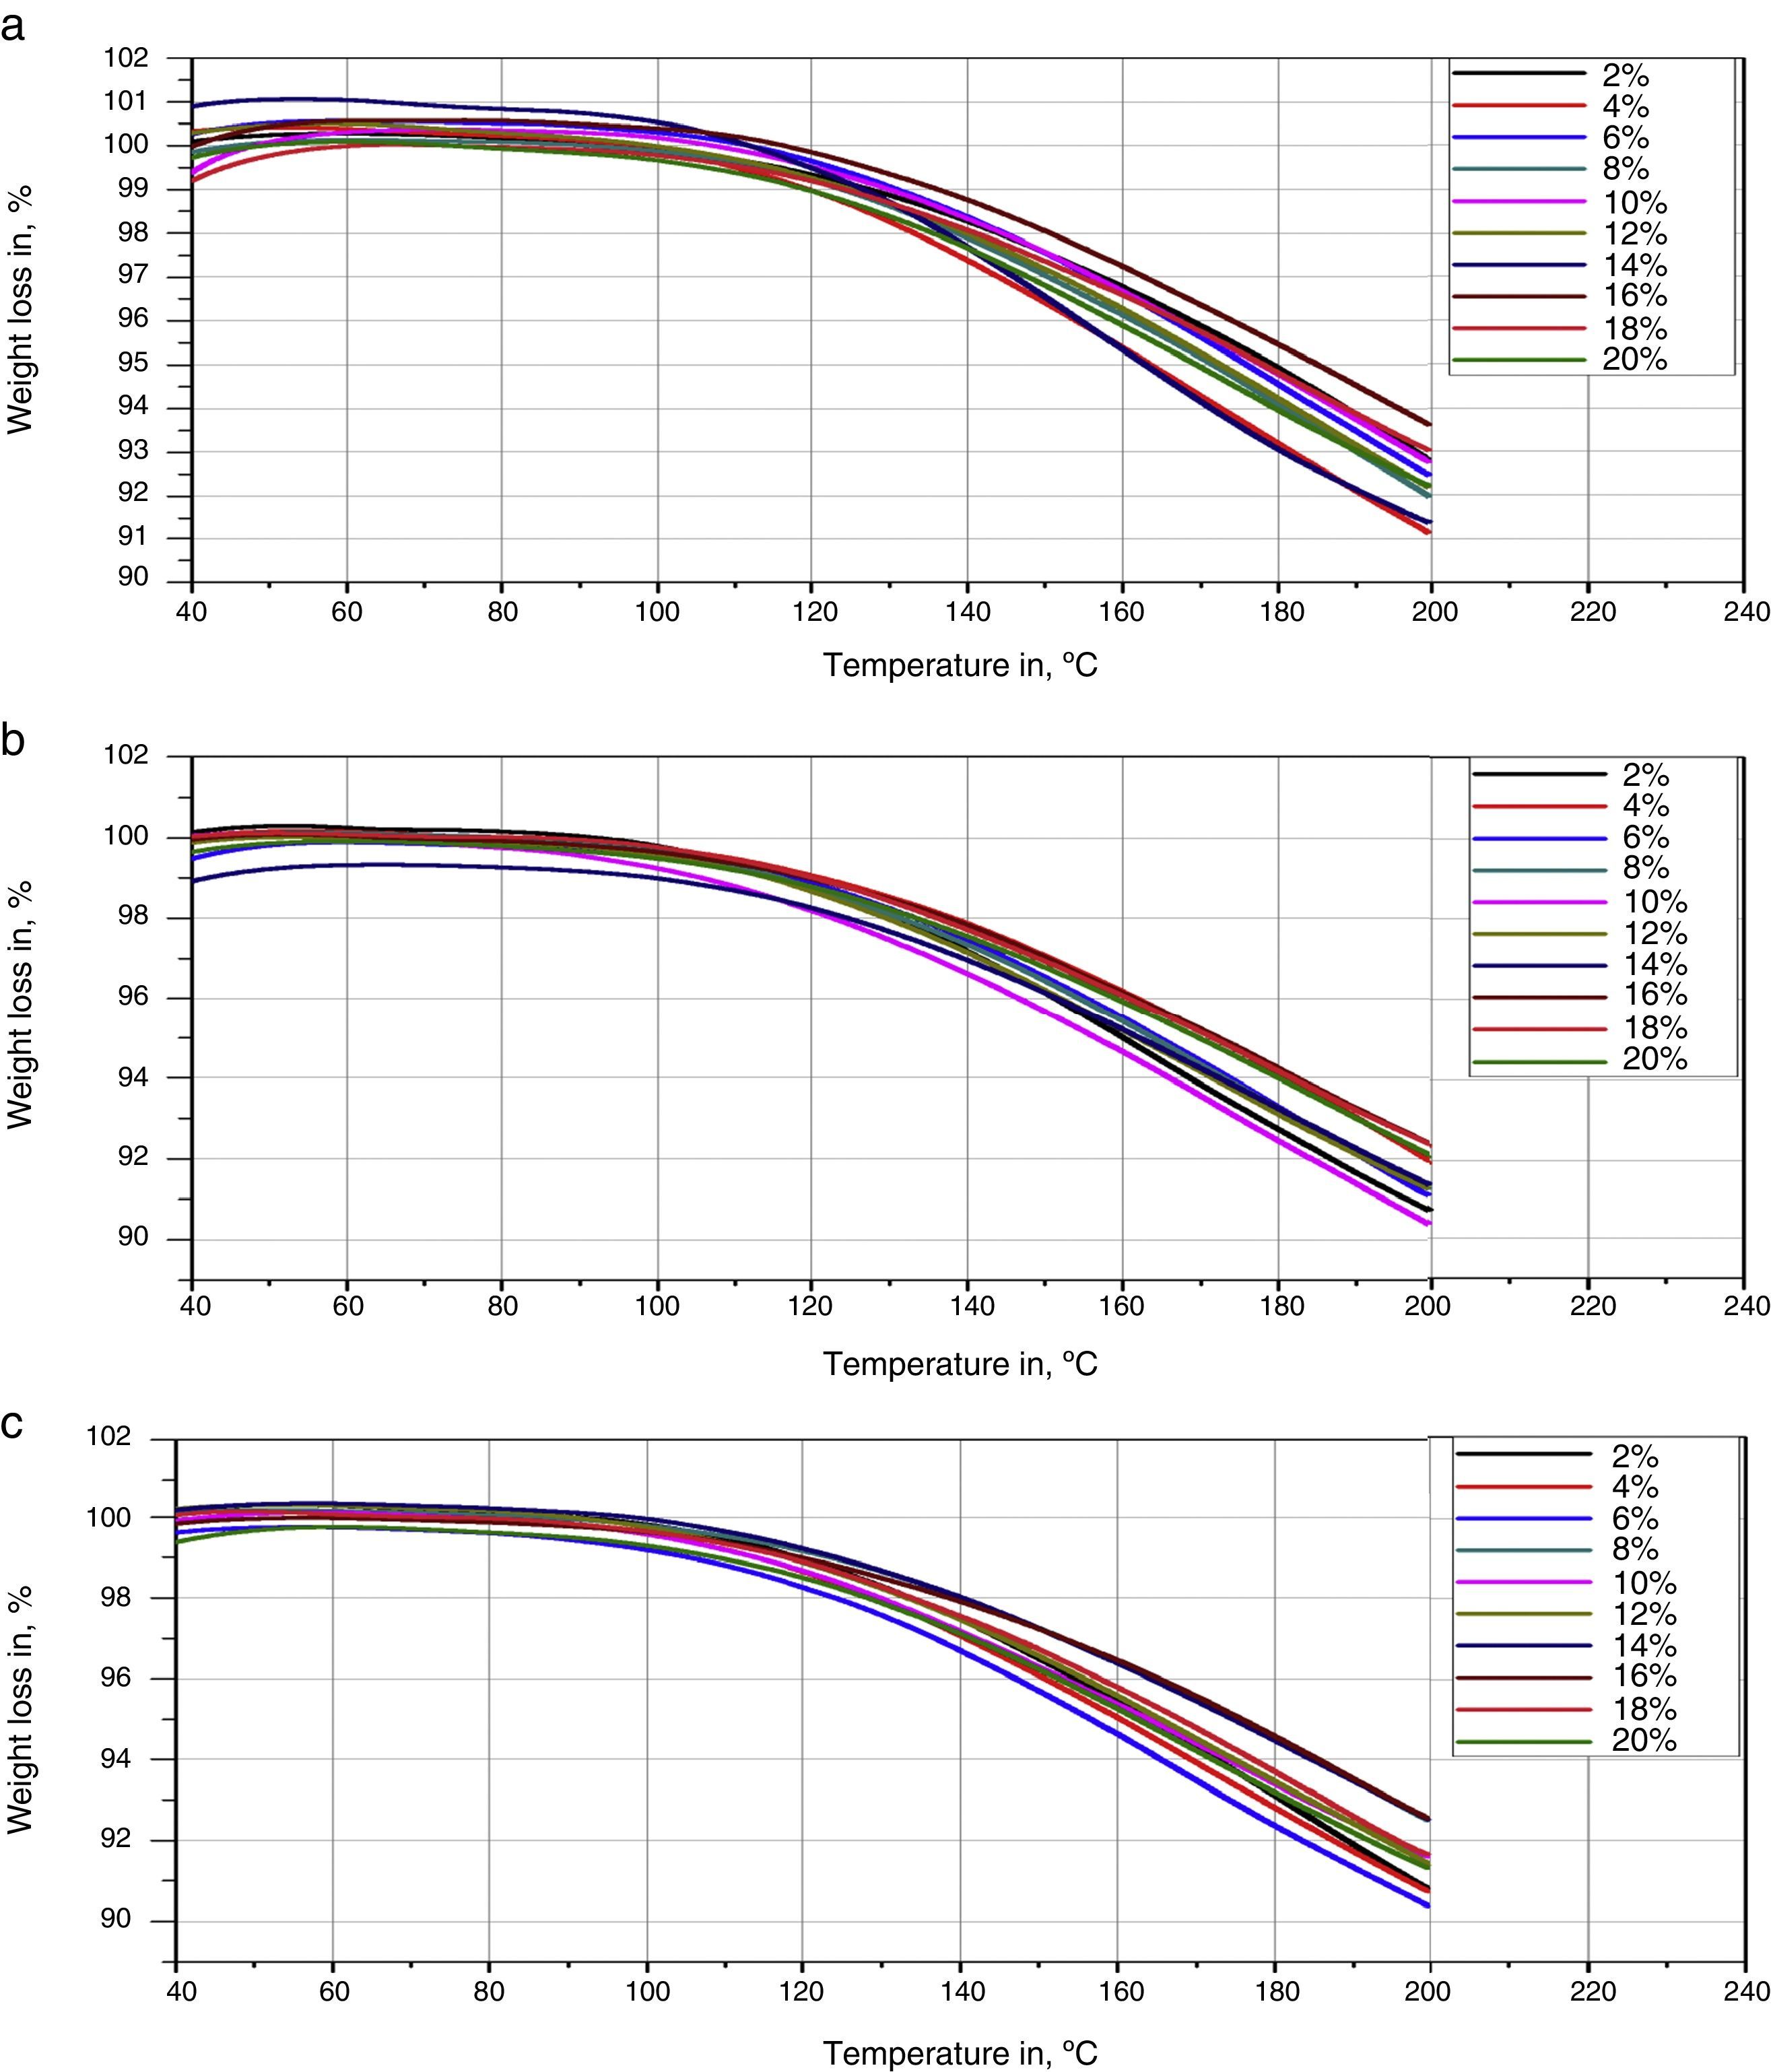
TGA results
The resin filled by metakaolin TGA results is shown in Figure 11.
 inject/MK1, (b) inject/MK2, and (c) inject/MK3.")
 inject/MK1, (b) inject/MK2, and (c) inject/MK3.")
The glass transition temperature varies from 403 to 413K. We notice that the clay filler has no influence on the resin, and there is no chemical interaction between the resin and the clay fillers.
We observed that the mineral fillers utilized, as well as their rates and sizes, do not affect the inject resin (Lehuy, 1990) has shown that the presence of charge has no significant influence on the glass transition temperature. These results indicate that there are no strong chemical interactions between the resin and the mineral filler with consequently a poor adhesion between the resin and the inorganic filler incorporated.
The TGA plot of the materials gives us a comparative analysis of filled and unfilled samples. These studies show that the degradation starting temperature is identical to that of the filled composite and the charged resins have a weight loss more important than that of the unfilled ones which varies from 7 to 9, while the resin without charges DM/M is equal to −7. Such difference is mainly due to humidity absorbed by the incorporated fillers in the matrix. These results confirm previous work (Giannelis, 1996) which showed that the corresponding micro composite (immiscible system to a micrometric scale) indicates no improvement in thermal stability. This confirms that dispersion is critical for improved thermal stability.
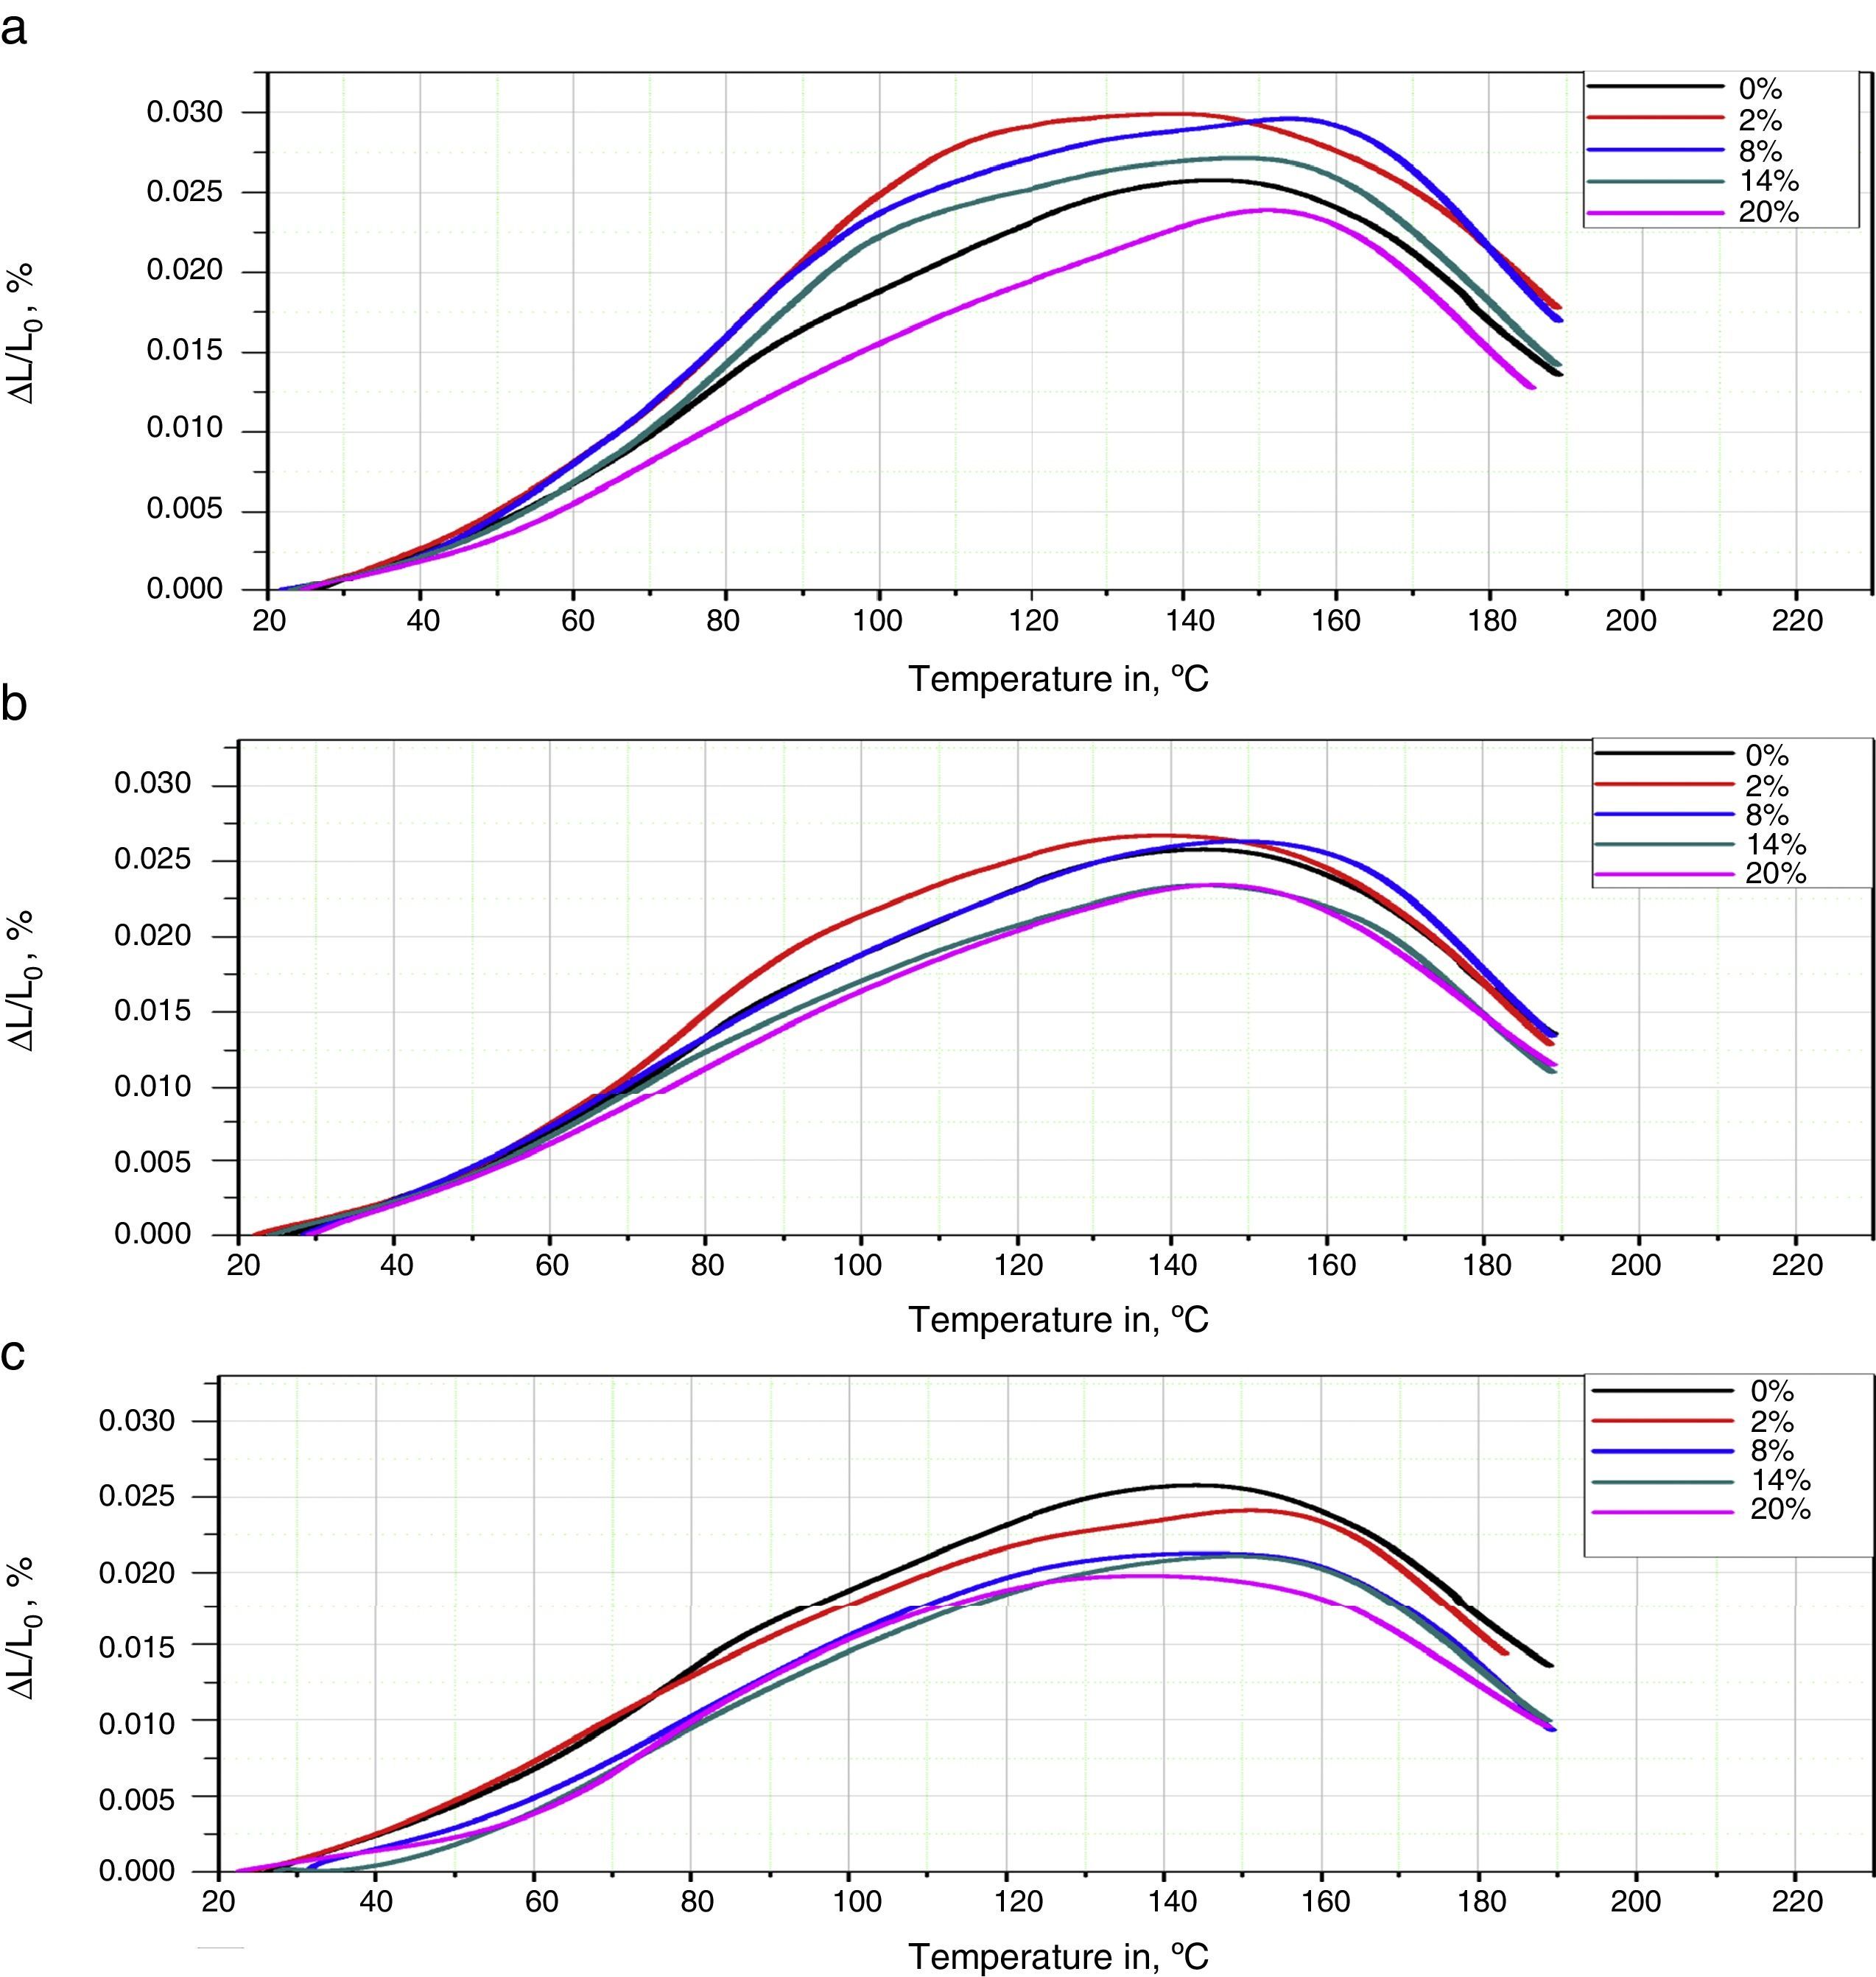
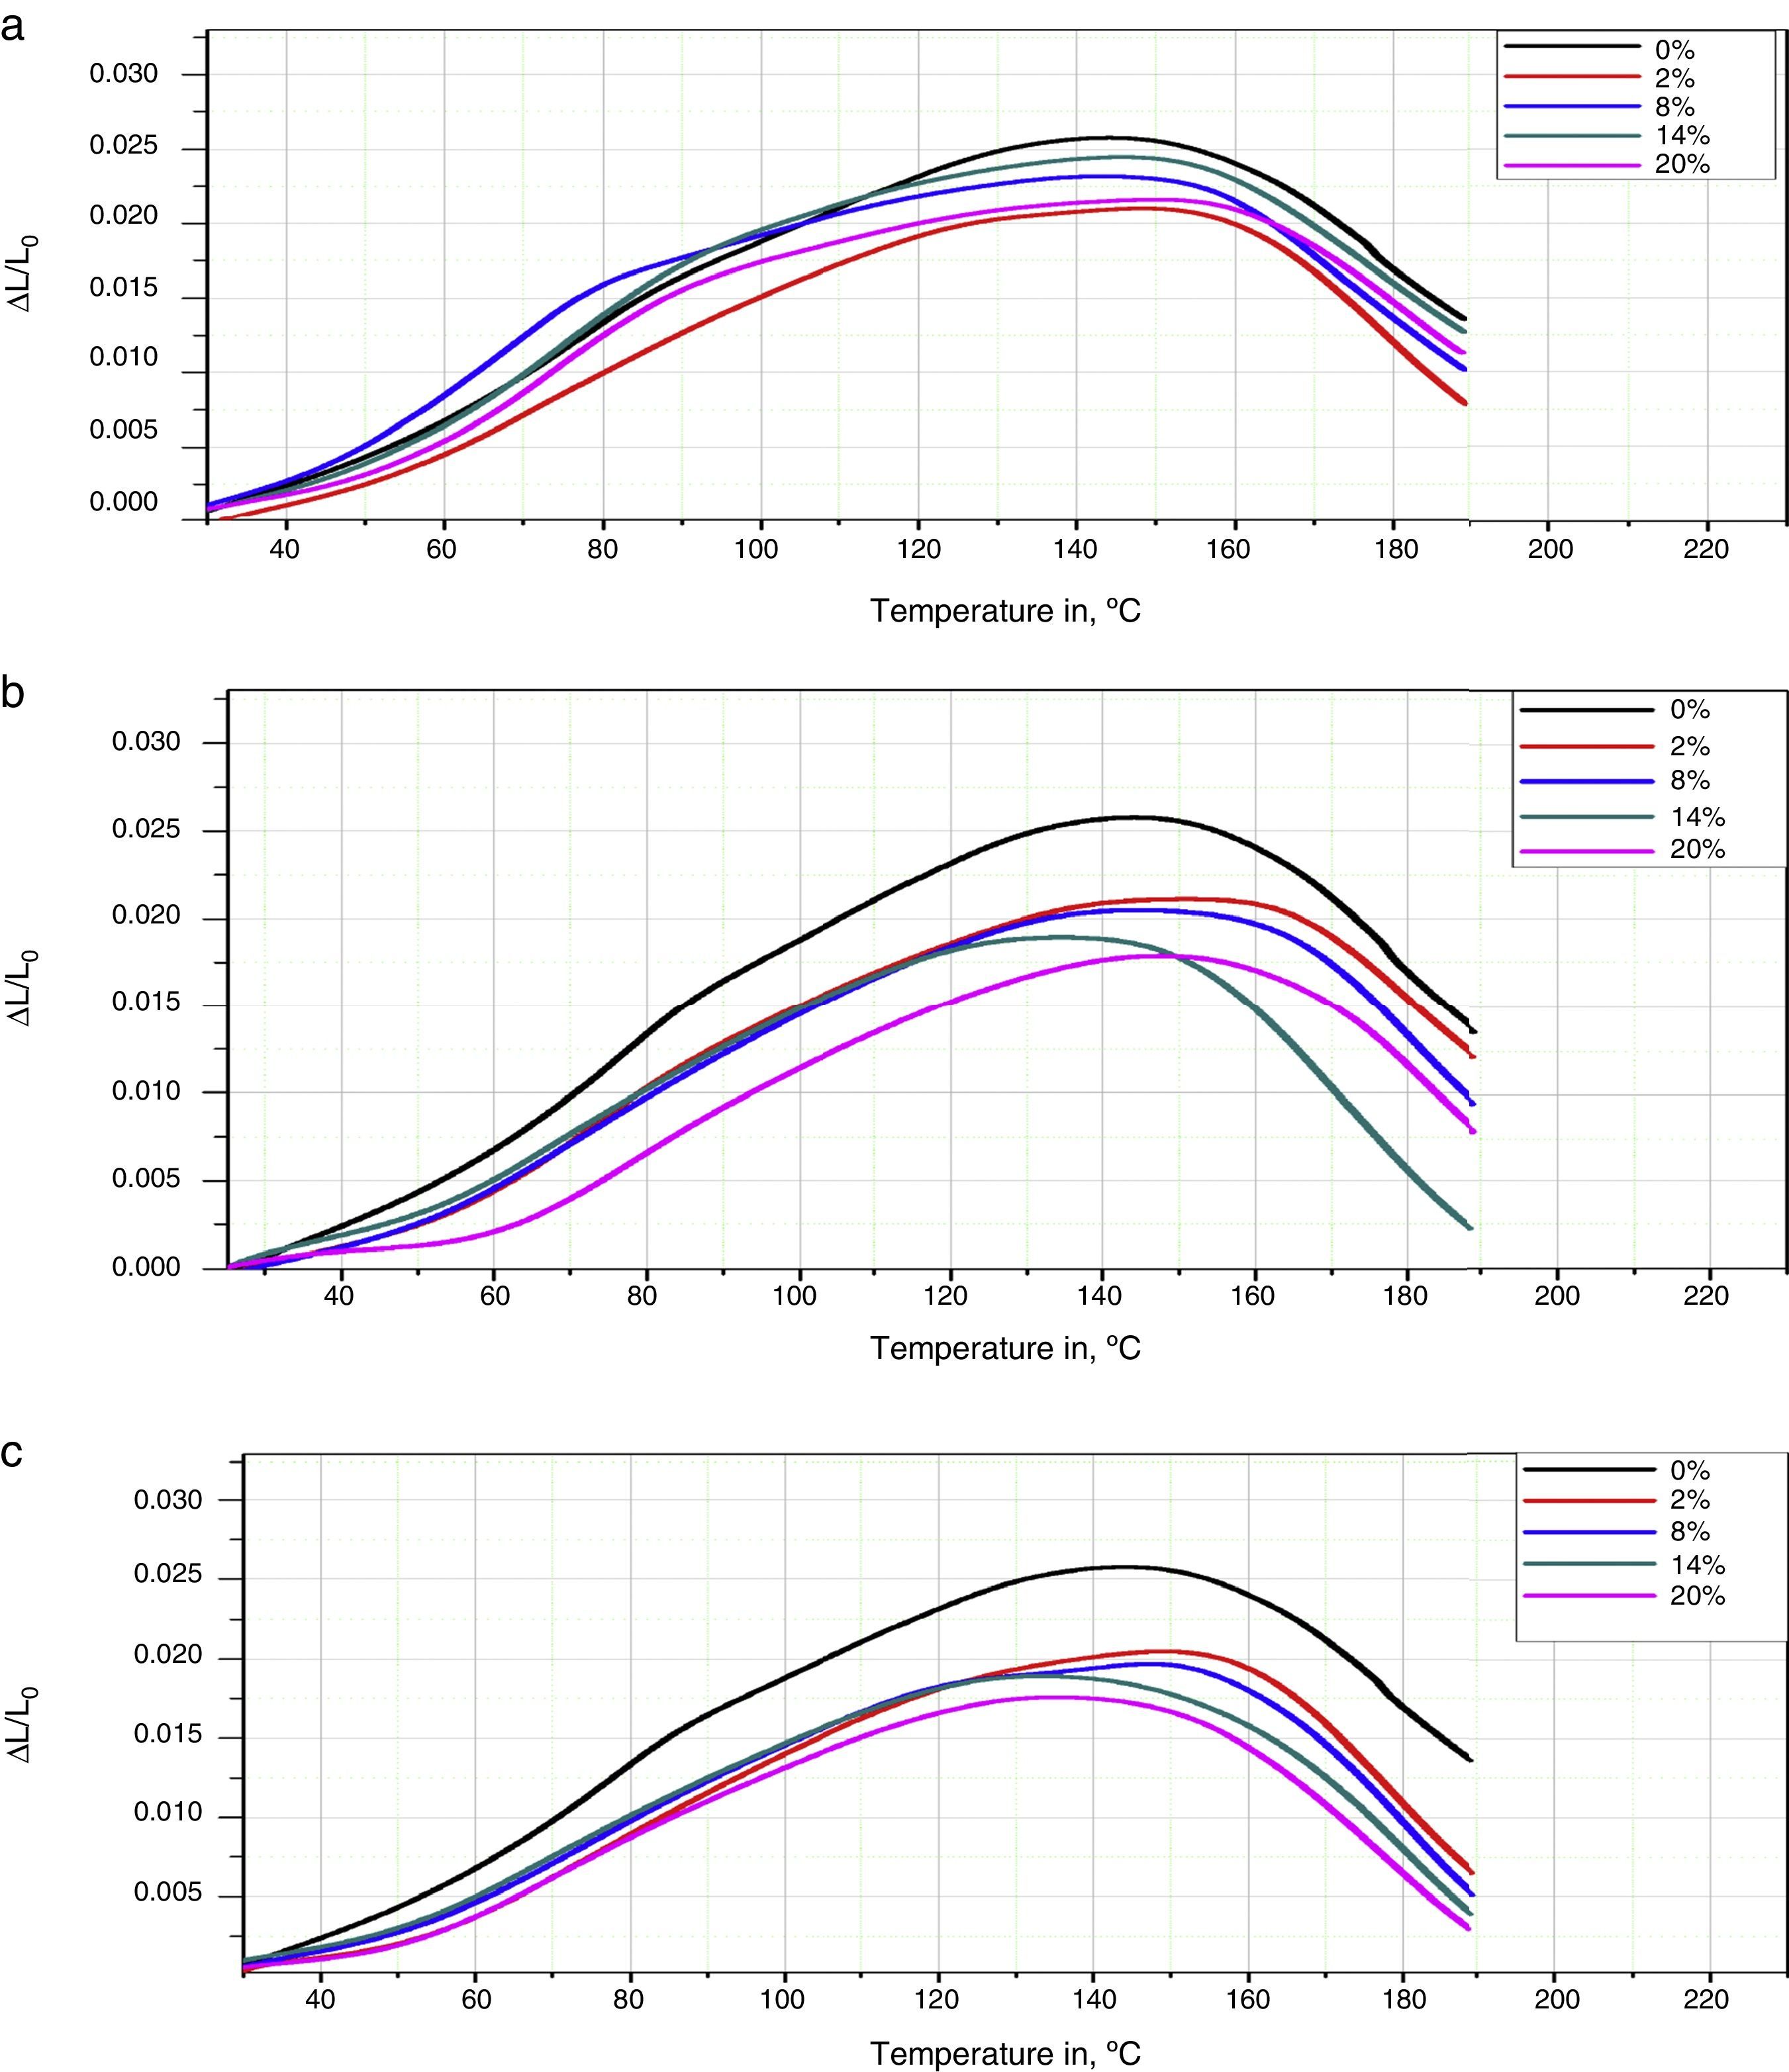
2.2.2.4Dimensional stability study by used dilatometerCylinder-shaped samples were used; the diameter was about 6×10⁻³m and the length 25×10−3m while the heating rate was set at 4.63K/s, the test was performed using a dilatometer DIL 402 C-NETZSCH of URMPE, results of resins charged by kaolin are presented in Figure 12.

Figure 13 shows the results of resins loaded with metakaolin.

The filled and unfilled resins exhibit an identical dilatation behavior and have a linear behavior up to 413K (transition temperature domain). Above which the dilatometry curve shows an abrupt change inducing a reduction of the elongation. We noticed a considerable shrinkage due to the presence of a certain amount of diluent in the resin and humidity absorbed by the fillers incorporated.
For temperature ranging from 273K to glass transition Tg, the matrix was in a vitrified state. It allow us to calculate the thermal expansion coefficient by using the following formula:
where L0 and L are, respectively, the initial length and the length at T temperature and α is the thermal dilatation coefficient.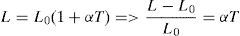
We can conclude that the unfilled resin has a higher thermal dilatation coefficient compared to the filled resins (Lehuy, 1990). The thermal dilatation coefficient decreases with increasing the fillers rate. For resins filled with finer particles, a lower thermal dilatation coefficient is obtained.
3ConclusionThe present paper reports the study of a composite material based on epoxy resin filled with local clay fillers powders possessing different structures; the study was conducted with different sizes at variable rates. The results obtained highlight the impact of kaolin and metakaolin, with respect to their size and rate, on improving the properties of the resin. The mechanical analysis shows a significant improvement of the filled resin compared to the unfilled one. We have additionally observed an increase of the elasticity modulus, the stress, as well as a decrease in the breaking elongation.
In the case of the kaolin filler, a low granulometry induces a good dispersion in the matrix, which in turn leads to an enhancement of mechanical properties.
Conversely, larger size particles negatively impact on the charge dispersion because of their own weight. To achieve improved properties, a high rate is required.
Metakaolin filled resins result in improved mechanical properties starting from 2%, thus reflecting a good compatibility between the filler and the inject resin.
The resins loaded with metakaolin give better results compared to kaolin-loaded. One may conclude that the presence of water molecules in the kaolin can notably degrade the bonds at the interface and thereby causing a degradation of the properties of the composite.
With regard to differential scanning calorimetry, it was observed that the glass transition temperature varies from 403K to 413K. In other words, there is no significant influence of the fillers, or their rate and size, on the glass transition temperature compared to the unfilled resin. These results show that there is no strong chemical interaction between the resin and the added clay fillers, resulting in a weak adhesion between the resin and the clay filler. According to previous studies, a good interaction is obtained when the fillers are treated.
The thermal analysis of the different materials provides a comparative assessment of the filled and unfilled resin samples and shows that the filled resin has a similar degradation starting temperature to the unfilled one whereas it displays a higher weight loss. This weight loss lies between 7 and 9 whereas it is equal to −7 for the resin without charges DM/M. This difference is due to humidity absorbed by the incorporated fillers in the matrix.
Observations made during the dilatometry analysis show that the fillers have a positive influence on the dilatation coefficient. The filled resins have a dilatation coefficient lower than that of the unfilled ones. From these results, it can be observed that the dilatation coefficient decreases with decreasing the particles size and with increasing the filler rate.
Finally, it can be concluded that for obtaining a good dispersion and interaction between the resin and the fillers, the clay fillers cannot be used without prior chemical treatment.
Conflict of interestThe authors have no conflicts of interest to declare.
Peer Review under the responsibility of Universidad Nacional Autónoma de México.