


Saturation of the magnetic core of transformers in a power system is an important effect that can be attributed to solar Geomagnetic Induced Currents (GICs). This saturation can conduce to voltage-control problems, generating harmonic currents, and heating of the transformer internal components, leading to gas relay alarm/operation and possible damage. This paper presents an analog physical reduced scale model of GICs in power transformers. The instrumentation employed to carry out this study consists of a single-phase reduced scale transformer, a controllable current source, a resistive load and a data acquisition system. The work establishes not only that it is possible to model the behavior of magnetic variables and to extrapolate the results to large full size power transformers, but also provides insight into GICs generation and their effects on power transformers. Obtained results are related to the non-linear behavior of GICs due to asymmetric saturation of the magnetic core in the power transformer, where computational model simulation is not able to give acceptable outcomes. Results are discussed for several GICs magnitudes, which include voltage, current, harmonics waveforms, magnetic core point of operation, the behavior of the stray flow, instantaneous power and core temperature.
Geomagnetic Induced Currents (GICs) are currents related to current flow in the ionosphere that interact with power systems. These currents are associated with solar storm activity and produce currents in the power grid that flow through transmission lines. These currents have a very low-frequency of 0.01–0.001Hz (quasi DC) with average magnitudes of 10–15A and peaks of up to 100A for 1–2min (Heindl et al., 2011).
Transformers with star connections and grounded neutrals that are linked by long transmission lines, as depicted in Figure 1, are susceptible to GICs problems due to the induced currents that flow through the transmission line and the neutrals that are grounded to close the circuit.

Several undesirable effects, produced by GICs in electrical power grids and transformers, have been reported. Moreover, when the DC magnetic flux is superimposed on the AC flux, the magnetic cores in the transformers are asymmetrically saturated (Lahtinen & Elovaara, 2002; Takasu, Oshi, Miyawaki, Saito, & Fujiwara,1994). The reported failures in transformers due to GICs are mainly dielectric and not a result of overheating. The effects of GICs on the grid and the transformers are summarized as follow: effects on the electric grid; on the one side when the reactive loads in the system are changed, the protections are misaligned and the internal resonant frequencies of the transformer change.
This process generates voltage surges that eventually degrade the insulation. On the other side, the magnetization impedance decreases, and the magnetizing current and the losses without loading increase. Reactive load absorption can cause instability in the electric grid (Berge, Varma, & Marti, 2011). Moreover, harmonics are contributed to the system, and even harmonics are generated.
Effects on the transformers are related to the relative permittivity of the magnetic core and the magnetization impedance decrease significantly (Bolduc, Gaudreau, & Dutil, 2000; Price, 2001). The magnetic core losses increase due to hysteresis, and eddy currents and the losses in the windings due to the Joule effect increase. Furthermore, the skin effect that is associated with harmonics in the current and in the magnetic flux increases. Heat increases in the fittings and tank due to the effects of eddy currents that are associated with increasing stray flux and with the appearance of even harmonics (Picher, Bolduc, Dutil, & Pham, 1997; Walling & Khan, 1991; Zhigang et al., 2010). The first harmonic vibration component in the transformer arises due to magnetostriction. Residual magnetism occurs in the core even when GICs are no longer present and the Inrush phenomenon occurs until the transient has died away.
These effects make it difficult to determine transformer design parameters that consider the effects of the GICs and adequately support them. The simulation of these operating conditions with a reduced-scale functional model provides useful information regarding the non-linear behavior of the transformer. In a real power transformer, these tests are very difficult to carry out, due to the big magnitudes of the currents and powers involved. This problem was resolved by using approximate numerical solutions. However, only real measurements are capable of validating these results. Currently, digital simulation tools do not account for time-dependent asymmetric saturation, which requires the development of specific models for each type of transformer (Egorov, 2007). The approach proposed in this work considers a fabricated small reduced-scale transformer, an experimental setup that permits the simulation of GICs and the use of instrumentation for measuring key variables.
2Reduced-scale model and GICs simulatorThe transformer model is specified and scaled in order to simulate GICs effects over real transformers. The focus in this work is to simulate only the core losses, losses in the windings produced by GICs, which are the dominant sources of heat associated with the currents and magnetic fluxes harmonic content.
2.1Reduced-scale transformerTo manufacture transformer scaled must consider several design parameters so that their behavior is as close as possible to real transformers. For example, the operating point of the magnetic core is desired to be equal to the real transformers. The sectional area of the magnetic core and windings must be scaled based on the transformer's power. High voltage windings were not considered since only the effects of the currents in the transformer are intended to be analyzed. A single phase of a three phase transformer bank scaled manufactured to simulate in the GICs was selected.
2.2Structure of the GICs simulatorThe simulator consists of a transformer with single-phase reduced scale with three legs, a controllable current source, a resistive load and the electronic instrumentation data acquisition system for measuring the primary and secondary voltages and currents, DC current in order to simulate GICs, the density stray magnetic flux outside the magnetic core and the temperature of the transformer core for different operating points. Figure 2 shows a simplified schematic diagram of the simulator.

The scaled single-phase transformer was designed to be feed with a voltage of 120V in the primary and the secondary 6.0V and a load current in the secondary of 100mA and shell-type construction. A resistive load of 50Ω, which is the rated transformer load, was considered. The objective of this simulator is to evaluate the effect of GICs with the transformer operating at its rated load.
The reduced-scale transformer is feed by a variac that allows changing the supply voltage from 0 to 120VAC. The source of DC current “IDC” that simulates the GICs, allows the current supplied to the secondary of the transformer to be adjusted from 0 to 250mA DC, from 0 to 250% of the value RMS of nominal current. The IDC current mainly flows through the secondary winding of the transformer because its resistance is 1/50 of the load resistance. The currents in the primary and secondary transformer are measured by resistive shunts, and the voltage measurement points have voltage dividers that are appropriate for not exceeding the voltage limits of the data acquisition system.
The stray magnetic-flux density is measured with a Hall-effect sensor that is located in the external portion of the core, at the central leg and parallel to the magnetic flux that is produced by the transformer winding. This localization was chosen to determine the leakage flux that leaves the magnetic core when GICs are present. The temperature is measured with an LM35 sensor that is attached to the magnetic core. The reason for the temperature measurement in the magnetic core is to determine the increase of heat produced by harmonics associated with GICs. The DC source current, the Hall-effect sensor and the temperature meter were powered with an independent AC/DC source.
2.3InstrumentationThe instrumentation is based on a commercial data acquisition system that digitizes the measured variables at a rate of 20,000samples/second. A control program that was developed in graphical language allows the instrument to acquire the waveforms of the measured variables simultaneously.
The control program allows the user to visualize the behavior of the variables in time and frequency domain. The frequency spectrum of the measured waveforms is spread out by using a discrete Fourier transform via a Hamming window, and the root mean square (RMS) values and the THD (Total Harmonic Distortion) of the involved variables are also spread out. The program also shows the behavior of the saturation curve for each operating point. The temperature behavior during the test can be used to estimate the losses associated with each simulation execution.
3Simulation results and discussion3.1Asymmetric non-linearity with GICs and its effect on waveformsThe voltage waveform in the primary corresponds to the supplied AC power, which is a low-impedance source. The primary current shows significant changes as the IDC current increases in the secondary. The average value of the primary current is zero, but the waveform indicates half-wave asymmetry. The peak value of the current is higher by a half-wave compared to the other. This difference demonstrates the decreasing magnetization impedance in the half-cycle, when the peak current is larger. Figure 3 shows two current waveforms that are seen from the primary. The red curve has no IDC component, while the blue curve corresponds to the primary current plus IDC component in the secondary which simulates the GICs. The voltages at the secondary positive and negative peaks are deformed due to symmetrical saturation under normal conditions. However, when the IDC component is present, the half-wave symmetry is lost, and the duty cycle is asymmetrical.

Figure 4 shows the current waveforms of two conditions on the secondary, with and without IDC current that were measured on transformer winding.
3.2The behavior of the generated harmonics
The voltages and currents waveforms in the secondary of the transformer during nominal operating condition, where the fundamental frequency can be 50Hz or 60Hz, have symmetry of half-wave and are associated with symmetric saturation of the magnetic core. This behavior only has odd-harmonic components. Thus, the harmonic components of 1, 3, 5, 7, … represent the components that possess these waveforms and satisfy the following property:
where T is the period of the periodic signal.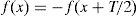
When the GICs flow through the secondary winding, even harmonics are generated as a product of asymmetric nonlinearity and the magnitude of the odd harmonic components remains constant. Even harmonic components appear in the primary and secondary current and secondary voltage. Figure 5 shows the harmonic components of the primary current with and without GICs, depicted as solid red and blue curves, respectively. Figure 6 shows the changing magnitudes of the largest harmonics as a function the magnitudes of the IDCs.


The operating point of the magnetic core is obtained from the graphical representation of the magnetic flux density (B) and the magnetic field intensity (H). The BH curve shows how the magnetic flux density changes as the alignment of the magnetic domains changes within the magnetic circuit. Once all domains have been aligned, the saturation point is reached, and further increases in magnetic field intensity have little changes of the magnetic flux density. The area of the hysteresis loop corresponds to the energy dissipated as heat by the magnetization and demagnetization process during each cycle. Figure 7 shows two operation conditions with and without an IDC component. These curves are obtained by plotting the integral of the secondary voltage (proportional to magnetic flux density “B”) on the vertical axis and primary current on the transformer (proportional to ampere*turns “H”) on the horizontal axis.

A qualitative analysis indicated that the saturation curve is symmetric about the vertical axis when no DC current is present. However, when the DC component is present, the curve shifts to the right in the first quadrant, which indicates increasing saturation. In contrast, the saturation decreases in the third quadrant.
No significant change was found in the area of the hysteresis curve when the GICs levels are present. However, when the GICs level is higher, the area increased due to the level of harmonics increase.
3.4Stray magnetic flux density and its relationship with the magnetization currentThe waveform of the magnetic flux density measured in the outer portion of the core is similar to the current waveform measured in primary of the transformer (Fig. 3). Therefore, the magnetic flux density and the current in the primary of the transformer have the same harmonic content. Similarly, the magnetic flux density has a DC component only when GICs are present. Figure 8 provides a comparison of the two waveforms. The curve in blue corresponds to the presence of GICs, and the curve in red corresponds to the absence of GICs.

The magnetic flux density can be measured in the fittings and tank and with this information; losses in the critical mechanical parts of the transformer can be estimated.
3.5Impedance as seen from the primaryThe relationship between the voltage and current RMS values gives an idea of the impedance magnitude when the GICs occur. When a DC component is present in the secondary, the impedance varies as follows:
where a and b are parameters that depend on the supply voltage. Figure 9 shows the impedance behavior as a function of the IDCs at different input voltages. This was obtained by curve fitting behavior.3.6Power associated with the transformer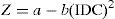

Instantaneous power is obtained by multiplying the voltage by the current point by point, which results in a time-dependent function. Figure 10 shows the instantaneous power based on the primary winding of the transformer with and without the DC current depicted as red and blue lines, respectively, on the secondary winding.

The power has a component that is twice the frequency, even harmonic components, in the absence of the IDC. However, when the IDC is present, the component of the first harmonic appears in the instantaneous power and odd harmonic components.
The real power is obtained by using Eq. (3).
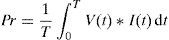
If the average real power transferred by the transformer without GICs is 100%, the real power is 68% when IDC is present. Consequently, the real power at the input the transformer decreases by 32% when the IDC is present. The reactive power change is from 100% to 166% VARs (under the same conditions), which corresponds to an increase of 66% in the absence of the IDC. In contrast, the peak instantaneous power values increase by 29%.
If we consider the product of the “RMS” voltage and current, the magnitude of the apparent power can be obtained. The behavior of the apparent power based on the IDC and for different supply voltages is shown in Figure 11. In addition, Figure 11 displays a parabolic behavior that is similar to the behavior that is presented in Figure 9.
3.7Thermal behavior
The amount of heat generated by the core losses (in the windings and fittings) results in non-uniform temperature increases in the transformer. However, if the total concentrated losses are considered, the temperature increase follows an exponential function relative to the amount of heat generated by all losses, the transformer mass, the environmental temperature and time evolution. Figure 12 shows the temperature measurement results on the transformer core. During the first period, only losses from the transformer occurred. The temperature tends to stabilize during the second period. In addition, when the DC current is applied, the temperature of the transformer increases.

The performance of the core temperature with and without the IDC can be approximated by using the following equations:
where T represents the temperature (°C) and t is time (min). Eq. (4) is only valid over the time interval of 0<t<52, while Eq. (5) is only valid for t>52. The time constants in Eqs. (4) and (5) are different because new heat sources appear when the GICs are present. For example, the heat produced by “eddy currents losses” on the core and windings.4Conclusions

The simulation of GICs using a reduced-scale transformer model provide insight into the effects that occur on parameters such as voltage, current, power, magnetic flux and thermal behavior. This simulation permits to observe the harmonics conduct produced at the operating point of the magnetic core. In addition, the losses and the reactive load variations can be estimated when the GICs are present. Changes can be observed in the operating point of the transformer due to the GICs, which mainly affect real power transference, variation in its impedance and the increase of losses. Each transformer has a unique electrical, magnetic and mechanical design in which the characteristics of the materials are very important. Therefore, to apply the proposed solution, manufacturing a scale model and the simulation of its behavior under the effect of GICs is required for each transformer design. The information obtained from the simulation can be used to obtain design rules and validate mathematical simulation models. Consequently, design rules can be optimized considering the GICs. Future studies will aim to develop elaborate scale models for real transformers in order to simulate their behavior under the influence of the GICs. Further studies will explore the effects of GICs in three-phase transformers with three, four, five legs and power of 100kVA, which will be constructed with different design criteria. One current technological challenge is the establishment of test methods for evaluating the performance of transformers with more than 1MVA when influenced by GICs.
Conflict of interestThe authors have no conflicts of interest to declare.
Peer Review under the responsibility of Universidad Nacional Autónoma de México.