


Metal matrix composites are replacing the traditional material world because of their superior mechanical properties. Consequently, the necessity for accurate machining of the composite has increased drastically. The major problems while machining metal matrix composites are surface roughness and cutting force. The present work focuses on the study of the cutting conditions which influence the cutting force and surface roughness in terms of spindle speed, feed rate, axial, radial depth of cut and weight percentage of silicon carbide particle (SiCp). Central composite rotatable second order response surface methodology has been employed to create the mathematical model. The adequacy of the model has been verified using analysis of variance. The direct and interaction effects of the process parameters have been studied to keep the cutting force and surface roughness minimal.
Milling is a metal removal process of feeding the work against a rotating multipoint cutter. The ratio of the metal removal rate is rapid as the cutter rotates at a high speed and has many cutting edges. It is employed to produce slots, pockets, precision molds and dies, automotive and aerospace components. Cutting force cause deflections of the part or machine structure and supply energy to the machining system which results in excessive cutting temperature or unstable vibrations. The reason for analyzing cutting force of the machine tool is to estimate tool forces that must be resisted by machine tool components, bearing loads, jigs and fixtures and power requirement. To satisfy the demands on product capabilities and functions, natural materials are insufficient and hence metal matrix composites (MMC) are considered. MMC consists of at least two components, of which one is a metal matrix and the other is a reinforcement. The metal matrix is generally an alloy. MMC has been studied mainly for the aerospace industry and space component due to a higher specific modulus, higher specific strength, lower coefficient of thermal expansion, better wear resistance, better properties at elevated temperature. Recently, electronic and automotive industries have been concentrating the composites (Rosso, 2006).
The cutting force model in turning of LM6/SiCp metal matrix composite has been proposed by Joardar, Das, Sutradhar, and Singh (2014).
The cutting speed, depth of cut and weight percentage of silicon carbide were specified as machining parameters. Sequential approach in face central composite design saves the number of experimentations needed. The author pointed that tangential cutting force and radial cutting force are more sensitive to cutting speed. Jeyakumar, Marimuthu, and Ramachandran (2013), carried out the mathematical model of cutting force, tool wear and surface roughness during end milling of Al6061/SiCp composite under dry condition. The cutting force component in the z-direction was at significantly higher magnitudes than that of the x-direction. The results indicated that the depth of cut was the dominant factor affecting tool wear, cutting force, and surface roughness. Palanikumar and Muniaraj (2014) employed the response surface method to analyze the thrust force in the drilling of hybrid metal matrix composites by coated carbide drill. The burr formed because of thrust reduced the hole quality. They demonstrated that the thrust force and burr formation were most influenced by the feed rate. Kalla, Sheikh-Ahmad, and Twomey (2010) put forward a mechanistic modeling technique to predict the cutting force by transforming specific cutting energies from orthogonal to oblique cutting in helical end milling. They concluded that proposed model was reasonable for unidirectional but less desirable for multi-directional composites.
Pramanik, Zhang, and Arsecularatne (2006) built up a systematic model for predicting the forces using Merchant's analysis, slip line field theory of plasticity and the Griffith theory of fracture. They stated that the force during the chip formation is higher than the ploughing and particle fracture. Sivasakthivel, Vel Murugan, and Sudhakaran (2010) brought forward a central composite rotatable second order response surface methodology to develop a mathematical model to predict cutting forces in terms of helix angle, axial depth of cut, radial depth of cut, feed rate and spindle speed of Al6063 of high speed steel end mill cutter. The experimental results showed that increase in feed rate and axial depth of cut reduces the infeed and crossfeed force. Babu, Selladurai, and Shanmugam (2008) established the effects of cutting parameters on the variations of cutting forces of Al SiCp metal matrix composite material. The author concluded that cutting forces were sensitive in the high speed and full immersion condition. They stated that with the increase in the depth of cut, cutting force in tangential direction increases.
Seeman, Ganesan, Karthikeyan, and Velayudham (2010) studied the tool wear and surface roughness during the machining of Al metal matrix composite. The result showed that the tool wear was affected by BUE formation at low speed and better surface finish was achieved at low feed rate with high speed. Anandakrishnan and Mahamani (2011) experimentally investigated on in situ MMC using uncoated tungsten carbide turning insert. They concluded that with the increase in the depth of cut, the rate of flank wear, cutting force and surface roughness increase. Palanisamy, Rajendran, and Shanmugasundaram (2007) optimized the machining parameters such as speed, feed, depth of cut using genetic algorithm, yield to minimize machining time while considering the technological constraints as cutting force, tool life in end milling process. Davim and Baptist (2000) discussed the relationship between cutting force and tool wear when machining the composite. In drilling, correlation was obtained between evolution of flank wear of the drills and the feed force. Similar correlations have been obtained by turning between the evolution of flank wear of the insert and the feed and depth forces.
Valarmathi, Palanikumar, and Latha (2013) analyzed the thrust force for composite panel based on Taguchi's design of experiments and response surface methodology. The authors have taken input parameters such as spindle speed, feed rate and point angle. Their results indicated that high spindle speed with low feed reduced the thrust force. Arokiadass, Palaniradja, and Alagumoorthi (2012) studied the effects of speed, feed depth of cut and % weight of silicon carbide on tool wear in machining LM25 Al alloy reinforced with SiCp in end milling operation. They analyzed the process constraints on performance characteristics using ANOVA. The decision attained by them is that the spindle speed and the content of SiCp are the influencing factor on tool wear.
Mahesh, Muthu, and Devadasan (2015) propounded a methodology to study the optimum cutting parameter aiming to minimize the surface roughness through response surface methodology and genetic algorithm (GA). They analyzed the direct and interaction effect of cutting parameter using design expert software. The conformity test have shown that there is a good agreement with predicted and observed values. Makadia and Nanavati (2013) investigated the influence of machining parameters as feed rate, tool nose radius, cutting speed and depth of cut of turning on the surface roughness of AISI 410 steel. Three level full factorial design of experiment has been used to conduct the experiment. Response surface optimization was employed to get optimum machining condition. Shihab, Khan, Mohammed, and Siddiquee (2014), studied the surface integrity in terms of surface roughness and microhardness of the dry hard turning process. Three levels, three parameter central composite design was employed to collect the experimental data. Good surface integrity has been achieved by keeping feed rate and depth of cut as lower level.
Raju, Janardhana, Kumar, and Rao (2011), applied the multiple regression analysis and Genetic algorithm to predict the surface roughness under dry and wet condition using high speed steel and carbide tools. Feed rate was the significant factor which effects the surface roughness. Through experiments, it has also been found that surface roughness decreases with the application of coolant by using a carbide tool. Klilckap, Cakir, Aksoy, and Inan (2005) experimentally investigated the tool wear and surface roughness of 5%SiCp Al MMC using uncoated and TiN coated cutting tools in turning process. Cutting parameters were considered as spindle speed, feed rate and depth of cut to predict the surface roughness and tool wear. They found that increase in cutting speed, increases tool wear and surface roughness. They also noticed that built up edge was absent while machining directly cast materials.
Chen, Wang, and Lee (2013) presented an optimal cutting parameter design of high speed cutting of the DIN 1.2344 tool steel. The orthogonal array with gray relation analysis was applied to optimize the end milling process with multiple performance characteristics. The selected cutting parameters were surface roughness on relief face, cutting speed, feed per tooth, axial cutting depth and radial cutting depth, while the considered performance characteristics are tool life and metal removal rate. The results of confirmation experiments revealed that gray relation analysis can effectively acquire an optimal combination of the cutting parameters.
In the present work, an attempt is made to investigate the effect of cutting variables on cutting force in end milling of LM6 aluminum alloy composites. The main aim is to develop the mathematical model for cutting force in terms of spindle speed, feed rate, axial depth of cut, radial depth of cut and various weight percentage of SiCp (wt% of SiCp) by the response surface method. The infeed, crossfeed and trust force are measured in tangential, radial and axial direction during end milling. The mathematical model aided us to study the direct and interaction effects of each parameter.
Very few authors (Arokiadass et al., 2012) have considered weight percentage of silicon carbide as one of the parameters to analyze the wear characteristics. Most of the authors studied the effect of cutting parameters such as speed, feed and depth of cut, but did not embark on the investigation by varying the weight percentage of silicon carbide on cutting force and surface roughness. Tool wear strongly correlates the surface roughness and cutting force while machining of composite. In the current work, experiments have been conducted with the purpose of specifically identifying the relationship between surface roughness and cutting force. Henceforth, the aims of this present work are
- •
To implement the five factor five level DoE (Design of Experiments) technique in the measurement of cutting force (axial, radial and thrust force) and surface roughness in machining of various weight percentage of SiCp.
- •
To generate the mathematical model for cutting force considering the process parameter as Spindle speed, Feed rate, Axial depth of cut, Radial depth of cut and varying weight percentage of SiCp.
- •
To study the direct and interaction effect of process parameters. Specifically, to describe the relationship between surface roughness and cutting force.
Machining parameters that are taken into account during machining in end milling process are spindle speed, feed rate, axial depth of cut, radial depth of cut and weight percentage of SiCp. The responses are cutting force and surface roughness (Ra). The three components of force in milling are infeed force (Fx), crossfeed force (Fy), thrust force (Fz) acts tangential, normal and parallel to the machine tool respectively.
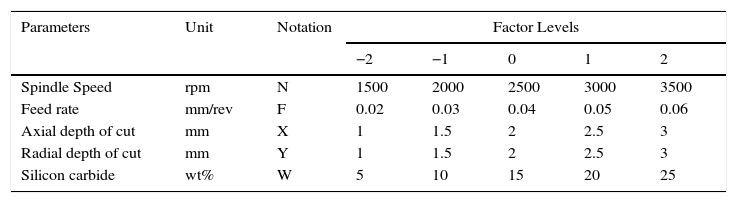
2.2Limits of machining parametersThe upper and lower limit of each process variables have to be identified from the relation.
where Xi is the required coded value of the variable X. X is any value of a variable from Xmin to Xmax. The upper limit of the process parameter is coded as 2, lower limit as −2. The intermediate values were calculated from Eq. (1) and machining parameters and their levels were presented in Table 1.2.3Preparation of MMCs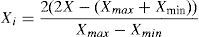
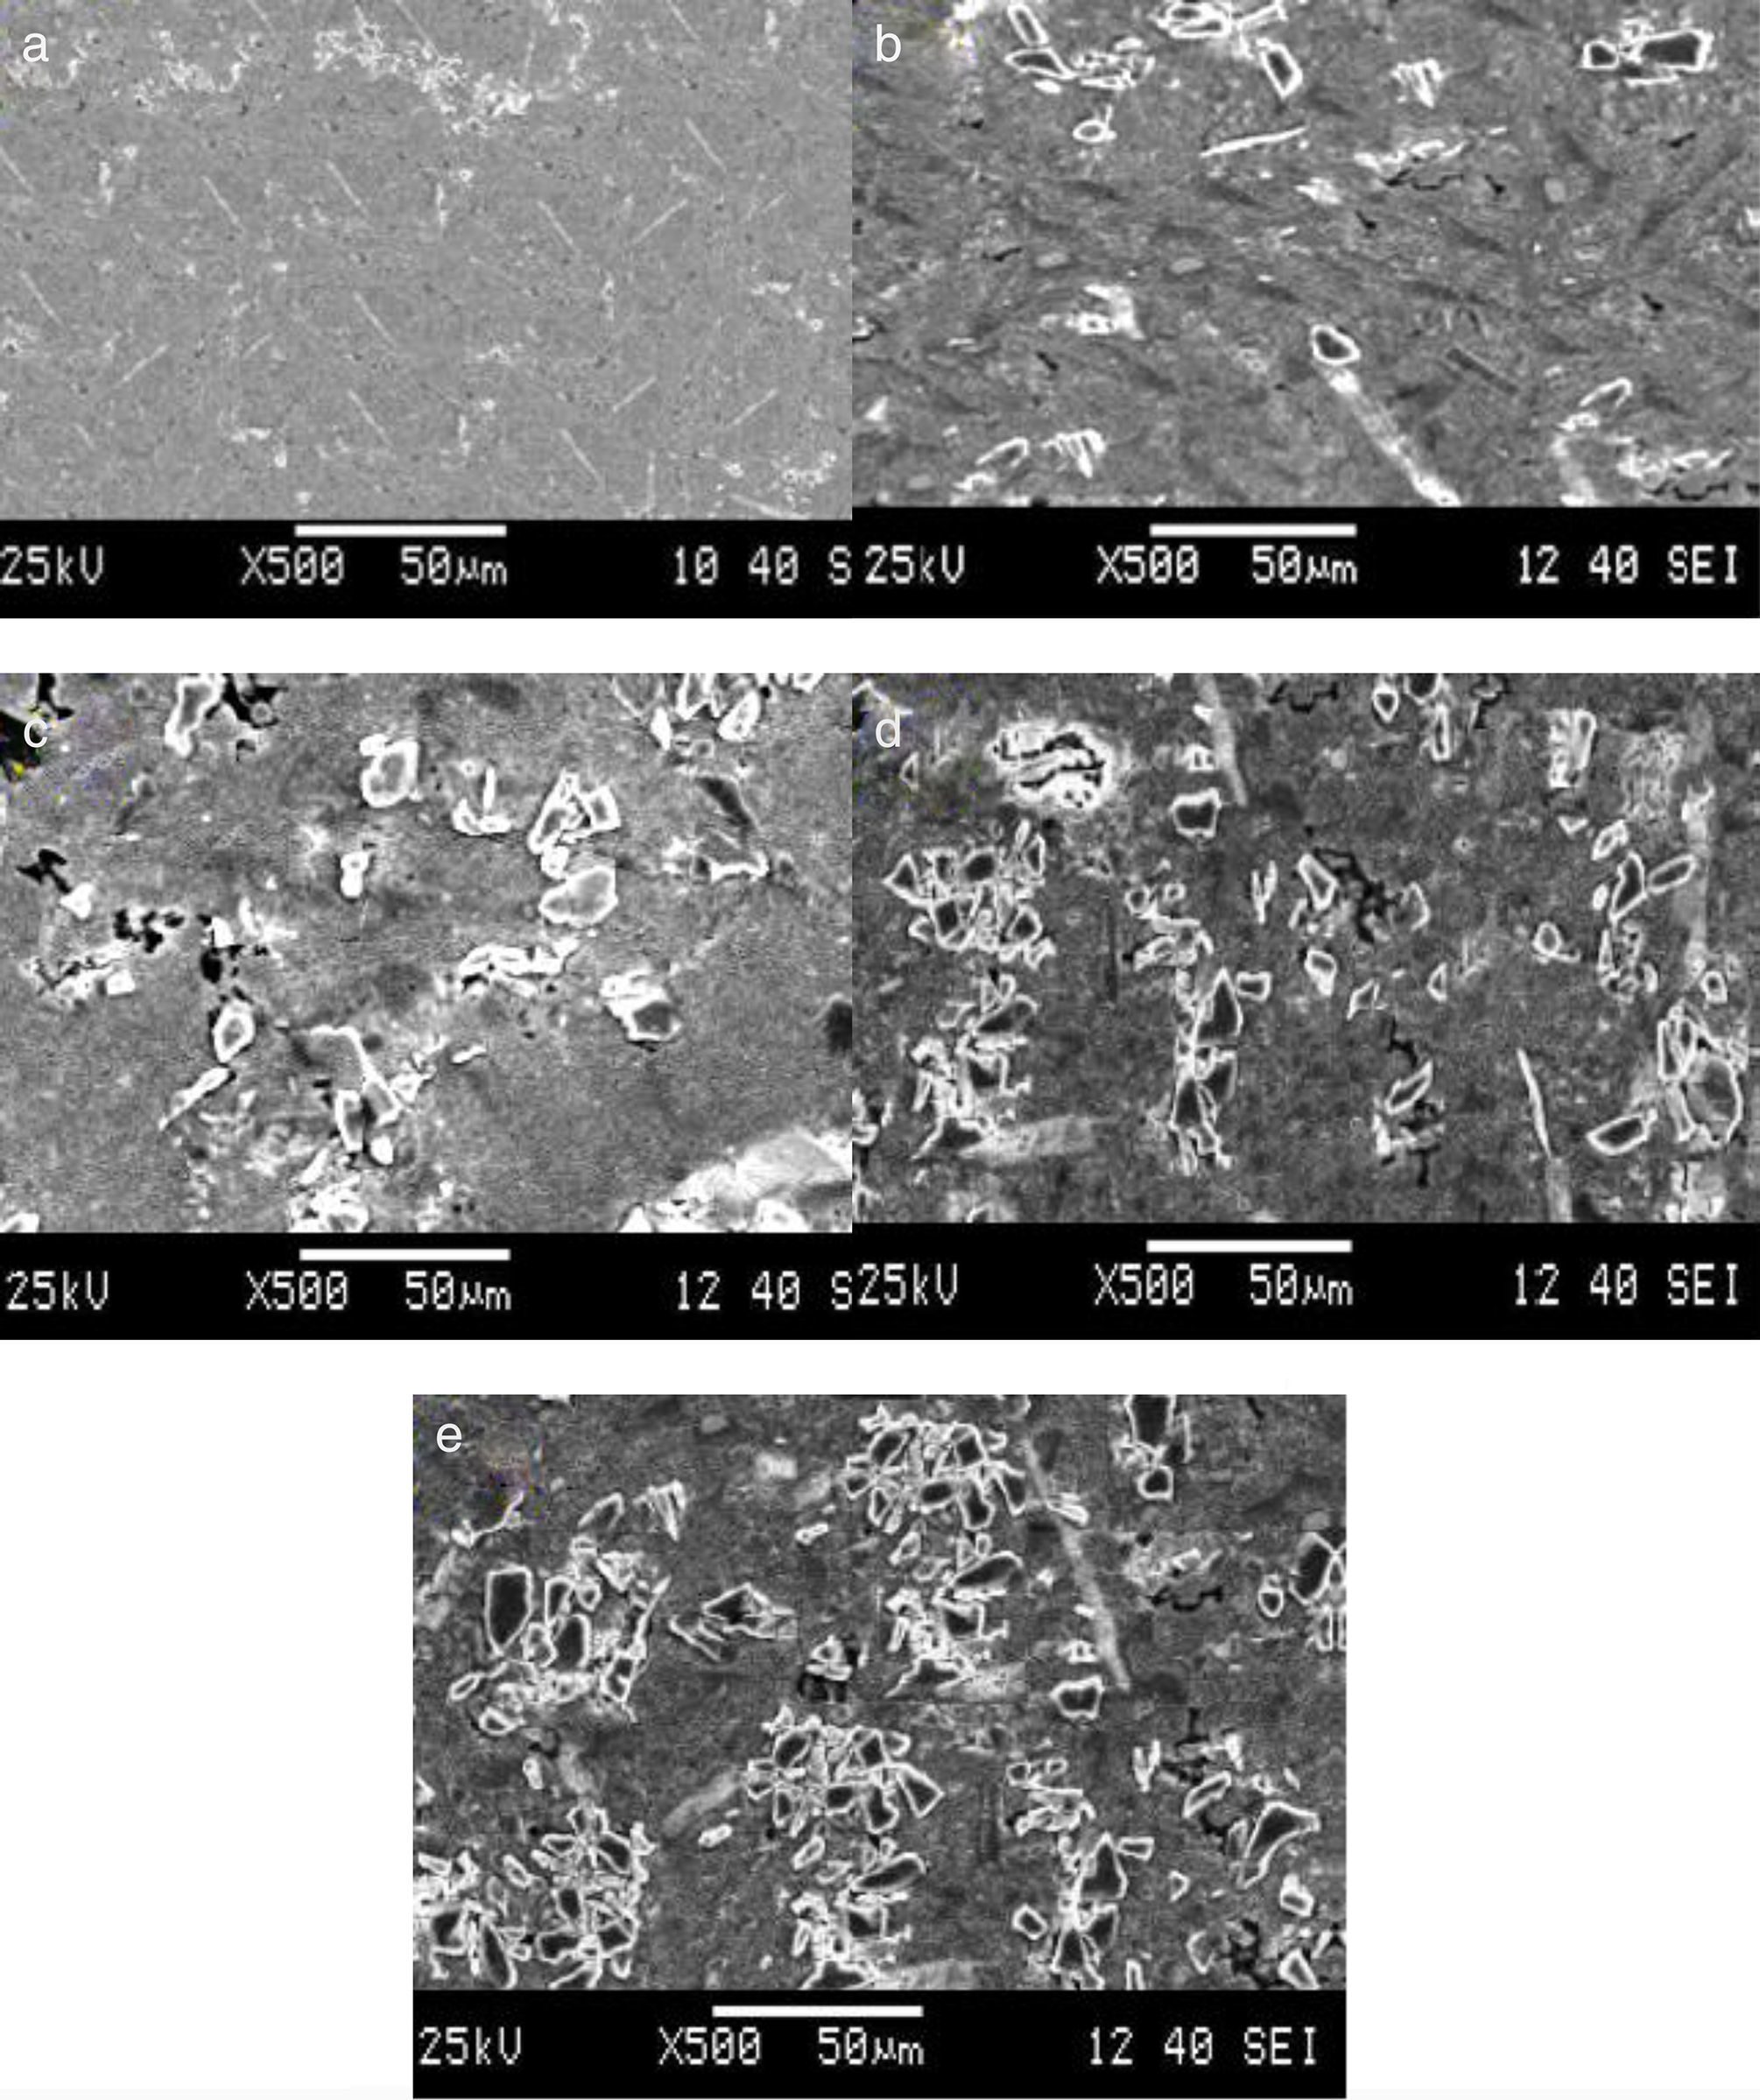
Aluminum metal matrix composite finds vast applications in the fields of construction, automotive and marine fields. Especially, LM6 is used for marine components, water-cooled manifolds and jackets, motor car and road transport fittings and pump parts. LM6 aluminum Alloy chemical composition is given in Table 2. Silicon carbide particulates of 30 micron size were used as reinforcement material. The particle size is also an important factor, wherein if the particle size increases, then the property will decrease because of inter particle spacing. However, the addition of SiC particles will increase the wear resistance, hardness and brittleness of the composite material (Dwivedi, Kumar, & Kumar, 2010; Ozben, Kilickap, & Cakir, 2008). The Stir casting technique was employed in order to prepare composite material. LM6 Alloy is preheated to 750°C and kept in a graphite crucible in an electric induction furnace. SiC particles were preheated to 350°C in furnace in order to release moisture and other toxic gases. SiC particles of amount weighing 5%, 10%, 15%, 20%, 25% were slowly added to the molten LM6 aluminum alloy inside crucible. Mechanical stirrer at 1250rpm is used to prepare the composite for a period of 15min. The molten material was poured inside the die at a temperature of 850°C. Cast composites were obtained after the die is allowed to cool in still air at room temperature. The SEM micrograph of 5%, 10%, 15%, 20% and 25% silicon carbide particles in the parent metal are shown in Figure 1. It indicates that the silicon carbide particles are evenly distributed in the matrix material.
 cast LM6/5wt% SiCp, (b) cast LM6/10wt% SiCp, (c) cast LM6/15wt% SiCp, (d) cast LM6/20wt% SiCp and (e) cast LM6/25wt% SiCp.")
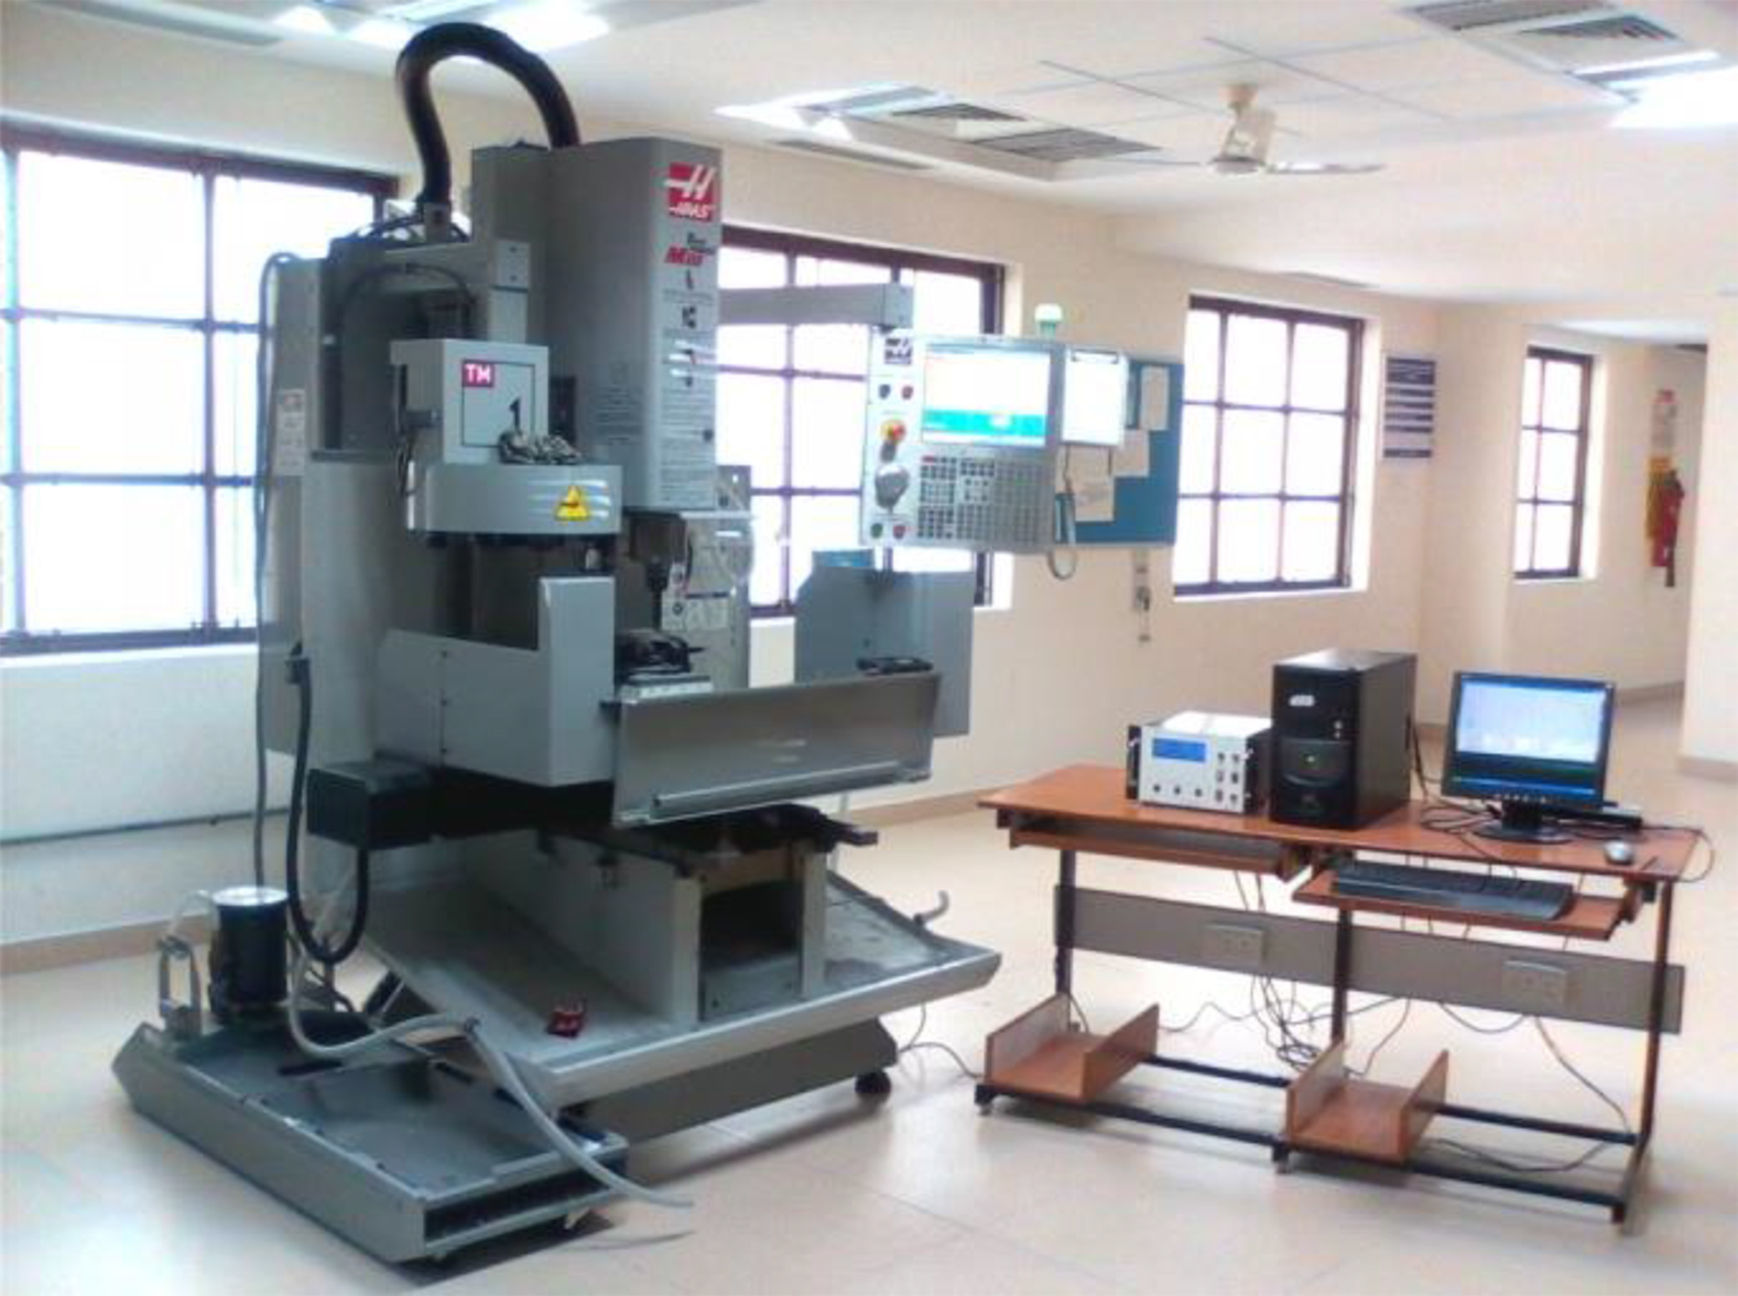
Experiments were performed on the HAAS CNC vertical machining center with two carbide insert end mill cutter with the diameter of 12mm and has the following specification: table length 1070mm, width 230mm, maximum spindle speed 4000rpm, feed rate 5.1m/min and the power of spindle motor 5.6kW. The dimension of the work specimen was 100mm×100mm×25mm.
The work piece was rigidly mounted on a specially designed vice which contains sensors to measure the cutting forces. The cutting force of the tool point in X, Y and Z directions are measured as infeed, crossfeed and thrust force respectively, using three axis milling tool dynamo-meter made by Syscon instruments which is pre-calibrated to 1kgf. Sensing element bonded with strain gauge is used to sense these forces. These forces from strain gauges are processed with instrumentation amplifiers then converted into digital data by 8 bit ADC. This digital output has been send out serially through RS232C to store the data in the data acquisition software (MSoffice one note). The acquired data are tabulated to predict the mathematical model.
Arithmetic average roughness Ra, root mean square deviation Rq, maximum height of the profile Ry, ten point height of irregularities Rz, maximum profile peak height Rp are some of the roughness parameters to characterize the surface roughness. Among these, Ra is the commonly used roughness parameter and best suited for monitoring the consistency of the machining process. Ra is the average absolute deviation of the workpiece from the center line and the same is used in this study. After machining of each workpiece, surface roughness value is measured using MITUTOYO SJ-201 surface roughness tester as a cutoff length of 2.5mm. For each specimen three sets of trails are measured and graphs are saved. Average surface roughness of each specimen have been noted in terms of Ra. Figure 2 shows the experimental setup used for conducting experiments.
2.5Generation of mathematical model
The regression procedure was used for the development of the mathematical model to predict the cutting force. The second order polynomial (Bhattacharyya, 1998) representing the response surface for “k” factors is given by Eq. (2)
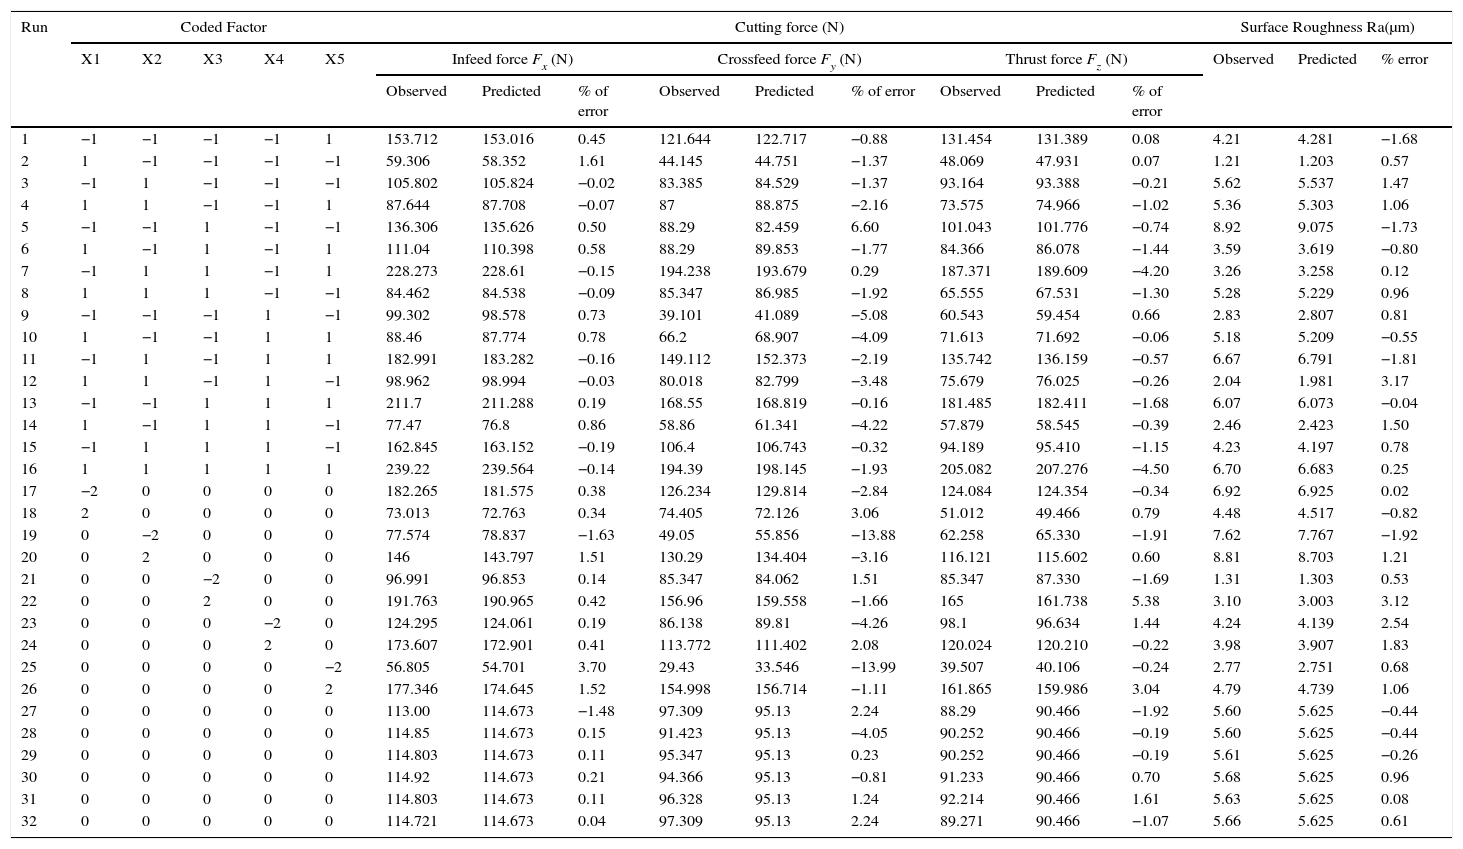
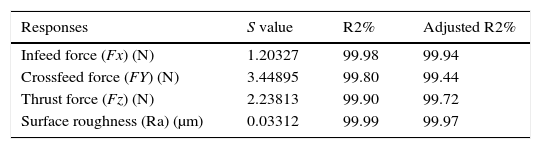
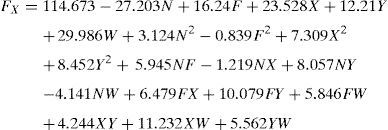
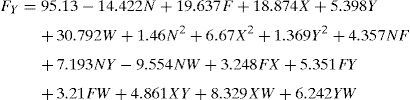
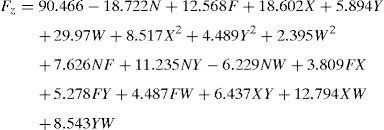
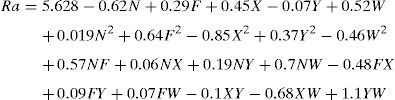
where a0=free term, ai=linear term coefficient, aii=quadratic term coefficient, aij=interaction term coefficient and ¿=error term. The response Y is expressed as a function of process parameters spindle speed (N), feed rate (Z), axial (X) and radial depth of cut (Y), wt% of SiCP (W) shown in Eq. (3)where Φ=response surface, eu=residual, u=no. of observations in the factorial experiment and iu represents the level of the ith factor in the uth observation. When the mathematical form of Φ is unknown, this function is approximated satisfactorily within the experimental region by polynomials in terms of process parameter variables. Box and Hunter proposed the central composite rotatable design for fitting a second order response surface based on the criterion of rotatability. The central composite rotatable design for five parameters with five levels consists of 32 experiments with the combination of sixteen factorial design points (lie at the vertices of the regular polyhedral), ten star points (to form sphere with α radius, consisting of equally spaced points from the center) and six replicated center points (also known as axial points which provide roughly equal precision of standard error). The design matrix with measured and predicted value of cutting force and surface roughness has been shown in Table 3. The Mini Tab statistical software (Version 15) package has been used to develop the response equations and evaluate the coefficient values. This software is also used to perform the data analyses (Montgomery, 2009). The statistical empirical equation has been developed using only the significant coefficients and is shown in Eqs. (4)–(7). R2 value for in feed, cross feed and thrust force in the x, y and z directions are approaches to unity as indicated in Table 4. Because of high R2 values, good correlations exist between the experimental and the predicted values.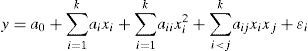

Design matrix with measured and predicted values of cutting force and surface roughness.
| Run | Coded Factor | Cutting force (N) | Surface Roughness Ra(μm) | ||||||||||||||
|---|---|---|---|---|---|---|---|---|---|---|---|---|---|---|---|---|---|
| X1 | X2 | X3 | X4 | X5 | Infeed force Fx (N) | Crossfeed force Fy (N) | Thrust force Fz (N) | Observed | Predicted | % error | |||||||
| Observed | Predicted | % of error | Observed | Predicted | % of error | Observed | Predicted | % of error | |||||||||
| 1 | −1 | −1 | −1 | −1 | 1 | 153.712 | 153.016 | 0.45 | 121.644 | 122.717 | −0.88 | 131.454 | 131.389 | 0.08 | 4.21 | 4.281 | −1.68 |
| 2 | 1 | −1 | −1 | −1 | −1 | 59.306 | 58.352 | 1.61 | 44.145 | 44.751 | −1.37 | 48.069 | 47.931 | 0.07 | 1.21 | 1.203 | 0.57 |
| 3 | −1 | 1 | −1 | −1 | −1 | 105.802 | 105.824 | −0.02 | 83.385 | 84.529 | −1.37 | 93.164 | 93.388 | −0.21 | 5.62 | 5.537 | 1.47 |
| 4 | 1 | 1 | −1 | −1 | 1 | 87.644 | 87.708 | −0.07 | 87 | 88.875 | −2.16 | 73.575 | 74.966 | −1.02 | 5.36 | 5.303 | 1.06 |
| 5 | −1 | −1 | 1 | −1 | −1 | 136.306 | 135.626 | 0.50 | 88.29 | 82.459 | 6.60 | 101.043 | 101.776 | −0.74 | 8.92 | 9.075 | −1.73 |
| 6 | 1 | −1 | 1 | −1 | 1 | 111.04 | 110.398 | 0.58 | 88.29 | 89.853 | −1.77 | 84.366 | 86.078 | −1.44 | 3.59 | 3.619 | −0.80 |
| 7 | −1 | 1 | 1 | −1 | 1 | 228.273 | 228.61 | −0.15 | 194.238 | 193.679 | 0.29 | 187.371 | 189.609 | −4.20 | 3.26 | 3.258 | 0.12 |
| 8 | 1 | 1 | 1 | −1 | −1 | 84.462 | 84.538 | −0.09 | 85.347 | 86.985 | −1.92 | 65.555 | 67.531 | −1.30 | 5.28 | 5.229 | 0.96 |
| 9 | −1 | −1 | −1 | 1 | −1 | 99.302 | 98.578 | 0.73 | 39.101 | 41.089 | −5.08 | 60.543 | 59.454 | 0.66 | 2.83 | 2.807 | 0.81 |
| 10 | 1 | −1 | −1 | 1 | 1 | 88.46 | 87.774 | 0.78 | 66.2 | 68.907 | −4.09 | 71.613 | 71.692 | −0.06 | 5.18 | 5.209 | −0.55 |
| 11 | −1 | 1 | −1 | 1 | 1 | 182.991 | 183.282 | −0.16 | 149.112 | 152.373 | −2.19 | 135.742 | 136.159 | −0.57 | 6.67 | 6.791 | −1.81 |
| 12 | 1 | 1 | −1 | 1 | −1 | 98.962 | 98.994 | −0.03 | 80.018 | 82.799 | −3.48 | 75.679 | 76.025 | −0.26 | 2.04 | 1.981 | 3.17 |
| 13 | −1 | −1 | 1 | 1 | 1 | 211.7 | 211.288 | 0.19 | 168.55 | 168.819 | −0.16 | 181.485 | 182.411 | −1.68 | 6.07 | 6.073 | −0.04 |
| 14 | 1 | −1 | 1 | 1 | −1 | 77.47 | 76.8 | 0.86 | 58.86 | 61.341 | −4.22 | 57.879 | 58.545 | −0.39 | 2.46 | 2.423 | 1.50 |
| 15 | −1 | 1 | 1 | 1 | −1 | 162.845 | 163.152 | −0.19 | 106.4 | 106.743 | −0.32 | 94.189 | 95.410 | −1.15 | 4.23 | 4.197 | 0.78 |
| 16 | 1 | 1 | 1 | 1 | 1 | 239.22 | 239.564 | −0.14 | 194.39 | 198.145 | −1.93 | 205.082 | 207.276 | −4.50 | 6.70 | 6.683 | 0.25 |
| 17 | −2 | 0 | 0 | 0 | 0 | 182.265 | 181.575 | 0.38 | 126.234 | 129.814 | −2.84 | 124.084 | 124.354 | −0.34 | 6.92 | 6.925 | 0.02 |
| 18 | 2 | 0 | 0 | 0 | 0 | 73.013 | 72.763 | 0.34 | 74.405 | 72.126 | 3.06 | 51.012 | 49.466 | 0.79 | 4.48 | 4.517 | −0.82 |
| 19 | 0 | −2 | 0 | 0 | 0 | 77.574 | 78.837 | −1.63 | 49.05 | 55.856 | −13.88 | 62.258 | 65.330 | −1.91 | 7.62 | 7.767 | −1.92 |
| 20 | 0 | 2 | 0 | 0 | 0 | 146 | 143.797 | 1.51 | 130.29 | 134.404 | −3.16 | 116.121 | 115.602 | 0.60 | 8.81 | 8.703 | 1.21 |
| 21 | 0 | 0 | −2 | 0 | 0 | 96.991 | 96.853 | 0.14 | 85.347 | 84.062 | 1.51 | 85.347 | 87.330 | −1.69 | 1.31 | 1.303 | 0.53 |
| 22 | 0 | 0 | 2 | 0 | 0 | 191.763 | 190.965 | 0.42 | 156.96 | 159.558 | −1.66 | 165 | 161.738 | 5.38 | 3.10 | 3.003 | 3.12 |
| 23 | 0 | 0 | 0 | −2 | 0 | 124.295 | 124.061 | 0.19 | 86.138 | 89.81 | −4.26 | 98.1 | 96.634 | 1.44 | 4.24 | 4.139 | 2.54 |
| 24 | 0 | 0 | 0 | 2 | 0 | 173.607 | 172.901 | 0.41 | 113.772 | 111.402 | 2.08 | 120.024 | 120.210 | −0.22 | 3.98 | 3.907 | 1.83 |
| 25 | 0 | 0 | 0 | 0 | −2 | 56.805 | 54.701 | 3.70 | 29.43 | 33.546 | −13.99 | 39.507 | 40.106 | −0.24 | 2.77 | 2.751 | 0.68 |
| 26 | 0 | 0 | 0 | 0 | 2 | 177.346 | 174.645 | 1.52 | 154.998 | 156.714 | −1.11 | 161.865 | 159.986 | 3.04 | 4.79 | 4.739 | 1.06 |
| 27 | 0 | 0 | 0 | 0 | 0 | 113.00 | 114.673 | −1.48 | 97.309 | 95.13 | 2.24 | 88.29 | 90.466 | −1.92 | 5.60 | 5.625 | −0.44 |
| 28 | 0 | 0 | 0 | 0 | 0 | 114.85 | 114.673 | 0.15 | 91.423 | 95.13 | −4.05 | 90.252 | 90.466 | −0.19 | 5.60 | 5.625 | −0.44 |
| 29 | 0 | 0 | 0 | 0 | 0 | 114.803 | 114.673 | 0.11 | 95.347 | 95.13 | 0.23 | 90.252 | 90.466 | −0.19 | 5.61 | 5.625 | −0.26 |
| 30 | 0 | 0 | 0 | 0 | 0 | 114.92 | 114.673 | 0.21 | 94.366 | 95.13 | −0.81 | 91.233 | 90.466 | 0.70 | 5.68 | 5.625 | 0.96 |
| 31 | 0 | 0 | 0 | 0 | 0 | 114.803 | 114.673 | 0.11 | 96.328 | 95.13 | 1.24 | 92.214 | 90.466 | 1.61 | 5.63 | 5.625 | 0.08 |
| 32 | 0 | 0 | 0 | 0 | 0 | 114.721 | 114.673 | 0.04 | 97.309 | 95.13 | 2.24 | 89.271 | 90.466 | −1.07 | 5.66 | 5.625 | 0.61 |
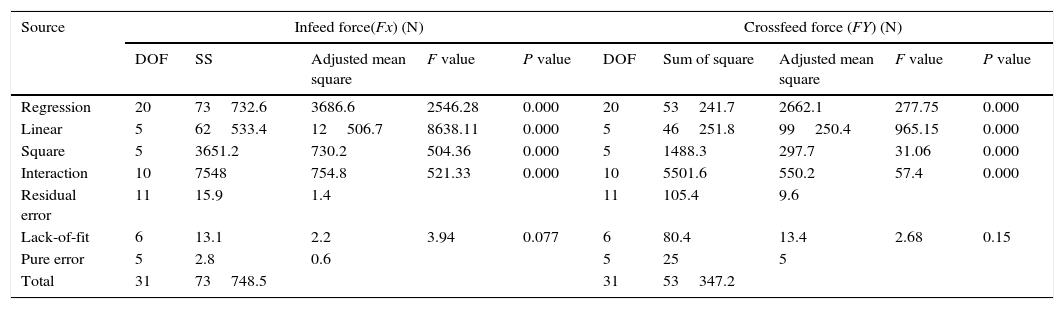
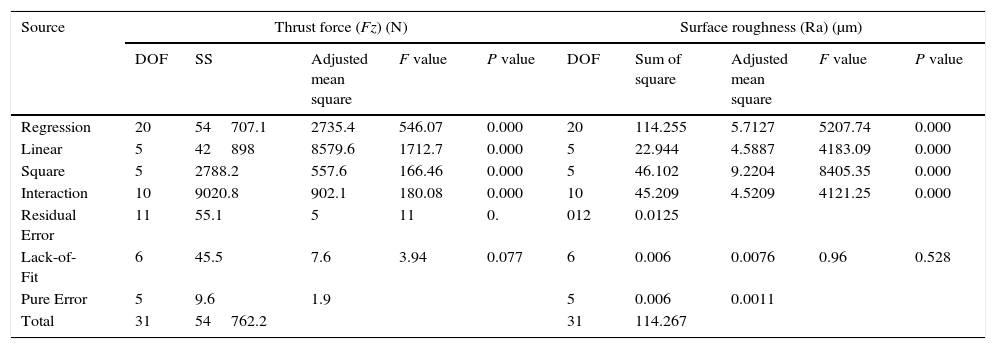
Adequacy of the experimental design has been verified by Analysis of variance (ANOVA). In ANOVA analysis lack of fit, F and R ratio have been used to check the adequacy of a model. Tables 5 and 6 indicates the ANOVA of regression parameters of the predicted surface response model for cutting forces (infeed, cross feed and thrust force) and surface roughness. The calculated values of F-ratio for lack of fit are compared with the standard values of F-ratio corresponding to their degrees of freedom. The standard percentage point of F distribution for 95% confidence level is 4.95. From Tables 5 and 6 the obtained F values were 3.94, 2.68, 3.94, 0.96 for infeed, crossfeed, trust force and surface roughness respectively, smaller than the standard value, indicating that the model is adequate. It is also found that from the P values, cutting force and surface roughness models linear, square and interaction effects are significant.
Analysis of variance for cutting force.
| Source | Infeed force(Fx) (N) | Crossfeed force (FY) (N) | ||||||||
|---|---|---|---|---|---|---|---|---|---|---|
| DOF | SS | Adjusted mean square | F value | P value | DOF | Sum of square | Adjusted mean square | F value | P value | |
| Regression | 20 | 73732.6 | 3686.6 | 2546.28 | 0.000 | 20 | 53241.7 | 2662.1 | 277.75 | 0.000 |
| Linear | 5 | 62533.4 | 12506.7 | 8638.11 | 0.000 | 5 | 46251.8 | 99250.4 | 965.15 | 0.000 |
| Square | 5 | 3651.2 | 730.2 | 504.36 | 0.000 | 5 | 1488.3 | 297.7 | 31.06 | 0.000 |
| Interaction | 10 | 7548 | 754.8 | 521.33 | 0.000 | 10 | 5501.6 | 550.2 | 57.4 | 0.000 |
| Residual error | 11 | 15.9 | 1.4 | 11 | 105.4 | 9.6 | ||||
| Lack-of-fit | 6 | 13.1 | 2.2 | 3.94 | 0.077 | 6 | 80.4 | 13.4 | 2.68 | 0.15 |
| Pure error | 5 | 2.8 | 0.6 | 5 | 25 | 5 | ||||
| Total | 31 | 73748.5 | 31 | 53347.2 | ||||||
Analysis of variance for cutting force and surface roughness.
| Source | Thrust force (Fz) (N) | Surface roughness (Ra) (μm) | ||||||||
|---|---|---|---|---|---|---|---|---|---|---|
| DOF | SS | Adjusted mean square | F value | P value | DOF | Sum of square | Adjusted mean square | F value | P value | |
| Regression | 20 | 54707.1 | 2735.4 | 546.07 | 0.000 | 20 | 114.255 | 5.7127 | 5207.74 | 0.000 |
| Linear | 5 | 42898 | 8579.6 | 1712.7 | 0.000 | 5 | 22.944 | 4.5887 | 4183.09 | 0.000 |
| Square | 5 | 2788.2 | 557.6 | 166.46 | 0.000 | 5 | 46.102 | 9.2204 | 8405.35 | 0.000 |
| Interaction | 10 | 9020.8 | 902.1 | 180.08 | 0.000 | 10 | 45.209 | 4.5209 | 4121.25 | 0.000 |
| Residual Error | 11 | 55.1 | 5 | 11 | 0. | 012 | 0.0125 | |||
| Lack-of-Fit | 6 | 45.5 | 7.6 | 3.94 | 0.077 | 6 | 0.006 | 0.0076 | 0.96 | 0.528 |
| Pure Error | 5 | 9.6 | 1.9 | 5 | 0.006 | 0.0011 | ||||
| Total | 31 | 54762.2 | 31 | 114.267 | ||||||
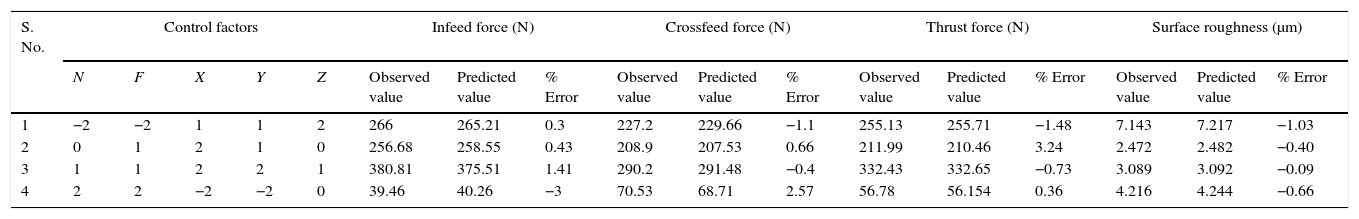
The validity of the model is checked for the levels of parameters which has not been included in the experimental design. The results of conformity are shown in Table 7. The test result shows that developed model computes the cutting force and surface roughness with reasonable accuracy. The difference in percentage between experimental and predicted value relative to the predicted value is estimated as the percentage error in the regression model. The error between the experimental and predicted value is less than 5%, which confirms the validity of the model.
Result of conformity.
| S. No. | Control factors | Infeed force (N) | Crossfeed force (N) | Thrust force (N) | Surface roughness (μm) | ||||||||||||
|---|---|---|---|---|---|---|---|---|---|---|---|---|---|---|---|---|---|
| N | F | X | Y | Z | Observed value | Predicted value | % Error | Observed value | Predicted value | % Error | Observed value | Predicted value | % Error | Observed value | Predicted value | % Error | |
| 1 | −2 | −2 | 1 | 1 | 2 | 266 | 265.21 | 0.3 | 227.2 | 229.66 | −1.1 | 255.13 | 255.71 | −1.48 | 7.143 | 7.217 | −1.03 |
| 2 | 0 | 1 | 2 | 1 | 0 | 256.68 | 258.55 | 0.43 | 208.9 | 207.53 | 0.66 | 211.99 | 210.46 | 3.24 | 2.472 | 2.482 | −0.40 |
| 3 | 1 | 1 | 2 | 2 | 1 | 380.81 | 375.51 | 1.41 | 290.2 | 291.48 | −0.4 | 332.43 | 332.65 | −0.73 | 3.089 | 3.092 | −0.09 |
| 4 | 2 | 2 | −2 | −2 | 0 | 39.46 | 40.26 | −3 | 70.53 | 68.71 | 2.57 | 56.78 | 56.154 | 0.36 | 4.216 | 4.244 | −0.66 |
A mathematical model, as indicated in Eqs. (4)–(7), has been developed to predict the infeed force, cross feed force, thrust force and surface roughness in relation with spindle speed, feed rate, axial depth of cut, radial depth of cut and wt% SiCp. The influence of the process parameters on the cutting force have been studied using the developed model. Direct and interaction effects of the process parameters on different cutting forces were plotted in Figures 3–7.
3.1Direct effects of machining parameters on cutting forces and surface roughness3.1.1Effect of spindle speed


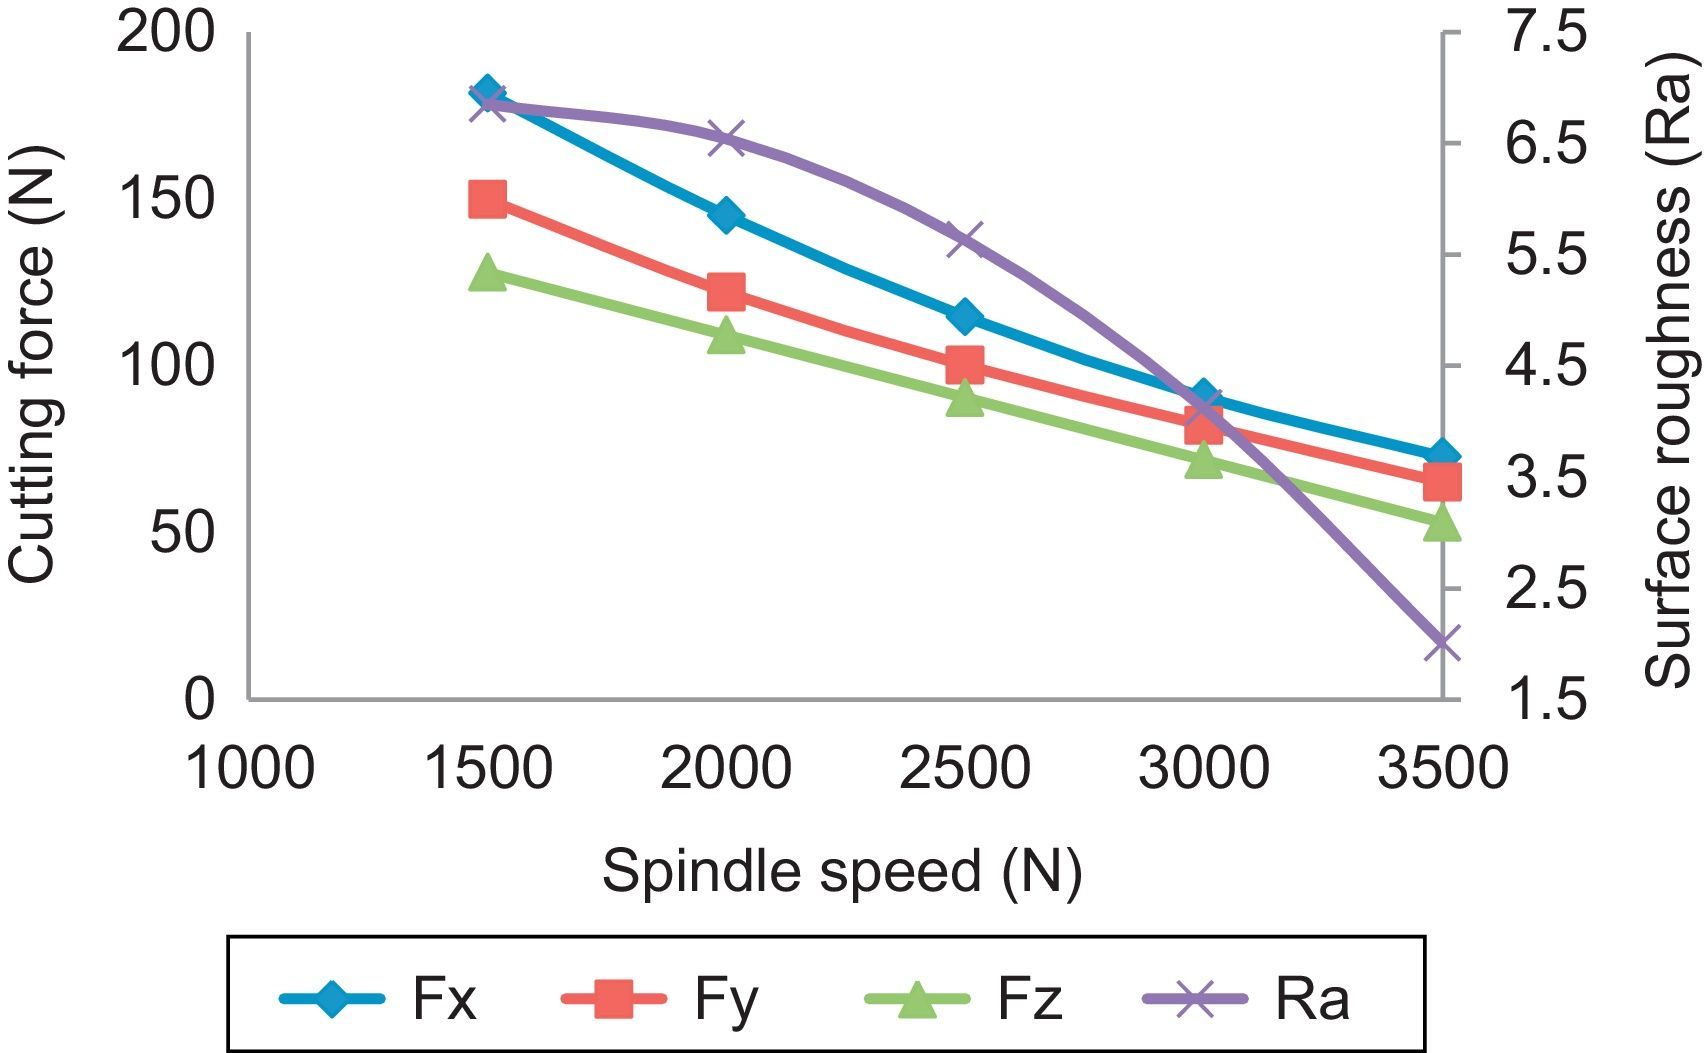
The effect of spindle speed on infeed, cross feed force, thrust force and surface roughness is shown in Figure 3. It is clear that an increase in spindle speed resulted in decreasing trend in cutting forces in all the three directions. When the spindle speed is increased, the chip-tool contact length got decreased, the material got heated up, and softened the matrix. Hence the cutting force in end milling process is reduced. Further, it is inferred that high cutting force is produced at extremely slow speeds (Stephenson & Agapiou, 2006). With the increase in spindle speed, the surface roughness is on the decline. At lower spindle speed, the unstable larger built-up-edge is formed and the chip fracture is produced which leads to the rough surface. Whereas at higher cutting speed, the built-up-edge formation is disappearing and the chip fracture is reduced, and hence surface roughness is decreased. The same inference was derived by Seeman et al. (2010). The minimum cutting force and surface roughness is obtained at 3500rpm of spindle speed.
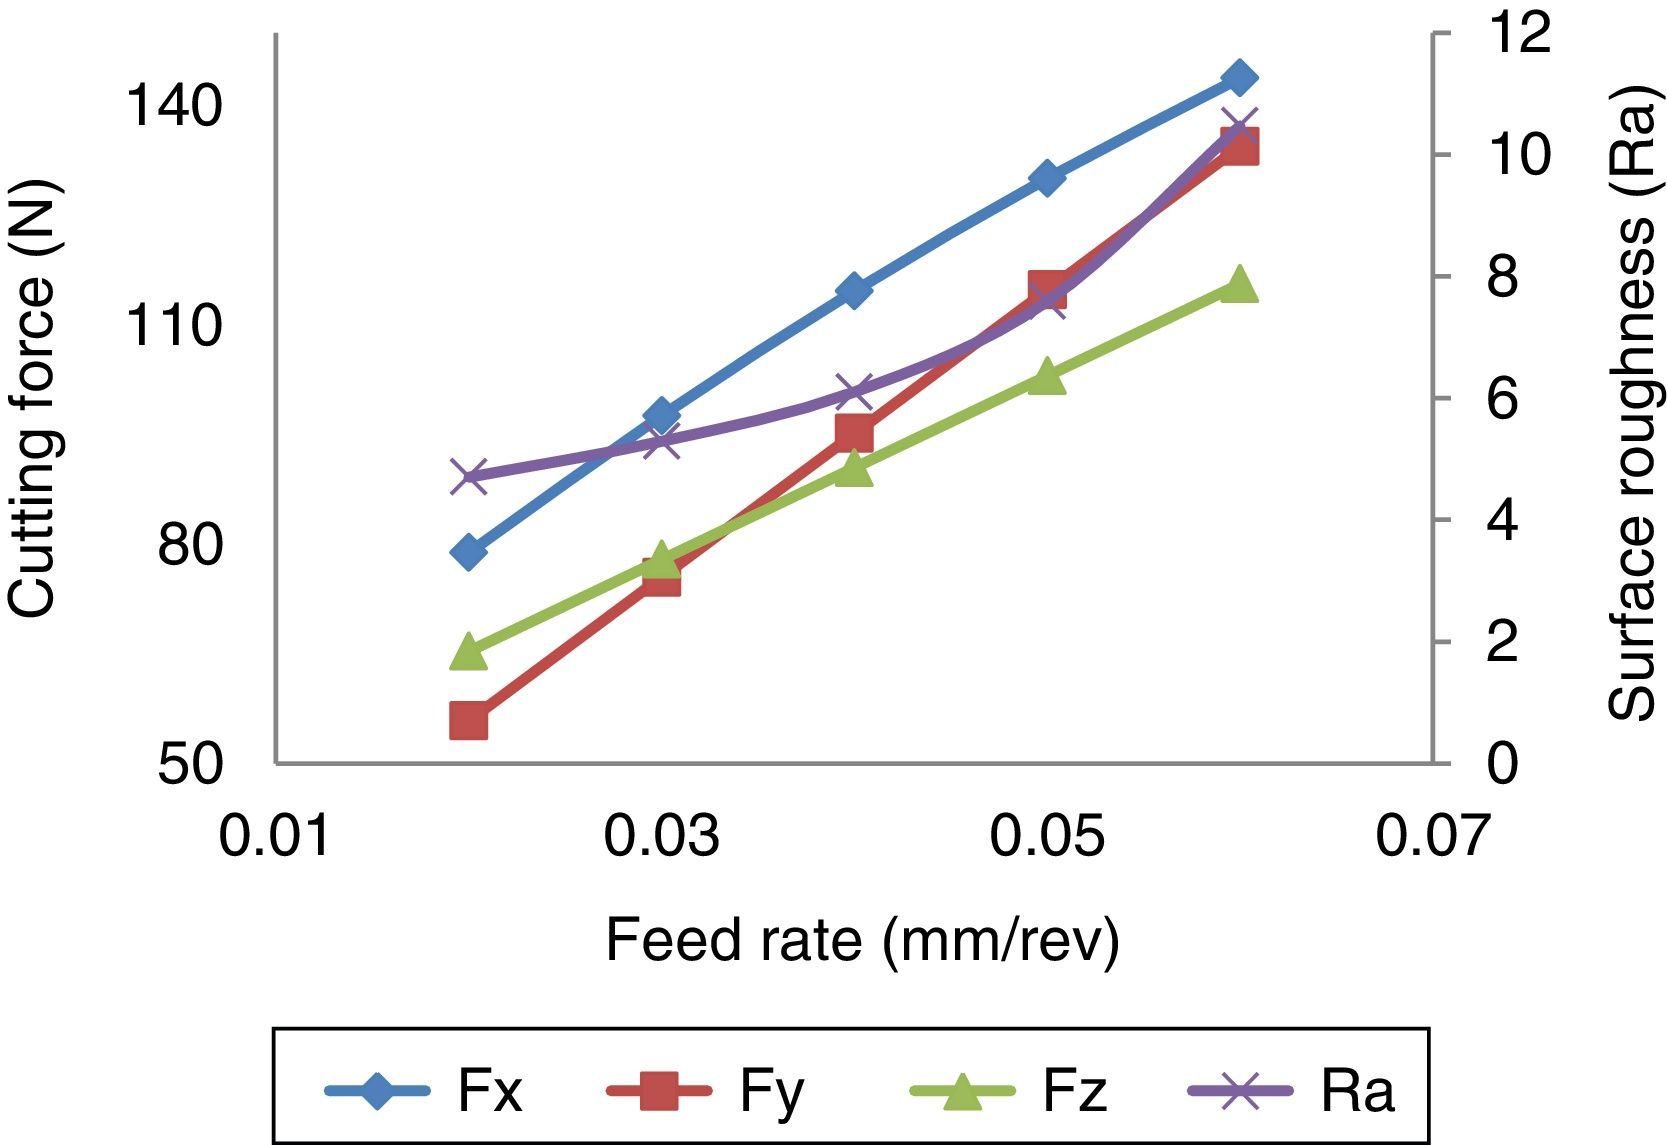
3.1.2Effect of feed rateFrom Figure 4, it is evident that the feed rate has an important effect on the cutting force and surface roughness. The feed rate is directly propositional to the cutting force in tangential, radial and axial direction. The reason is that the area of contact and load carried by the cutter increases because of the increase in the feed rate. Increasing the feed rate increases the roughness of the machined surface. At a higher feed rate, the material removal rate is also high which results in the creation of friction between work and tool, leading to a pitting mark. A similar observation was made by Dwivedi et al. (2010).
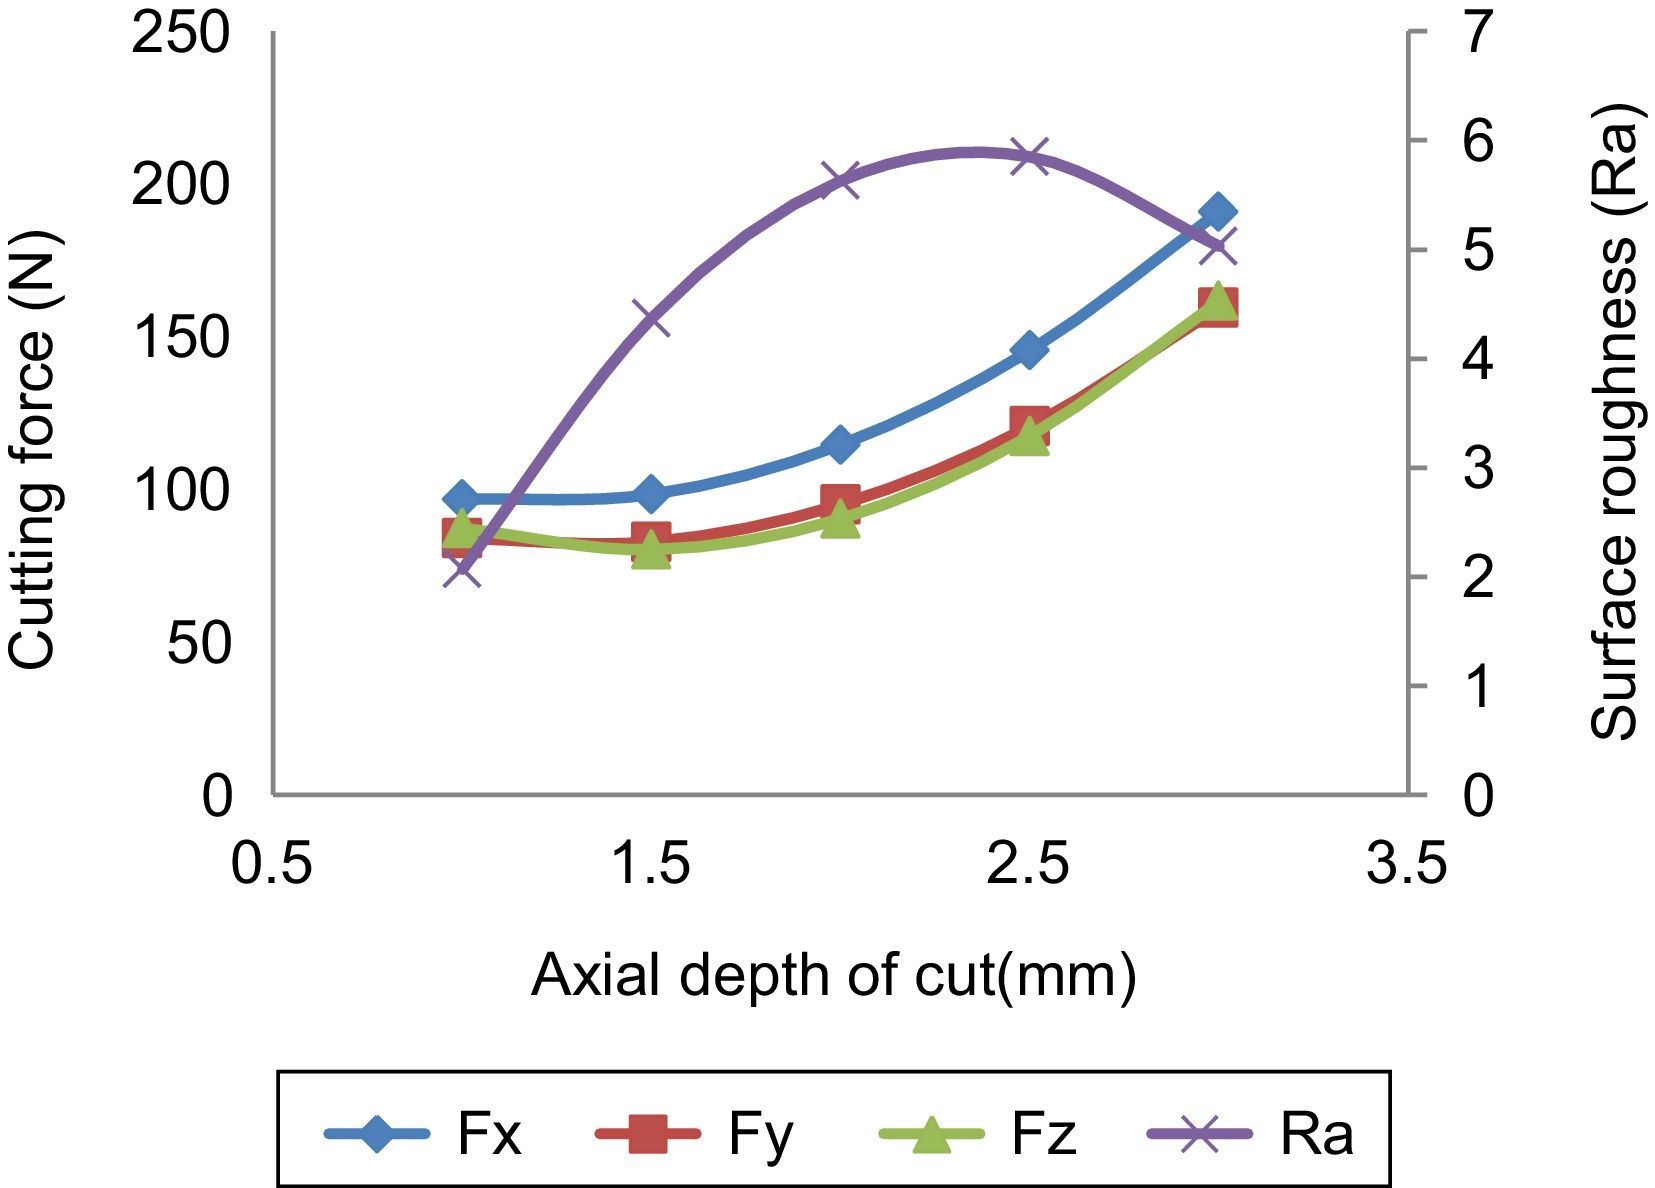
3.1.3Effect of axial depth of cutThe increase in the axial depth of cut resulted in an increased infeed, crossfeed, thrust force and surface roughness, as shown in Figure 5. When the axial depth of cut increases, more length of the flute gets engaged which results in more cutting force in the rotating direction. It is inferred from the figure that, when the axial depth of cut ranges from 1mm to 2mm the surface roughness increases because of the higher chip thickness of the work material.
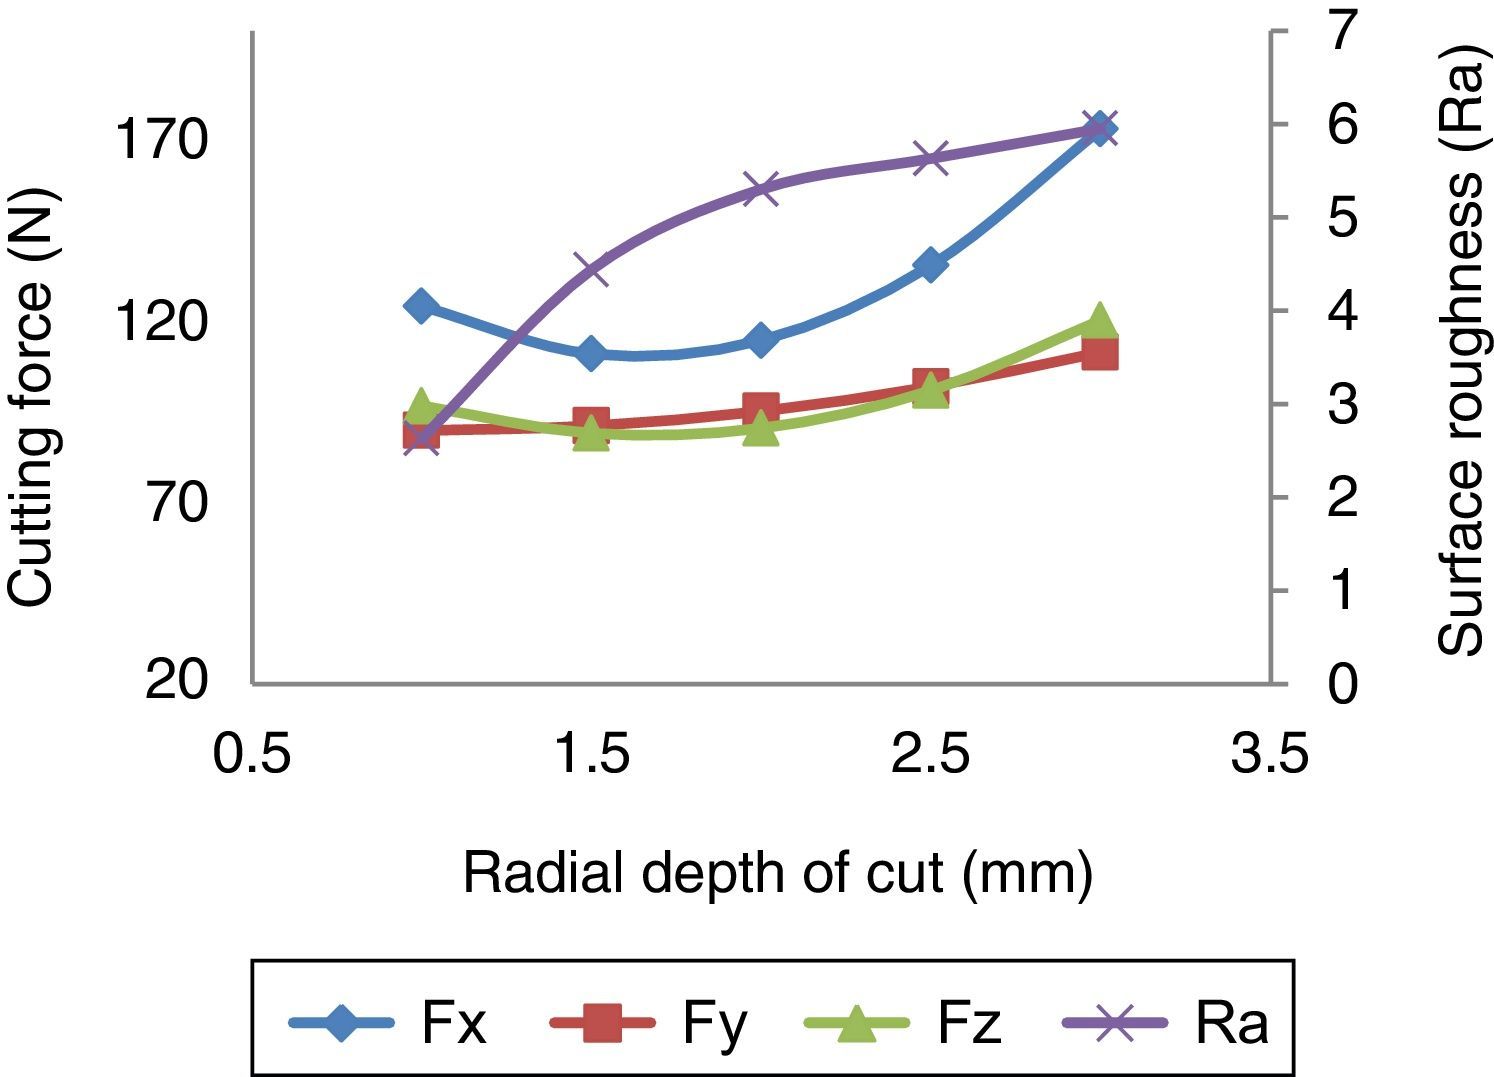
3.1.4Effect of radial depth of cutFrom Figure 6, it is evident that the radial depth of cut has the significant effect on all the three forces and surface roughness. An increase in the radial depth of cut during the milling operation resulted in increased cutting force. The reason being that, higher radial depth of cut increases the volume of metal removal and increase the contact area of work piece, which resulted in increased cutting force in rotational direction. The surface roughness increases with the increase in the radial depth of cut due to and increase in the vibration and wear.
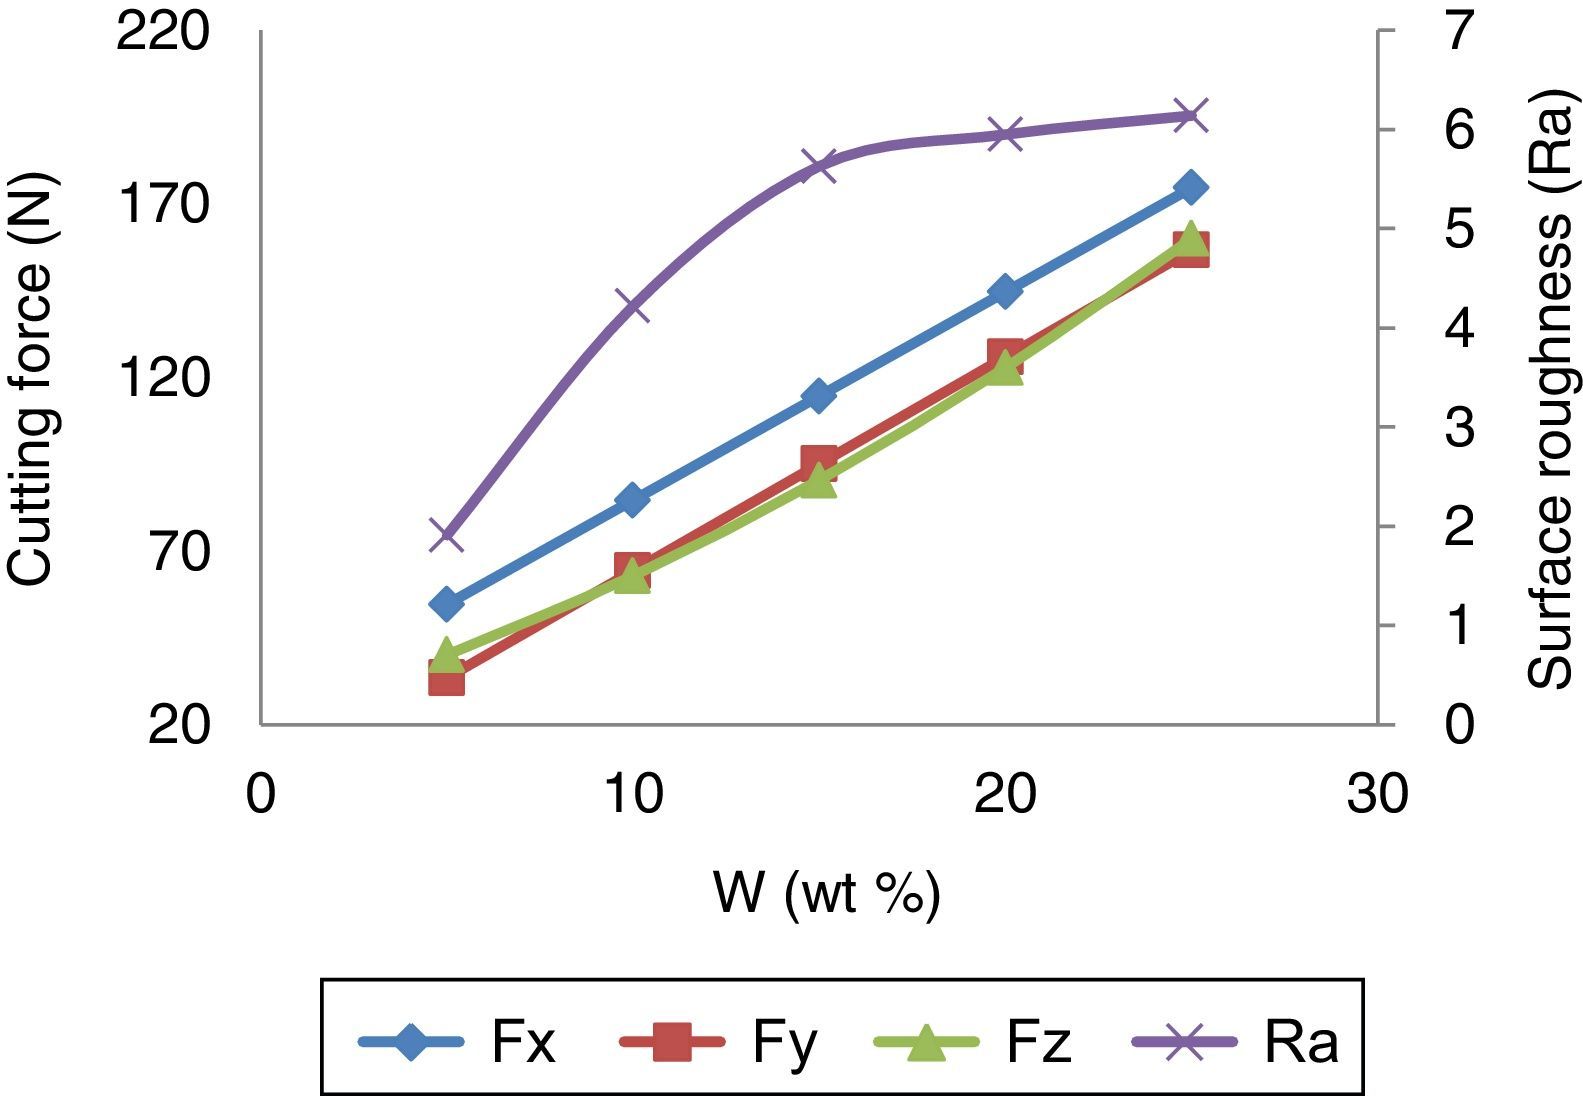
3.1.5Effect of wt% of silicon carbideThe effect of wt% of SiCp on cutting force is shown in Figure 7. While the wt% of silicon carbide particle increases, the cutting forces and surface roughness also increases. This is due to the addition of harder and stiffer reinforcing material into the soft metallic material which becomes more difficult to machine. The cutting force and surface roughness is minimum at the lowest wt% of SiCp combination. Arokiadass et al. (2012) derived the same inference in his research work.
3.2Interactive effects of machining parameters on cutting forceThe change in the effect of one variable, when the second variable is changed from one level to another, is known as Interaction effect. The interaction effects of the process variables are useful in understanding the process behavior. The two-way interactive effects of the process variables which have strong interaction with cutting force are shown in Figures 8–14
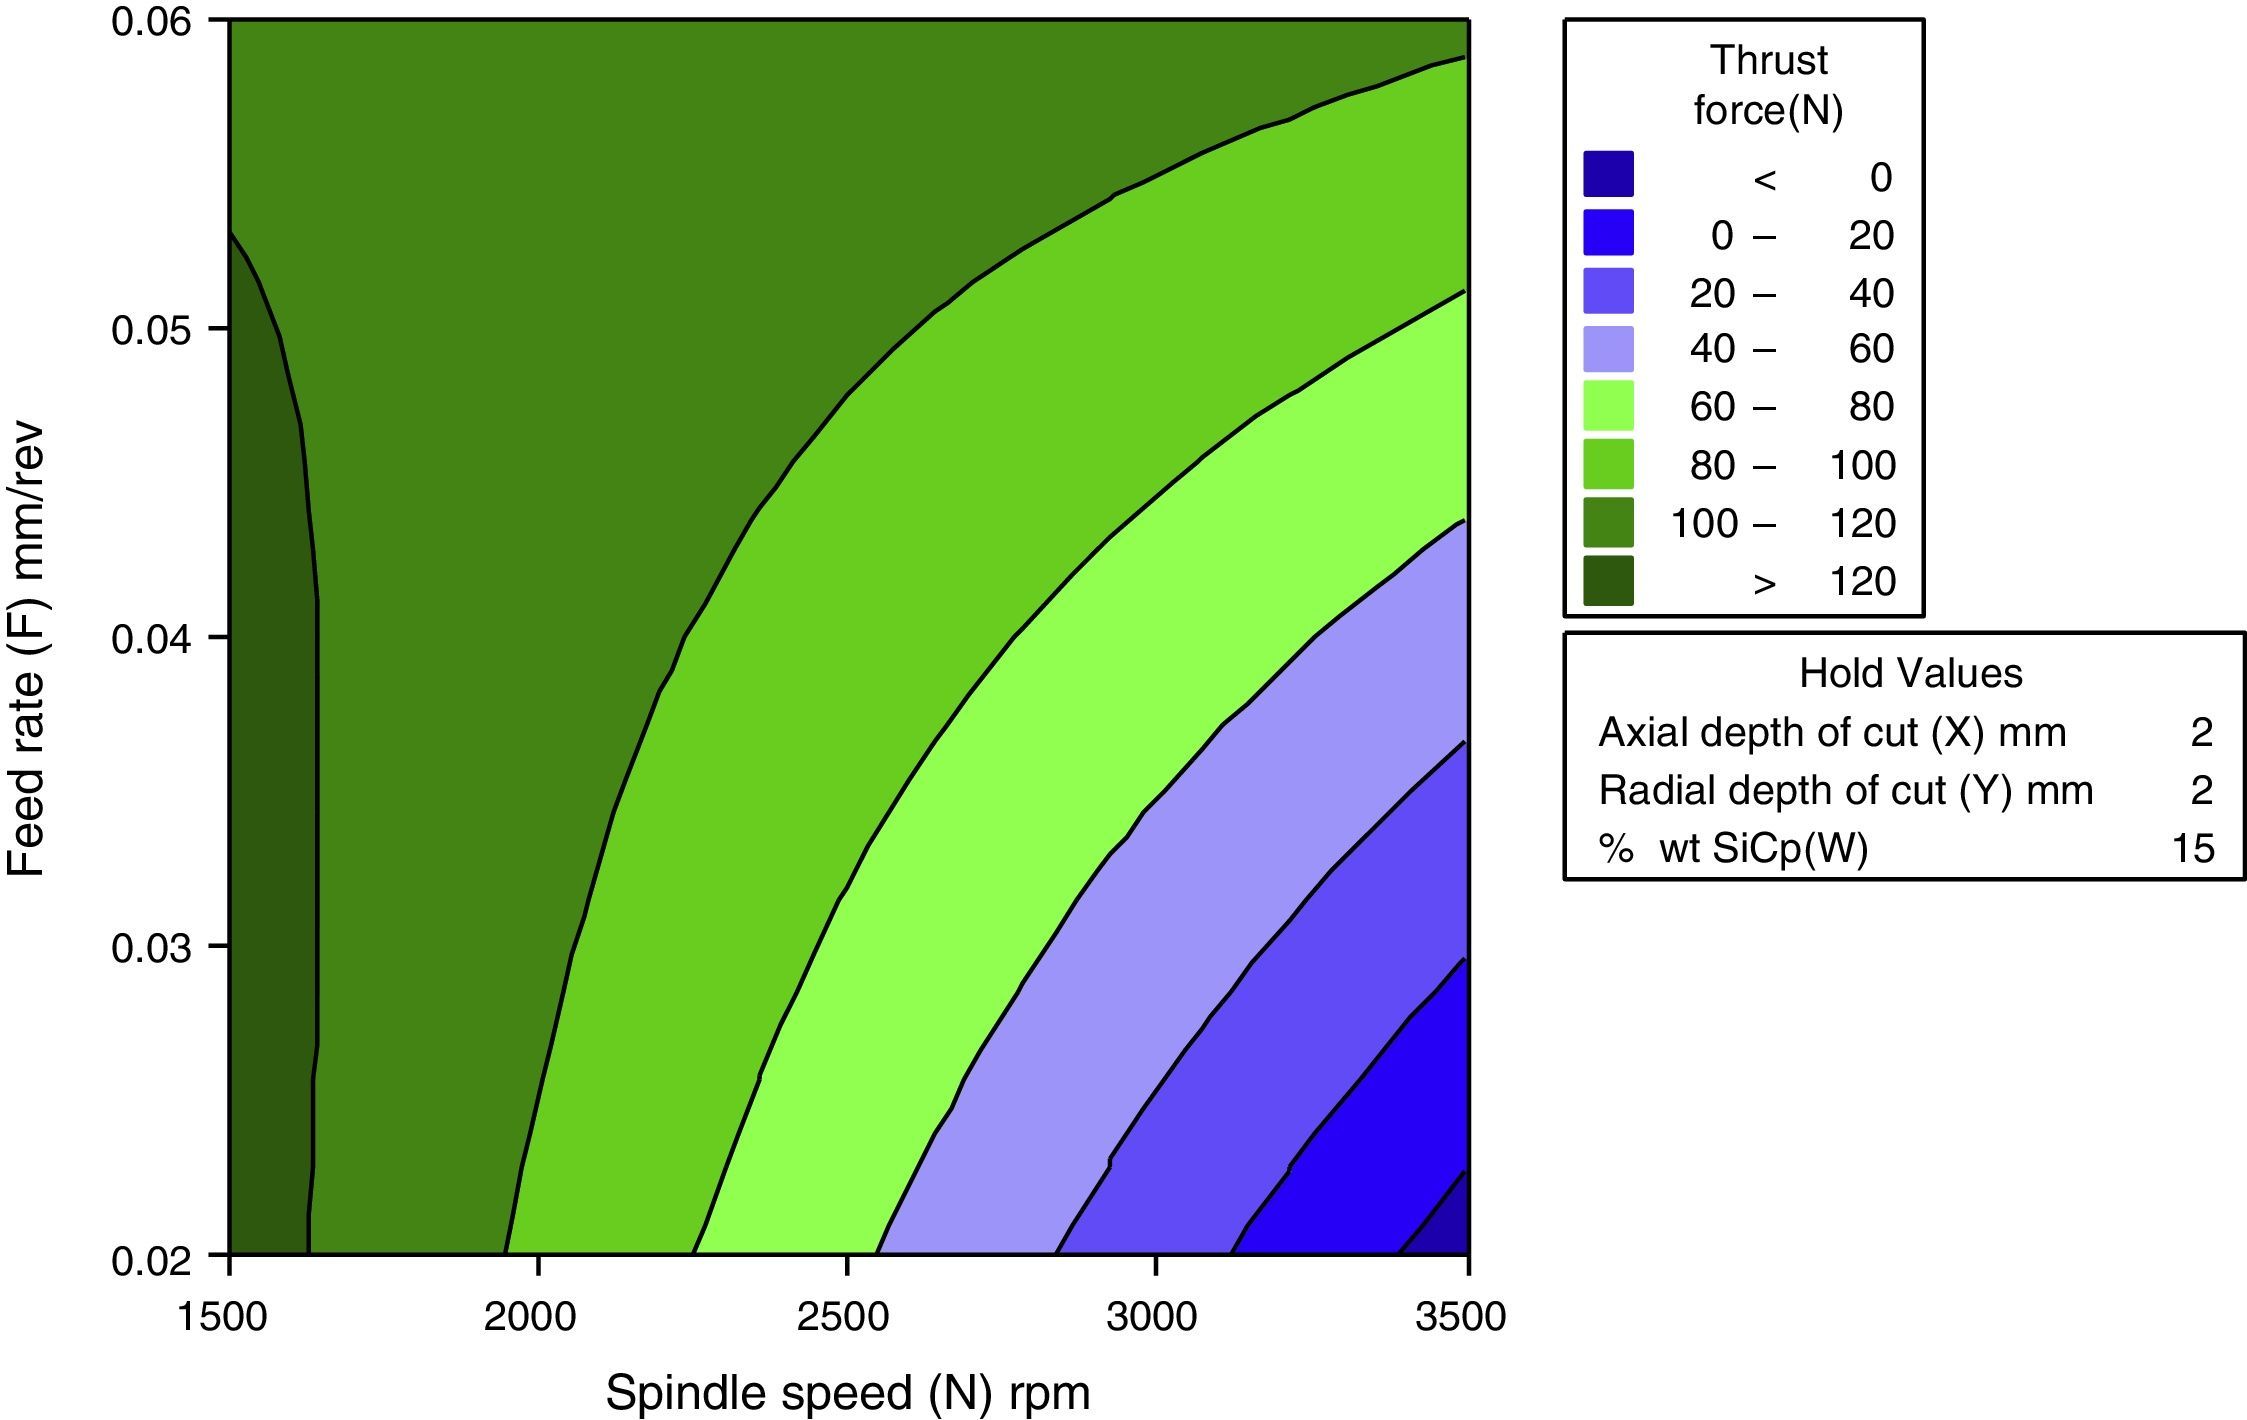
3.2.1Interactive effects of spindle speed and feed rate for thrust force


Figure 8 shows the interactive effect of spindle speed and feed rate on thrust force. It has been inferred from the direct effect analysis that the spindle speed has a negative effect and feed rate has a positive effect on infeed force, crossfeed force and thrust force. It is observed that the thrust force decreases with increase in cutting speed from 1500rpm to 3500rpm. The trend gets similar for all the levels of feed rate from 0.02mm/rev to 0.06mm/rev.
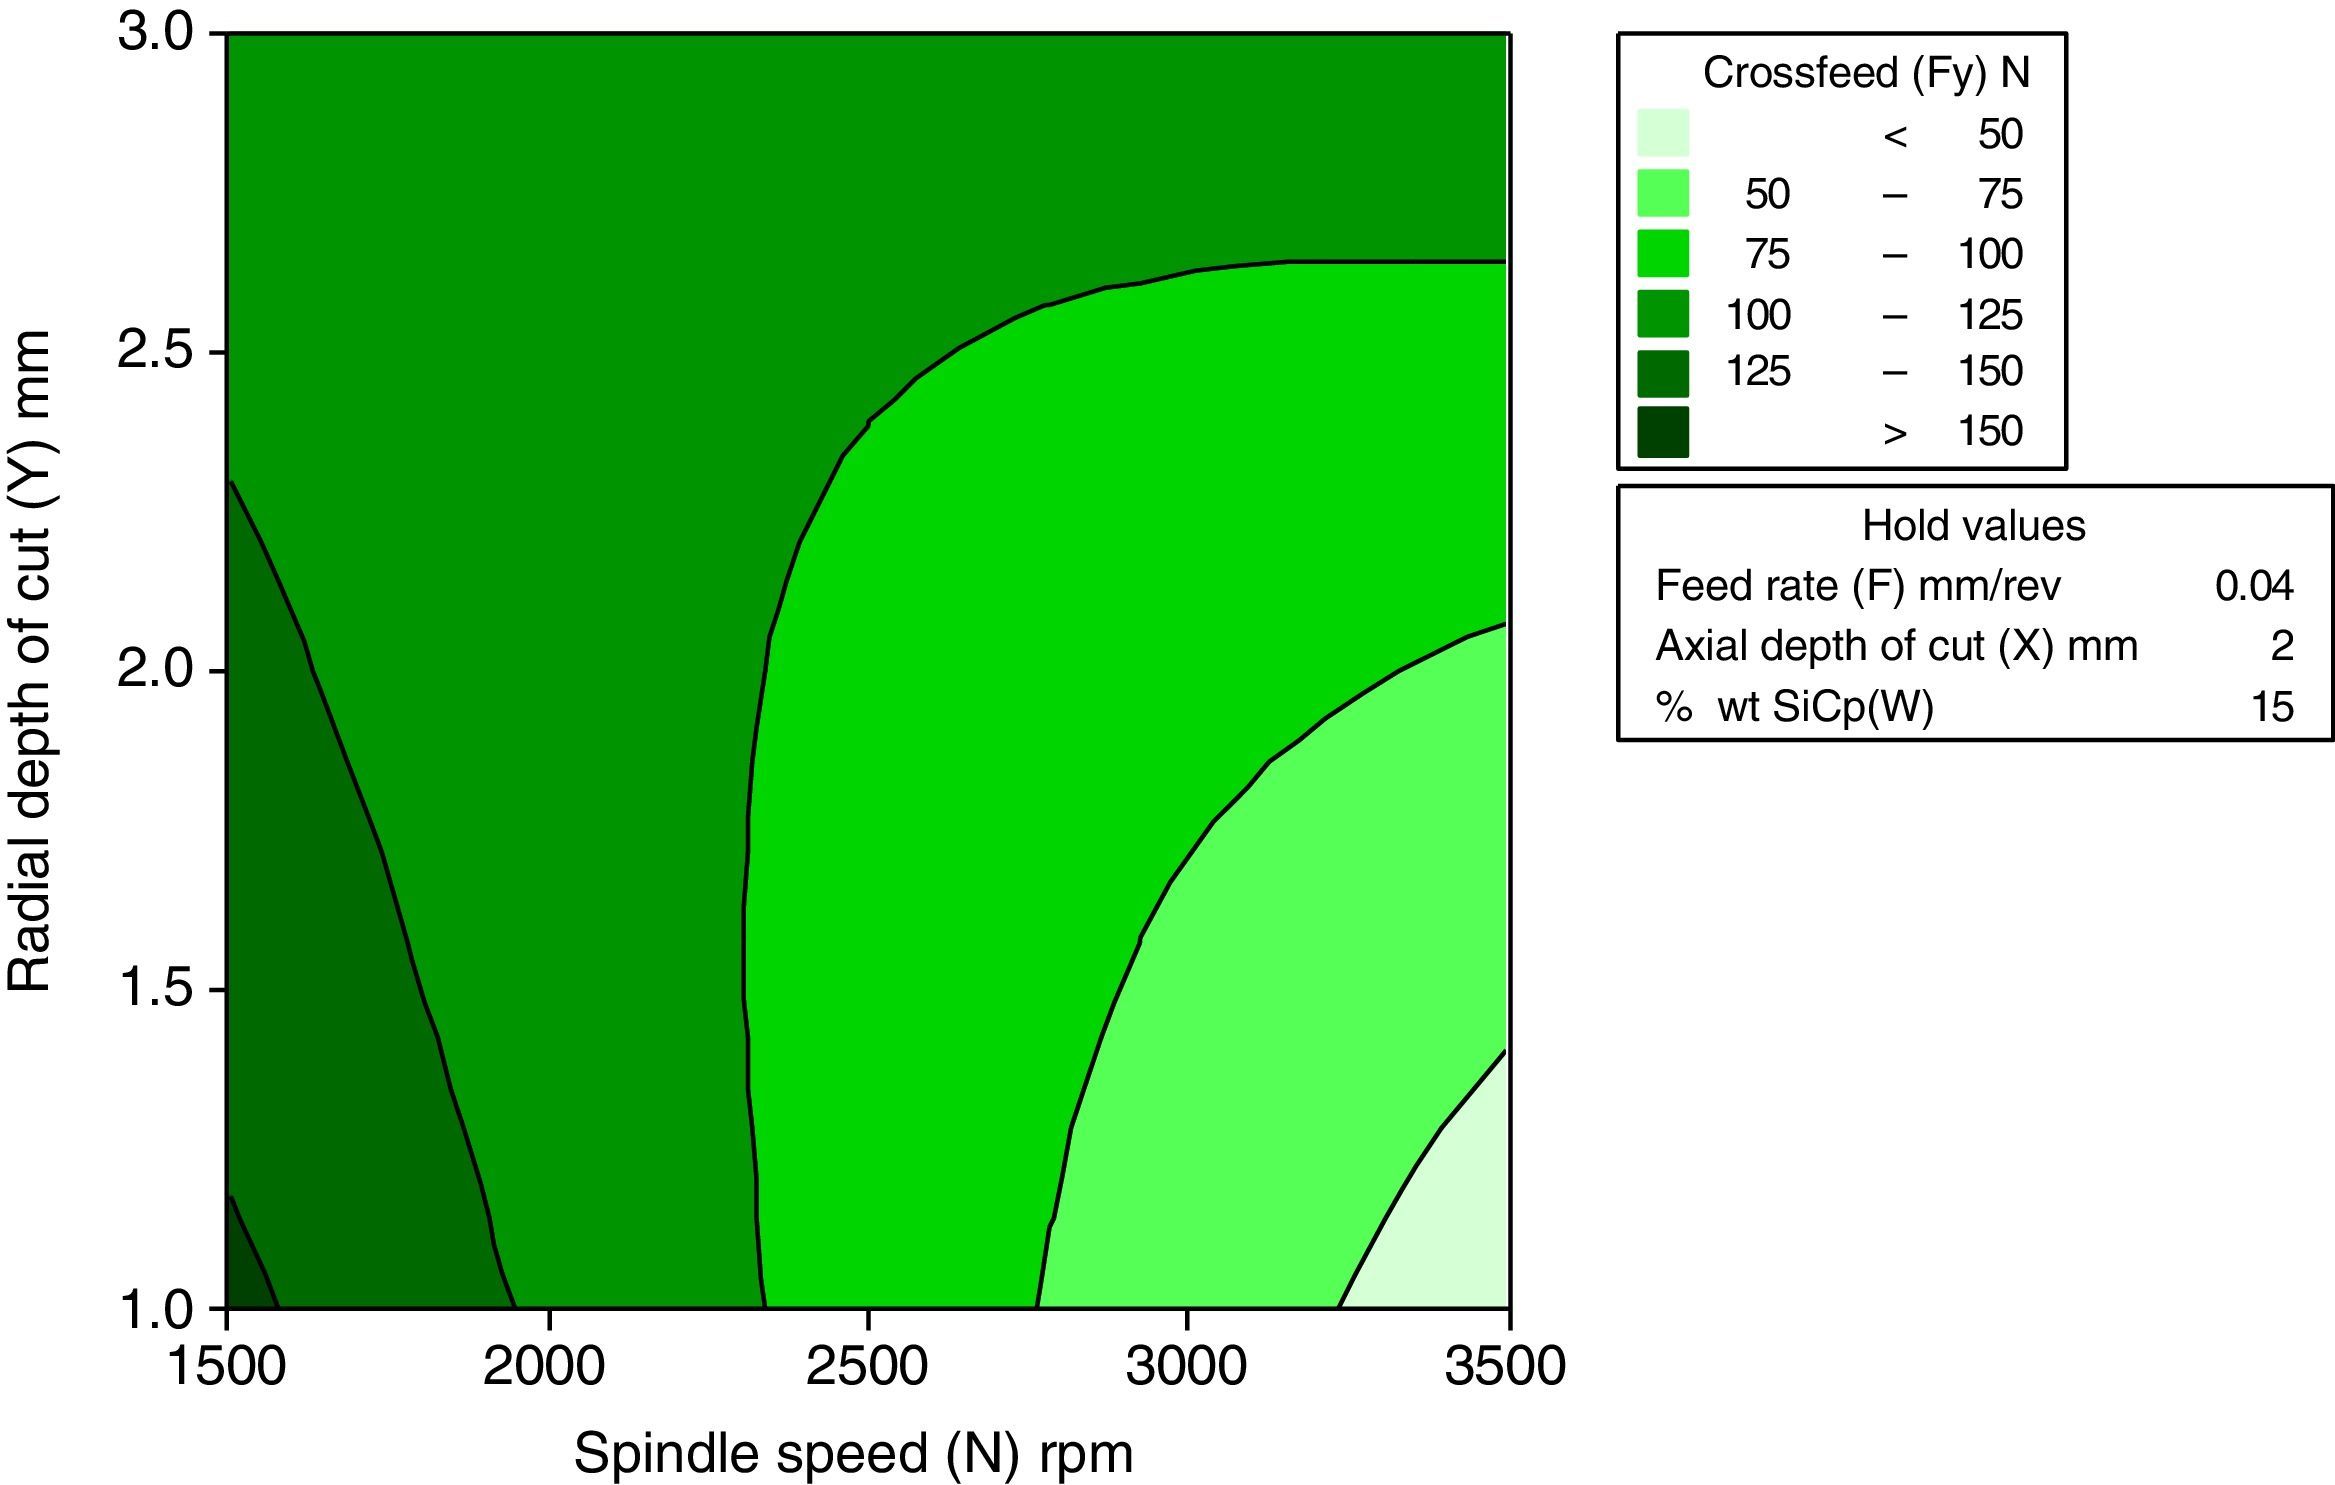
3.2.2Interactive effects of spindle speed and radial depth of cut for crossfeed forceFigure 9 indicates the interactive effect of spindle speed and radial depth of cut for crossfeed force. It has been inferred from the direct effect analysis that the spindle speed has the negative effect and radial depth of cut has a positive effect. It reveals that crossfeed force increase with increase in spindle speed for all the level. The trend gets same for the radial depth of cut from 1mm to 2mm. The crossfeed force is minimal for the 3500rpm of the spindle speed and 1mm of the radial depth of cut.
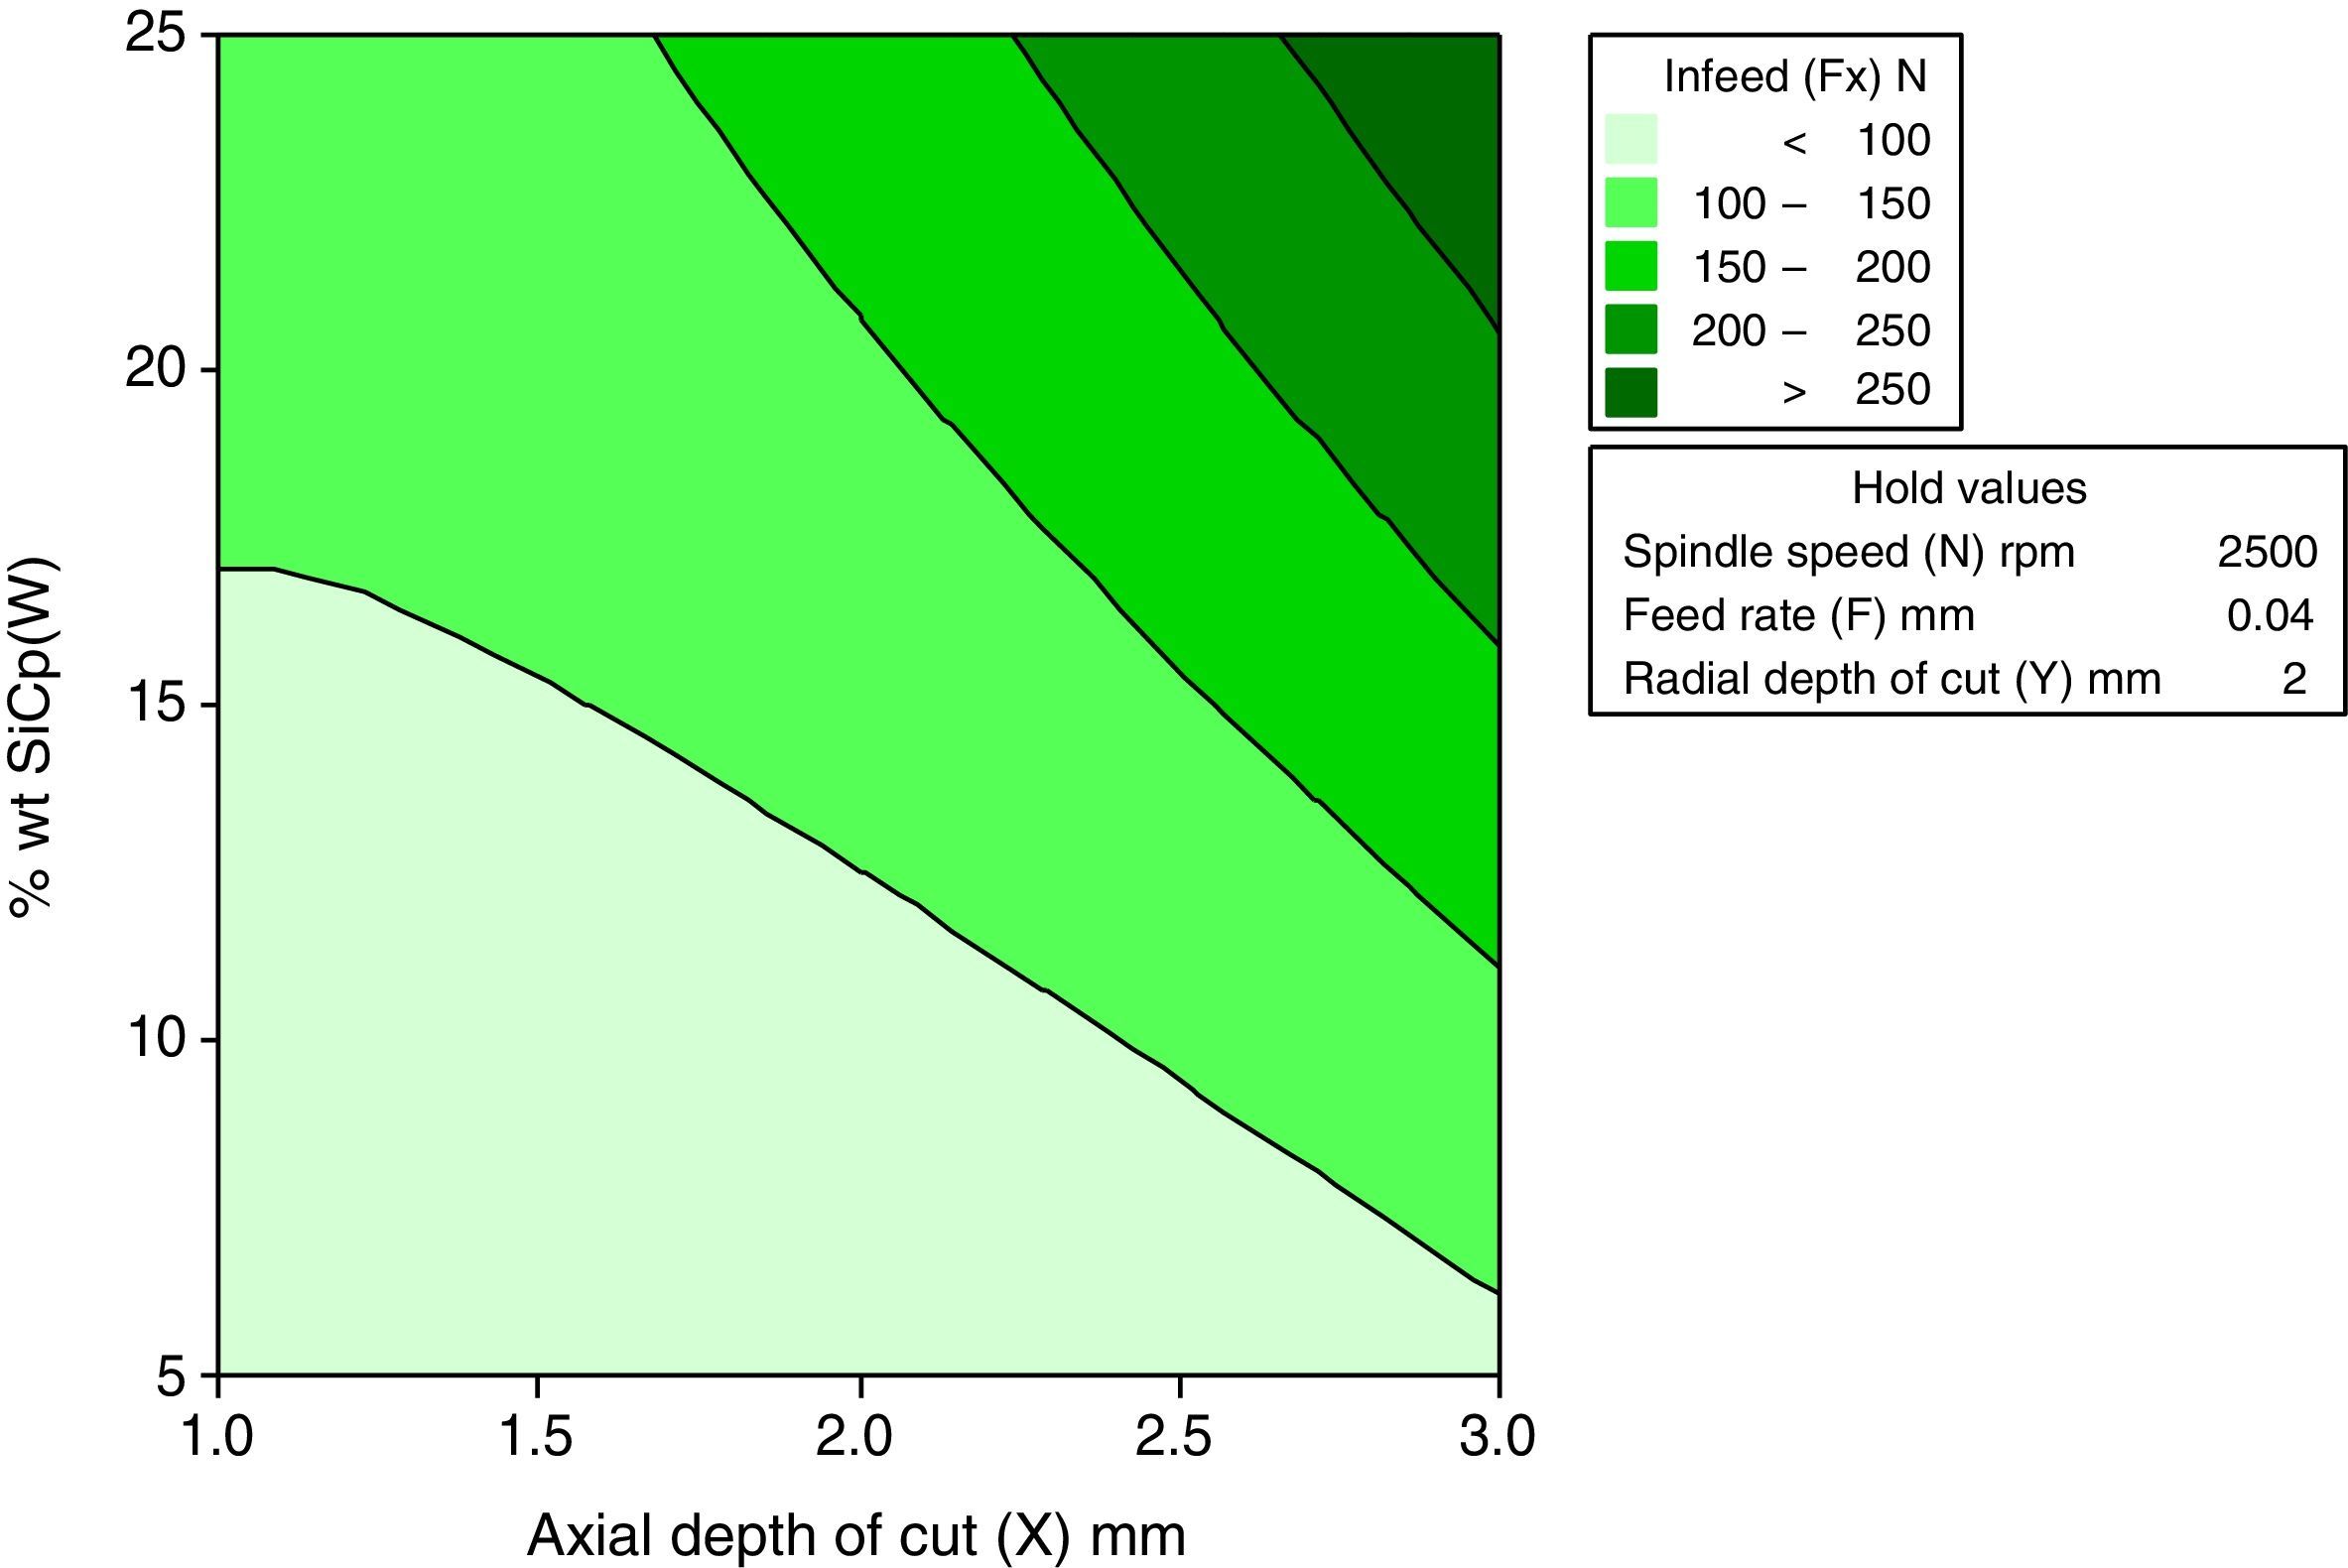
3.2.3Interactive effects of axial depth of cut and wt% of SiCp for Infeed forceFigure 10 shows the relation between axial depth of cut and wt% of SiCp on Infeed force. The direct effect analysis indicates that both axial depth of cut and wt% of SiCp have a positive effect on infeed force, crossfeed force and thrust force. It is observed that axial depth of cut increases resulted in increase of infeed force. A similar trend is followed for all the levels of weight percentage of silicon carbide.
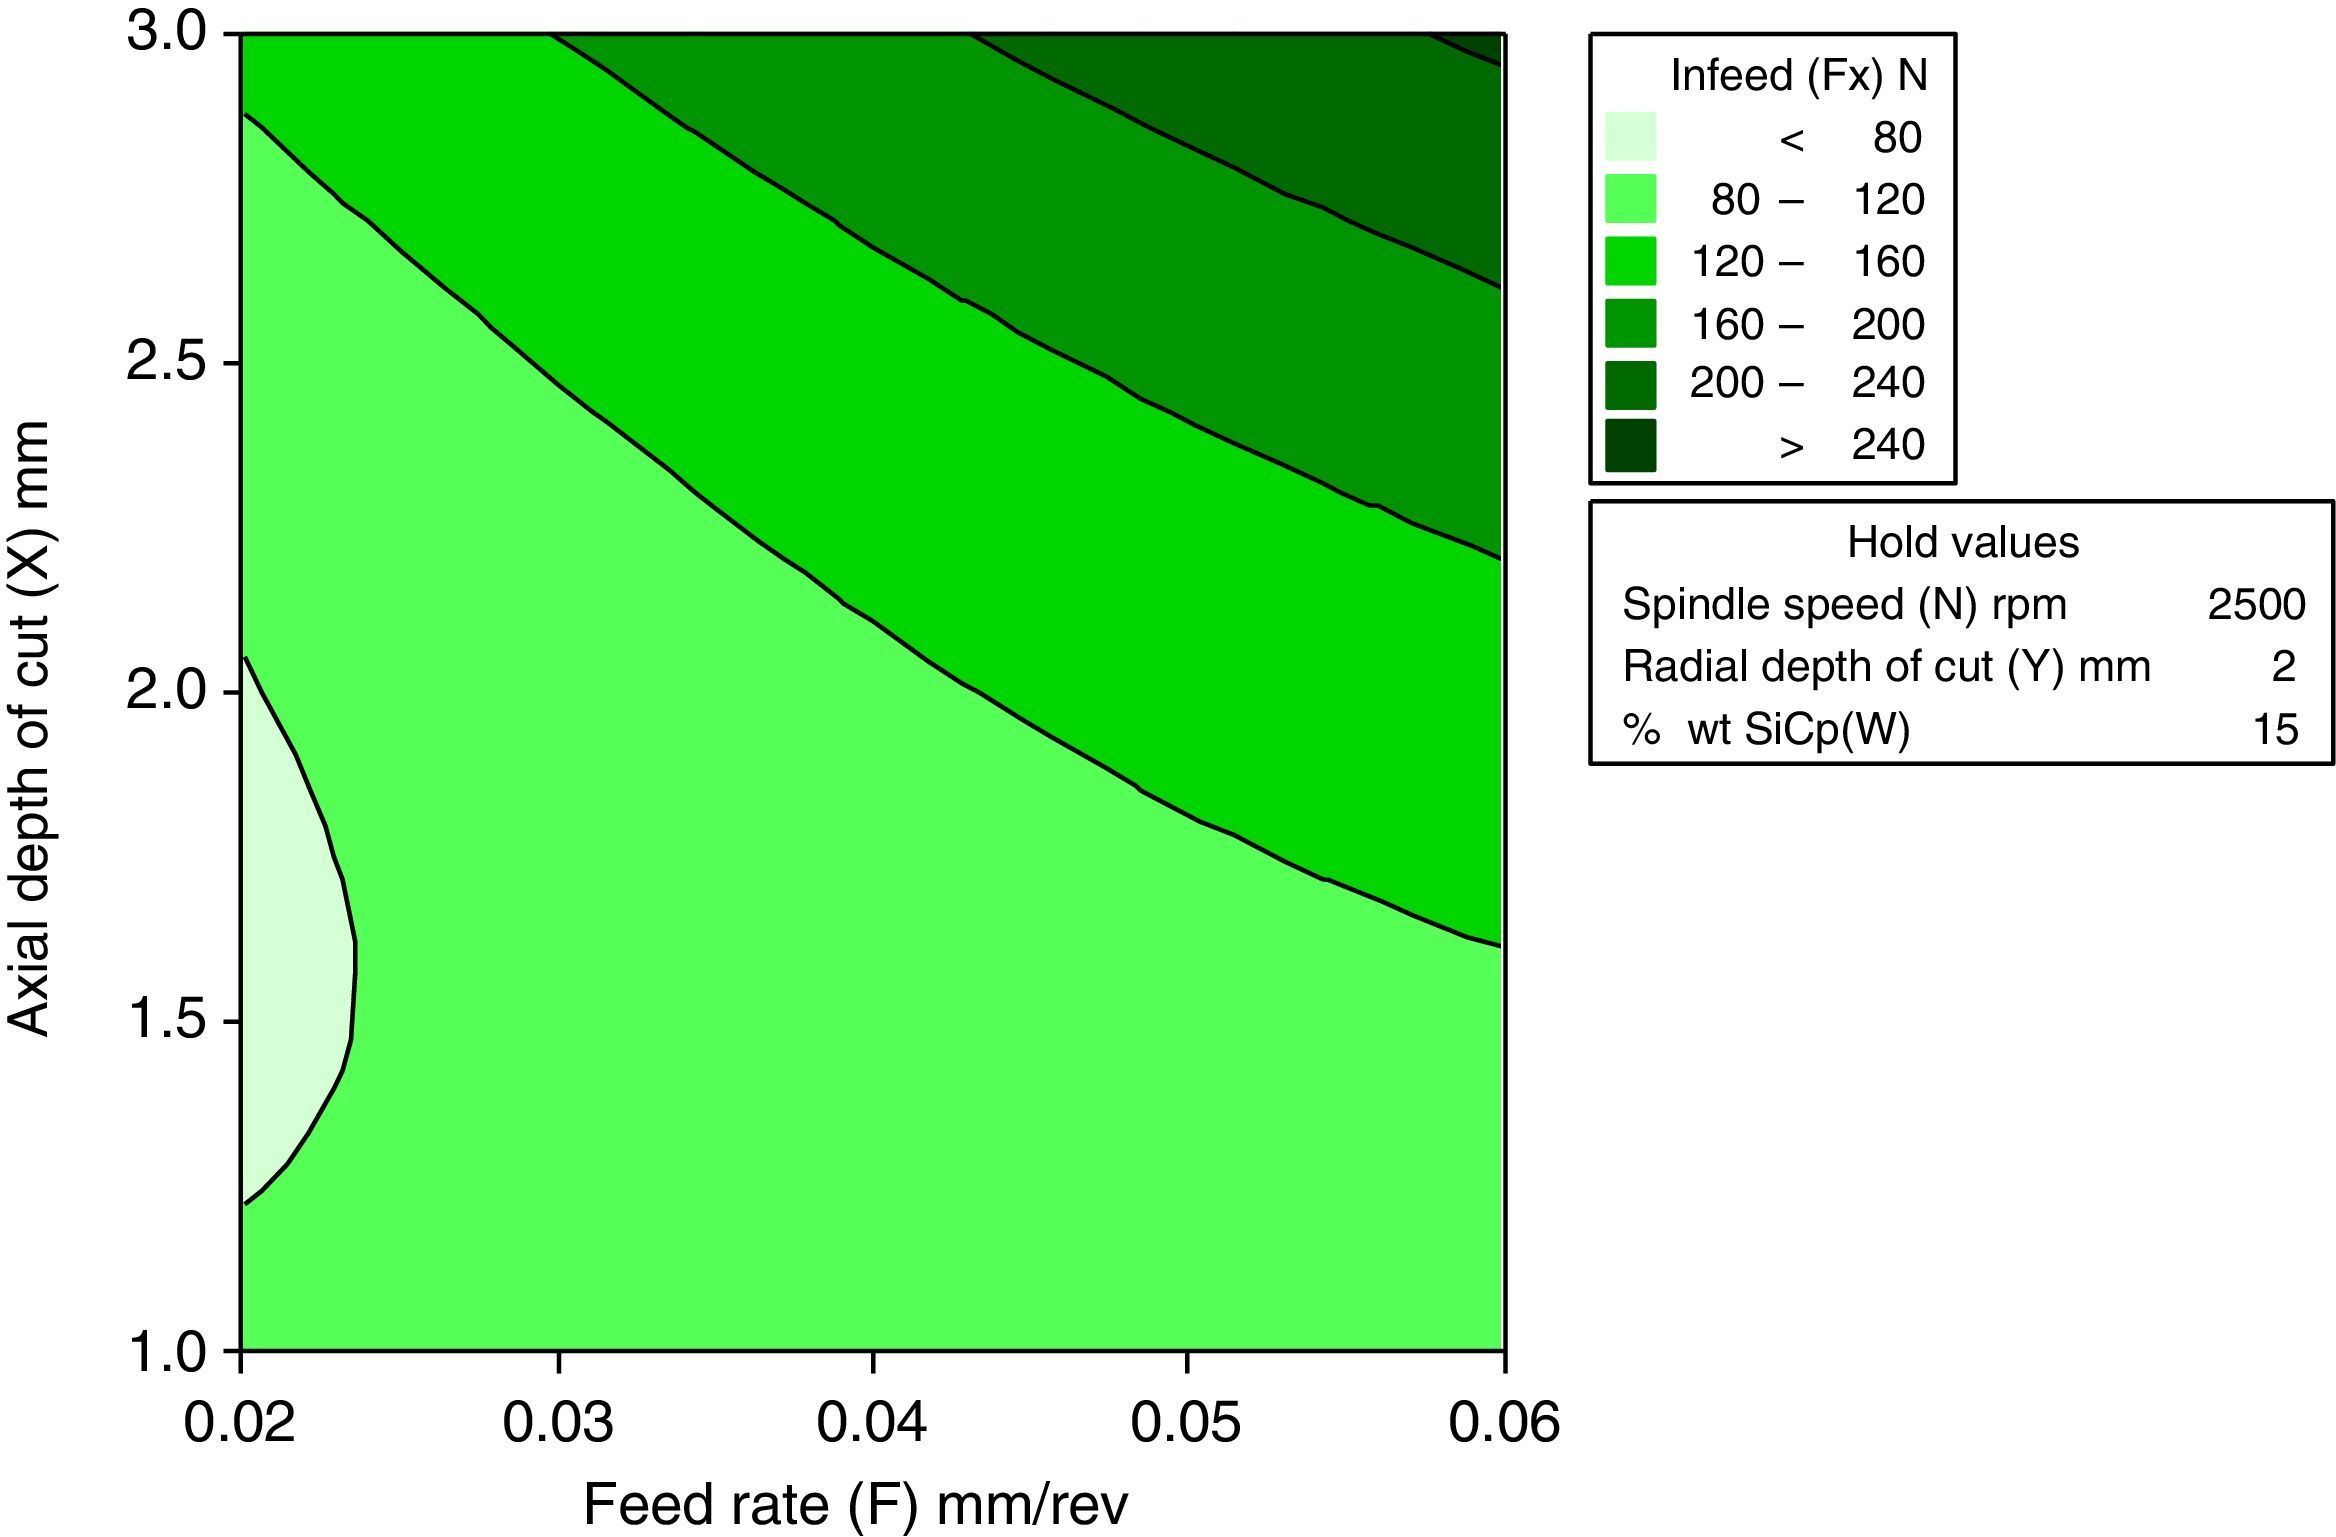
3.2.4Interactive effects of feed rate and axial depth of cut for infeed forceFigure 11 displays the interactive effect of the feed rate and the axial depth of cut on the infeed force. The direct effect analysis shows that both feed rate and axial depth of cut have a positive effect on the cutting force, which indicates that an increase in the feed rate increases the infeed force from 0.02mm/rev to 0.06mm/rev for all the level of axial depth of cut. The cutting force is minimum when 0.02mm/rev to 0.03mm/rev of the rate and 1–2.3mm of the axial depth of cut.
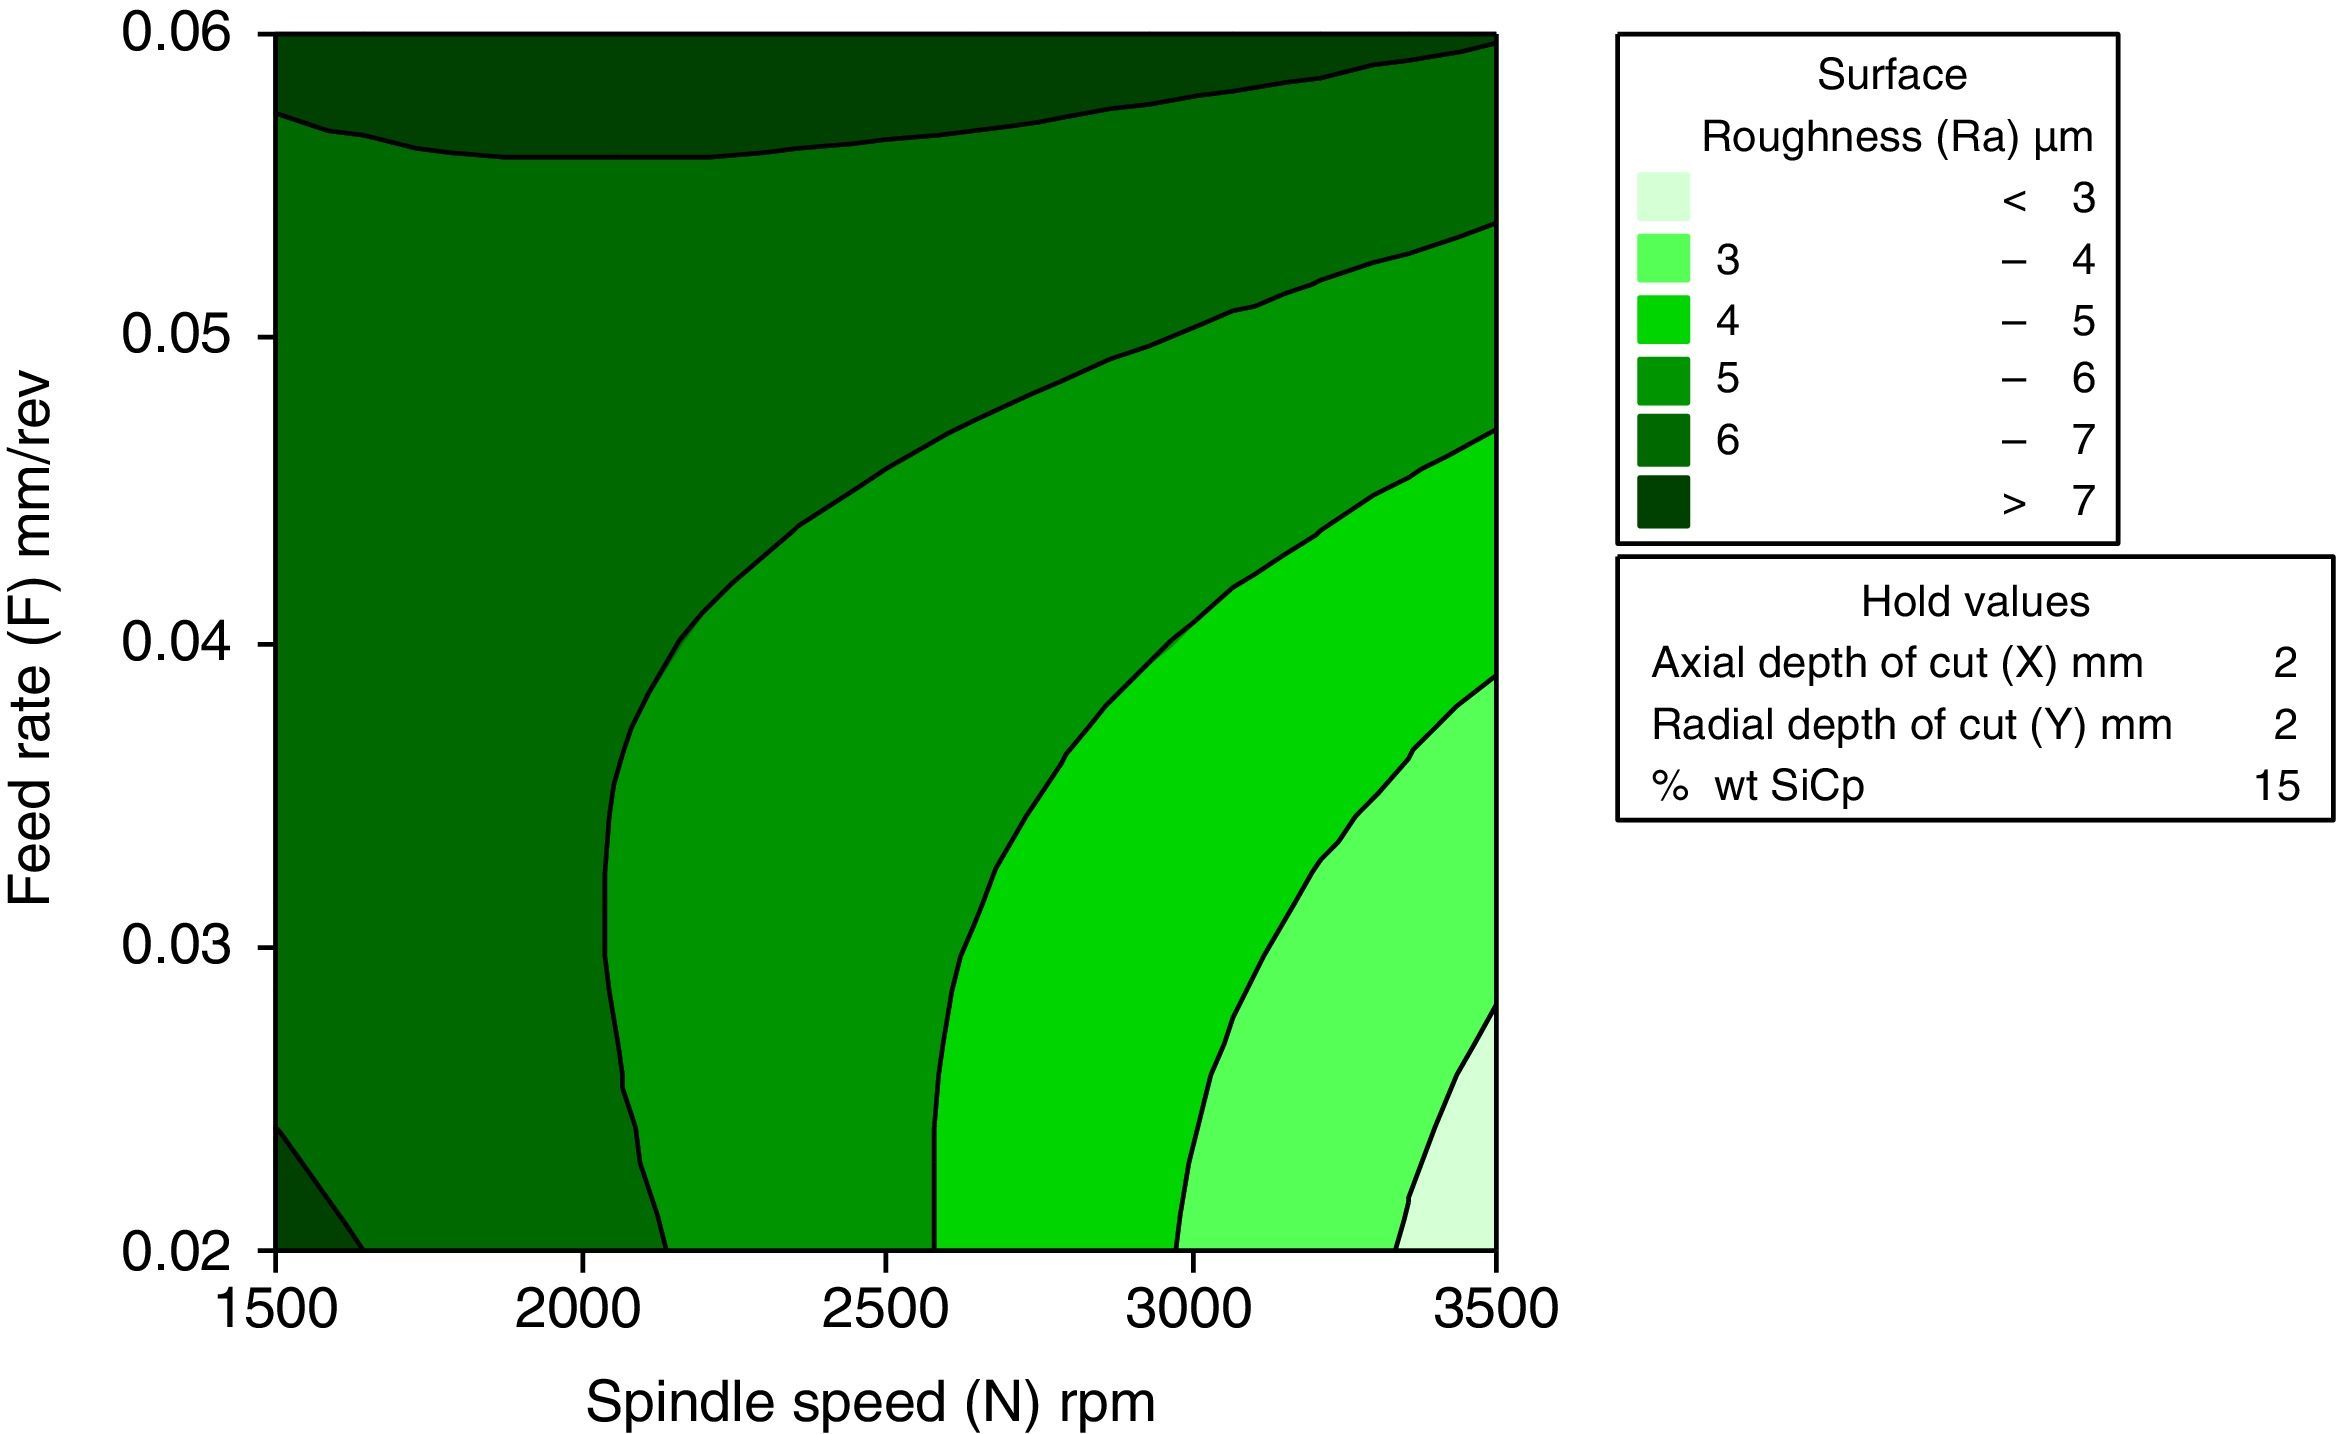
3.2.5Interactive effects of spindle speed and feed rate for surface roughnessFigure 12 shows the effect of the spindle speed and the feed rate on surface roughness. The inference from the direct effect analysis is that the spindle speed has a negative effect and the feed rate has a positive effect. It is also observed that an increase in the spindle speed resulted in a better surface finish. The same trend follows for the change of level of the feed rate from 0.02mm to 0.04mm. It is observed that the surface roughness is minimum at 3500rpm of spindle speed and 0.02mm/rev of feed rate
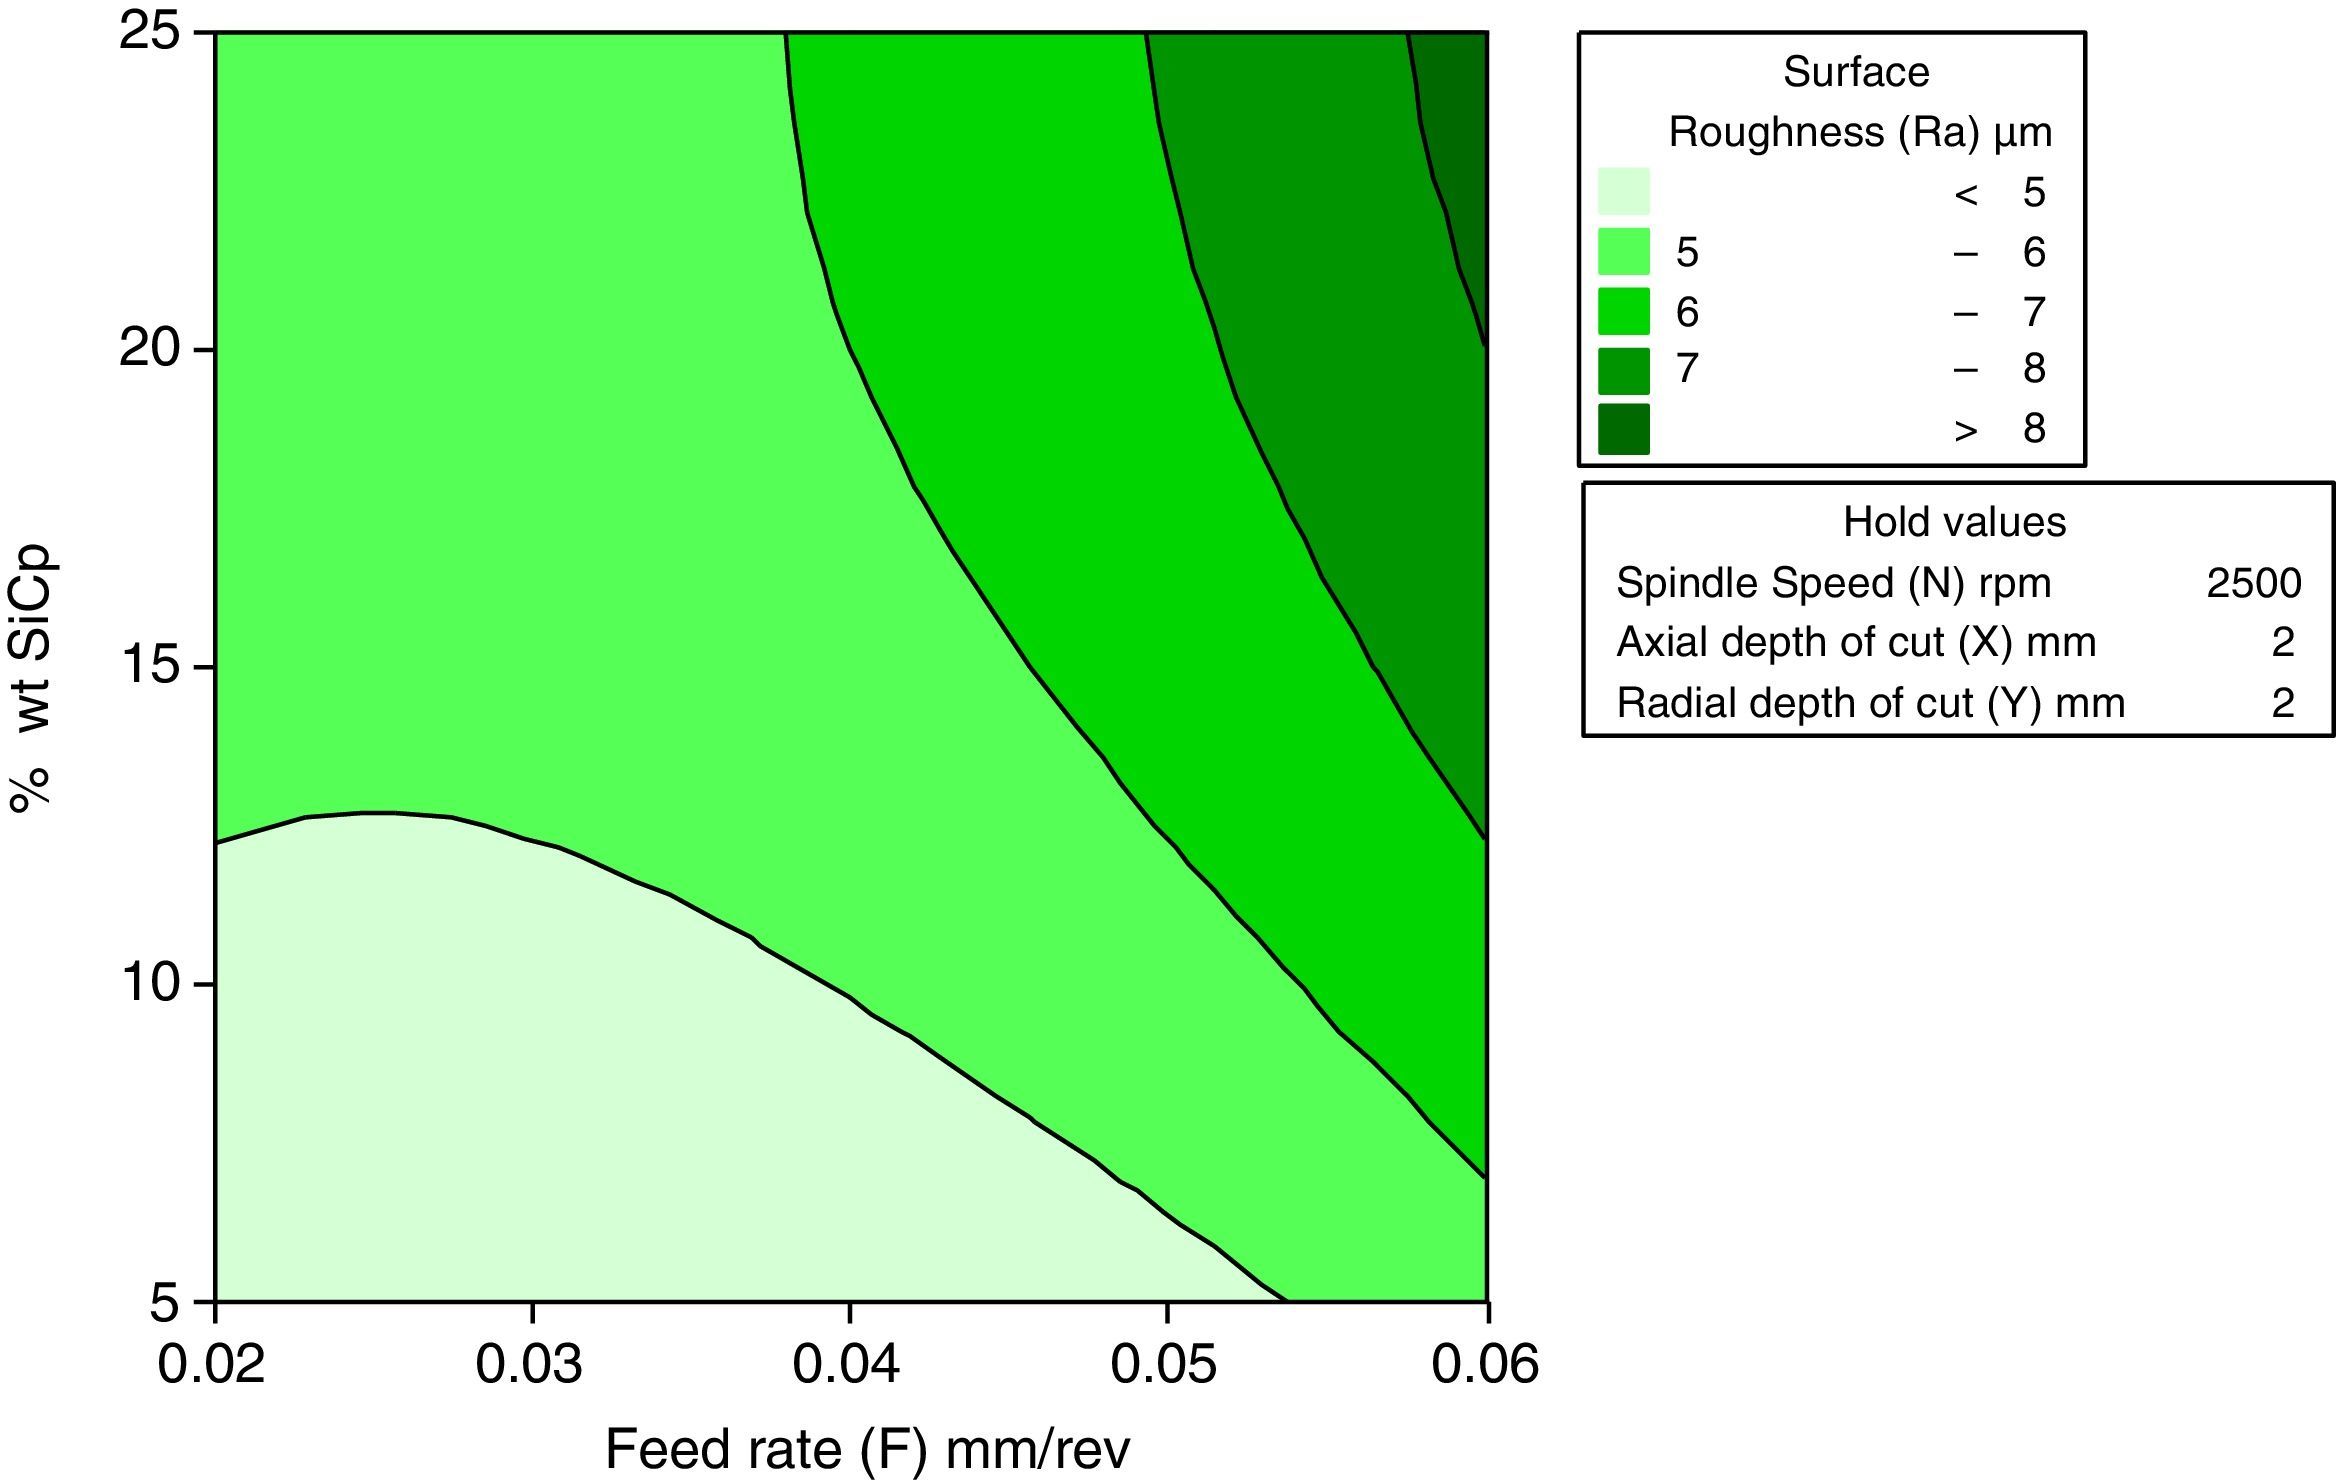
3.2.6Interactive effects of feed rate and wt% of SiCp for surface roughnessFigure 13 describes the interactive effect of feed rate and wt% of SiCp surface roughness. The interpretation from the direct effect analysis is that both feed rate and wt% of SiCp have a positive effect on surface roughness. The graph indicates that, decrease in feed rate, results the better surface finish for the change of wt% SiCp from 5% to 25%. The better surface finish can be maintained at 5wt% SiCp.
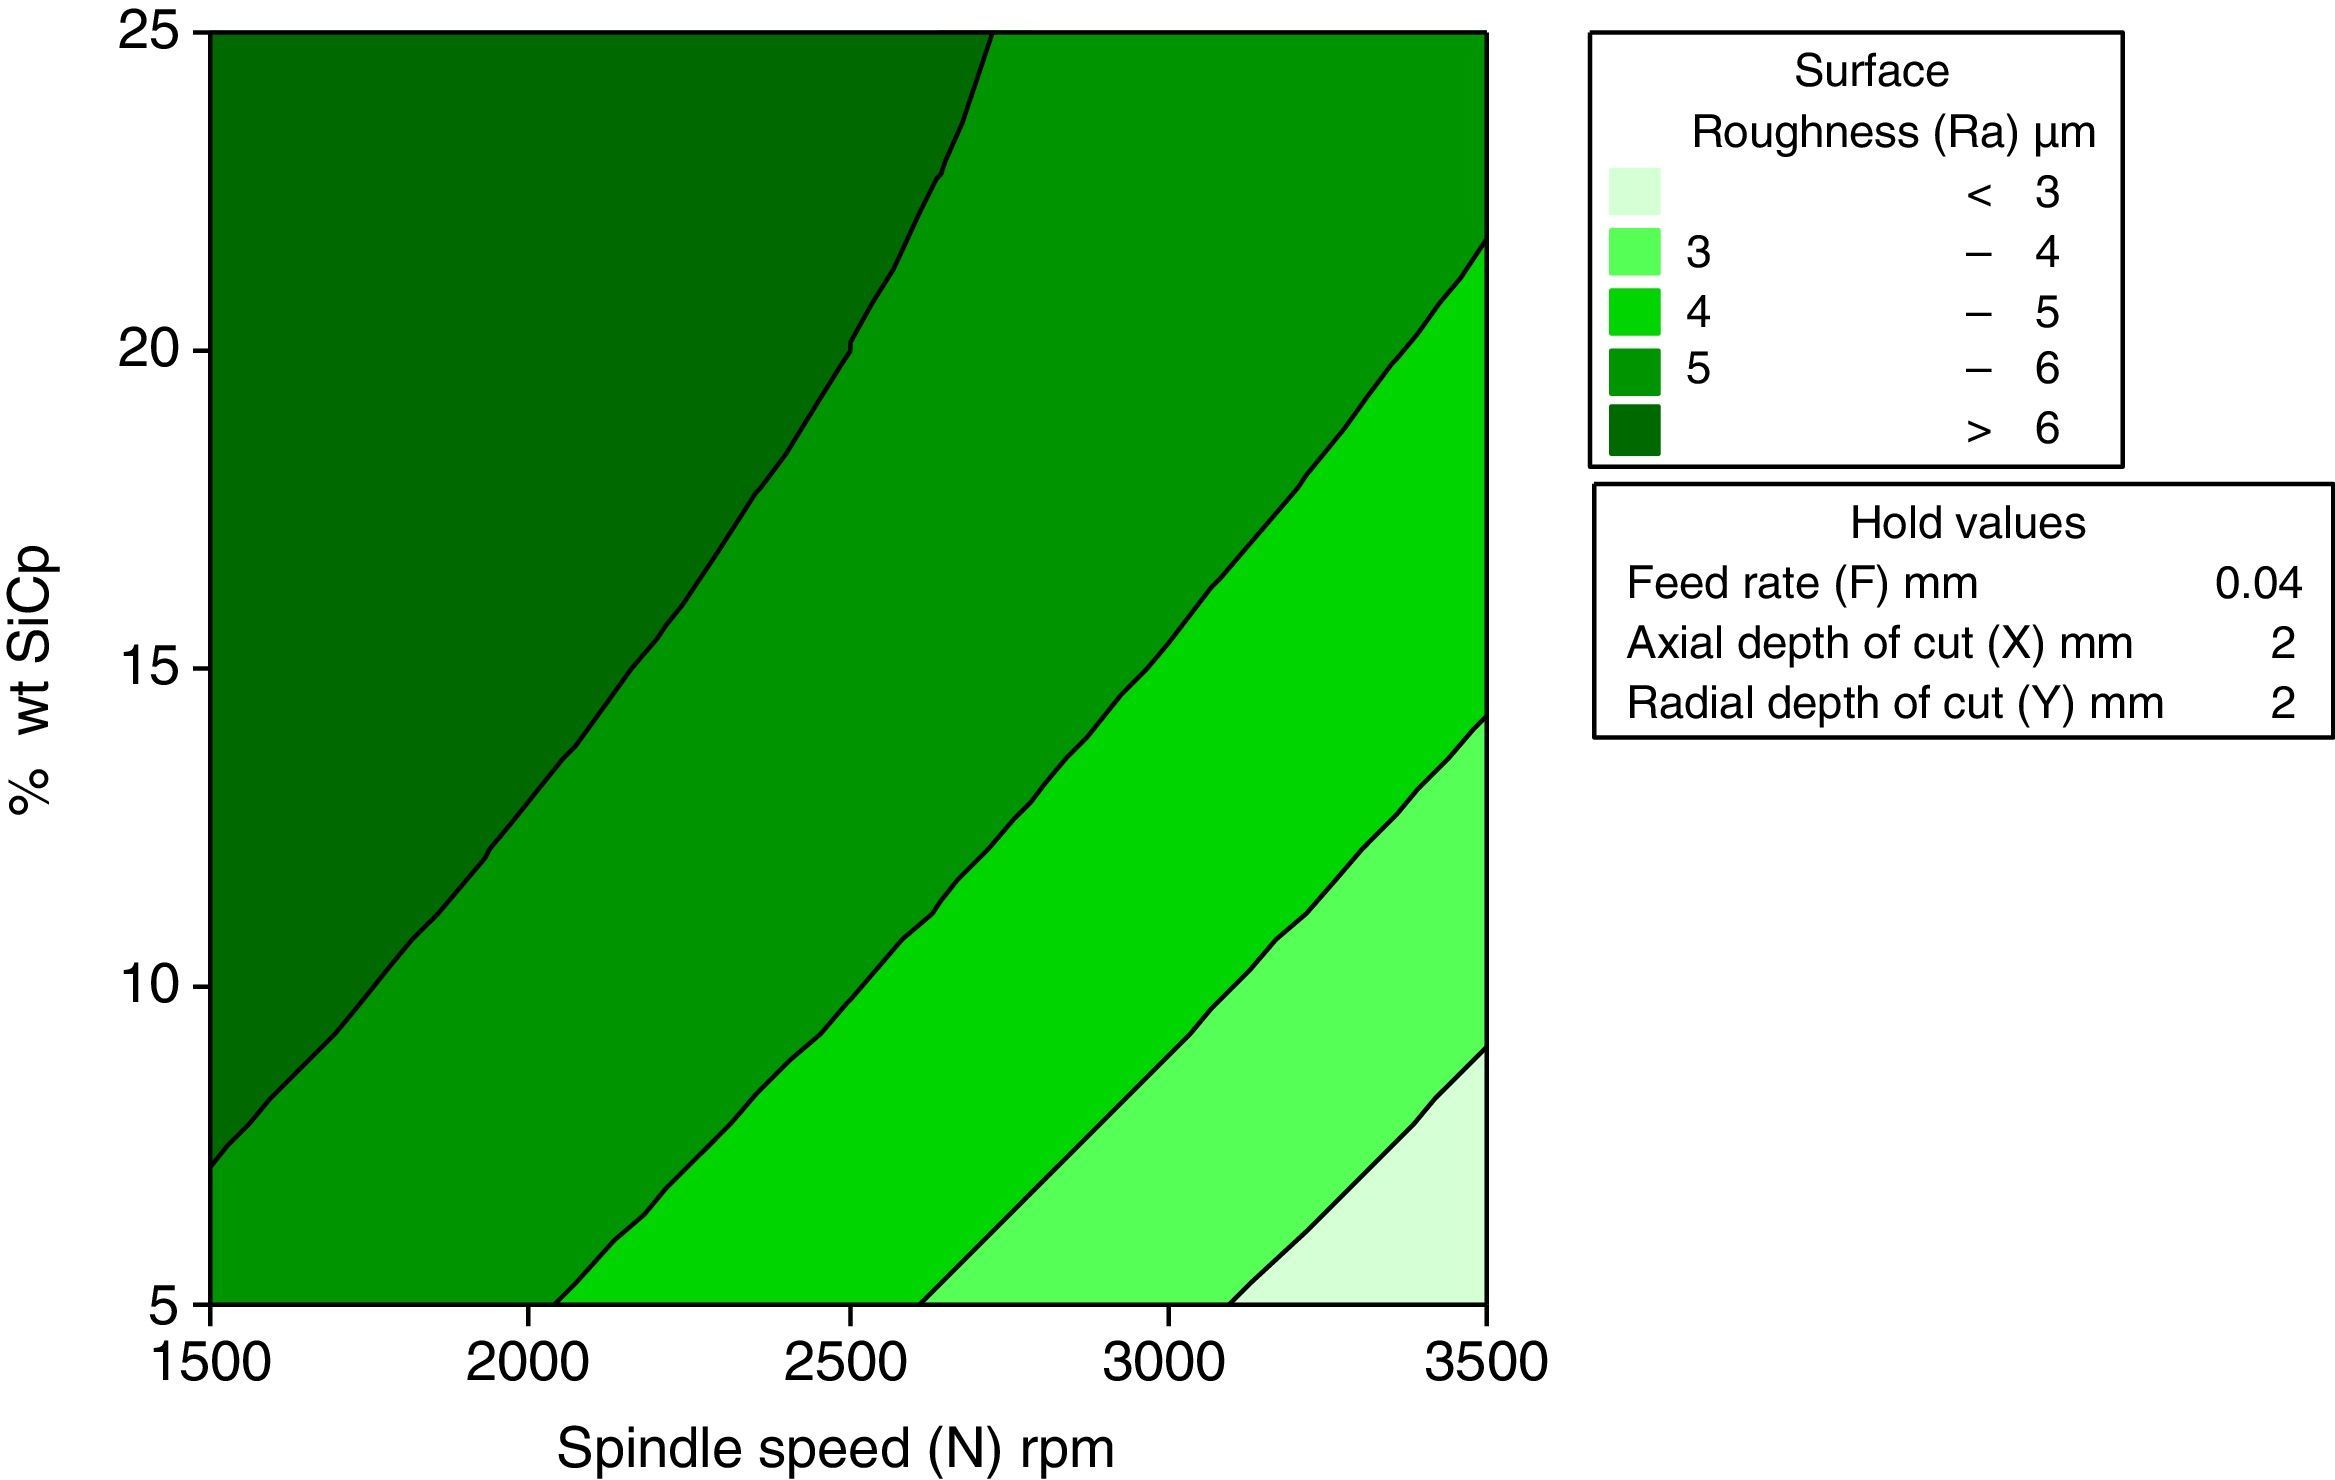
3.2.7Interactive effects spindle speed and wt% of SiCp for surface roughnessFigure 14 indicates the interactive effect of spindle speed wt% of SiCp on surface roughness. From the direct effect analysis, the spindle speed has a negative effect and wt% of SiCp has a positive effect. It infers that, the increase in spindle speed decreases the surface roughness at all levels of weight percentage of silicon carbide. At 3500rpm of spindle speed and 5wt% SiCp ensures better surface finish.
4ConclusionThe experimental investigation presents the effect of the machining parameters (spindle speed, feed rate, axial depth of cut, radial depth of cut and weight percentage of SiCp) on the cutting forces (infeed force, crossfeed force and thrust force) and surface roughness in end milling of LM6 Al/SiCp metal matrix composites.
The following conclusions have been obtained from the results of the present research work:
- •
Infeed force is the most dominant of the three components and shows extensively higher magnitudes than that of the cross feed and thrust force.
- •
Increase in spindle speed decreases the cutting forces (infeed force, crossfeed and thrust force). Additionally, the axial depth of cut on cutting forces is more sensitive compared to wt% of SiCp, radial depth of cut and feed rate due to excessive contact area.
- •
The main effect plot indicates that, the feed rate is the most significant parameter on surface roughness. Because of less metal removal rate, friction and pitting mark, the surface roughness in end milling of MMC is minimum at the lower feed rate. At a higher spindle speed, built-up-edge formation is vanished, therefore the surface roughness decreases.
- •
The results of ANOVA and confirmation experiments have proved that the mathematical models of the cutting force are well-fitted and the estimated values of the responses are closer to the investigation's results with 95% confidence level.
The authors have no conflicts of interest to declare.
This research did not receive any specific grant from funding agencies in the public, commercial, or not-for-profit sectors.
Peer Review under the responsibility of Universidad Nacional Autónoma de México.