


Background/Objective: Social anxiety is a common issue arising in adolescence that can cause significant impairment and have detrimental consequences for development in the absence of treatment. In this study we examined the factor structure and the psychometric properties of a 12-item short form of the Portuguese-Language Social Anxiety Scale for Adolescents (SAS-A-SF). Method: A community adolescent sample (N = 835) and a young offender sample (N = 244) completed the SAS-A, the Basic Empathy Scale and the Reactive-Proactive Aggression Questionnaire. Confirmatory factor analysis, internal consistency, cross gender and cross sample invariance, convergent and discriminant validity of the SAS-A-SF were analyzed. Results: The confirmatory factor analysis revealed that the 3-factor second-order model obtained the best fit.The results provided evidence that the SAS-A-SF is a psychometrically sound instrument that shows measurement invariance across genders and across samples, good reliability and positive correlations with empathy. Conclusions: The Portuguese version of SAS-A-SF is a useful, time-efficient tool for both researchers and practitioners who need to assess social anxiety, a relevant construct in adolescent psychopathology.
Antecedentes/Objetivo: La ansiedad social es un problema común con inicio en la adolescencia que puede causar impedimentos y consecuencias negativas en el desarrollo en ausencia de tratamiento. En el presente estudio analizamos la estructura factorial y las propiedades psicométricas de una forma abreviada de 12 ítems de la versión portuguesa de la Social Anxiety Scale for Adolescents (SAS-A-SF). Método: Una muestra de adolescentes de la población general (N = 835) y de infractores institucionalizados (N = 244) completó el SAS-A, la Basic Empathy Scale y el Reactive-Proactive Aggression Questionnaire. Realizamos un análisis factorial confirmatorio y analizamos la consistencia interna, la invariancia entre sexos y muestras, la validez convergente y discriminante de la SAS-A-SF. Resultados: El análisis factorial confirmatorio mostró que el modelo de segundo orden con tres factores era el que mejor se ajustaba a los datos. Los resultados apuntan a que la SAS-A-SF es un instrumento con buenas propiedades psicométricas que muestra invariancia de medida entre sexos y muestras, una buena fiabilidad y correlaciones positivas con la empatía. Conclusiones: La versión portuguesa de la SAS-A-SF es una herramienta útil y eficiente para investigadores y terapeutas que necesiten evaluar la ansiedad social, un constructo relevante en la psicopatología adolescente.
Social anxiety disorder (SAD), one of the most common forms of adolescent psychopathology, can cause significant impairment in different life domains, such as academic functioning and interpersonal relationships (Ranta, La Greca, Kaltiala-Heino, & Marttunen, 2016). It involves persistent and excessive fear of unfamiliar social or performance situations, which are frequently avoided. This avoidance is likely to hinder adolescents’ development, as they may have a more restricted social world and engage in fewer extra-curricular activities (Nelemans et al., 2016), even presenting a higher risk of early school dropout (Van Ameringen, Mancini, & Farvolden, 2003).
SAD has an early onset (Fehm, Beesdo, Jacobi, & Fiedler, 2008), a relatively high prevalence in adolescents (with estimated rates between 5.0% and 9.1%; Costello, Egger, Copeland, Erkanli, & Angold, 2011; Merikangas et al., 2010), and a negative prognosis in the absence of treatment (Bornas, de la Torre-Luque, Fiol-Veny, & Balle, 2017). These findings suggest that having time and cost-effective, valid, and reliable screening tools available to accurately detect this disorder and monitor treatment progress is crucial (Buela-Casal, & Guillén-Riquelme, 2017).
Furthermore, SAD in adolescence is longitudinally associated with several negative outcomes: it substantially increases the risk for subsequent depression (Beesdo et al., 2007), on- and off-line victimization of bullying (Álvarez-García, Nuñez, Dobarro, & Rodriguéz, 2015; Jiménez & Estévez, 2017), internet addiction (Stavropoulos et al., 2017) and alcohol use (Black et al., 2015).
Although SAD has been linked to poorer social functioning (e.g., Keller, 2006), there are intriguing findings in the literature that point in opposite directions, suggesting that socially anxious youths may have increased empathy levels (Tibi-Elhanany & Shamay-Tsoory, 2011) and be less prone to exhibit aggressive and delinquent behaviours (DeWall, Buckner, Lambert, Cohen, & Fincham, 2010).
The existence of gender differences in SAD prevalence is well established, with female youths typically reporting more social anxiety (SA) than males (Merikangas et al., 2010), which emphasizes the importance of ensuring that measures are gender invariant. Cultural variations in the experience and expression of SAD, however, remain largely unexplored. The extant research on this topic supports the existence of cultural differences, with individuals from collectivistic countries being generally more accepting toward socially withdrawn and reticent behaviors, and reporting higher levels of SA and more fear of blushing than participants from individualistic countries (Heinrichs et al., 2006). Thus, it is important to validate SA measures in non Anglo-Saxon cultures to ensure that the instrument is able to capture accurately the meaning of this construct in different societies. Portuguese adolescents lead, to some extent, lives that are similar to youths in other Western nations (WHO Europe, 2016). Although we could categorize Portugal as an individualistic society in the Eastern vs. Western axis, the country's Catholic tradition and its alignment with Mediterranean cultures mean that a strong emphasis is placed on family relationships and the family unit, as well as belongingness and social interdependence (Guerreiro, 2014). In this study, we will attempt to validate a golden standard measure of SA with Portuguese youths.
Among the most used and empirically supported questionnaires for measuring SA is the Social Anxiety Scale for Adolescents (SAS-A, La Greca & López, 1998). It contains three subscales: Fear of Negative Evaluation (FNE), Social Avoidance and Distress-New (SAD-New) and Social Avoidance and Distress-General (SAD-Gen). This instrument has received consistent empirical support demonstrating its reliability as a screening tool (Tulbure, Szentagotai, Dobrean, & David, 2012). Its original factorial structure has been replicated multiple times in samples from different countries and cultures (e.g., García-López et al., 2011; La Greca, Inglés, Lai, & Marzo, 2015; Olivares et al., 2005; Ranta et al., 2012). The three-factor structure is also invariant across gender and age, as well as between normative and clinically anxious adolescents (Inglés, La Greca, Marzo, & García-Fernández, 2010; La Greca, Inglés, Lai, & Marzo, 2015).
Regarding internal consistency, alpha values ranging from .70 to .94 have been reported (Ginsburg, La Greca, & Silverman, 1998; Inderbitzen-Nolan & Walters, 2000; Ranta et al., 2012). Test–retest reliability coefficients taken in different time intervals have also proved to be strong, ranging from .55 to .86 (Storch, Masia-Warner, Dent, Roberti, & Fisher, 2004; Zhou, Xu, Inglés, Hidalgo, & La Greca, 2008).
Construct validity of the SAS-A is robust, as it has shown significant correlations with other measures of social functioning (e.g., peer relations and acceptance, La Greca & López, 1998), general anxiety and depressive symptoms (Inderbitzen-Nolan & Walters, 2000). Evidence for concurrent and discriminant validity comes from its significant correlations with other measures of SA (Storch et al., 2004) and its non-significant associations with self-perceptions in nonsocial areas (La Greca & López, 1998), respectively. The SAS-A has also shown good predictive validity, successfully classifying individuals according to the SAD diagnosis of the Anxiety Disorders Interview Schedule for DSM-IV (Olivares et al., 2005).
Taking into consideration the well-established properties of the SAS-A, the validation of a short version of this instrument is a promising line of research, as it would allow its inclusion in research protocols without a substantial increase in participant load. The present study is part of a larger project investigating psychopathic traits and their relations with other variables, such as SA, among different types of samples. It has been proposed that anxiety may provide a distinct contribution when assessing the primary and secondary variants of the psychopathy construct (Salihovic, Kerr, & Stattin, 2014). However, researchers must previously demonstrate that anxiety measures are valid and reliable among forensic samples. The 12-item short version of the SAS-A used in this study consists of the four items that have been consistently found to have the highest loading for each subscale (e.g., Benner & Graham, 2009; Nelemans et al., 2017). Among Portuguese adolescents, it was predicted that: (1) the three-factor structure of the SAS-A-SF would be confirmed; (2) the SAS-A-SF would show cross gender and cross sample measurement invariance; (3) the SAS-A-SF would show good internal consistency measured by Cronbach's Alpha; (4) the SAS-A-SF would show convergent validity with the original SAS-A and the Basic Empathy Scale, and discriminant validity with the Reactive-Proactive Aggression Questionnaire; and that (5) female youths would report more SA than male youths.
MethodParticipantsA school sample of 835 participants (M=15.94 years; SD=1.66 years; age range=12-20 years), subdivided into males (n=409; M=16.01; years; SD=1.69 years; age range=12-20 years) and females (n=426; M=15.82 years; SD=1.73 years; age range=12-20 years), agreed participate in the study voluntarily. The school sample was recruited from randomly selected public schools managed by the Portuguese Ministry of Education. The participants were mostly white Europeans (88.9%) from an urban/semi-urban background who had completed an average of 9 years of education (M=8.98; SD=1.45; range=4-12). No differences were found between males and females regarding age (F=2.62; p=.11), and years of education (F=3.61; p=.06).
An institutional sample of 244 (M=16.67 years; SD=1.43 years; age range=12-20 years) of male participants was recruited from eight juvenile detention centers managed by the Portuguese Ministry of Justice. The institutionalized youths were all detained by the court's decision, the harshest sentence the court can give to adolescents. Among the detained participants, the mean age of crime onset was 11.32 years (SD=2.23), and mean age of detention was 15.46 years (SD=1.32) as a result of committing serious and violent crimes (e.g., robbery, assault). Males from the institutional sample, when compared to males from the school sample, were older (F=26.06; p≤.001) and had fewer years of education (F=562.71; p≤.001).
MeasuresThe Portuguese-language adaptation of the SAS-A (La Greca & López, 1998) was used in this study (for a detailed account on the scale translation and validation, see Pechorro, Ayala-Nunes, Nunes, Maroco, & Gonçalves, 2016). The SAS-A is an 18-item (plus four filler items) self-administered scale appropriate for adolescents between 13 and 18 years of age. Items are anchored in a 5-point Likert scale (from 1=Strongly disagree to 5=Strongly agree). Total scores may range between 18 and 90, with higher scores indicating higher levels of SA. The FNE subscale is composed of eight items that reflect fears and concerns regarding negative evaluations from other people (e.g., “I worry about what others think of me”); SAS-A items 8, 9, 12 and 14 were retained on the SAS-A-SF. The SAD-New subscale is comprised of six items including feelings of discomfort and social avoidance in new situations or situations involving unfamiliar peers (e.g., “I get nervous when I talk to peers I don’t know very well”); SAS-A items 4,10, 13, and 20 were retained on the SAS-A-SF. Lastly, the SAD-Gen subscale includes four items reflecting discomfort and avoidance in general situations of peer interactions (e.g., “I feel shy even with peers I know well”) (La Greca & López, 1998), all of which were retained on the SAS-A-SF.
The Basic Empathy Scale (BES; Jolliffe, & Farrington, 2006) is a 20-item self-report measure designed to assess empathy in youths, measuring two distinct factors: Affective empathy (e.g., “My friend's emotions don’t affect me much”), and Cognitive empathy (e.g., “I find it hard to know when my friends are frightened”). It has been used with pre-adolescents and adolescents aged 9 to 18 years old. Each item is scored on a five-point ordinal scale (from 1=Strongly disagree to 5=Strongly agree). Scores are calculated by reverse-scoring the positively worded items and then summing the items to obtain the total score and the factors scores. Higher scores indicate an increased presence of the associated characteristics. The Portuguese validation of the BES (Pechorro, Ray, Salas-Wright, Marôco, & Gonçalves, 2015) was used. The internal consistency for the current study was α=.91.
The Reactive-Proactive Aggression Questionnaire (RPQ; Raine et al., 2006) is a self-report measure distinguishing between two factors: Reactive aggression (e.g., “Reacted angrily when provoked by others”) and Proactive aggression (e.g., “Hurt others to win a game”). It consists of 23 items rated on a 3-point ordinal scale (0=Never, 1=Sometimes, and 2=Often). Higher scores indicate higher levels of aggression. The Portuguese validation of the RPQ (Pechorro, Ayala-Nunes, Khan, & Nunes, 2017) was used. Internal consistency for the present study was α=.92.
A sociodemographic questionnaire was applied to obtain data about participants’ age, gender, parent's socioeconomic status, ethnic group, origin (urban vs. rural), and years of schooling completed.
ProcedureAuthorization to assess youths from the school sample was obtained from the General Directorate of Education of the Portuguese Ministry of Education. The participants, from public schools of the Lisbon, Algarve and Coimbra regions, were informed about the nature of the study and asked to voluntarily participate. Parental authorization was previously obtained from all participants that accepted to collaborate in the present study. The participation rate was approximately 87%. Authorization to assess youths from the forensic sample was obtained from the General Directorate of Reintegration and Prison Services of the Portuguese Ministry of Justice. The detainees were informed about the nature of the study and asked to voluntarily participate. The participation rate was approximately 92%. The research was approved by University of Minho Research Ethics Committee.
Data analysisThe data were analyzed using IBM SPSS 24.0 (IBM Corp., Chicago, IL.) and EQS 6.3 (Bentler & Wu, 2015). The factor structure of the SAS-A-SF scale was assessed with Confirmatory Factor Analysis (CFA) performed with ML robust estimation methods. Goodness of fit indices were calculated, including Satorra-Bentler chi-square/degrees of freedom, comparative fit index (CFI), incremental fit index (IFI), root mean square error of approximation (RMSEA) and Akaike Information Criterion (AIC). Regarding the incremental fit index (Bollen's IFI), values that exceed .90 are regarded as acceptable. We used the AIC to select the models with the lowest expected discrepancy between the true model and the hypothesized model (West, Taylor, & Wu, 2014). The CFA was performed on the 12 items of the SAS-A-SF and only items with standardized loadings above .45 were retained. No modification indexes were considered to improve the measurement model.
Measurement invariance was evaluated using the S-Bχ2 difference test, the ΔCFI, and the ΔRMSEA, to determine if the constraints significantly deteriorated the fit of the model (Cheung & Rensvold, 2002).
ANOVAs were used to examine differences between the groups, including partial Eta squared (ηp2) effect size and power (Leech, Barrett, & Morgan, 2015). Pearson correlations were used to analyze associations between scale variables.
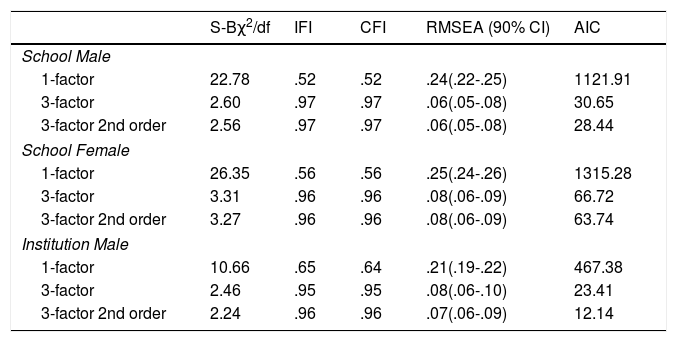
ResultsOur first step in examining the psychometric properties of the SAS-A-SF was to use CFA to replicate the different factor structures proposed for this instrument. We found strong support for the 3-factor second-order model based on appropriate goodness-of-fit indices (West et al., 2014). However, the 3-factor first-order model also obtained a good fit and did not differ from the second-order model (see Table 1).
Goodness of fit indices for the different models of the SAS-A-SF.
| S-Bχ2/df | IFI | CFI | RMSEA (90% CI) | AIC | |
|---|---|---|---|---|---|
| School Male | |||||
| 1-factor | 22.78 | .52 | .52 | .24(.22-.25) | 1121.91 |
| 3-factor | 2.60 | .97 | .97 | .06(.05-.08) | 30.65 |
| 3-factor 2nd order | 2.56 | .97 | .97 | .06(.05-.08) | 28.44 |
| School Female | |||||
| 1-factor | 26.35 | .56 | .56 | .25(.24-.26) | 1315.28 |
| 3-factor | 3.31 | .96 | .96 | .08(.06-.09) | 66.72 |
| 3-factor 2nd order | 3.27 | .96 | .96 | .08(.06-.09) | 63.74 |
| Institution Male | |||||
| 1-factor | 10.66 | .65 | .64 | .21(.19-.22) | 467.38 |
| 3-factor | 2.46 | .95 | .95 | .08(.06-.10) | 23.41 |
| 3-factor 2nd order | 2.24 | .96 | .96 | .07(.06-.09) | 12.14 |
Note. S-Bχ2=Satorra-Bentler chi-square; df=degrees of freedom; IFI=Incremental Fit Index; CFI=Comparative Fit Index; RMSEA (90% CI)=Root Mean Square Error of Approximation (90% Confidence Interval); AIC=Akaike Information Criterion; ML=Maximum Likelihood.
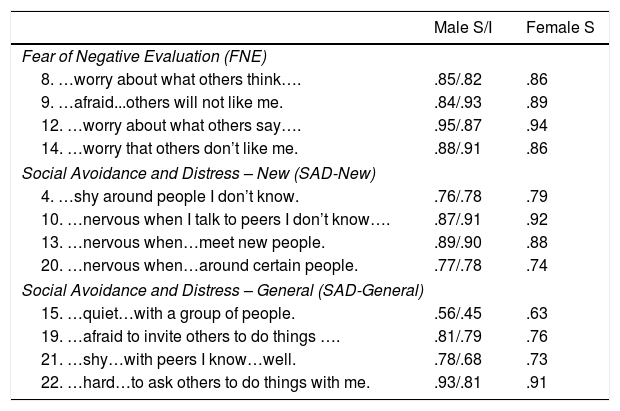
Table 2 displays the standardized item loadings for the 3-factor second-order model structure of the SAS-A-SF, estimated with the ML Robust method. All items had loadings well above .45 and, thus, none were removed from the model.
Standardized factor loadings of the three-factor 2nd order model of the SAS-A-SF.
| Male S/I | Female S | |
|---|---|---|
| Fear of Negative Evaluation (FNE) | ||
| 8. …worry about what others think…. | .85/.82 | .86 |
| 9. …afraid...others will not like me. | .84/.93 | .89 |
| 12. …worry about what others say…. | .95/.87 | .94 |
| 14. …worry that others don’t like me. | .88/.91 | .86 |
| Social Avoidance and Distress – New (SAD-New) | ||
| 4. …shy around people I don’t know. | .76/.78 | .79 |
| 10. …nervous when I talk to peers I don’t know…. | .87/.91 | .92 |
| 13. …nervous when…meet new people. | .89/.90 | .88 |
| 20. …nervous when…around certain people. | .77/.78 | .74 |
| Social Avoidance and Distress – General (SAD-General) | ||
| 15. …quiet…with a group of people. | .56/.45 | .63 |
| 19. …afraid to invite others to do things …. | .81/.79 | .76 |
| 21. …shy…with peers I know…well. | .78/.68 | .73 |
| 22. …hard…to ask others to do things with me. | .93/.81 | .91 |
Note. S/I=School/Institution samples; S=School sample.
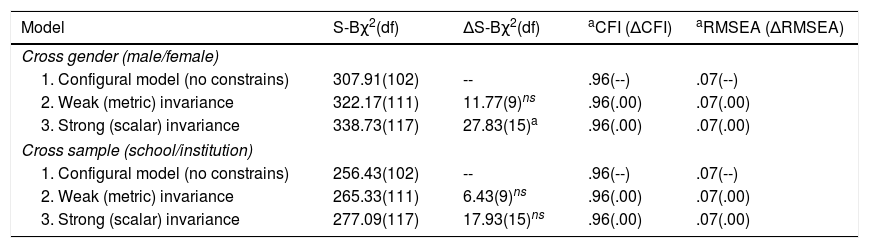
The next step was to test for measurement invariance across gender (males versus females from the school sample) and sample type (school sample males versus institution sample males) using the 3-factor model. The configural model (i.e., no constrains included) served as the baseline model to which we compared stricter models against. That is, the fit indices of the baseline model were compared with a model where factor loadings are equally constrained across groups (i.e., weak or metric invariance) and with a model where factor loadings and covariances are equally constrained across groups (i.e., strong or scalar invariance) which are shown in Table 3. Regarding cross-gender invariance, results showed that the ΔS-Bχ2(df) values were significant in terms of strong invariance, but if we consider Cheung and Rensvold's (2002) criteria (i.e., ΔCFI not exceeding .01, ΔRMSEA less than .015) and standard criteria regarding CFI and RMSEA (i.e., CFI above .90, RMSEA below .08) there is support for measurement invariance across gender. Regarding sample type invariance results, the ΔS-Bχ2(df) values were always non-significant and also supported measurement invariance.
Tests for invariance of the SAS-A-SF goodness of fit statistics.
| Model | S-Bχ2(df) | ΔS-Bχ2(df) | aCFI (ΔCFI) | aRMSEA (ΔRMSEA) |
|---|---|---|---|---|
| Cross gender (male/female) | ||||
| 1. Configural model (no constrains) | 307.91(102) | -- | .96(--) | .07(--) |
| 2. Weak (metric) invariance | 322.17(111) | 11.77(9)ns | .96(.00) | .07(.00) |
| 3. Strong (scalar) invariance | 338.73(117) | 27.83(15)a | .96(.00) | .07(.00) |
| Cross sample (school/institution) | ||||
| 1. Configural model (no constrains) | 256.43(102) | -- | .96(--) | .07(--) |
| 2. Weak (metric) invariance | 265.33(111) | 6.43(9)ns | .96(.00) | .07(.00) |
| 3. Strong (scalar) invariance | 277.09(117) | 17.93(15)ns | .96(.00) | .07(.00) |
Note. S-Bχ2(df)=Satorra-Bentler chi-square (degrees of freedom); *CFI=robust Comparative Fit Index; *RMSEA=robust Root Mean Square Error of Approximation; C.I.=confidence interval.
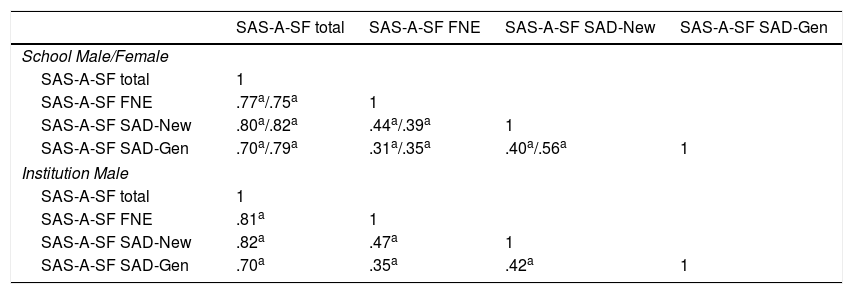
Table 4 presents the Pearson correlations between the SAS-A-SF total and its three dimensions among the male school sample, the female school sample, and male institutionalized sample. As expected, mostly moderate to strong positive correlations emerged between the SAS-A-SF total score and its dimensions.
Correlation matrixes between SAS-A-SF total and its dimensions.
| SAS-A-SF total | SAS-A-SF FNE | SAS-A-SF SAD-New | SAS-A-SF SAD-Gen | |
|---|---|---|---|---|
| School Male/Female | ||||
| SAS-A-SF total | 1 | |||
| SAS-A-SF FNE | .77a/.75a | 1 | ||
| SAS-A-SF SAD-New | .80a/.82a | .44a/.39a | 1 | |
| SAS-A-SF SAD-Gen | .70a/.79a | .31a/.35a | .40a/.56a | 1 |
| Institution Male | ||||
| SAS-A-SF total | 1 | |||
| SAS-A-SF FNE | .81a | 1 | ||
| SAS-A-SF SAD-New | .82a | .47a | 1 | |
| SAS-A-SF SAD-Gen | .70a | .35a | .42a | 1 |
Note. FNE=Fear of Negative Evaluation; SAD-New=Social Avoidance and Distress–New; SAD-Gen=Social Avoidance and Distress–General.
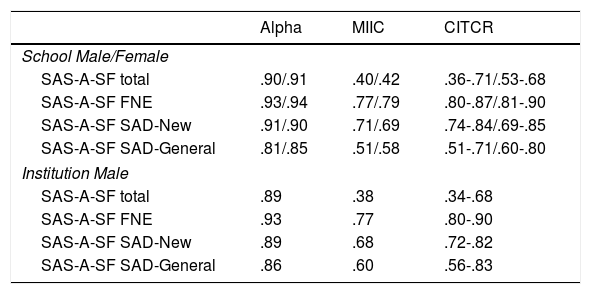
Table 5 displays the alphas, the mean inter-item correlations, and the corrected item-total correlation range for the SAS-A-SF and its dimensions among the different samples. The results were mostly good, but the mean inter-item correlation of the dimensions of the SAS-A-SF were all above the recommended value of .50 (Clark & Watson, 1995).
Internal consistency of the SAS-A-SF.
| Alpha | MIIC | CITCR | |
|---|---|---|---|
| School Male/Female | |||
| SAS-A-SF total | .90/.91 | .40/.42 | .36-.71/.53-.68 |
| SAS-A-SF FNE | .93/.94 | .77/.79 | .80-.87/.81-.90 |
| SAS-A-SF SAD-New | .91/.90 | .71/.69 | .74-.84/.69-.85 |
| SAS-A-SF SAD-General | .81/.85 | .51/.58 | .51-.71/.60-.80 |
| Institution Male | |||
| SAS-A-SF total | .89 | .38 | .34-.68 |
| SAS-A-SF FNE | .93 | .77 | .80-.90 |
| SAS-A-SF SAD-New | .89 | .68 | .72-.82 |
| SAS-A-SF SAD-General | .86 | .60 | .56-.83 |
Note. FNE=Fear of Negative Evaluation; SAD-New=Social Avoidance and Distress–New; SAD-General=Social Avoidance and Distress–General; Alpha=Cronbach's alpha; MIIC=mean inter-item correlation; CITCR=corrected item-total correlation range.
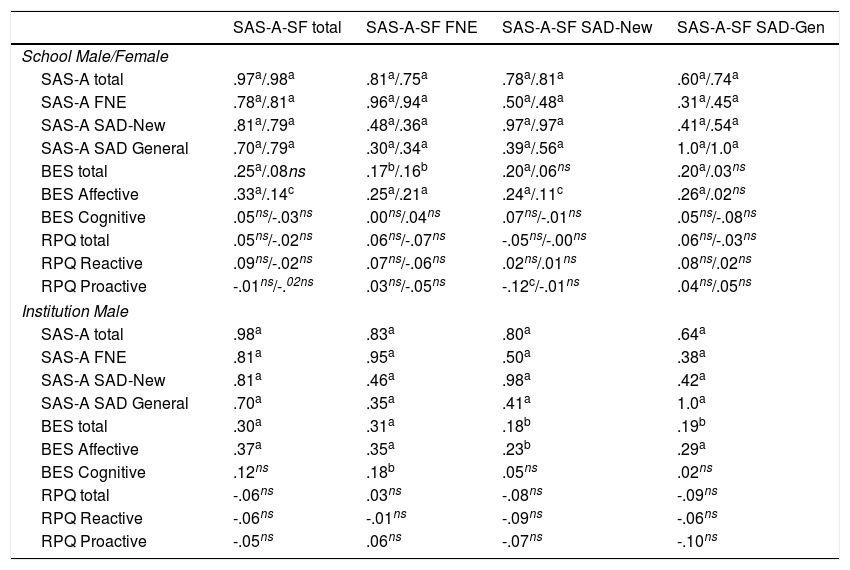
The associations of the SAS-A-SF with the original SAS-A showed moderate to strong positive statistically significant correlations as expected. The associations with the BES total and the BES Affective dimension showed mostly low to moderate positive statistically significant correlations, but it is interesting to point out that the BES Cognitive dimension failed to reach statistical significance. The discriminant validity with the RPQ revealed mostly the expected low or negative correlations (see Table 6).
Correlations of the SAS-A-SF and its dimensions with the SAS-A, BES and RPQ.
| SAS-A-SF total | SAS-A-SF FNE | SAS-A-SF SAD-New | SAS-A-SF SAD-Gen | |
|---|---|---|---|---|
| School Male/Female | ||||
| SAS-A total | .97a/.98a | .81a/.75a | .78a/.81a | .60a/.74a |
| SAS-A FNE | .78a/.81a | .96a/.94a | .50a/.48a | .31a/.45a |
| SAS-A SAD-New | .81a/.79a | .48a/.36a | .97a/.97a | .41a/.54a |
| SAS-A SAD General | .70a/.79a | .30a/.34a | .39a/.56a | 1.0a/1.0a |
| BES total | .25a/.08ns | .17b/.16b | .20a/.06ns | .20a/.03ns |
| BES Affective | .33a/.14c | .25a/.21a | .24a/.11c | .26a/.02ns |
| BES Cognitive | .05ns/-.03ns | .00ns/.04ns | .07ns/-.01ns | .05ns/-.08ns |
| RPQ total | .05ns/-.02ns | .06ns/-.07ns | -.05ns/-.00ns | .06ns/-.03ns |
| RPQ Reactive | .09ns/-.02ns | .07ns/-.06ns | .02ns/.01ns | .08ns/.02ns |
| RPQ Proactive | -.01ns/-.02ns | .03ns/-.05ns | -.12c/-.01ns | .04ns/.05ns |
| Institution Male | ||||
| SAS-A total | .98a | .83a | .80a | .64a |
| SAS-A FNE | .81a | .95a | .50a | .38a |
| SAS-A SAD-New | .81a | .46a | .98a | .42a |
| SAS-A SAD General | .70a | .35a | .41a | 1.0a |
| BES total | .30a | .31a | .18b | .19b |
| BES Affective | .37a | .35a | .23b | .29a |
| BES Cognitive | .12ns | .18b | .05ns | .02ns |
| RPQ total | -.06ns | .03ns | -.08ns | -.09ns |
| RPQ Reactive | -.06ns | -.01ns | -.09ns | -.06ns |
| RPQ Proactive | -.05ns | .06ns | -.07ns | -.10ns |
Note. SAS-A=Social Anxiety Scale for Adolescents; SAS-A-SF=Short Form; BES=Basic Empathy Scale; RPQ=Reactive-Proactive Aggression Questionnaire.
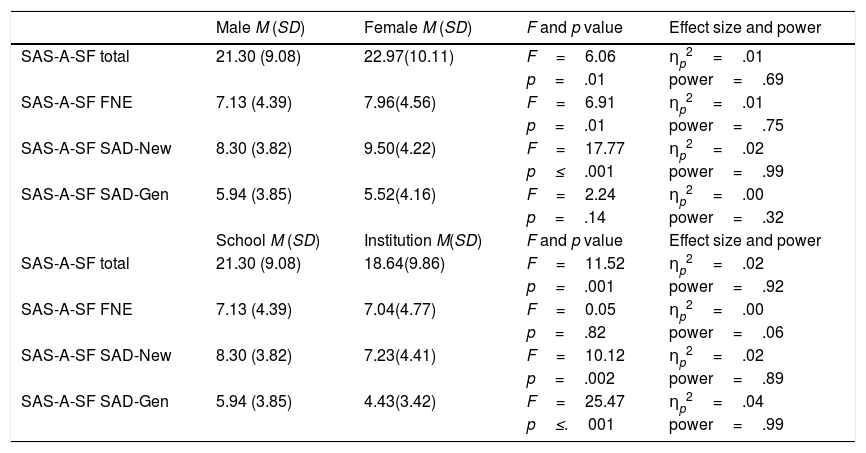
Comparisons of the male and female participants from the school sample revealed that female youths scored significantly higher on the SAS-A-SF, and most of its dimensions, while comparisons of the male participants from the school sample with the male participants from the institution sample revealed that school youths scored significantly higher on the SAS-A-SF, and most of its dimensions (see Table 7).
Descriptive statistics and ANOVAs for the SAS-A-SF total and its dimensions.
| Male M (SD) | Female M (SD) | F and p value | Effect size and power | |
|---|---|---|---|---|
| SAS-A-SF total | 21.30 (9.08) | 22.97(10.11) | F=6.06 | ηp2=.01 |
| p=.01 | power=.69 | |||
| SAS-A-SF FNE | 7.13 (4.39) | 7.96(4.56) | F=6.91 | ηp2=.01 |
| p=.01 | power=.75 | |||
| SAS-A-SF SAD-New | 8.30 (3.82) | 9.50(4.22) | F=17.77 | ηp2=.02 |
| p≤.001 | power=.99 | |||
| SAS-A-SF SAD-Gen | 5.94 (3.85) | 5.52(4.16) | F=2.24 | ηp2=.00 |
| p=.14 | power=.32 | |||
| School M (SD) | Institution M(SD) | F and p value | Effect size and power | |
| SAS-A-SF total | 21.30 (9.08) | 18.64(9.86) | F=11.52 | ηp2=.02 |
| p=.001 | power=.92 | |||
| SAS-A-SF FNE | 7.13 (4.39) | 7.04(4.77) | F=0.05 | ηp2=.00 |
| p=.82 | power=.06 | |||
| SAS-A-SF SAD-New | 8.30 (3.82) | 7.23(4.41) | F=10.12 | ηp2=.02 |
| p=.002 | power=.89 | |||
| SAS-A-SF SAD-Gen | 5.94 (3.85) | 4.43(3.42) | F=25.47 | ηp2=.04 |
| p≤.001 | power=.99 |
The aim of the present study was to validate a Portuguese Language short form of the SAS-A (La Greca & López, 1998) in a sample of Portuguese youths. Overall, our findings did support the validity and reliability of the SAS-A-SF, suggesting its appropriateness for use in the Portuguese context.
Regarding the SAS-A-SF structure, we found that the three factor model (Fear of Negative Evaluation, Social Avoidance and Distress-New, and Social Avoidance and Distress-General dimensions) was the best fitting for our data, replicating the factorial structure of both the original instrument (La Greca & López, 1998; La Greca et al., 2015) and its Portuguese adaptation (Pechorro et al., 2016). Similarly to Nelemans et al. (2017) study, we found supporting evidence for the measurement invariance of the SAS-A-SF across gender. The findings from that study also supported the instruments’ cross-sample invariance using different community samples of adolescents. In our study, we tested the invariance of the instrument further by including a sample of youth male offenders and the cross-invariance results held, thus confirming the appropriateness of using the SAS-A-SF with clinical and community adolescent populations.
The internal validity of the SAS-A-SF was also good (Nelemans et al., 2017), with moderate to strong positive correlations between the total score and its subscales and mean inter-item correlations of the dimensions above the recommended value (Clark & Watson, 1995).
Concerning convergent validity, the SAS-A-SF subscales were, as expected, significantly related to the original SAS-A, which indicates that this short form may be a useful tool to measure SA in situations where time constraints require using more efficient instruments. Moreover, the SAS-A-SF was overall significantly associated with the BES, showing low to moderate correlations with the total score and the affective dimension (Pechorro et al., 2016; Tibi-Elhanany & Shamay-Tsoory, 2011). However, the cognitive dimension was not significantly associated with the SAS-A-SF. Because socially anxious youths tend to spend more time wondering about what other people think and feel about them, it is possible that heightened levels of SA predispose adolescents to be more aware and sensitive towards other people's feelings, but do not affect the cognitive component of empathy. Nonetheless, the link between empathy and SA should be further elucidated in future research. The SAS-A-SF had low or negative correlations with the RPQ, which supports its discriminant validity and is consistent with previous research showing null or low negative correlations of SA with different forms of aggression (Batanova & Loukas, 2011).
Lastly, our fifth hypothesis was confirmed, as girls reported significantly more SA than boys. As in other studies, girls report higher scores than boys on the SAS-A-SF total, SAS-A-SF FNE, and SAS-A-SF SAD-New, but no gender differences on the SAD-Gen subscale (La Greca & López, 1998; Olivares et al., 2005; Pechorro et al., 2017; Storch et al., 2004). These gender differences have been extensively reported in the literature (Merikangas et al., 2010) and are consistent with the observed phenomenon of females being more vulnerable to affective disorders than males (e.g., Seney & Sibille, 2014).
An interesting finding was that the detainees sample had overall lower SA scores than the school sample. This is in accordance with other research showing that adolescents’ SA is negatively associated to the display of aggressive and delinquent behaviours (DeWall et al., 2010). It is also consistent with the notion that psychopathy and antisocial behaviors are often characterized by the absence of fear and anxiety (Frick & Ellis, 1999). Whether empathy is one of the underlying mechanisms behind this association could be addressed in future research.
This study had some limitations. First, due to its cross-sectional nature, the test-retest reliability properties of the SAS-A-SF could not be evaluated. Second, due to the inexistence of adequately validated SA measures for Portuguese youths, it was not possible to analyze the SAS-A convergent validity recurring to instruments that measured the same construct. Third, the constructs were measured with a self-report method, and only one informant was used. This could potentially result in inflated correlations. Future research should use multiple methods and informants to overcome this limitation.
In sum, our findings suggest that the Portuguese version of the SAS-A-SF has satisfactory psychometric properties, namely a factorial structure consistent with the underpinning substantive theory, cross-gender and cross-sample invariance, good internal consistency, and good convergent and discriminant validity. Hence, our study found evidence for the psychometric validity and reliability of the Portuguese Language short form of the SAS-A, supporting its use in Portuguese youths.
FundingThis work was supported by the Portuguese Foundation for Science and Technology (FCT; Grant SFRH/BPD/86666/2012) with co-financing of the European Social Fund (POPH/FSE), the Portuguese Ministry of Education and Science (MEC), and FEDER (PT2020 Partnership Agreement; UID/PSI/01662/2013).
