


Background/Objective: Self-reported health depends on the internal frame of reference and on response styles. One way of studying this dependency is using anchoring vignettes. Response shift effects are assumed to induce a negative correlation between self-reported health and the health assessments attributed to the vignettes. Method: A representative sample of the German adult population (N=2,409) was selected. Participants were asked to rate their health state and the health states of two rather complex vignettes representing patients with several health complaints on a 0-100 scale. Results: The mean score of self-assessed health was M=76.20 (SD=20.6). There was a very small positive correlation between the assessment of the vignettes and the self-assessed health state (r=.12). After controlling for a proxy of objective health, measured in terms of chronic conditions, the relationship remained slightly positive. Chronic conditions were only marginally associated with the assessments of the vignettes (0 conditions: M=44.8; ≥ 2 conditions: M=42.2). Conclusions: The lack of the postulated association between self-reported health and vignettes’ ratings means that we cannot derive tools to correct the subjective ratings for differential use of frames of reference.
Antecedentes/Objetivo: El autoinforme acerca de la salud depende del marco de referencia interno y de los estilos de respuesta. Una manera de estudiar esta dependencia es usando viñetas de anclaje. Método: Se seleccionó una muestra representativa de la población alemana (N=2.409). Se pidió a los participantes que evaluasen (en una escala de 0 a 100) su propia salud y la de los estados de salud de dos viñetas relativamente complejas, las cuales representaban pacientes con distintos problemas de salud. Resultados: La puntuación promedio en evaluación autoinformada fue de M=76,20 (DT=20,60). Se encontró una pequeña correlación positiva entre la evaluación de la salud propia y la evaluación de las viñetas (r=0,12). Después de controlar por un proxy de salud objetiva, medido en términos de condiciones crónicas, la relación continuó siendo ligeramente positiva. Las condiciones crónicas solo se relacionaron marginalmente con la evaluación de las viñetas (0 condiciones: M=44,80; ≥2 condiciones: M=42,20). Conclusiones: La ausencia de la relación propuesta entre el autoinforme de la salud propia y la evaluación de las viñetas significa que no podemos derivar herramientas para la corrección de las puntuaciones subjetivas del uso diferencial de marcos de referencia.
Health-related quality of life has become an important outcome criterion in medical research over the last decades. However, self-assessments of health are subjective in nature. They are related to internal frames of reference and they depend on response styles. If it was possible to quantify differences in the use of frames of reference, these scores could be used to correct subjective health ratings in order to get a better approximation of objective health. One approach to examine effects of differential use of frames of reference (response heterogeneity) is the use of anchoring vignettes. Vignettes are short descriptions of persons (cases). The task of the respondents is to evaluate these vignettes with regard to a certain criterion, e. g., health (Grol-Prokopczyk, Freese, & Hauser, 2011; Salomon, Tandon, & Murray, 2004) or job satisfaction (Kristensen & Johansson, 2008). Vignettes can also be applied to study decision-making processes, including clinical judgments of health professionals (Evans et al., 2015).
Several vignette studies demonstrated that different groups of people judge health related variables in different ways, depending on their own position of the continuum: physical capacity (Salomon et al., 2004), sadness and depression (Guindon & Boyle, 2012), alcohol consumption (van Soest, Delaney, Harmon, Kapteyn, & Smith, 2011), or symptoms of urinary, bowel and erectile dysfunction that are typical for prostate cancer patients (Korfage, de Koning, & Essink-Bot, 2007). These examples show that people can evaluate vignettes differently, depending on their own value of the variable being assessed. One possible explanation of this effect is response shift (Sprangers & Schwartz, 1999). The central component of response shift is recalibration, the adaptation of the frame of reference to changed circumstances. Clinicians are faced with processes of successful and failing adaptation in their daily practice. Several techniques have been developed to assess response shift (Barclay-Goddard, Epstein & Mayo, 2009; Dabakuyo et al., 2013; Sprangers & Schwartz, 1999). The vignettes approach, however, has gained only little use in quality of life research (Korfage et al., 2007). According to the response shift concept, a deterioration of health will result in the tendency to evaluate health states in a more positive way compared with the way of evaluating before the deterioration. Therefore, response shift phenomena should result in a negative correlation between health and the assessments of vignettes. Subjectively rated health can be considered a proxy of objective health; therefore, we expect a negative correlation between self-rated health and the vignettes’ assessments. If this theoretically postulated effect could be empirically proven and quantitatively evaluated, the responses to the vignettes could be utilized to correct the self-rated health assessments for this different use of the underlying scales and to derive better estimations of objective health.
However, another kind of association between self-rated health and assessments of vignettes is possible as well. There are individual differences in the tendency to give positive or optimistic vs. negative or pessimistic judgments. “Health-optimistic” people (Grol-Prokopczyk et al., 2011) tend to use positive ratings (excellent, very good) more often than “health-pessimistic” people. Under the assumption of “response consistency” (equal frame of reference for self-ratings and assessments of other people) this dispositional factor yields to a positive correlation between self-ratings and the health assessments of the subjects attributed to the vignettes.
When the objective health state is taken into consideration in the evaluation of the relationship between health self report and vignettes ratings, a deeper insight in the relationship is possible. This can be done in several ways. First, the positional effect (response shift) should result in a negative association between objective health and assessments of the vignettes. Second, the dispositional effect or judgment effect (health optimism) should result in a positive association between self-assessed health and the vignettes assessments after statistically controlling for objective health. A study with 2,625 participants from the general population found such a positive association between self-reported health and vignettes ratings after controlling for objective health indicators (Grol-Prokopczyk et al., 2011). In that study, women were more “health-optimistic” than men, e. g., women evaluated the health state of the vignettes as better than men did. In our study, we also test such gender differences and the regression of self-rated health on vignettes ratings, controlling for a proxy of objective health.
A further study using anchoring vignettes with a similar aim was performed in ten European countries (Angelini, Cavapozzi, Corazzini, & Paccagnella, 2014). The greatest differences in mean life satisfaction were found between Denmark (highest satisfaction) and Italy (lowest satisfaction), but after controlling for the judgments of persons described in two vignettes, the picture was changed, with the Netherlands as the most satisfied country and the Czech Republic with the lowest satisfaction mean scores. More importantly for the purpose of our study, the correlations between the own health assessment and the assessments of the two vignettes were positive (.09 and .11) in that study (Angelini et al., 2014), and restricting the analysis to people whose life situation was similar to that described in the vignettes (rather bad circumstances), the correlations increased markedly. In our study, we also test whether the restriction to a subsample of respondents who are in a similar health situation as the vignettes will also result in an increased correlation.
In the research on vignettes, most vignette descriptions are short, restricted to one aspect of health or quality of life (e.g., physical functioning). The shortness of the vignettes has the advantage that multiple vignettes with graded problems can be designed and presented to the respondents, but the interpretation of differences between the assessments are restricted to the domain that underlies the case description and cannot be generalized to global health assessment. In the present study, we intended to adopt two vignettes that give a more complex view of the patient, including several aspects of health.
The main aim of this paper was to test the relationship between health self-assessments and the assessments of the health states of persons represented in rather complex vignettes. We test age and gender effects on the assessments of the own health state and the assessments of the vignettes’ health, we intend to decide whether one of the two possible effects (positional or dispositional) was predominant, using correlations between self-rated health and assessments of the vignettes, and we test the relationship between own health and the vignettes assessment controlling for a proxy of objective health.
MethodParticipantsIn May and June 2013, a representative sample of the German general population was examined with the assistance of a demographic consulting company (USUMA, Berlin, Germany). The entire country was separated into 258 sample areas. Once a sample area was selected, street, house, and household, were chosen randomly. The target person in the household was also selected randomly, using the Kish technique. Inclusion criteria were age ≥14 years and being fluent in German.
A first attempt to contact study candidates was made at 4,360 addresses. A total of 2,508 people between 14 and 97 years of age agreed to participate and completed the self-rating questionnaires (participation rate: 58% of valid addresses). The subjects were visited by a study assistant, gave written informed consent, and filled in several questionnaires. Subjects younger than 18 years or with one or more missing items in the health assessments were excluded from the analysis (N=99). Thus, the final sample consisted of 2,409 subjects. The study was approved by the Ethics Committee of the University of Leipzig.
InstrumentsThe respondents were asked to assess their present health on a 0-100 scale. The anchors were labeled as worst possible health (0) and best imaginable health (100), according to the Visual Analogues Scale of the quality of life questionnaire EQ-5D (Brooks, 1996; Craig, Pickard & Lubetkin, 2014). Two vignettes of patients were designed and described as follows:
- -
Patient A is handicapped in his mobility by a disease. He has problems using stairs, cannot perform his daily tasks (e.g., shopping) and occasionally has to use a wheel chair. He has hip and knee pain but considers it tolerable. Mentally he feels well. He is not anxious or depressed and does not see a reason to complain about his health.
- -
Patient B has chronic back pain and physicians have been unable to figure out why. Although Patient B can move and fulfil his daily activities without help, he feels alienated by his pain, he mistrusts the physicians, and he perceives his future health situation as hopeless.
Study participants were asked to assess the health states of the people described in these two vignettes on a scale of 0-100.
The participants also filled in a questionnaire concerning chronic conditions. We used the German version (Streibelt, Schmidt, Brunger, & Spyra, 2012) of the Self-administered Comorbidity Questionnaire SCQ (Sangha, Stucki, Liang, Fossel, & Katz, 2003). With this instrument the presence of 13 chronic diseases is identified (yes/no). In the analysis we counted the number of these chronic diseases as a rough proxy for the objective health state. Bodily complaints were assessed with the 8-item short form of the Giessen complaints list GBB (Schumacher & Brähler, 1999). This questionnaire summarizes complaints from four domains: exhaustion, gastrointestinal complaints, musculoskeletal complaints, and cardiovascular complaints. Anxiety and depression were screened with the 4-item instrument Patient Health Questionnaire PHQ-4 (Kocalevent, Finck, Jimenez-Leal, Sautier, & Hinz, 2014; Lowe et al., 2010), with two anxiety items and two depression items. In the analyses we only used the total scores of the GBB and the PHQ-4.
Statistical analysesThe assessments of patients A and B were combined to a mean assessment AB for several analyses. ANOVAs were calculated to test the effects of age group and gender on health assessments and to test the influence of chronic diseases on the health variables. Pearson correlations were used to describe the association between the health judgments. To estimate the association between own health assessment and the assessment of the vignettes, controlling for the objective health state, the regression of the own health state on the assessments of the vignettes was compared with the regression on the combination of vignettes assessments and objective health, measured in terms of the number of chronic conditions according to the SCQ (Grol-Prokopczyk et al., 2011). In addition (Angelini et al., 2014), we restricted the correlational analysis between own health and vignettes assessments to subsamples of participants with chronic diseases which resembled the health situation described in the vignettes.
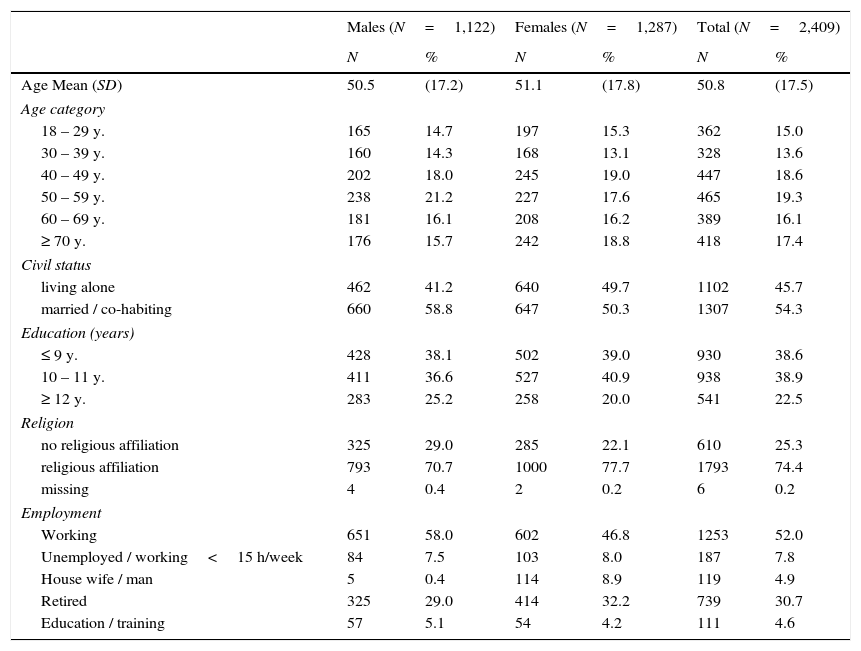
ResultsTable 1 presents characteristics of the study participants. The sample was fairly representative of the general German population in terms of age and gender. The corresponding percentages for the age groups (18-29 y., 30-39 y., 40-49 y., 50-59 y., 60-69 y. and ≥70 y.), taken from the census (Destatis, 2015), are as follows: males: 18.1%, 15.2%, 21.4%, 17.3%, 13.5%, and 14.6%, and females: 16.4%, 14.0%, 19.4%, 16.3%, 13.4%, and 20.4%, respectively.
Sociodemographic characteristics of the sample.
| Males (N=1,122) | Females (N=1,287) | Total (N=2,409) | ||||
|---|---|---|---|---|---|---|
| N | % | N | % | N | % | |
| Age Mean (SD) | 50.5 | (17.2) | 51.1 | (17.8) | 50.8 | (17.5) |
| Age category | ||||||
| 18 – 29 y. | 165 | 14.7 | 197 | 15.3 | 362 | 15.0 |
| 30 – 39 y. | 160 | 14.3 | 168 | 13.1 | 328 | 13.6 |
| 40 – 49 y. | 202 | 18.0 | 245 | 19.0 | 447 | 18.6 |
| 50 – 59 y. | 238 | 21.2 | 227 | 17.6 | 465 | 19.3 |
| 60 – 69 y. | 181 | 16.1 | 208 | 16.2 | 389 | 16.1 |
| ≥ 70 y. | 176 | 15.7 | 242 | 18.8 | 418 | 17.4 |
| Civil status | ||||||
| living alone | 462 | 41.2 | 640 | 49.7 | 1102 | 45.7 |
| married / co-habiting | 660 | 58.8 | 647 | 50.3 | 1307 | 54.3 |
| Education (years) | ||||||
| ≤ 9 y. | 428 | 38.1 | 502 | 39.0 | 930 | 38.6 |
| 10 – 11 y. | 411 | 36.6 | 527 | 40.9 | 938 | 38.9 |
| ≥ 12 y. | 283 | 25.2 | 258 | 20.0 | 541 | 22.5 |
| Religion | ||||||
| no religious affiliation | 325 | 29.0 | 285 | 22.1 | 610 | 25.3 |
| religious affiliation | 793 | 70.7 | 1000 | 77.7 | 1793 | 74.4 |
| missing | 4 | 0.4 | 2 | 0.2 | 6 | 0.2 |
| Employment | ||||||
| Working | 651 | 58.0 | 602 | 46.8 | 1253 | 52.0 |
| Unemployed / working<15 h/week | 84 | 7.5 | 103 | 8.0 | 187 | 7.8 |
| House wife / man | 5 | 0.4 | 114 | 8.9 | 119 | 4.9 |
| Retired | 325 | 29.0 | 414 | 32.2 | 739 | 30.7 |
| Education / training | 57 | 5.1 | 54 | 4.2 | 111 | 4.6 |
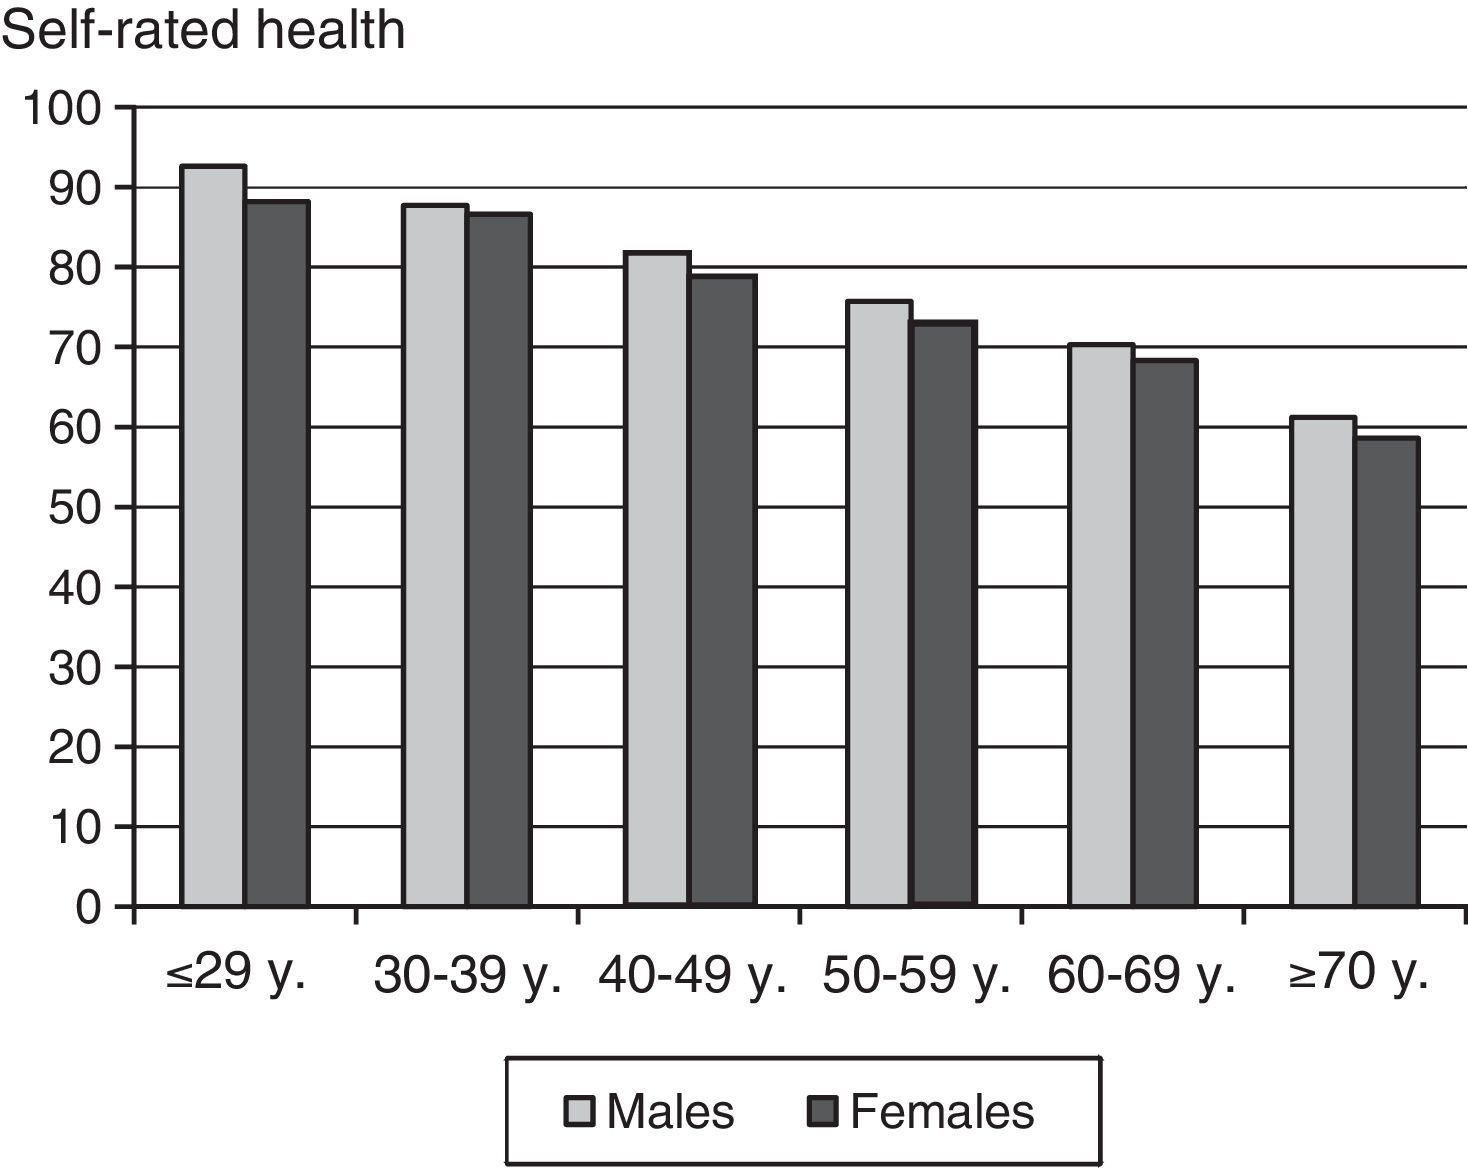
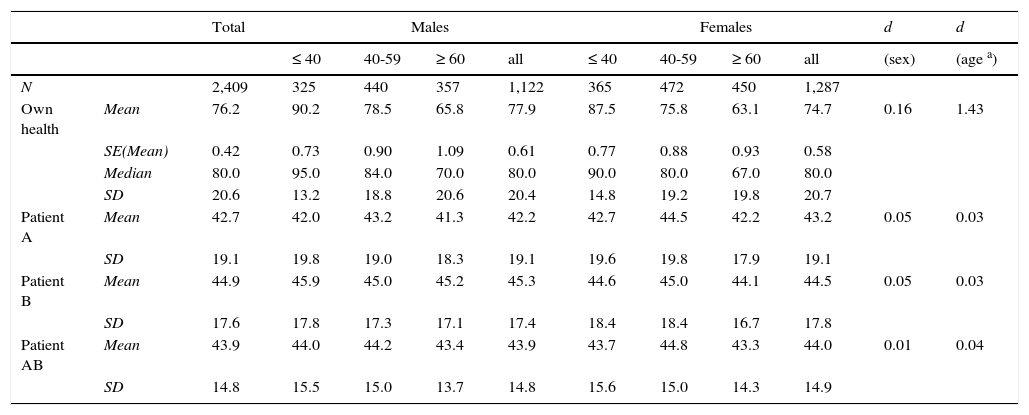
Figure 1 and Table 2 present mean scores of males and females, stratified in age groups. The age categories in Table 2 were condensed in order to get higher sample sizes for each category. The present health states decreased with age, and males reported better health states than females. The two-way ANOVA results were as follows: age (F=334.3, p<.001), gender (F=13.1, p<.001), age x gender (F=0, p=.998). The regression of present health on age and gender yielded the following equation:

Mean scores of health assessments by age group and gender.
| Total | Males | Females | d | d | ||||||||
|---|---|---|---|---|---|---|---|---|---|---|---|---|
| ≤ 40 | 40-59 | ≥ 60 | all | ≤ 40 | 40-59 | ≥ 60 | all | (sex) | (age a) | |||
| N | 2,409 | 325 | 440 | 357 | 1,122 | 365 | 472 | 450 | 1,287 | |||
| Own health | Mean | 76.2 | 90.2 | 78.5 | 65.8 | 77.9 | 87.5 | 75.8 | 63.1 | 74.7 | 0.16 | 1.43 |
| SE(Mean) | 0.42 | 0.73 | 0.90 | 1.09 | 0.61 | 0.77 | 0.88 | 0.93 | 0.58 | |||
| Median | 80.0 | 95.0 | 84.0 | 70.0 | 80.0 | 90.0 | 80.0 | 67.0 | 80.0 | |||
| SD | 20.6 | 13.2 | 18.8 | 20.6 | 20.4 | 14.8 | 19.2 | 19.8 | 20.7 | |||
| Patient A | Mean | 42.7 | 42.0 | 43.2 | 41.3 | 42.2 | 42.7 | 44.5 | 42.2 | 43.2 | 0.05 | 0.03 |
| SD | 19.1 | 19.8 | 19.0 | 18.3 | 19.1 | 19.6 | 19.8 | 17.9 | 19.1 | |||
| Patient B | Mean | 44.9 | 45.9 | 45.0 | 45.2 | 45.3 | 44.6 | 45.0 | 44.1 | 44.5 | 0.05 | 0.03 |
| SD | 17.6 | 17.8 | 17.3 | 17.1 | 17.4 | 18.4 | 18.4 | 16.7 | 17.8 | |||
| Patient AB | Mean | 43.9 | 44.0 | 44.2 | 43.4 | 43.9 | 43.7 | 44.8 | 43.3 | 44.0 | 0.01 | 0.04 |
| SD | 14.8 | 15.5 | 15.0 | 13.7 | 14.8 | 15.6 | 15.0 | 14.3 | 14.9 | |||
Note. d: Effect size; a: Comparison between youngest and oldest age group; SE(Mean): Standard error of mean.
Present health=105 – .593 * age + 2.8 * gender.
Gender has to be coded with 0 for females and 1 for males. The multiple R of this analysis was .51. For example, a 55-years old man has an expected present health score of 105.0 – 32.6 + 2.8=75.2. All main effects and interaction effects of age and gender for the health assessments of the vignettes (Table 2) were not statistically significant (p > .05 in all cases).
Correlations between the variablesThe correlations between the own health state and the assessments of the vignettes were as follows: r=.11 (patient A); r=.07 (patient B), and r=.12 (averaged patient AB). Though being small in magnitude, all these correlations were statistically significant with p<.01. The correlation between the assessments of the two vignettes was r (patient A, patient B)=.31 (p<.001).
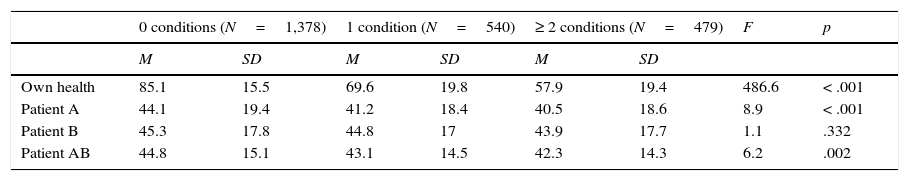
Chronic diseases and health assessmentsWe calculated the number of chronic conditions assessed with the SCQ for each participant. Most participants reported no condition (58%), 22% reported one of the conditions, and 20% reported two or more chronic conditions. In three cases, the number of chronic conditions was missing. ANOVAs proved highly significant relationships between chronic conditions and self-assessed health status (Table 3). The vignettes failed to evoke clear judgment differences for the three groups. One of the vignettes (A) was assessed as having a better health status by the subjects without chronic conditions (M=44.1) compared to the other groups (M=41.2 and M=40), whereas there was no significant difference in the assessment of the other vignette B. The combined analysis (patient AB) also reached the significance criterion, but the differences between the disease groups were very low in magnitude, with mean values between 42.3 and 44.8.
Health assessments and chronic conditions.
| 0 conditions (N=1,378) | 1 condition (N=540) | ≥ 2 conditions (N=479) | F | p | ||||
|---|---|---|---|---|---|---|---|---|
| M | SD | M | SD | M | SD | |||
| Own health | 85.1 | 15.5 | 69.6 | 19.8 | 57.9 | 19.4 | 486.6 | < .001 |
| Patient A | 44.1 | 19.4 | 41.2 | 18.4 | 40.5 | 18.6 | 8.9 | < .001 |
| Patient B | 45.3 | 17.8 | 44.8 | 17 | 43.9 | 17.7 | 1.1 | .332 |
| Patient AB | 44.8 | 15.1 | 43.1 | 14.5 | 42.3 | 14.3 | 6.2 | .002 |
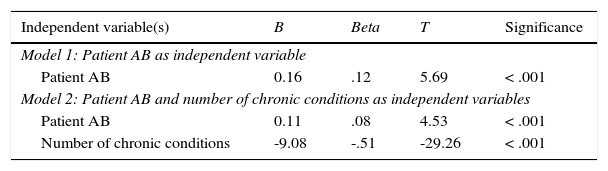
The results of the two regression analyses in which self-rated health was regressed on the judgments to vignette AB (model 1) or both vignette AB and the number of chronic conditions (model 2) are given in Table 4. The beta coefficient of model 1 (beta=.12) corresponds to the correlation between own health and the assessment to vignette AB (r=.12) reported above. When the number of chronic conditions are included (model 2), the beta coefficient (beta=.08) becomes smaller, but still remains positive and statistically significant.
Results of the regression analyses. Dependent variable: Self-reported health; independent variable(s): health assessment of patient AB (model 1) and health assessment of patient AB and number of chronic conditions (SCQ) (model 2).
| Independent variable(s) | B | Beta | T | Significance |
|---|---|---|---|---|
| Model 1: Patient AB as independent variable | ||||
| Patient AB | 0.16 | .12 | 5.69 | < .001 |
| Model 2: Patient AB and number of chronic conditions as independent variables | ||||
| Patient AB | 0.11 | .08 | 4.53 | < .001 |
| Number of chronic conditions | -9.08 | -.51 | -29.26 | < .001 |
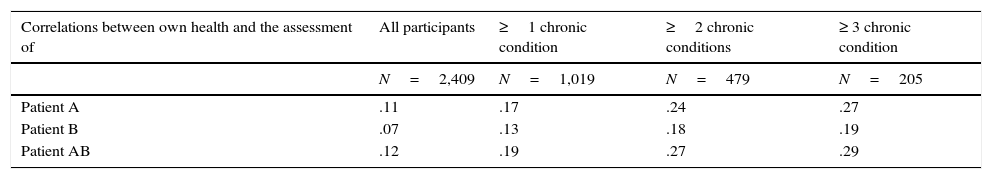
Table 5 reports correlation coefficients between own health and assessments of patient AB for several subsamples, depending on the number of chronic conditions. Since the vignettes represent rather bad health states, the health states of participants suffering from chronic conditions are more similar to that of the vignettes, and in this way we test whether the similarity between the respondents and the vignettes concerning health has an effect on the relationship between the putative shift effect (negative correlation) and the putative judgment effect (positive correlation). The more chronic conditions the participants have, the higher the correlation, reaching a coefficient of r=.29 for the subgroup of participants reporting at least three of the chronic conditions (Table 5). The increase in the correlation is similar for both vignettes A and B.
Correlations between own health and vignettes assessments, restricted to subsamples of participants according to the number of chronic conditions.
| Correlations between own health and the assessment of | All participants | ≥1 chronic condition | ≥2 chronic conditions | ≥ 3 chronic condition |
|---|---|---|---|---|
| N=2,409 | N=1,019 | N=479 | N=205 | |
| Patient A | .11 | .17 | .24 | .27 |
| Patient B | .07 | .13 | .18 | .19 |
| Patient AB | .12 | .19 | .27 | .29 |
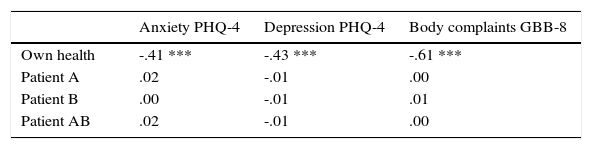
Health assessment was associated with body complaints (r=-.61), and, to a lower degree, with anxiety and depression (Table 6). However, there was no correlation between the assessments of the vignettes and the three variables anxiety, depression, and body complaints.
DiscussionThe first aim of the study was to test whether there are positive or negative correlations between respondents’ self-assessed health and their assessments of vignettes’ health. There were small positive correlations, with a coefficient of r=.12 between self-assessed health and assessment of the combined vignettes. Though the coefficient is statistically significant, the explained variance (1.44%) is small. The first conclusion of this positive correlation is that the positional (response shift) effect is not stronger than the judgment effect. However, conclusions about the extent of both effects are not possible.
According to the hypothesized positional (shift) effect, we expected that people suffering from chronic diseases (compared to healthy people) would evaluate the vignettes as being healthier. This hypothesis was not supported; the differences in Table 3 were small in magnitude. The comparison between the two regression models also provides only weak evidence for the positional (shift) effect: The inclusion of the number of chronic diseases in the model resulted in a very small change of the beta coefficient from .12 to .08. The latter (positive) coefficient cannot be directly compared with that reported by Grol-Prokopczyk et al. (2011) because that paper was based on ordered Probit regressions, but in that study the coefficient was also positive.
When the analyses were restricted to a subsample of subjects being in a rather bad health situation in terms of chronic diseases (and, therefore, similar to the persons described in the vignettes), the associations between own health and vignettes assessments increased, from r=.12 to r=.29. Such an effect was also observed in the study examining life satisfaction (Angelini et al., 2014). It indicates that in a sample of people with health problems the judgment effect clearly prevails.
This judgment effect or “health optimism” effect is related to the acquiescence effect or yes-set effect, the general tendency of people to provide affirmative answers to items, regardless of the context of the items (Billiet & McClendon, 2000; Ferrando & Lorenzo-Seva, 2010). When all items of a questionnaire are formulated in the same direction (e. g., high scores represent good health), the acquiescence effect contributes to a positive correlation between the items. In our study, the assessments of the vignettes and the self-rated health were measured with the same scale and the same orientation, where high scores indicated good health. In this case, we cannot distinguish between the acquiescence effect and the health optimism effect, since both effects represent the tendency to choose high scores on the health scale. The acquiescence effect provides an explanation for the fact that obviously opposite variables, e. g., positive and negative affectivity (Watson & Clark, 1997) or optimism and pessimism (Herzberg, Glaesmer, & Hoyer, 2006), nevertheless show only small negative correlations. These effects should also been taken into account when the influence of value orientations and protective factors on self-reported health is studied (Maercker et al., 2015).
We found similar results for the assessments of both vignettes regarding mean scores and lack of substantial correlations to self-rated health, though both vignettes were designed to be different. While vignette A was mainly characterized by physical problems, vignette B presented mental problems. The mean values of the assessments (M=42) are in the expected range, but the correlation between the assessments (r=.31) was only moderate. That is, the respondents judged them differently; some respondents attributed a higher level of health to vignette A, while others judged the opposite way. Nevertheless, there was a positive correlation.
There are several options for designing the vignettes. The description can be more or less complex, and the vignettes can be labeled as patients or people. The vignettes’ age and gender can be fixed, left open, or the respondents have to assign their own age and gender to the vignettes. Furthermore, the description of the vignettes can be tailored to the specific patients under study, as was done in the study with prostate cancer patients (Korfage et al., 2007). Finally, the symptoms described in the vignettes can be more or less severe. We decided to use two complex vignettes with no specification of disease or age. The disadvantage is that it is not clear which aspects of health are evaluated by the respondents, and which age they assigned to the vignettes. In contrast to our results, the Grol-Prokopczyk et al. (2011) study found a stable gender effect on “health optimism”: females assessed the vignettes as being healthier compared with the judgments of males. One possible reason for this difference is that in the Grol-Prokopczyk et al. study the vignettes were designed as “peers”, having the same age and gender as the respondent. Therefore, women had to assess female vignettes, which might contribute to the higher health ratings in that study. A recent study (Au & Lorgelly, 2014) compared “restricted” vignettes, described in terms of only one dimension, e. g., physical functioning, (Type A) with “complex” vignettes, described in terms of the five dimensions of the quality of life questionnaire EQ-5D (Type B). The participants of the study (Au & Lorgelly, 2014) reported that their subjectively rated response consistency (using the same scale for own assessment and the assessment of the vignettes) was higher for the complex type B (49%) compared with the restricted type A (29%).
Future research on vignettes should systematically investigate the effects of the factors complexity, symptom severity, and self-relatedness (vignettes of unspecified or fixed age and gender vs. age and gender of the respondent). This would help design most appropriate vignettes for the assessment of judgment effects. In addition, responding to vignettes in samples of patients may be different from that in a sample of the general population, and this relationship should also be systematically studied.
There are several options for the assessment of health. We used a 0-100 scale for rating the health states of both the respondents and the vignettes. Another possibility, used in the international SHARE study, is a five-point Likert scale (cf. Hartley, 2014) with the options: excellent, very good, good, fair, and poor (Grol-Prokopczyk et al., 2011; Jurges, 2007). Other researchers prefer the five answer labels: very good, good, fair, sometimes good/poor, and poor (Galenkamp, Deeg, Braam, & Huisman, 2013). Moreover, in other studies, the respondents were asked to rate health problems with one of five options: none, mild, moderate, severe, and extreme (Guindon & Boyle, 2012; Salomon et al., 2004). The advantage of the 0-100 scale is that it can be considered a metric scale, while the other examples require nonparametric statistics (Perneger, Gayet-Ageron, Courvoisier, Agoritsas, & Cullati, 2013).
The mean scores of the health status, given in Table 2, can be used as reference values in evaluating the health status of certain groups of patients. A previous German investigation using the same scale (Hinz, Klaiberg, Brähler, & König, 2006) found a mean score of M=77.1 which is very similar to the mean score of this study (M=76.2). The linear age effect and the lack of interactions between age and gender supported a linear regression approach. The coefficients of the regression can be used to calculate the expected health level of any age and gender group. The regression coefficients indicate that males report better subjective health than females (diff=2.8 points), and each age decade has a health worsening effect of 5.9 points on the 0-100 scale. In the previous study (Hinz et al., 2006), the gender effect was 3.9 points, and the effect of one age decade was 4.6 points.
Some further limitations of this examination should be mentioned. We designed the vignettes with relatively complex descriptions and severe symptoms. Vignettes A and B were referred to as “patient A” and “patient B”; perhaps the word “patient” triggered another category. It might be useful to return to more simple descriptions of one aspect of quality of life, or to vignettes with less severe symptoms. In the assessment of chronic conditions, we did not obtain clinical diagnoses. Therefore, our results are restricted to relationships between self-assessment data; the number of chronic conditions as measured with the SCQ is only a rough proxy of objective health. The possible selection bias has already been mentioned, though the age and gender distribution of our sample was similar to that of the German adult population.
In summary, we found only very small correlations between own health assessment and the assessment of complex vignettes, indicating that the hypothesized frame-of-reference effect was not strong enough to be used as a correcting factor for self-assessed health scores, even after controlling for a proxy of objective health.
