Personal outcomes-related quality of life provides information about the impact of individualized supports and services that are provided to people with intellectual disability. The Personal Outcomes Scale (POS) is a valid and reliable instrument that measures these outcomes using two parts, self-report and report by others. Based on the POS, the aim of this study is to provide a new psychometric study of the instrument that allows the evaluation of the three principal informers involved in the enhancement of individual's quality of life: individual with intellectual disability, professional and family member. This approach overcomes the limitations of the POS. For the self-report were involved 529 people with intellectual disability. A professional (N=522) and a family member (N=462) separately participated for the report by others versions to assess personal outcomes for each participant. The reliability study provides appropriate values for the first and second order factors with α values being higher than .82. The construct validity analysis provides an adjustment of the theoretical model, particularly regarding the assessments from professionals. Results show this instrument is adequate to evaluate personal outcomes and giving the guidelines for making policy and practice decisions.
Los resultados personales relacionados con la calidad de vida aportan información sobre el impacto de los apoyos individualizados y servicios ofrecidos a las personas con discapacidad intelectual. La Escala de Resultados Personales (ERP) es un instrumento válido y fiable que evalúa estos resultados en base a dos partes, el autoinforme y el informe de los otros. Basándonos en la ERP, el objetivo es ofrecer un nuevo estudio psicométrico de este instrumento contemplando la participación de los tres informadores implicados en la mejora de la calidad de vida: la persona con discapacidad intelectual, el profesional y un miembro de la familia. Esta aproximación supera los límites de la ERP. Para el autoinforme han participado 529 personas con discapacidad intelectual. El profesional (N=522) y el miembro de la familia (N=462) han participado separadamente en las versiones correspondientes. El estudio de fiabilidad aporta valores apropiados para los factores de primer y segundo orden (α ≥ .82). El análisis de la validez de constructo se ajusta al modelo teórico, particularmente en los profesionales. Según los resultados, este instrumento es adecuado para evaluar resultados personales y aportar información válida para las prácticas profesionales y las políticas sociales.
The concept of quality of life (QoL), which is understood to be a sensitizing notion in the field of intellectual disability (ID), has shifted towards a measurable construct that is expressed in terms of personal outcomes (Schalock, Gardner, & Bradley, 2007; Schalock & Verdugo, 2002). These outcomes are understood to be “person-defined and valued aspirations. Personal outcomes are generally defined in reference to QoL domains and indicators” (Schalock et al., 2007, p. 14). It is quite logical, then, to believe that personal outcomes can be used as a reference for the services and support that are provided to people with ID (Luckasson & Schalock, 2013a; Schalock & Verdugo, 2012a, 2012b; van Loon et al., 2013). Personal outcomes make sense within a QoL model. Regarding people with ID the most commonly used is the model by Schalock and Verdugo (2002). It is characterized by a hierarchical, multidimensional structure and includes both etic (universal) and emic (cultural) components. The eight dimensions of this model have been empirically validated in different cultures and countries (Jenaro et al., 2005; Schalock et al., 2005) and are arranged into three higher-order factors (Wang, Schalock, Verdugo, & Jenaro, 2010): (1) Independence, which includes the dimensions of personal development and self-determination; (2) Social Participation, which includes dimensions of interpersonal relations, social inclusion, and rights; and (3) Well-being, which includes the dimensions of emotional well-being, physical well-being, and material well-being.
In order to fully understand this model, we have to consider the ecological vision of disability, which is defined by the individual's three developmental environments (Bronfenbrenner & Morris, 1998): microsystem, mesosystem, and macrosystem. It is in these environments that valuable personal outcomes are expected to be achieved. This view is observed in the programs and services supplied to people with ID, which are not standard or predictable and have become support systems based on individualization (Luckasson & Schalock, 2013b; Schalock et al., 2007). The ecological perspective is closely linked to the paradigm of supports that places emphasis on the idea that the provision of individualized supports reduces the inconsistency between the individual's capacities and the environment's demands. Thus, the main purpose of organization should be the identification and provision of the supports using the Individualized Supports Plans (ISP). This is accomplished as a result of a support team composed by the individual, family member and staff which everyone plays an essential role to enhance desired outcomes (Buntinx & Schalock, 2010; Luckasson & Schalock, 2013a; Schalock, Bonham, & Verdugo, 2008; Thompson et al., 2009).
In order to properly evaluate and use personal outcomes, it is necessary to have measurement instruments with satisfactory psychometric properties that are based on an empirically validated QoL model (Arias, Verdugo, Navas, & Gómez, 2013; Jenaro et al., 2005; Schalock et al., 2005; Wang et al., 2010). Authors disagree about whether QoL assessment should include, on the one hand, the measurement of subjective well-being (including individual preferences) or, on the other, objective life circumstances and experiences (Schalock & Felce, 2004; Schalock et al., 2007). Although authors disagree about whether the objective or subjective perspective should be taken in regard to QoL, the soundest proposal is based on a combination of these perspectives (Ayaso-Maneiro, Domínguez-Prado, & García-Soidan, 2014; Cummins, 2005; Schalock & Felce, 2004; Schalock et al., 2007).
The Personal Outcomes Scale (POS) takes this approach and is a useful tool when studying the impact of support strategies that are provided to people with ID (van Loon, Van Hove, Schalock, & Claes, 2008). This scale was designed to assess, firstly, people with ID and, secondly, the perspectives of proxies (professionals or family members). Thus, this instrument contributes to the debate regarding the use of subjective or objective measures including different points of view in order to assess the QoL construct (Balboni, Coscarelli, Giunti, & Schalock, 2013; Claes, Vandevelde et al., 2012).
Related to the significance of assessing personal outcomes based on individual evaluations and proxies, the objective of this study is to provide a new psychometric study of this measurement instrument that allows us to examine the perspective of each participant involved in the ISP. Until now, the report of the others of the POS is used for both professional and family, but a specific scale is required for each one. Nowadays there are instruments validated for objective and subjective perspectives, but not for the assessment of objective views separately. For example, in Spanish context only two instruments related to the QoL model had been validated that included this two-fold perspective (objective and subjective). Firstly, the Integral Scale was validated (Verdugo, Gómez, Arias, & Schalock, 2009), although the fact that the two parts (reports from other people and self-report) did not have the same items could be seen as a limitation. The second instrument was the INICO-FEAPS Scale (Verdugo et al., 2013), which included two self-administered scales, one for the individual with ID and the other for external respondents. Although these two instruments use the QoL model that was previously mentioned (Schalock & Verdugo, 2002) and have satisfactory psychometric properties, the validation of the POS for the three main informers involved in ISP is required. The first reason for choosing the POS is because is not self-administered and is applied through use of an interview, both regarding the self-report and the reports from other respondents. The original authors specifically emphasized that there should be a dialogue about the items, which meant that the interview needed to be conducted by an interviewer who had prior training about the fundamentals and administration of this instrument (Claes, Van Hove, van Loon, Vandevelde, & Schalock, 2010). Secondly, we believe that the content of the items more accurately addresses the concept of personal outcomes, which was introduced by Schalock et al. (2007). As thirdly, the POS has showed acceptable psychometric properties in other languages and countries (Simões & Santos, 2013).
Therefore, the objective of this paper is to present a new psychometric study of the POS for the three informers (the individual with ID, the professional, and the family member) in the Spanish population. This project will allow to future research to use this instrument and obtaining a final decision regarding the congruency of these three sources of information.
MethodParticipantsThe sample consisted of a total of 529 people with ID (296 men and 233 women), with Mage= 35.03, SD= 10.82, age range: 16-66, who came from seven autonomous communities in Spain: Andalusia (20.9%), Aragon (4%), Catalonia (25%), Castile and León (6.6%), Castile-La Mancha (14.8%), Madrid (17.4%), and Galicia (11.7%). Besides, professionals (N=522) and their families (N=462) participated.
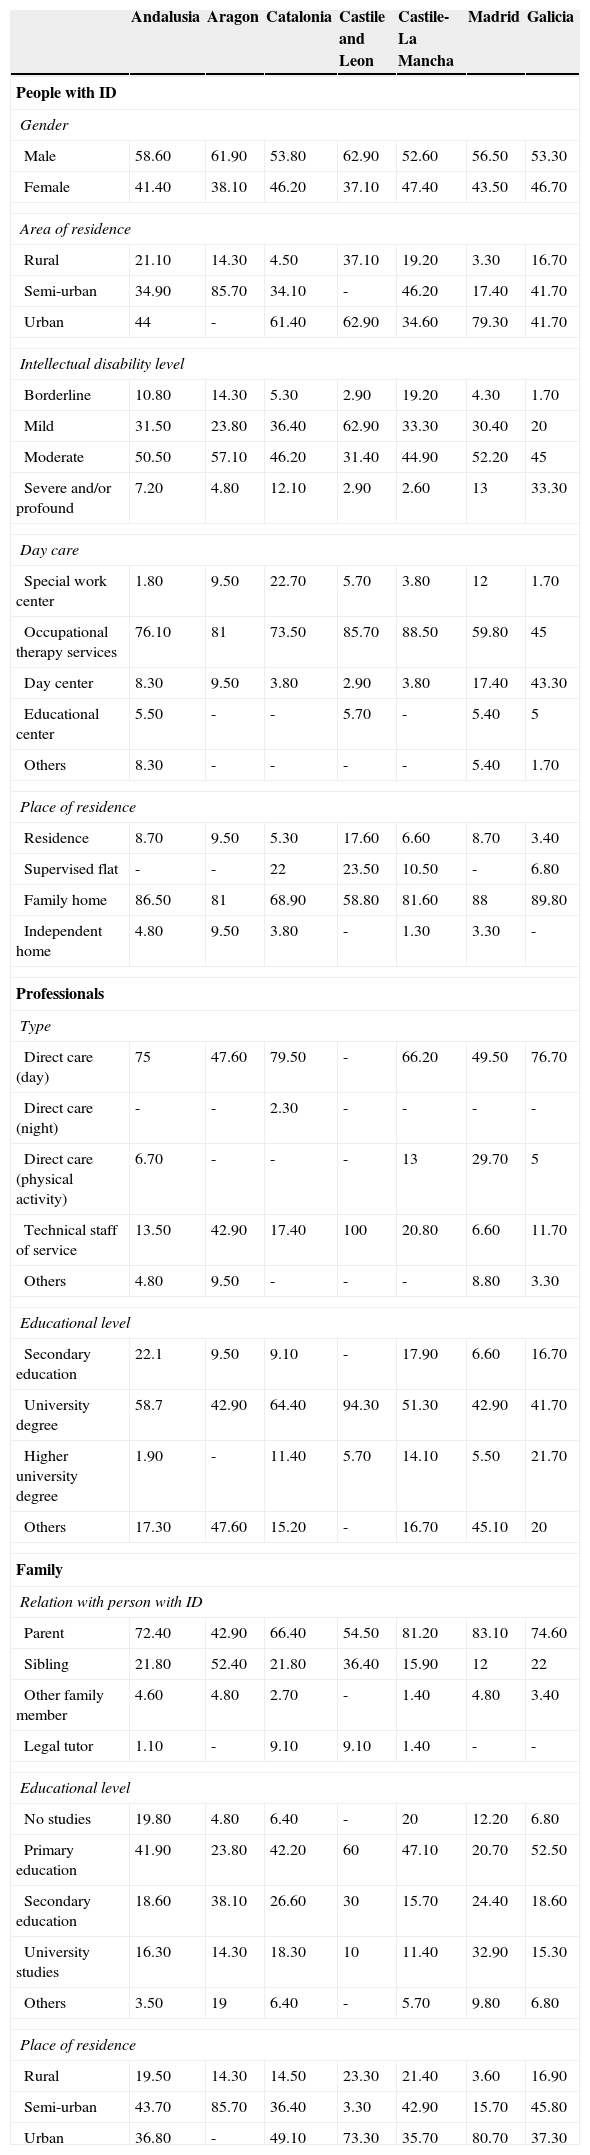
In this study, accidental, non-randomized sampling was carried out in every autonomous community. The Table 1 shows the main descriptive data regarding the individual with ID, the professional and the family member who participated for every community.
Descriptive data of people with ID, professionals and family.
| Andalusia | Aragon | Catalonia | Castile and Leon | Castile-La Mancha | Madrid | Galicia | |
|---|---|---|---|---|---|---|---|
| People with ID | |||||||
| Gender | |||||||
| Male | 58.60 | 61.90 | 53.80 | 62.90 | 52.60 | 56.50 | 53.30 |
| Female | 41.40 | 38.10 | 46.20 | 37.10 | 47.40 | 43.50 | 46.70 |
| Area of residence | |||||||
| Rural | 21.10 | 14.30 | 4.50 | 37.10 | 19.20 | 3.30 | 16.70 |
| Semi-urban | 34.90 | 85.70 | 34.10 | - | 46.20 | 17.40 | 41.70 |
| Urban | 44 | - | 61.40 | 62.90 | 34.60 | 79.30 | 41.70 |
| Intellectual disability level | |||||||
| Borderline | 10.80 | 14.30 | 5.30 | 2.90 | 19.20 | 4.30 | 1.70 |
| Mild | 31.50 | 23.80 | 36.40 | 62.90 | 33.30 | 30.40 | 20 |
| Moderate | 50.50 | 57.10 | 46.20 | 31.40 | 44.90 | 52.20 | 45 |
| Severe and/or profound | 7.20 | 4.80 | 12.10 | 2.90 | 2.60 | 13 | 33.30 |
| Day care | |||||||
| Special work center | 1.80 | 9.50 | 22.70 | 5.70 | 3.80 | 12 | 1.70 |
| Occupational therapy services | 76.10 | 81 | 73.50 | 85.70 | 88.50 | 59.80 | 45 |
| Day center | 8.30 | 9.50 | 3.80 | 2.90 | 3.80 | 17.40 | 43.30 |
| Educational center | 5.50 | - | - | 5.70 | - | 5.40 | 5 |
| Others | 8.30 | - | - | - | - | 5.40 | 1.70 |
| Place of residence | |||||||
| Residence | 8.70 | 9.50 | 5.30 | 17.60 | 6.60 | 8.70 | 3.40 |
| Supervised flat | - | - | 22 | 23.50 | 10.50 | - | 6.80 |
| Family home | 86.50 | 81 | 68.90 | 58.80 | 81.60 | 88 | 89.80 |
| Independent home | 4.80 | 9.50 | 3.80 | - | 1.30 | 3.30 | - |
| Professionals | |||||||
| Type | |||||||
| Direct care (day) | 75 | 47.60 | 79.50 | - | 66.20 | 49.50 | 76.70 |
| Direct care (night) | - | - | 2.30 | - | - | - | - |
| Direct care (physical activity) | 6.70 | - | - | - | 13 | 29.70 | 5 |
| Technical staff of service | 13.50 | 42.90 | 17.40 | 100 | 20.80 | 6.60 | 11.70 |
| Others | 4.80 | 9.50 | - | - | - | 8.80 | 3.30 |
| Educational level | |||||||
| Secondary education | 22.1 | 9.50 | 9.10 | - | 17.90 | 6.60 | 16.70 |
| University degree | 58.7 | 42.90 | 64.40 | 94.30 | 51.30 | 42.90 | 41.70 |
| Higher university degree | 1.90 | - | 11.40 | 5.70 | 14.10 | 5.50 | 21.70 |
| Others | 17.30 | 47.60 | 15.20 | - | 16.70 | 45.10 | 20 |
| Family | |||||||
| Relation with person with ID | |||||||
| Parent | 72.40 | 42.90 | 66.40 | 54.50 | 81.20 | 83.10 | 74.60 |
| Sibling | 21.80 | 52.40 | 21.80 | 36.40 | 15.90 | 12 | 22 |
| Other family member | 4.60 | 4.80 | 2.70 | - | 1.40 | 4.80 | 3.40 |
| Legal tutor | 1.10 | - | 9.10 | 9.10 | 1.40 | - | - |
| Educational level | |||||||
| No studies | 19.80 | 4.80 | 6.40 | - | 20 | 12.20 | 6.80 |
| Primary education | 41.90 | 23.80 | 42.20 | 60 | 47.10 | 20.70 | 52.50 |
| Secondary education | 18.60 | 38.10 | 26.60 | 30 | 15.70 | 24.40 | 18.60 |
| University studies | 16.30 | 14.30 | 18.30 | 10 | 11.40 | 32.90 | 15.30 |
| Others | 3.50 | 19 | 6.40 | - | 5.70 | 9.80 | 6.80 |
| Place of residence | |||||||
| Rural | 19.50 | 14.30 | 14.50 | 23.30 | 21.40 | 3.60 | 16.90 |
| Semi-urban | 43.70 | 85.70 | 36.40 | 3.30 | 42.90 | 15.70 | 45.80 |
| Urban | 36.80 | - | 49.10 | 73.30 | 35.70 | 80.70 | 37.30 |
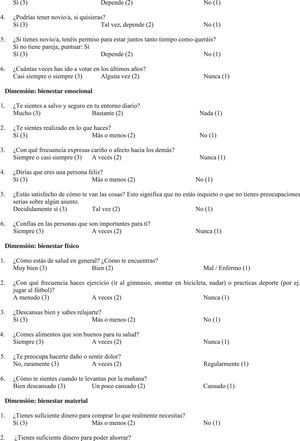
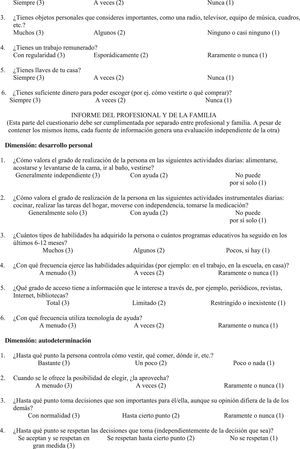
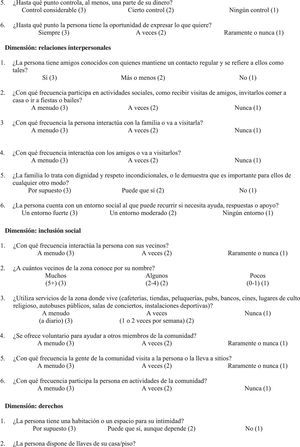
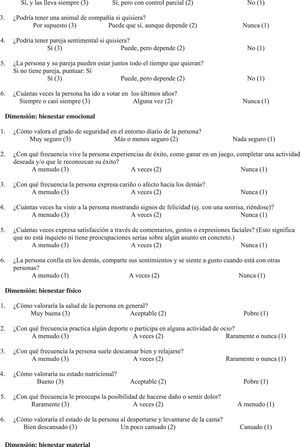
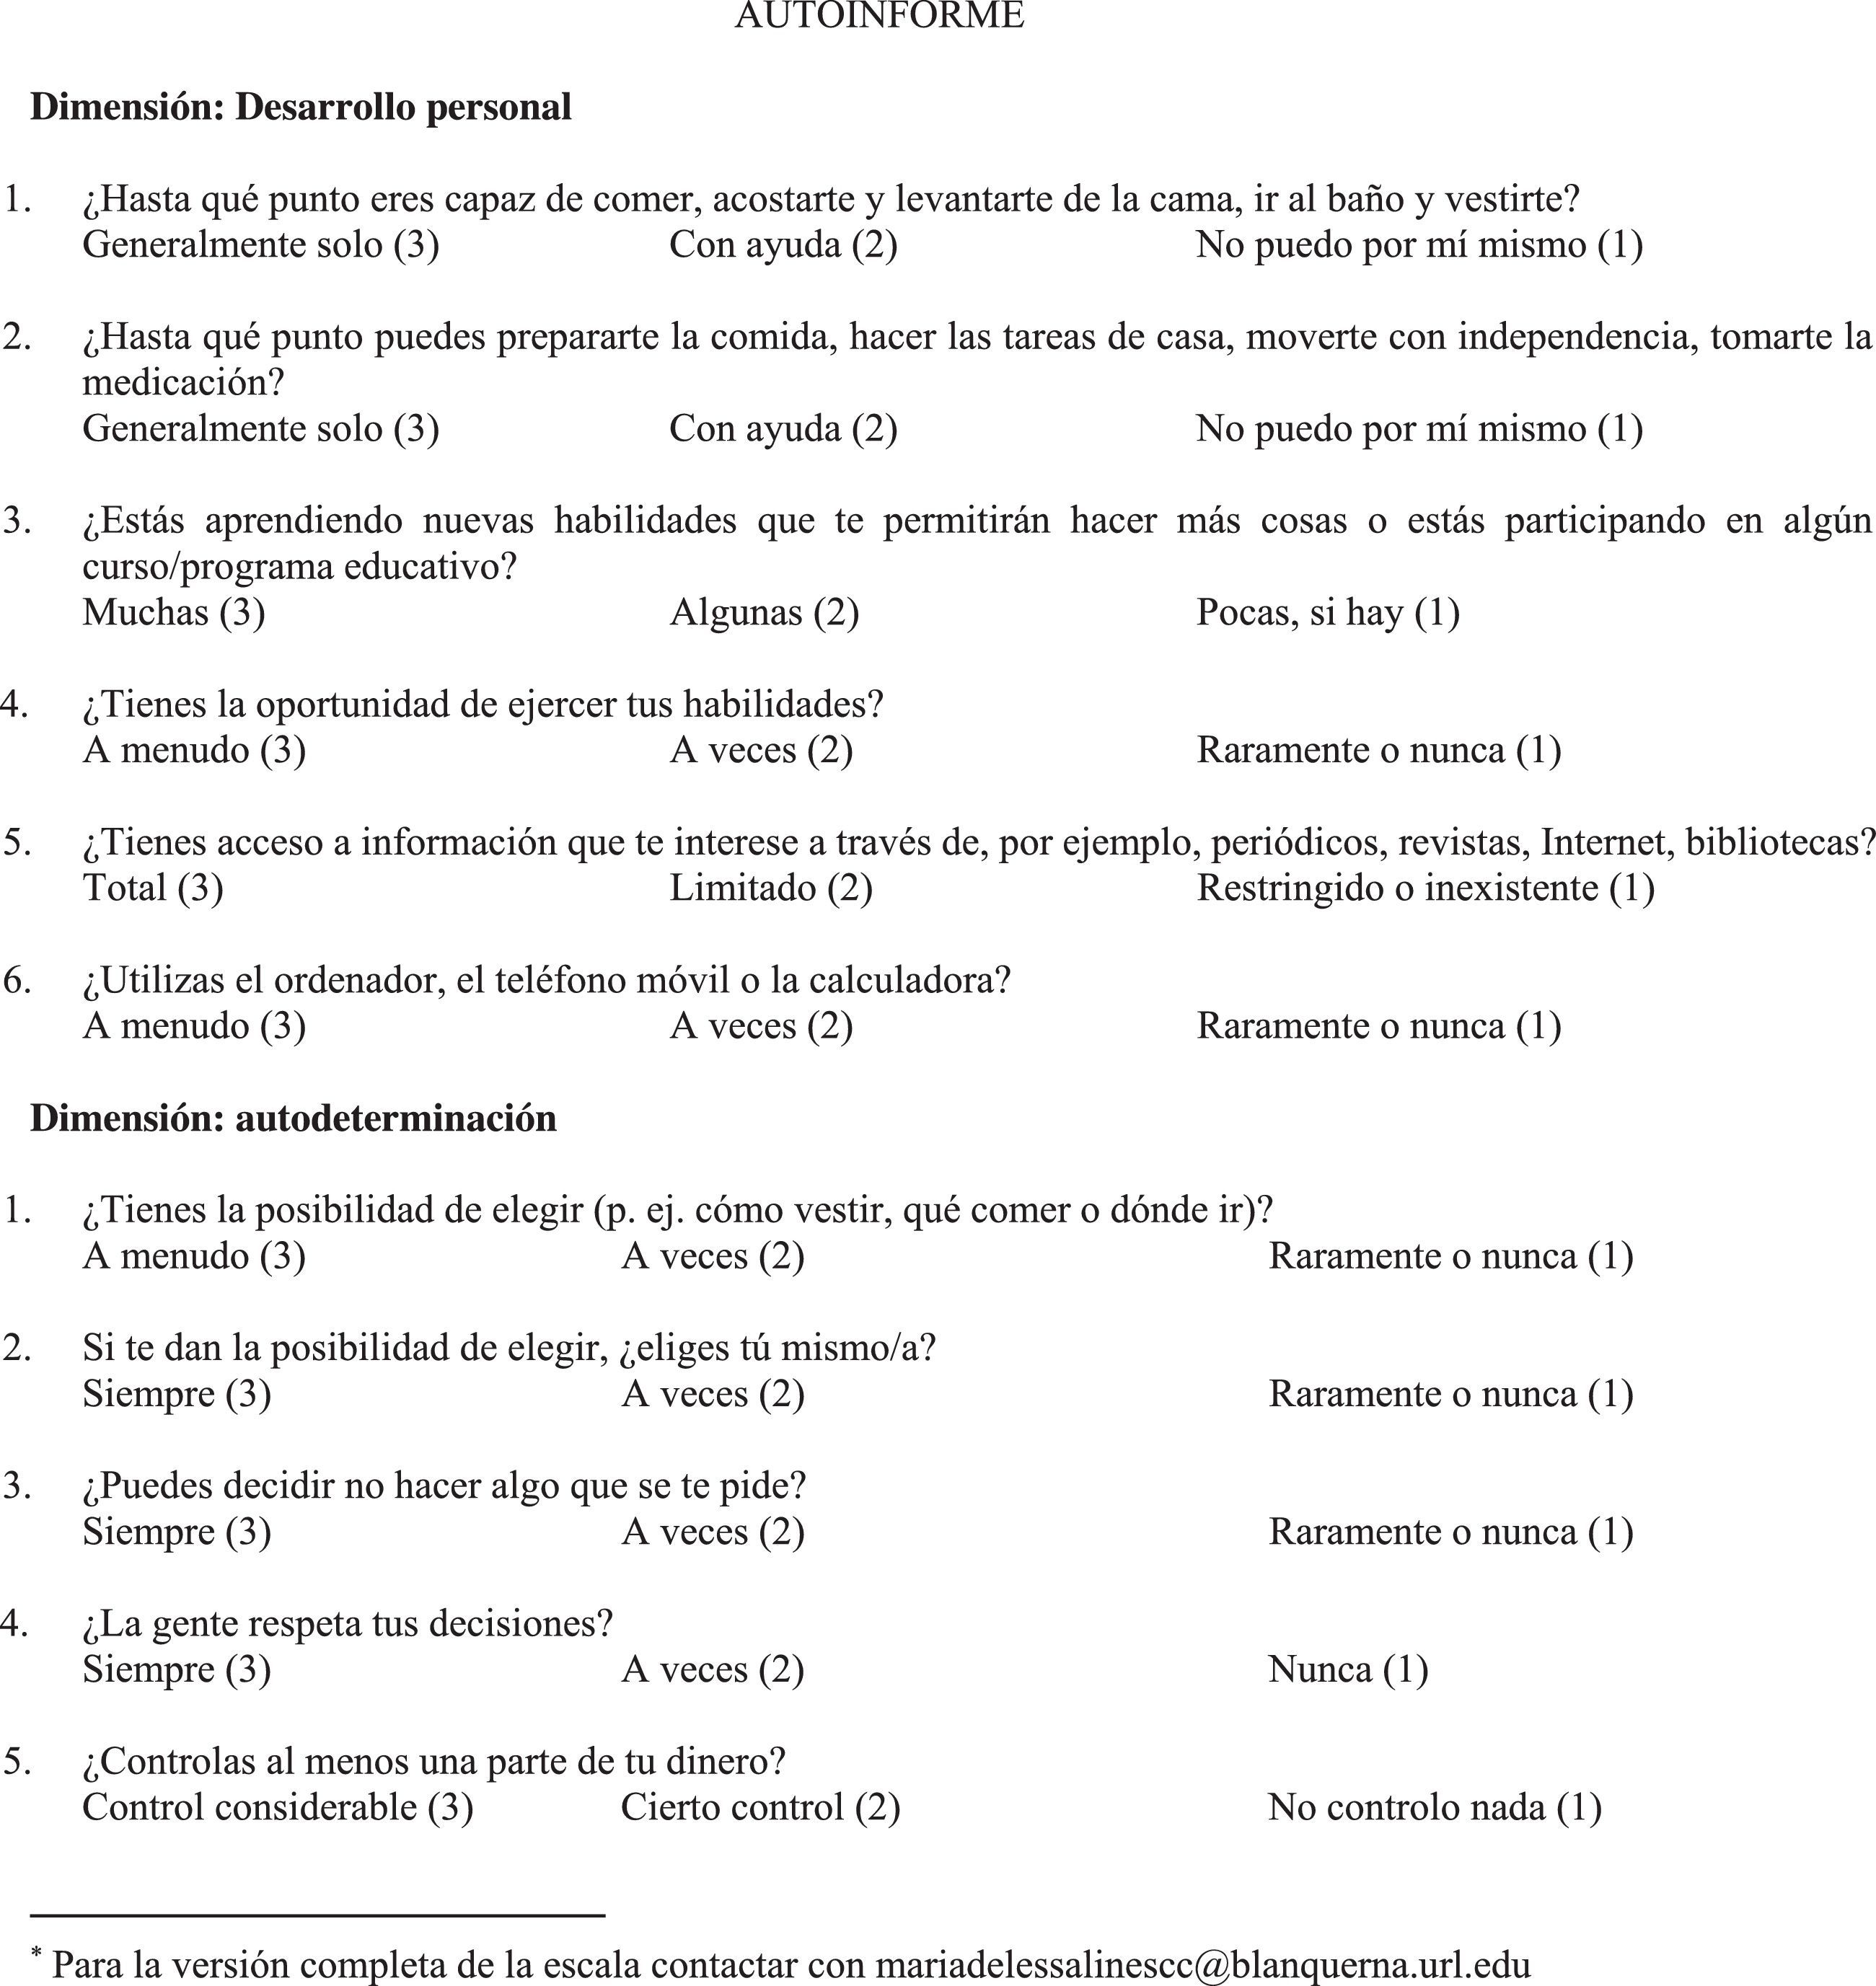
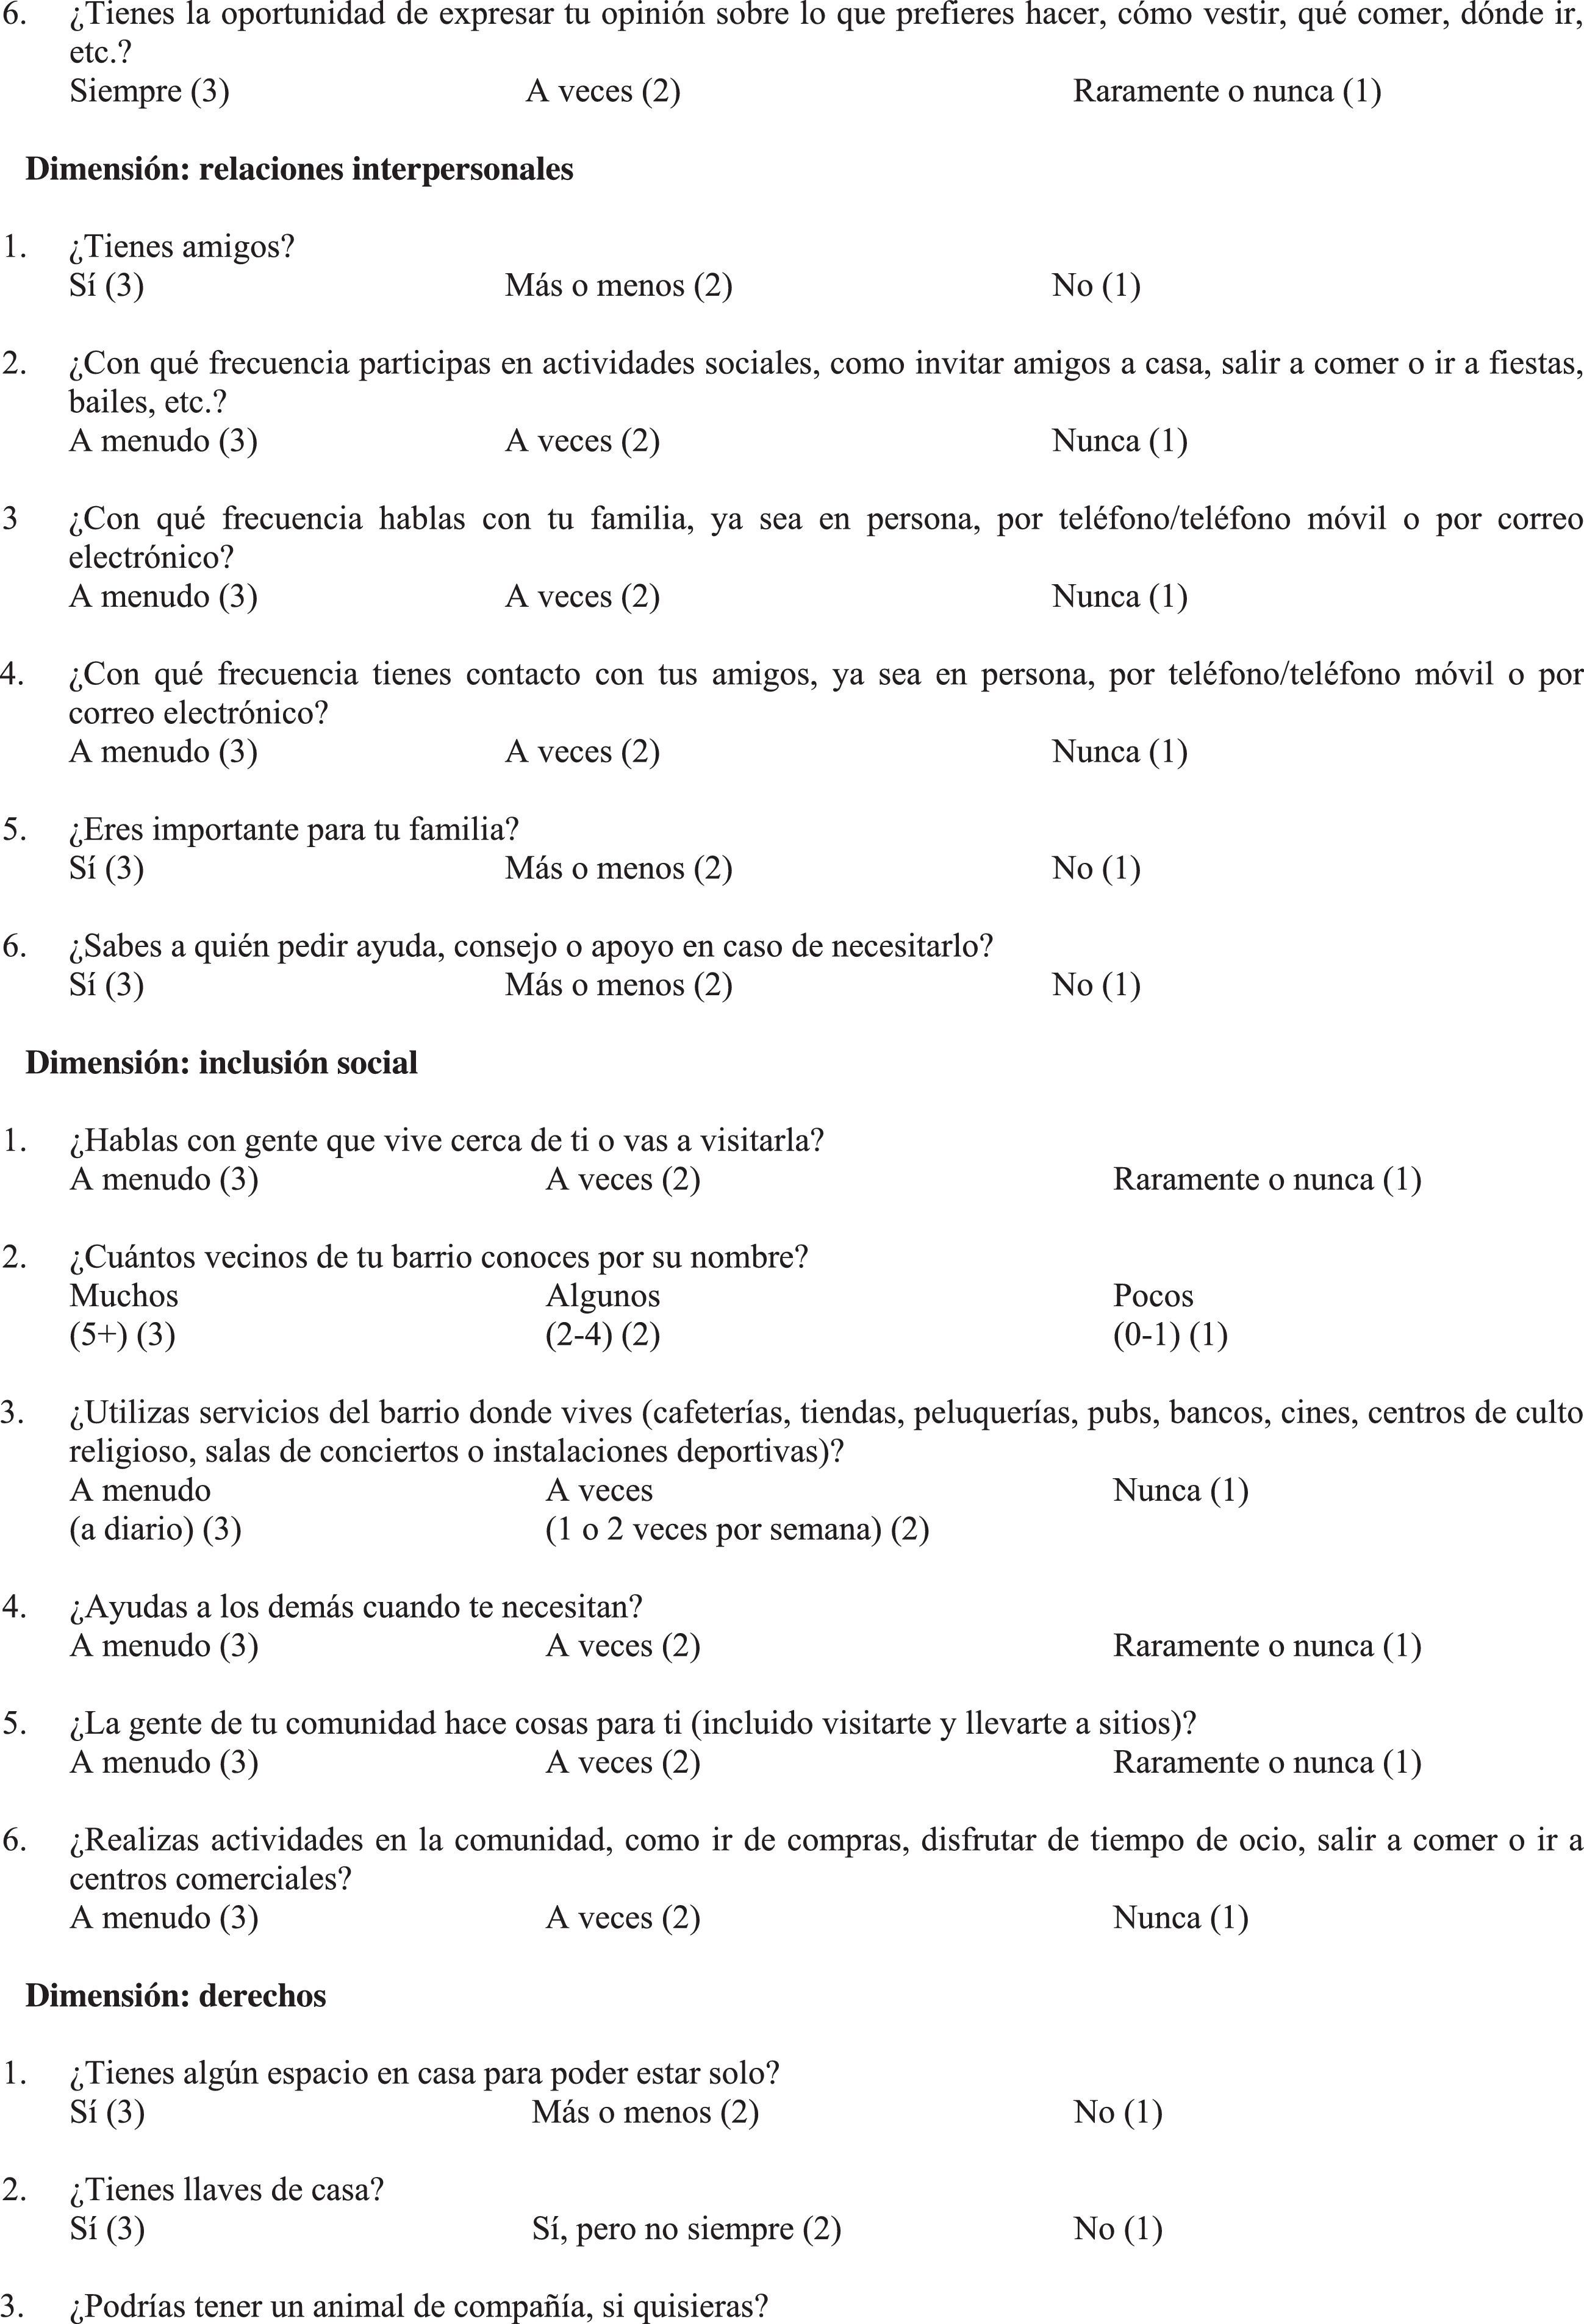
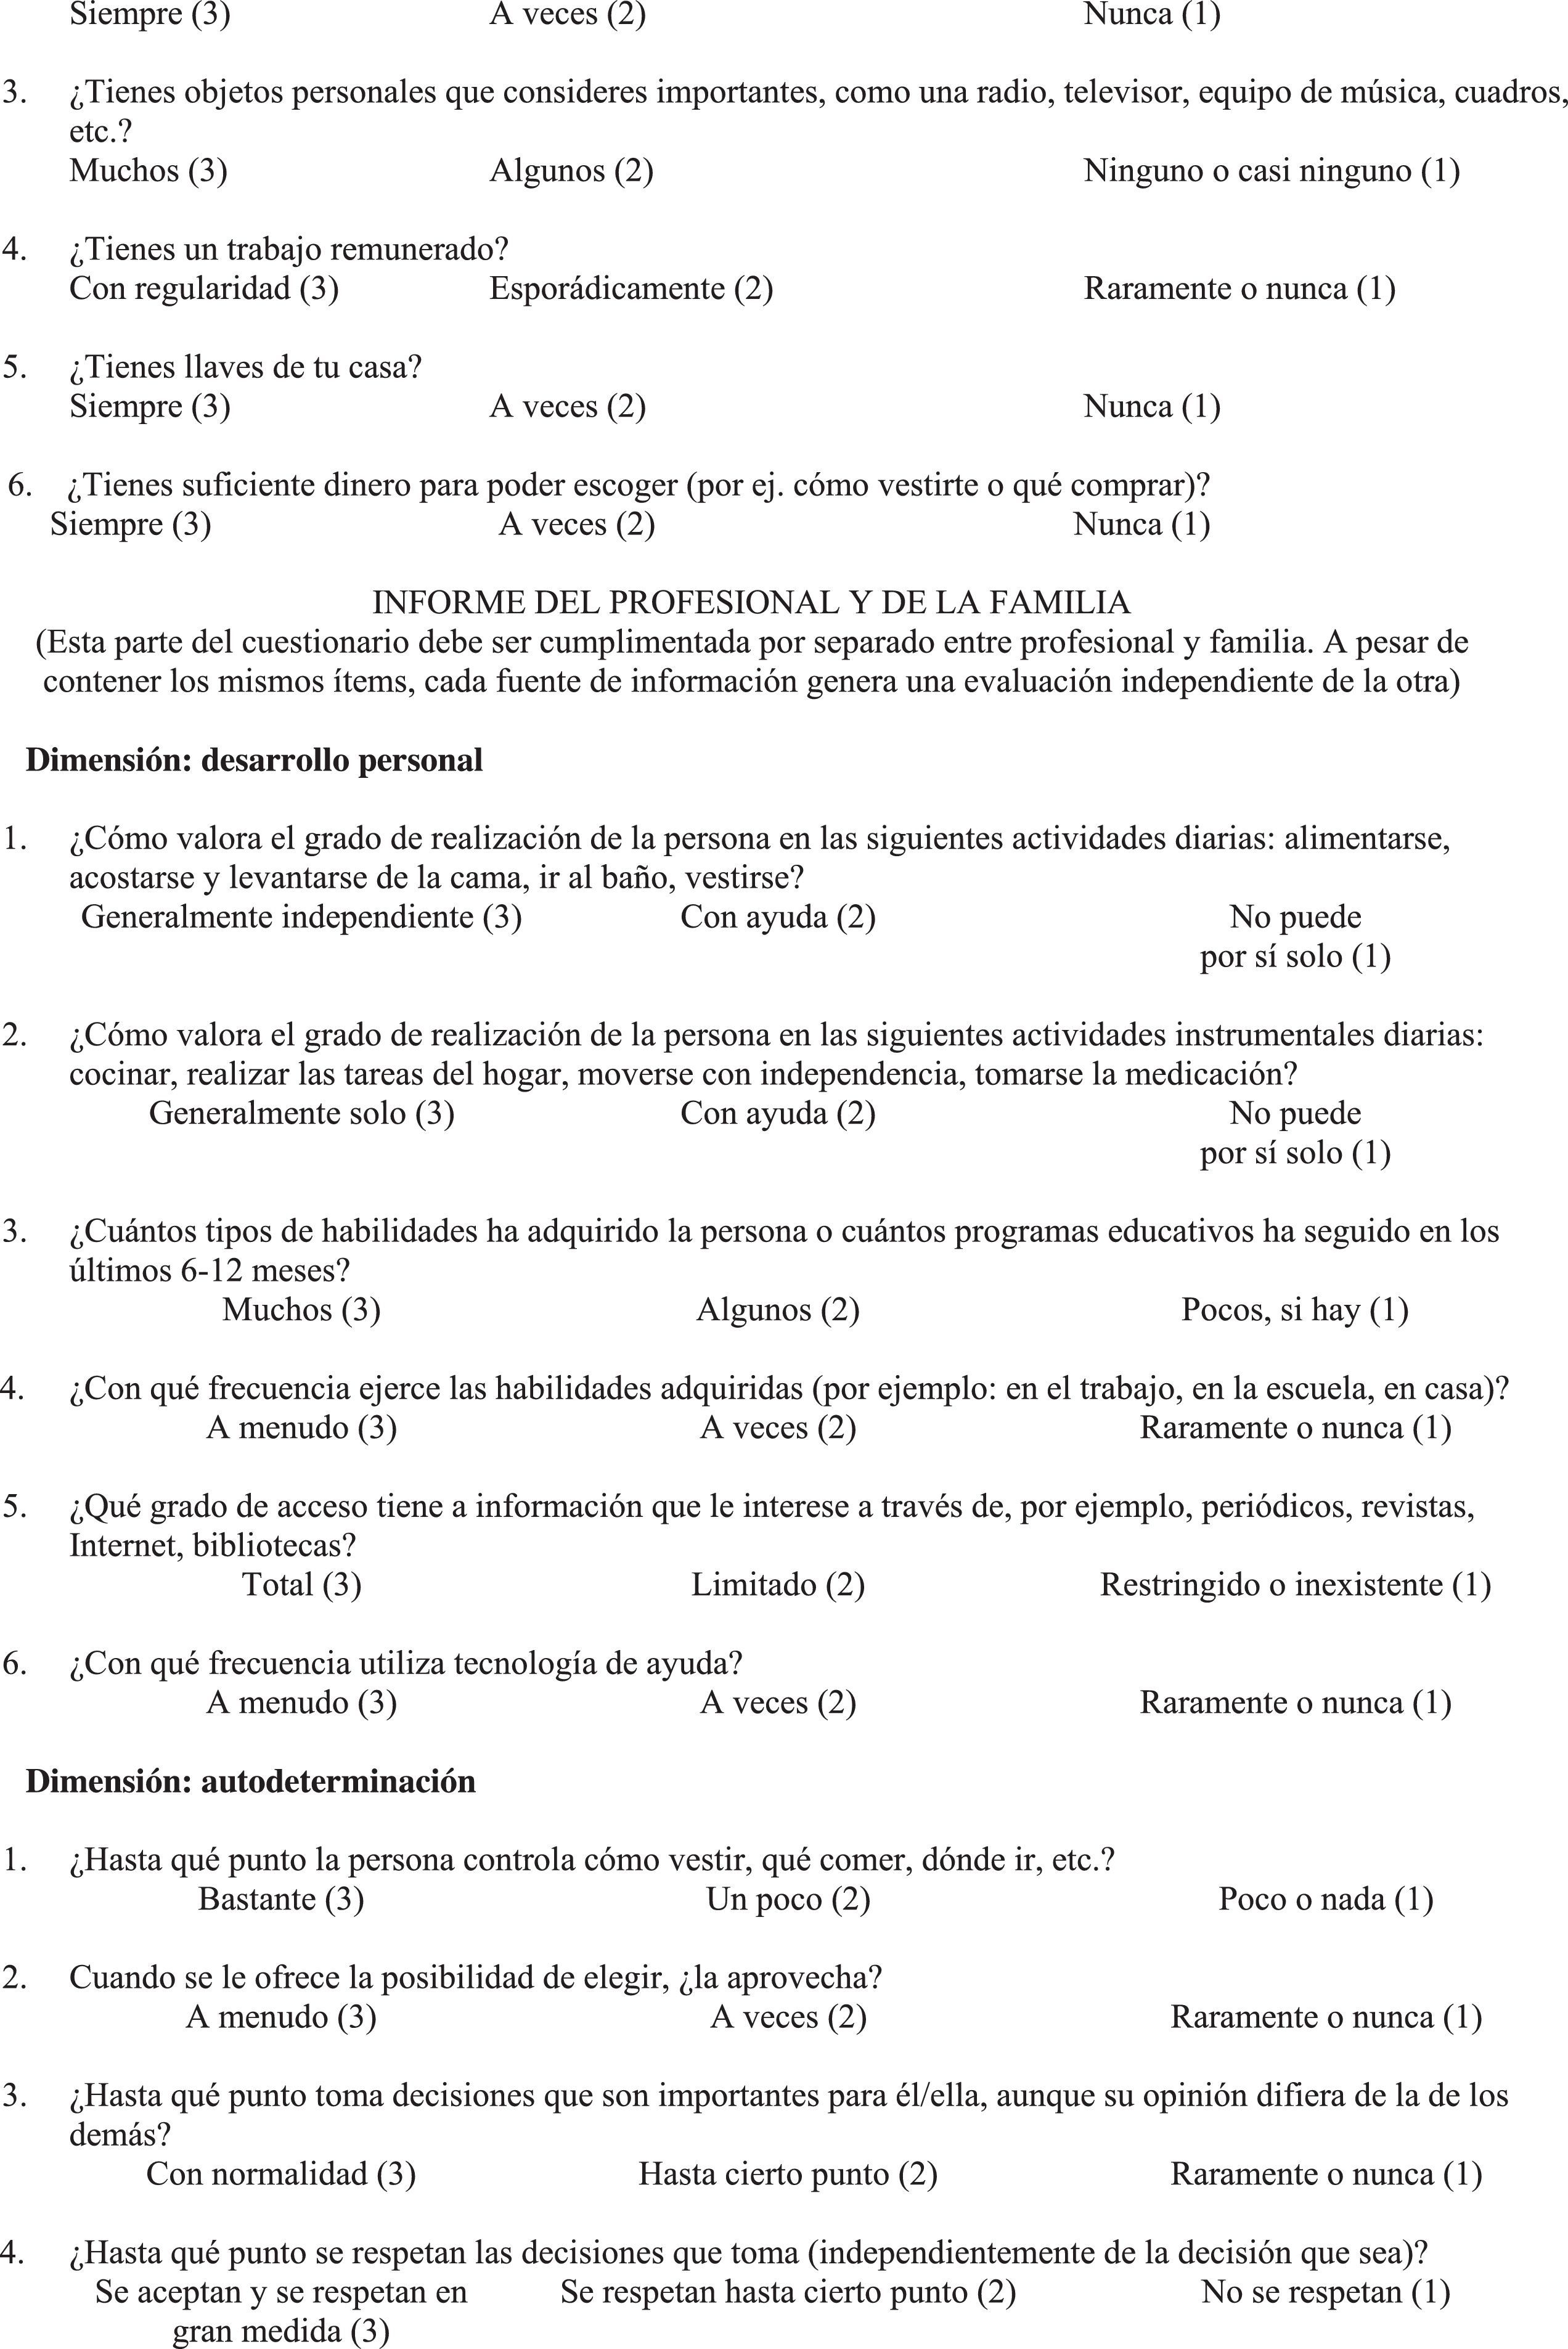
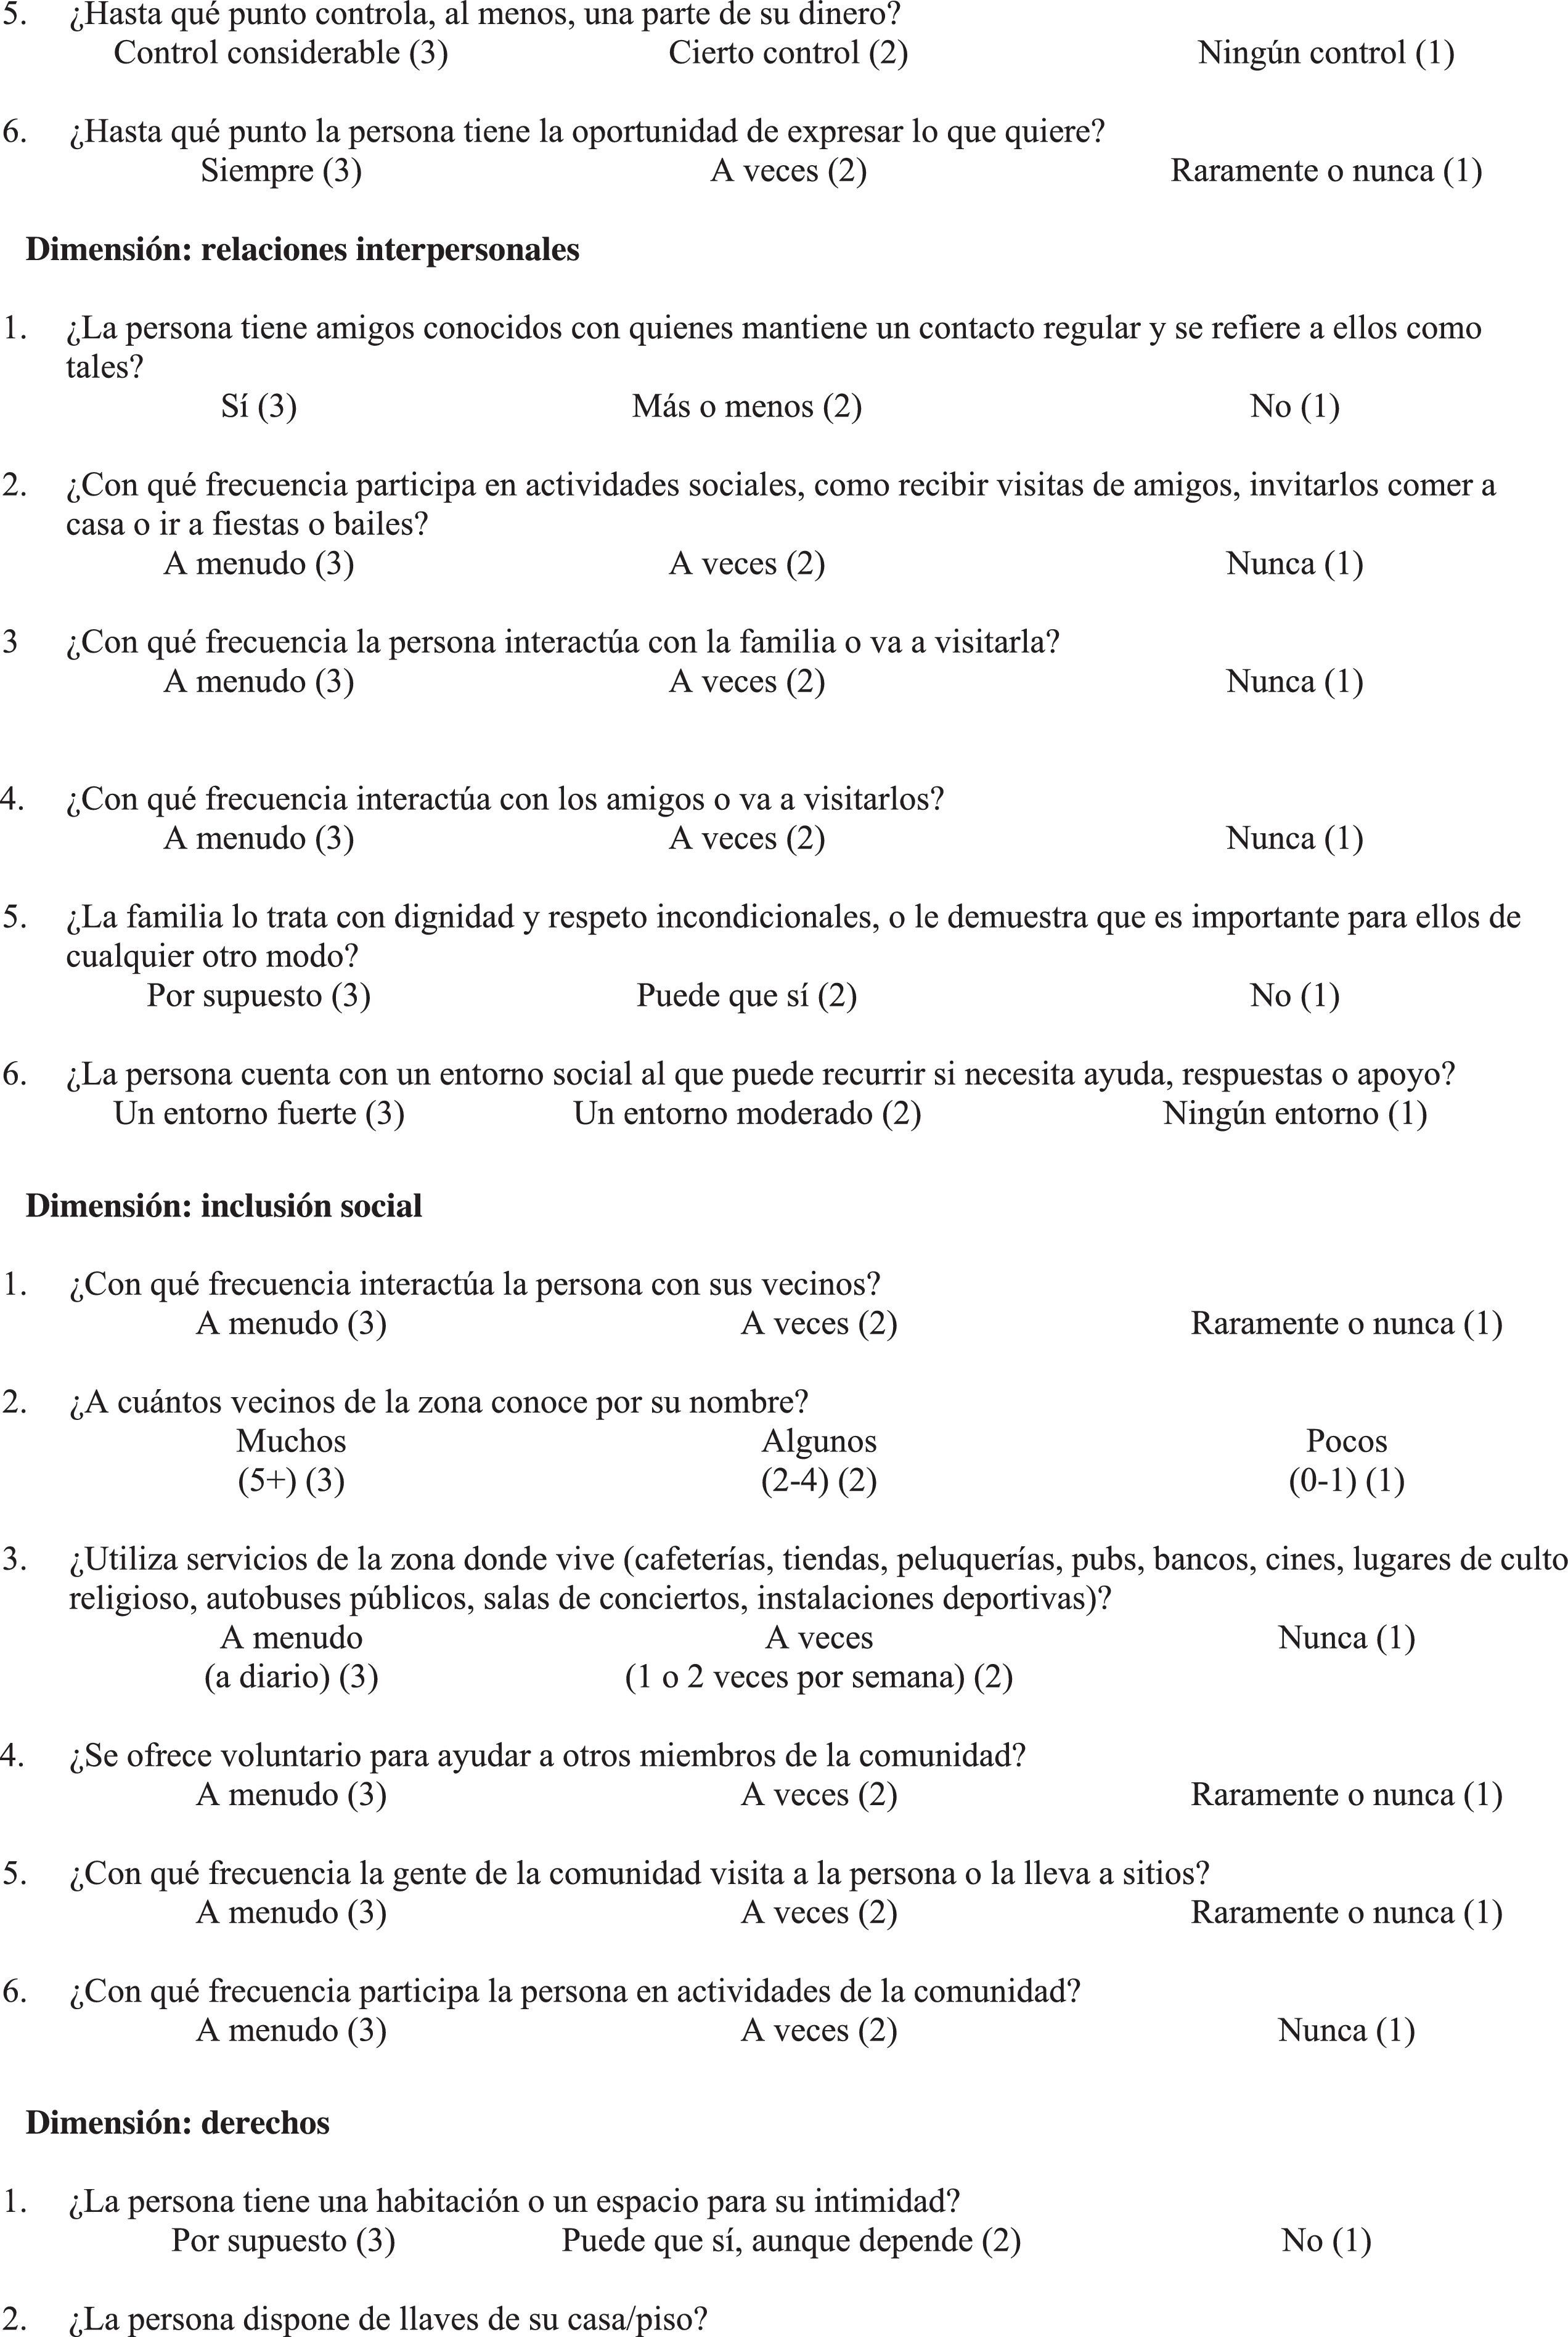
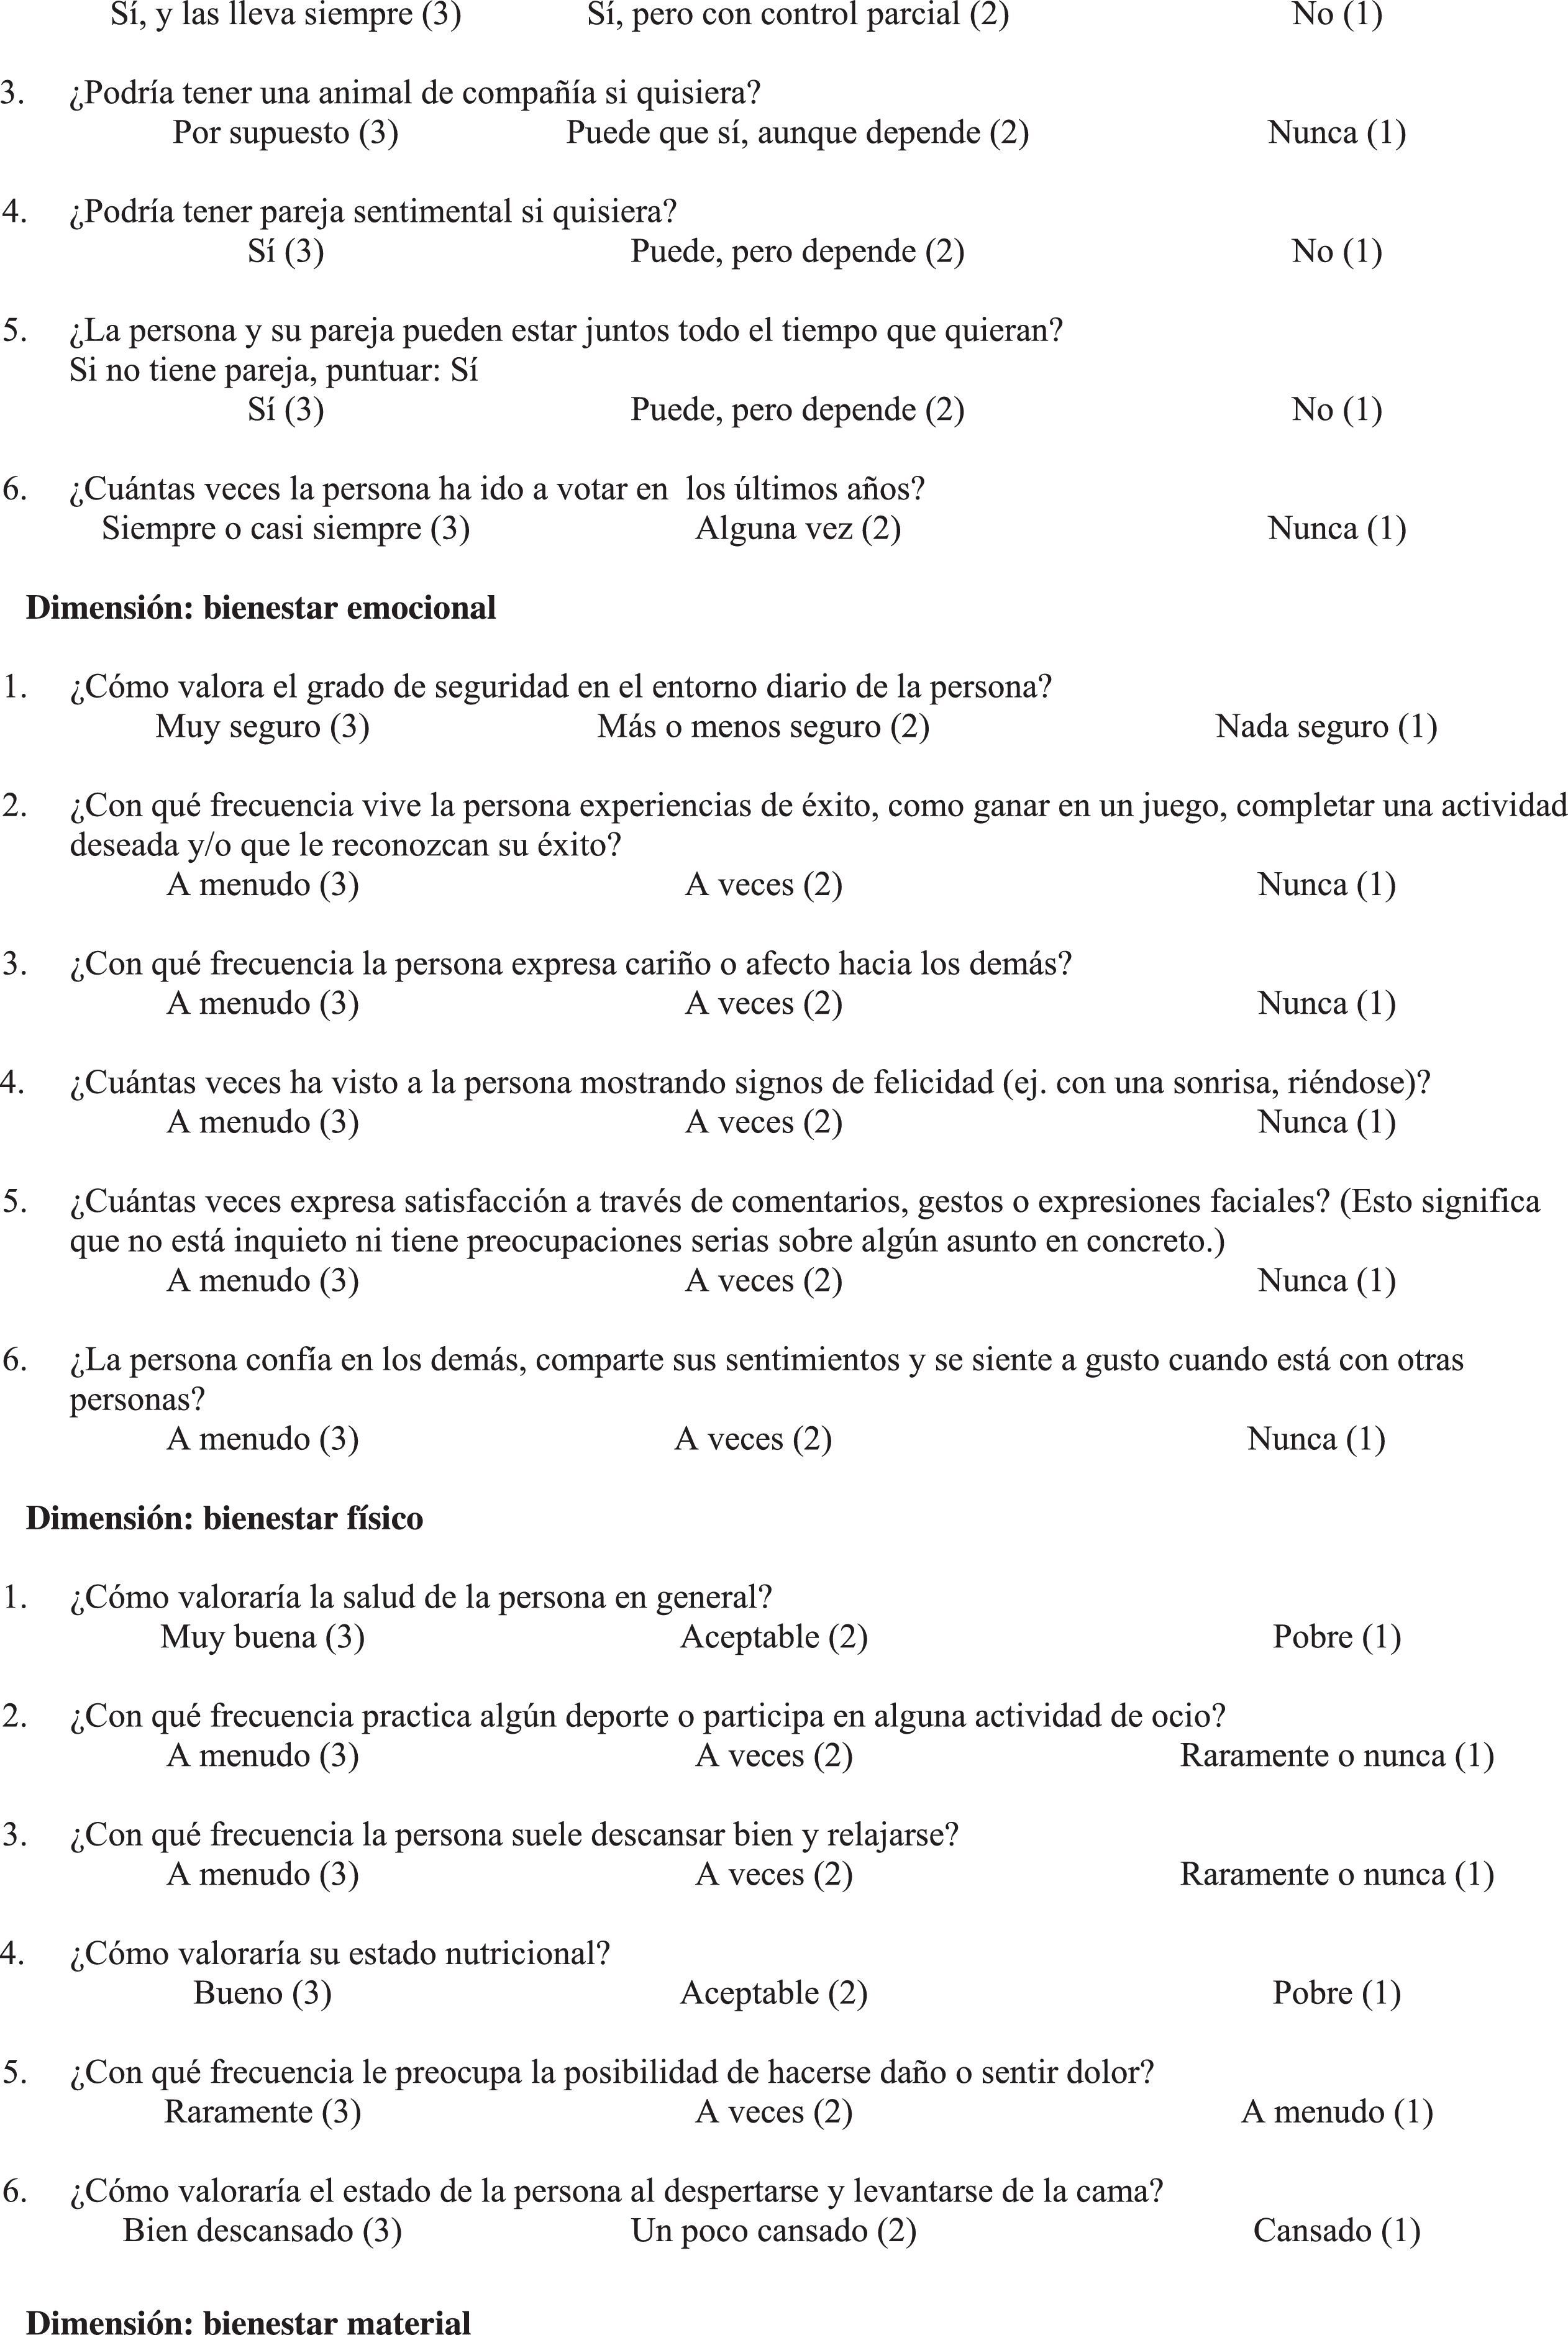
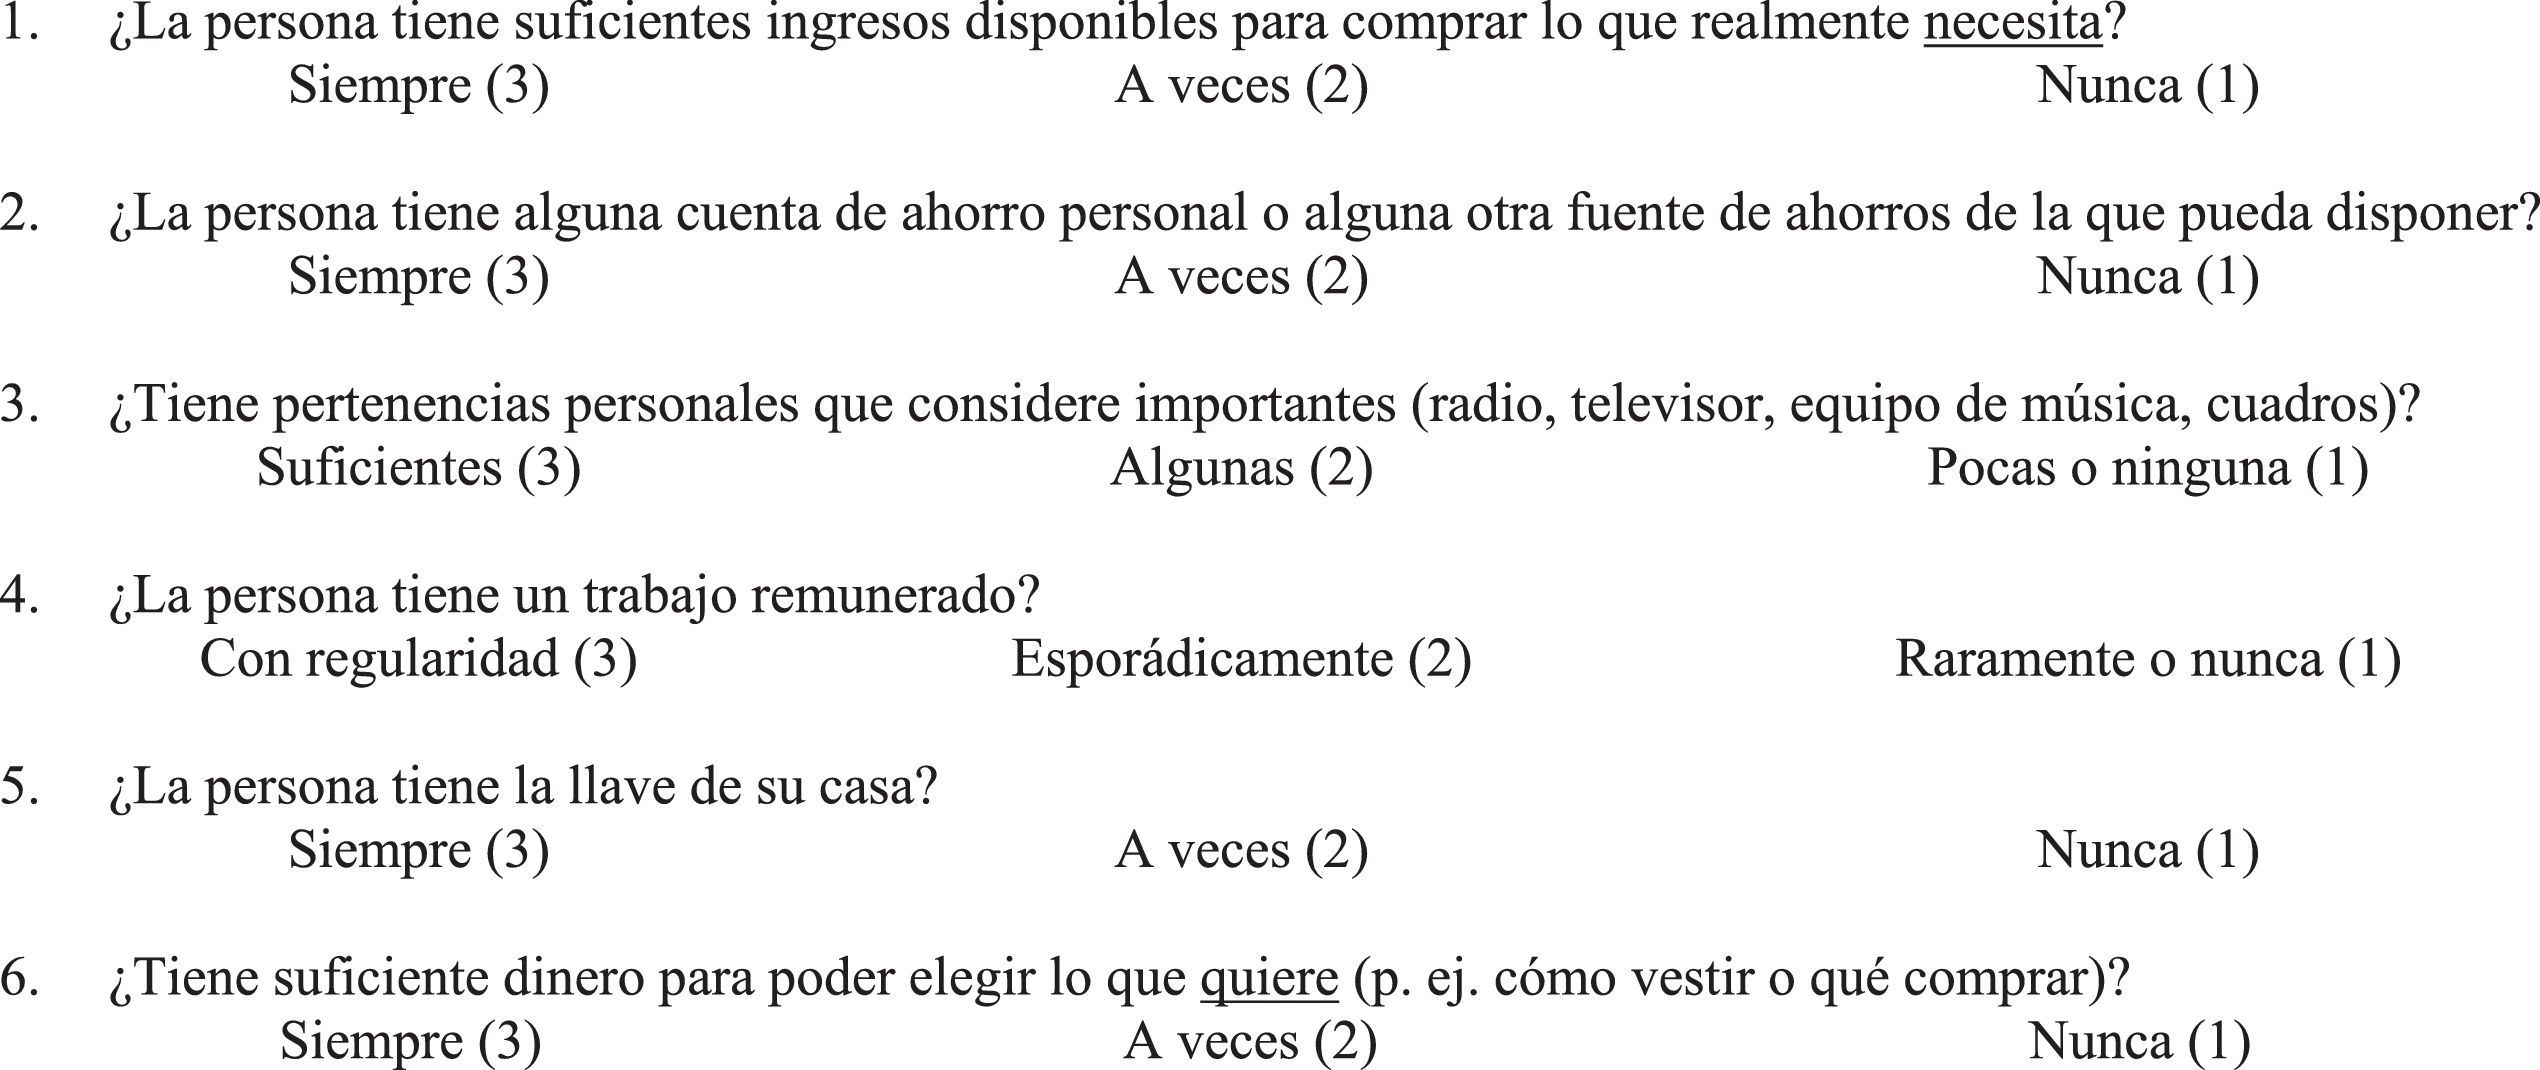
In order to carry out the psychometric study of the POS, two related instruments were used: Personal Outcomes Scale (POS; Appendix 1) and Gencat Scale.
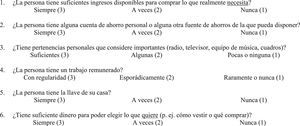
The POS (van Loon et al., 2008) aims to assess QoL in people with ID on the basis of the eight dimensions of Schalock and Verdugo's (2002) model, which were arranged into three higher-order factors: independence, social participation, and well-being (Wang et al., 2010). The Spanish version of the POS is divided into three information sources: (a) self-report, where the individual answers on his/her own; therefore, this assesses the subjective perspective of QoL; (b) report by the professional, which assessed the individual's experiences and circumstances from the view of direct care staff or a service technician; and (c) family report, where the indicators are given scores from a family member's perspective. If the individual cannot answer on his/her own, only the professional's report and the family member's report are directly used. In this adaptation, the use of proxies for the self-report was not established. Every dimension has 6 items, which means that a total of 48 items are answered for the scale as a whole. Every item is assessed through the use of a 3-point Likert scale. Scores are obtained through an interview that is conducted by an interviewer who has previous training regarding the theoretical model of the scale and the proper administration of the scale. Respondents needed to know the individual with ID for at least 3 months and needed to have had the opportunity to observe him/her in one or more environments over a period of 3 to 6 months. Outcomes are obtained for every dimension and the three factors. For every dimension, the sum of all of the scores from the 6 items is obtained by using the following calculation: (3)=always, (2)=sometimes, and (1)=rarely or never. After the dimensions of every factor are summed, a final score is calculated for each factor. Because the original scale was adapted for this study, before administering it, a pilot test was carried out with a sample of 77 people with ID and their professionals, who were not later included in the final sample. This prior study demonstrated a good reliability level in terms of internal consistency (α=.85 to α=.89) for the different factors and sources of information and of appropriate discriminability values for the items (in all cases>.54), which guaranteed their maintenance in regard to all of the factors and respondents. These results prompted the final administration of the POS adaptation in the final sample.
The Gencat Scale (Verdugo, Arias, Gómez, & Schalock, 2008) was administered in order to assess the convergent validity of the POS. This scale is based on the multidimensional QoL model by Schalock and Verdugo (2002) and addresses all of the people who use social services. This instrument is self-administered by professionals and allows for the objective assessment of QoL, which is needed to elaborate ISP. This scale has appropriate reliability values in terms of internal consistency (α=.91) for the total scale, but these values fluctuate for the different factors that are defined (α=.47 to α=.88). Despite these fluctuations, this scale is considered to be a suitable control test for the assessment of convergent validity. This can be seen in the adjustment values that are found in the confirmatory measurement model, which were appropriate (Normed Fit Index=.95; Tucker Lewis Index=.96; Comparative Fit Index=.97; Standardized Root Mean Residual=.076; Goodness of Fit Index=.96; and Adjusted Goodness of Fit Index=.96) (Verdugo et al., 2008). By using the Gencat, you can obtain a total direct score for every dimension, a QoL Index, a percentile for this index, and a QoL Profile. In order to obtain this total direct score, all of the answers have to be summed (1-2-3-4) for the items that correspond to each of the eight dimensions. In order to obtain the standard score and the percentile, an index table is used according to which group the individual who is being analyzed belongs to. The Gencat has four index tables: one for the general sample, one for the elderly (older than 50), one for people with ID, and one for the other groups (people with drug addiction, HIV/AIDS, physical disabilities and mental health problems). The summation of the standard scores for the eight dimensions results in the QoL Index (or compound standard score) and the percentile. Separate from this Index, these standard scores can be graphically represented, which provides us with the QoL Profile.
ProcedureOrganizations that provide service were asked to participate by the Spanish Confederation of Organizations for the People with Intellectual Disability (FEAPS) and by logistic support from the delegations in every autonomous community. The organizations that agreed to participate provided day services (special work centers, occupational therapy, day centers), and most of them also provided residential services (supervised flats, residences) for adults with ID.
In every autonomous community, specific training was given regarding the application of the POS to those professionals who would participate as interviewers. Due to this, we could guarantee that the instrument's application would be in concordance with the original authors’ guidelines. At the end of the training sessions, professionals were given all of the materials (scale forms and item descriptors) that were needed in order to administer the scale in every center. These professionals interviewed a total of 670 participants, 529 of which followed the established instructions. Accordingly, for each person evaluated, we identified the professional assisting them and we contacted their family, thus gathering the three informants that would later be evaluated. Given the characteristics of the sampling, the professional interviewed was the one usually assisting the person with ID since deep knowledge of the condition of the person with ID is required to fill in the scale. Consequently, once the person with ID was identified, obviously the family member and the professional were defined, too. Along with the questionnaires, in order to follow the guidelines of the Ethical Committee, these professionals were sent the informed consent form so that it could be read and signed by all of the participants.
Statistical data analysisFor more conventional analyses, as descriptive statistics or Pearson's correlations, we used the IBM SPSS Statistics 21 program and, in order to assess construct validity through Confirmatory Factor Analysis (CFA), we used MPlus (5th edition) (Muthén & Muthén, 1998-2007) to identify the characteristics of the parameter estimation procedures.
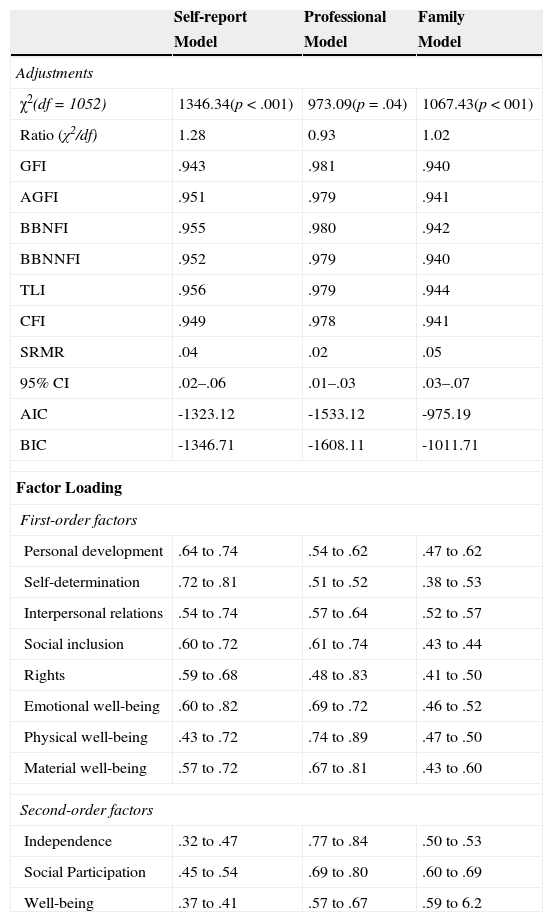
ResultsFor the analysis of construct validity, every source of information was submitted into a confirmatory factor analysis (CFA), which considered the existence of a measurement model with eight first-order factors and three second-order factors. Given the ordinal characteristics of the items on the scale, we estimated polychroric correlation coefficients and used a Maximum Likelihood estimation (MLE), which assumed the multinormality of observed distributions and the factor scores were distributed with a normal model of μ=0 and σ2=1. The model that had a better adjustment was the one that was related to the reports by professionals, although the other two models did not have remarkably worse adjustments. These are normal results for confirmatory models, which supports the acceptance of this proposed model as being the structure of the construct. The adjustment results for the three measurement models can be seen in Table 2. Additionally, this table shows standardized factor loading values that were associated with every factor and source of information, with all of them being statistically significant (p<.001). The values that were obtained guarantee significant factor loadings of every item on the theoretically assigned factor.
Adjustments and factor loading of the three measurement models.
| Self-report | Professional | Family | |
|---|---|---|---|
| Model | Model | Model | |
| Adjustments | |||
| χ2(df=1052) | 1346.34(p<.001) | 973.09(p=.04) | 1067.43(p<001) |
| Ratio (χ2/df) | 1.28 | 0.93 | 1.02 |
| GFI | .943 | .981 | .940 |
| AGFI | .951 | .979 | .941 |
| BBNFI | .955 | .980 | .942 |
| BBNNFI | .952 | .979 | .940 |
| TLI | .956 | .979 | .944 |
| CFI | .949 | .978 | .941 |
| SRMR | .04 | .02 | .05 |
| 95% CI | .02–.06 | .01–.03 | .03–.07 |
| AIC | -1323.12 | -1533.12 | -975.19 |
| BIC | -1346.71 | -1608.11 | -1011.71 |
| Factor Loading | |||
| First-order factors | |||
| Personal development | .64 to .74 | .54 to .62 | .47 to .62 |
| Self-determination | .72 to .81 | .51 to .52 | .38 to .53 |
| Interpersonal relations | .54 to .74 | .57 to .64 | .52 to .57 |
| Social inclusion | .60 to .72 | .61 to .74 | .43 to .44 |
| Rights | .59 to .68 | .48 to .83 | .41 to .50 |
| Emotional well-being | .60 to .82 | .69 to .72 | .46 to .52 |
| Physical well-being | .43 to .72 | .74 to .89 | .47 to .50 |
| Material well-being | .57 to .72 | .67 to .81 | .43 to .60 |
| Second-order factors | |||
| Independence | .32 to .47 | .77 to .84 | .50 to .53 |
| Social Participation | .45 to .54 | .69 to .80 | .60 to .69 |
| Well-being | .37 to .41 | .57 to .67 | .59 to 6.2 |
Note. GFI: Goodness of Fit Index; AGFI: Adjusted Goodness of Fit Index; BBNFI: Bentler Bonnet Normed Fit Index; BBNNFI: Bentler Bonnet Non Normed Fit Index; CFI: Comparative Fit Index; TLI: Tucker Lewis Index; SRMR: Standardized Root Mean Standard Residual; CI: Confidence Interval; AIC: Akaike Information Criteria; BIC: Bayesian Information Criteria.
All significant (p<.001)
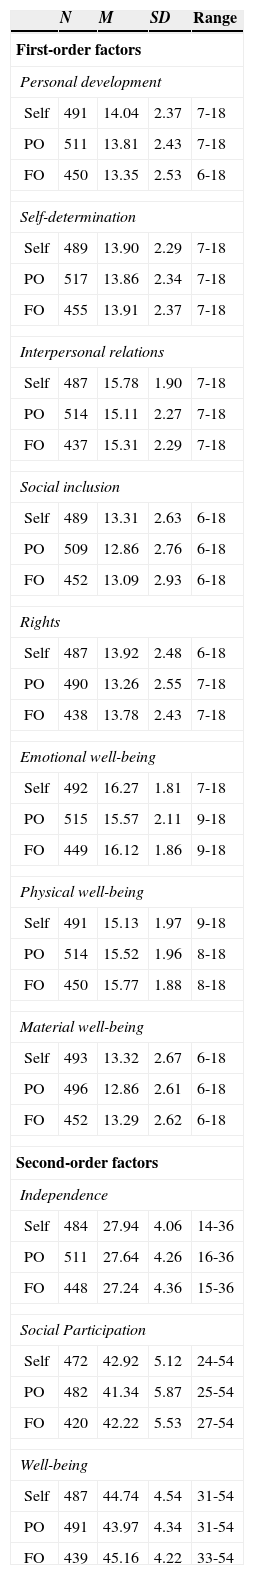
Also, we obtained the final summations for every factor and source of information. The distributions that were observed for every factor are shown in Table 3 for first- and second-order factors.
Descriptive data of first and second-order factors.
| N | M | SD | Range | |
|---|---|---|---|---|
| First-order factors | ||||
| Personal development | ||||
| Self | 491 | 14.04 | 2.37 | 7-18 |
| PO | 511 | 13.81 | 2.43 | 7-18 |
| FO | 450 | 13.35 | 2.53 | 6-18 |
| Self-determination | ||||
| Self | 489 | 13.90 | 2.29 | 7-18 |
| PO | 517 | 13.86 | 2.34 | 7-18 |
| FO | 455 | 13.91 | 2.37 | 7-18 |
| Interpersonal relations | ||||
| Self | 487 | 15.78 | 1.90 | 7-18 |
| PO | 514 | 15.11 | 2.27 | 7-18 |
| FO | 437 | 15.31 | 2.29 | 7-18 |
| Social inclusion | ||||
| Self | 489 | 13.31 | 2.63 | 6-18 |
| PO | 509 | 12.86 | 2.76 | 6-18 |
| FO | 452 | 13.09 | 2.93 | 6-18 |
| Rights | ||||
| Self | 487 | 13.92 | 2.48 | 6-18 |
| PO | 490 | 13.26 | 2.55 | 7-18 |
| FO | 438 | 13.78 | 2.43 | 7-18 |
| Emotional well-being | ||||
| Self | 492 | 16.27 | 1.81 | 7-18 |
| PO | 515 | 15.57 | 2.11 | 9-18 |
| FO | 449 | 16.12 | 1.86 | 9-18 |
| Physical well-being | ||||
| Self | 491 | 15.13 | 1.97 | 9-18 |
| PO | 514 | 15.52 | 1.96 | 8-18 |
| FO | 450 | 15.77 | 1.88 | 8-18 |
| Material well-being | ||||
| Self | 493 | 13.32 | 2.67 | 6-18 |
| PO | 496 | 12.86 | 2.61 | 6-18 |
| FO | 452 | 13.29 | 2.62 | 6-18 |
| Second-order factors | ||||
| Independence | ||||
| Self | 484 | 27.94 | 4.06 | 14-36 |
| PO | 511 | 27.64 | 4.26 | 16-36 |
| FO | 448 | 27.24 | 4.36 | 15-36 |
| Social Participation | ||||
| Self | 472 | 42.92 | 5.12 | 24-54 |
| PO | 482 | 41.34 | 5.87 | 25-54 |
| FO | 420 | 42.22 | 5.53 | 27-54 |
| Well-being | ||||
| Self | 487 | 44.74 | 4.54 | 31-54 |
| PO | 491 | 43.97 | 4.34 | 31-54 |
| FO | 439 | 45.16 | 4.22 | 33-54 |
Note. Self: Self-report; PO: Professional's Observation; FO: Family member's Observation.
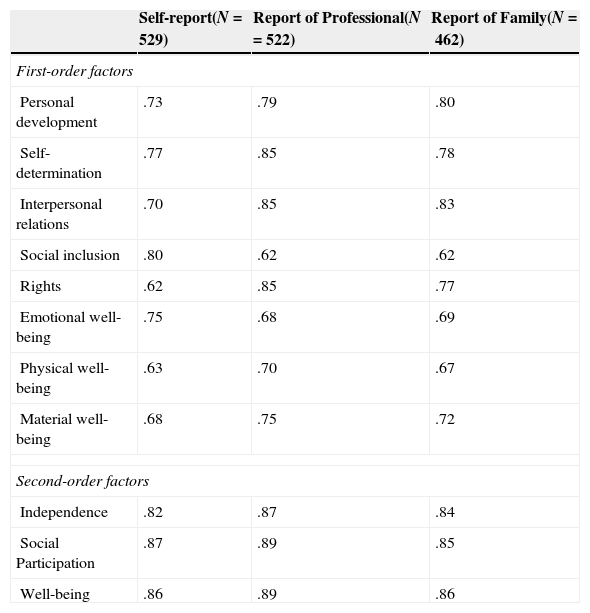
In order to estimate the reliability in terms of internal consistency, Cronbach's α was used for every factor and source of information. Naturally, in this case, the results of the values should be considered as merely descriptive, since the POS is hetero-administered for all the informants and it would therefore not be strictly an internal consistency estimation. Results from this analysis are shown in Table 4.
Cronbach's α values per every factor and source of information.
| Self-report(N=529) | Report of Professional(N=522) | Report of Family(N=462) | |
|---|---|---|---|
| First-order factors | |||
| Personal development | .73 | .79 | .80 |
| Self-determination | .77 | .85 | .78 |
| Interpersonal relations | .70 | .85 | .83 |
| Social inclusion | .80 | .62 | .62 |
| Rights | .62 | .85 | .77 |
| Emotional well-being | .75 | .68 | .69 |
| Physical well-being | .63 | .70 | .67 |
| Material well-being | .68 | .75 | .72 |
| Second-order factors | |||
| Independence | .82 | .87 | .84 |
| Social Participation | .87 | .89 | .85 |
| Well-being | .86 | .89 | .86 |
The values that resulted from this analysis correspond to appropriate values for most of the factors, particularly for the second-order factors.
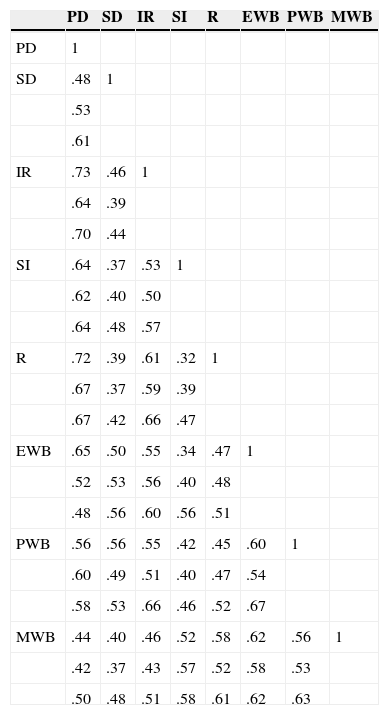
Finally, Pearson's correlation values were estimated from the values of every factor (first- and second-order), and these values were considered to be continuous functions. Results shown in Tables 5 and 6 point to there being a degree of dependence among the factors, which is similar to what the model proposed.
Correlations between first-order factors.
| PD | SD | IR | SI | R | EWB | PWB | MWB | |
|---|---|---|---|---|---|---|---|---|
| PD | 1 | |||||||
| SD | .48 | 1 | ||||||
| .53 | ||||||||
| .61 | ||||||||
| IR | .73 | .46 | 1 | |||||
| .64 | .39 | |||||||
| .70 | .44 | |||||||
| SI | .64 | .37 | .53 | 1 | ||||
| .62 | .40 | .50 | ||||||
| .64 | .48 | .57 | ||||||
| R | .72 | .39 | .61 | .32 | 1 | |||
| .67 | .37 | .59 | .39 | |||||
| .67 | .42 | .66 | .47 | |||||
| EWB | .65 | .50 | .55 | .34 | .47 | 1 | ||
| .52 | .53 | .56 | .40 | .48 | ||||
| .48 | .56 | .60 | .56 | .51 | ||||
| PWB | .56 | .56 | .55 | .42 | .45 | .60 | 1 | |
| .60 | .49 | .51 | .40 | .47 | .54 | |||
| .58 | .53 | .66 | .46 | .52 | .67 | |||
| MWB | .44 | .40 | .46 | .52 | .58 | .62 | .56 | 1 |
| .42 | .37 | .43 | .57 | .52 | .58 | .53 | ||
| .50 | .48 | .51 | .58 | .61 | .62 | .63 |
Note. First value: Self-report Model; Second value: Family Model; and Third Value: Professional Model. All values (p<.001).
PD= Personal Development, SD= Self-Determination, IR= Interpersonal Relations, SI= Social Inclusion, R=Rights, EWB= Emotional Well-Being, PWB= Physical Well-Being, MWB= Material Well-Being
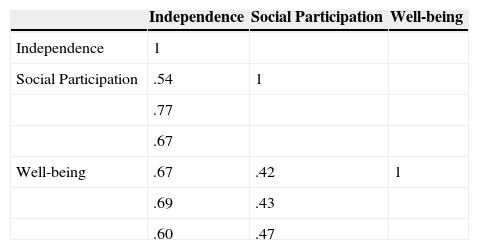
Correlations between second-order factors.
| Independence | Social Participation | Well-being | |
|---|---|---|---|
| Independence | 1 | ||
| Social Participation | .54 | 1 | |
| .77 | |||
| .67 | |||
| Well-being | .67 | .42 | 1 |
| .69 | .43 | ||
| .60 | .47 |
Note. First value: Self-report Model; Second value: Family Model; and Third Value: Professional Model. All values (p<.001)
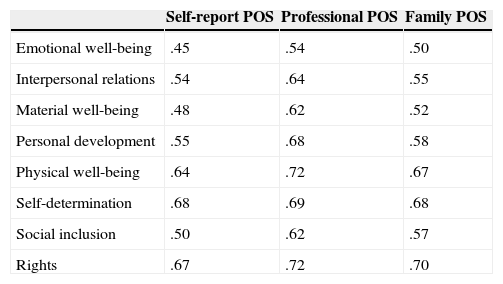
In order to estimate the convergent validity between the POS and Gencat, Pearson's correlations were obtained between the direct values of the different factors that were defined in both scales in order to verify their concurrence according to the general criteria (Izquierdo, Olea, & Abad, 2014). Global index values were ignored because they were not the object of this analysis. Table 7 shows the correlation values and distinguishes between the different POS sources by providing the Bonferroni correction for their significance in order to reduce the family wise error rate.
Correlation coefficients between POS and Gencat factors.
| Self-report POS | Professional POS | Family POS | |
|---|---|---|---|
| Emotional well-being | .45 | .54 | .50 |
| Interpersonal relations | .54 | .64 | .55 |
| Material well-being | .48 | .62 | .52 |
| Personal development | .55 | .68 | .58 |
| Physical well-being | .64 | .72 | .67 |
| Self-determination | .68 | .69 | .68 |
| Social inclusion | .50 | .62 | .57 |
| Rights | .67 | .72 | .70 |
Note. All significant (p<.001) with Bonferroni correction.
In this study, the psychometric properties for the three informers of the POS were examined. This measurement instrument assesses QoL in adults with ID in terms of personal outcomes. The reliability study found a proper internal consistency for the items for every factor and respondent. The values for the second-order factors are slightly higher than those in the original scale, particularly for the Independence factor, both in the self-report and in the direct observation (Claes, Vandevelde et al., 2012).
In regard to the validity study, construct validity and convergent validity were examined. In regard to the CFA, we can assume that the model that adjusts better to the construct is that of the professionals’ reports, although the models for people with ID and family members are also considered to be appropriate. The results were consistent with previous studies in regard to the multi-dimensionality of the QoL construct (Jenaro et al., 2005; Schalock et al., 2005) and the presence of three second-order factors (Wang et al., 2010).
In regard to convergent validity, as previously explained, the Gencat Scale was used because it was also used in the validation of the first original POS version. However, although the Gencat assesses QoL from the professional's objective perspective, first-order factors were analyzed for the three kinds of respondents. Results showed an acceptable correlation with the measurement criterion that this adapted scale intends to evaluate.
Regarding this psychometric study, the authors believe that two points need to be highlighted. Firstly, as seen in the reliability and validity results for the self-report, we have a good measurement instrument that allows for the direct participation of the individual with ID in the assessment of their QoL. These results were obtained with appropriate representation from people with ID due to the instructions for the proper application of the scale were strictly followed and the guidelines for the assessment of QoL were considered (Claes et al., 2010). Therefore, we agree with Claes, Vandevelde et al. (2012) that if the people with ID can speak for themselves, the self-report should be directly answered by them. If the individual with ID has communication problems, this part being answered by a proxy (professional or family member) cannot be justified because it was not created for this purpose. Moreover, we have to consider that, in relation to the degree of agreement among the different POS respondents, the correlations between self-reports and the information from the other respondents may be low (Claes, Vandevelde et al., 2012). Therefore, in those situations when self-reports cannot be assessed, applying the report of others is proposed, which has satisfactory psychometric properties, both for professional and family versions.
Secondly, we assert that we have an instrument with a sufficient amount of psychometric qualities, for the self-report and for the report of professional and family member. It allows us to assess QoL from subjective and objective perspectives that are proposed in relevant literature in this field (Schalock & Verdugo, 2002; Schalock et al., 2007). Thus, the organizations in Spain that rely on this QoL model and work for the development of ISP have a valid and reliable instrument at their disposal, which will allow them to assess the impact of these plans on the expected personal outcomes.
This study has a few limitations. Firstly, the organizations that participated from the different autonomous communities are not at the same levels in terms of their knowledge and application of Schalock & Verdugo's (2002) QoL model and their guidelines that are defined in relation to the support paradigm (Schalock et al., 2008; Thompson et al., 2009). Thus, although some training was carried out in regard to the theoretical background and administration of the POS, the degree of comprehension of the items may have been influenced the study, depending on the organization's degree of involvement in using the QoL model and their commitment to promoting social inclusion. A second limitation lies in the fact that most of the participants with ID live with their families, and there is a low presence of those who live in supervised homes or independent homes. This situation is due to the fact that for this study, we needed the participation of the family, and indeed, the organizations have had more access to those parents who live with the individual with ID. In some cases, when the individual with ID lived in a supervised home, the legal tutor was considered to be a family member because their role was similar to that of a family member. Nevertheless, this was not the case for all of the cases because these cases were specific to participants who did not have a family or had parents who were rather old. In regard to the last limitation, we highlight the low participation of people with severe and/or profound ID due to their limitations in comprehension and communication. It is true that the administration of this scale through an interview has increased the participation of people with high comprehension difficulties; however, the representation of such people was low in our study. Otherwise, the use of the Classical Theory of Test can be a methodological and technical limitation in order to obtain more adjusted results in terms of generalizability so, for this type of instrument, it may be an interesting approach according to Rupp (2013) propositions.
Likewise, the results of this study provide new ways and opportunities for future research. Firstly, the Spanish version of the POS can be used to examine the degree of agreement between the self-report and the information from professional and family and, in this sense, to advance the knowledge of the significance of QoL assessment (Balboni et al., 2013; Claes, Vandevelde et al., 2012; Gómez, Arias, Verdugo, & Navas, 2012). Secondly, some studies show that personal outcomes are influenced by specific support strategies, environmental factors and personal characteristics (Claes, Van Hove, Vandevelde, van Loon, & Schalock, 2012). Thus, the Spanish POS can be used to assess the impact of support strategies that are provided by services such as was done with the original version (Claes, Van Hove et al., 2012) and to adopt improvement measures (van Loon et al., 2013). Finally, it is becoming more necessary to know the relationship between QoL and certain personal conditions of disability. We have to consider whether the dimensions, subdimensions, and indicators that are proposed in an evaluation system are equally relevant for all of the people with ID or whether there should be different or more detailed specifications (Petry, Maes, & Vlaskamp, 2009; Verdugo, Gómez, Arias, Navas, & Schalock, 2014). It is important to note that a more thorough analysis is needed of the convergence among sources of information and, even more, the divergence among them. That divergence may be very informative in evaluation and systematization processes when using the Spanish version of the POS. Some proposals and indexes have been put forward for this type of situation (Carbó-Carreté, Guàrdia-Olmos, & Giné, 2015) which we should also apply to this scale as future complementary analysis research.
FundingThis research has been funded by the Ministerio de Educación y Ciencia de España (DEP2005-00202-C04-03/ACTI).