


Background/Objective: This study aims to characterize the differences on the short-term temporal network dynamics of the undirected and weighted whole-brain functional connectivity between healthy aging individuals and people with mild cognitive impairment (MCI). The Network Change Point Detection algorithm was applied to identify the significant change points in the resting-state fMRI register, and we analyzed the fluctuations in the topological properties of the sub-networks between significant change points. Method: Ten MCI patients matched by gender and age in 1:1 ratio to healthy controls screened during patient recruitment. A neuropsychological evaluation was done to both groups as well as functional magnetic images were obtained with a Philips 3.0T. All the images were preprocessed and statistically analyzed through dynamic point estimation tools. Results: No statistically significant differences were found between groups in the number of significant change points in the functional connectivity networks. However, an interaction effect of age and state was detected on the intra-participant variability of the network strength. Conclusions: The progression of states was associated to higher variability in the patient's group. Additionally, higher performance in the prospective and retrospective memory scale was associated with higher median network strength.
Antecedentes/Objetivo: Este estudio tiene como objetivo caracterizar las diferencias en la red dinámica de conectividad funcional no dirigida entre un grupo de personas sanas y otro con deterioro cognitivo leve. Se aplicó un algoritmo de detección de puntos de cambio en redes complejas para identificarlos en registros fMRI en estado de reposo y se analizaron las fluctuaciones en las propiedades topológicas de las subredes entre puntos de cambio significativos. Método: Diez pacientes emparejados por sexo y edad en proporción 1:1 a controles sanos. Se realizó una evaluación neuropsicológica a ambos grupos y se obtuvieron imágenes funcionales con un Philips Ingenia 3.0T. Todas las imágenes fueron preprocesadas y analizadas estadísticamente a través de herramientas de estimación dinámica de puntos. Resultados: No se encontraron diferencias estadísticamente significativas entre ambos grupos en el número de puntos de cambio en las redes de conectividad funcional. Se detectó un efecto de interacción entre edad y la variabilidad intra-sujeto en algunos indicadores de complejidad (strength) de la red dinámica. Conclusiones: La progresión de la conectividad se asoció a una mayor variabilidad en el grupo de pacientes. Además, se puede asociar un mayor rendimiento en la escala de memoria prospectiva y retrospectiva con un mayor valor de la mediana de strength de la red.
According to the United Nations world population prospects, people aged 65 or more are the group with the fastest growth rates worldwide and the number of people above 80 years is expected to triple by 2050, although important regionals gaps do exist (United Nations & Department of Economic and Social Affairs, 2019). These demographic trend challenges the health care management of age-associated diseases, such as cancer, neurodegenerative disorders, and dementia; all of which are being addressed from a wide range of scientific fields.
Among age-related disorders, Mild Cognitive Impairment (MCI) is a characterized by self- and hetero-reported cognitive complaints, objective cognitive impairment, preserved independence and functioning in daily activities and the absence of dementia. This diagnostic can often, though not always, become a transition state from preserved cognitive functioning in healthy aging to Alzheimer's Disease (AD) and other types of clinical dementia (Petersen et al., 1999).
In the field of computational neuroscience, increasing efforts have been made to understand the functional and structural effects of MCI in relation to healthy aging and AD. In this regard, differences in functional connectivity or co-activation patterns between brain areas, measured though Blood Oxygen Level Dependent (BOLD) contrast, has been extensively analyzed in both task and resting-state study designs.
Patients with MCI are known to present cortical atrophy, reduced brain activity between the hippocampus and the posterior cingulate cortex and the precuneus region, and increased activity in the Default Mode Networks (DMC) networks during rest (Esposito et al., 2013; Farràs-Permanyer, Guàrdia-Olmos, & Peró-Cebollero, 2015; Kim & Lee, 2013). Also, the decreased Functional Connectivity was found to be more severe in those MCI patients who converted AD (Hafkemeijer, van der Grond, & Rombouts, 2012).
More recently, Sullivan, Anderson, Turner, and Spreng (2019) found an effect of the preservation of the cognitive state on higher interactivity both across hemispheres and between brain regions in healthy older adults when compared to MCI participants. This coactivation increased with age in the healthy group and was associated to higher scores in Mini Mental State Examination (MMSE) in the MCI group.
Increased resting-state Functional Connectivity in the right medial superior frontal gyrus and the left superior parietal gyrus has been associated to lower scores in MMSE in older adults with MCI (Zhang et al., 2019). These authors also found an increased functional connectivity between the right medial superior frontal gyrus and left parietal lobe in MCI participants when compared to healthy controls.
Interestingly, a disconnection syndrome – with decreased network centrality in limbic areas, the default mode network, dorsal attention network, and frontoparietal control network – appears to coexist with compensatory mechanisms in MCI individuals (Wang et al., 2019), which may alleviate the effects of cognitive decline.
Graph theoretical approaches have been used with classification algorithms to identify network features that could discriminate between healthy aging and MCI, as well as between those patients that converted to AD and those who remained stable during the study period (Du, Fu, & Calhoun, 2018; Hojjati, Ebrahimzadeh, Khazaee, & Babajani-Feremi, 2017; Khazaee, Ebrahimzadeh, & Babajani-Feremi, 2016). Using classification techniques, these studies achieved classification accuracy above 70%.
Compared to healthy controls, the Functional Connectivity whole-brain networks of MCI patients showed decreased global and local efficiency, as well as decreased connection strength between peripheral network nodes (Zhao et al., 2017).
In the last years, there has been an increasing interest in dynamic or time-varying Functional Connectivity (dFC), where the Functional Connectivity between brain regions along the resting-state fMRI (rs-fMRI) register length is expected to be non-constant. However, applications of these approaches to the study of MCI are still scarce.
In a recent study, the amplitude of low-frequency fluctuations at voxel level was analyzed using a sliding window approach and they found altered regional patterns in terms of coefficient of variations in MCI, related to control participants. Those patients showed more spatially distributed and varied low-frequency fluctuations in the parietal and temporal lobes (Wang et al., 2019). Using multiscale entropy in healthy controls and patients with MCI and Alzheimer's disease (Niu et al., 2018) found significant reductions in the complexity of the BOLD signals in the latter groups when compared to control participants, which was associated to the degree of cognitive decline.
Amnesic MCI individuals spent more time in one of four identified resting FC states in comparison to healthy older adults (Brenner et al., 2018), which suggests a reduction in connectivity dynamics. This results are coherent with the reduced metastability from healthy to MCI and AD found in Córdova-Palomera et al. (2017); understanding metastability as the dynamic and flexible changes that is characteristic of the optimal neural activity at rest.
The inclusion of the temporal dynamics in classification algorithms seems to be a promising contribution. For instance, in Wee, Yang, Yap, and Shen (2016), the Functional Connectivity network of MCI patients was characterized by lower small-world coefficient (more random features in the network), lower transitivity and higher characteristic path length in MCI, compared to healthy control individuals. According to these authors, the inclusion of temporal dynamics of these whole brain connectivity measures improved the performance of their classification algorithms.
All things considered, we aimed to assess the differences between MCI and matched control individuals in resting-state network properties through a dynamic functional connectivity approach. First, we identified rs-fMRI states in each individual through the network change point detection algorithm (Cribben & Yu, 2017) and we tested the differences between groups in the number of change points. Secondly, we aimed to analyze the effects of age and state on network strength, characteristic path length, transitivity and small-worldness of each subnetwork. Finally, we described the community structure of each state in each participant.
MethodParticipantsData analyzed in this study was previously published in a work on static functional connectivity by Farràs-Permanyer et al. (2019). Ten Mexican patients with MCI diagnosis were recruited in collaboration with Laboratorio Clínico, Centro Integral de Diagnóstico Médico of Guadalajara's Grupo Río Center (Jalisco, Mexico), Instituto de Neurociencias de la Universidad de Guadalajara (Jalisco, Mexico) and Universitat de Barcelona (Barcelona, Spain). All patients met (Petersen et al., 1999) criteria for memory complaints, objective memory impairments, normal general cognitive function, and unaffected daily life activities, and were assessed through Mini-Mental State Examination (MMSE), the Prospective and Retrospective Memory Questionnaire (PRMQ), the Geriatric Depression Scale (GDS), The Pfeffer Activity Questionnaire (PAQ), the Clinical Dementia Rate (CDR), the Boston Naming Test (BNT) and the NEUROPSI (Attention and Memory).
Patients were matched in sex, age group (less than 65, from 66 to 80, more than 80) and education level (up to 6 years, from 6 to 12 years, more than 12 years) in 1:1 ratio to healthy controls screened during patient recruitment.
Patients were excluded from the study in presence of illiteracy, inability to understand the protocol or undergo neuropsychological tests, relevant psychiatric disorders, history of cerebrovascular accidents, alcohol or substance abuse, MRI incompatibilities or advanced cognitive deterioration, dementia or other neurodegenerative diseases other than MCI. Although 27 participants were initially included in the study, three participants in the control group and four participants in the MCI group had to be discarded because the absolute root mean square movement in their rs-fMRI sequences was above half a voxel (Power, Barnes, Snyder, Schlaggar, & Petersen, 2012). Therefore, the remaining 10 participants in the MCI group and 10 participants in the control group were finally analyzed.
Written informed consent was obtained from every individual prior to taking part in the study, according with the Declaration of Helsinki and by the institutional ethics committee. Moreover, this procedure was approved by the Bioethical Committee of the University of Barcelona (03/10/2017).
InstrumentsNeuropsychological assessment was performed in two stages. During a screening stage, participants were administered the Mini-Mental State Examination (MMSE; Folstein, Folstein, & McHugh, 1975) to assess their time and place orientation, attention, calculation, and language and visual construction, while the Prospective and Retrospective Memory Questionnaire (PRMQ; Smith, Della Sala, Logie, & Maylor, 2000) was used to detect prospective and retrospective memory slips in everyday life. More specifically, we used the Spanish adaptation of the MMSE (Blesa et al., 2001) with the adjustments for the Mexican population proposed by Villaseñor-Cabrera, Guàrdia-Olmos, Jiménez-Maldonado, Rizo-Curiel, and Peró-Cebollero (2010), and the Mexican adaptation of the PRMQ (González-Ramírez & Mendoza-González, 2011).
During this stage, the Pfeffer Activity Questionnaire (PAQ; Pfeffer, Kurosaki, Harrah, Chance, & Filos, 1982) was also administered to evaluate their performance of daily activities, if a relative of the participant was also present.
In a second stage, those individuals who were willing to continue their participation in the study went through a complete neuropsychological evaluation that included the administration of the Boston Naming Test (BNT) to assess the language ability (Fernández & Fulbright, 2015), NEUROPSI for memory and attention (Ostrosky-Solís, Ardila, & Rosselli, 1999) and Geriatric Depression Scale (GDS; Brink et al., 1982; Fernández-San Martín et al., 2002).
MR image acquisition and preprocessing protocol has been previously described in Farràs-Permanyer et al. (2019). Functional magnetic images were obtained with a Philips Ingenia 3.0-T system at the Laboratorio Clínico, Centro Integral de Diagnóstico Médico of Guadalajara's Grupo Rio Center (Jalisco, Mexico). A T1 weighted Turbo Field Echo (TFE) structural image was obtained for each subject with a 3-dimensional protocol (repetition time [TR]=2800ms, echo time [TE]=6.3ms, 170 slices, and field of view [FOV]=240×240×170) with sagittal plane acquisition. A functional image T2* weighted (BOLD) was obtained (TR=2000ms, TE=30ms, FOV=230×230×160, voxel size=2.4×2.4×4mm, 29 slices) with transverse plane acquisition.
Structural image was preprocessed using an FSL (FMRIB Software Library v5.0) pipeline adapted under authorization from the authors (Diez et al., 2015), with its parameters adjusted to fit our data, including a motion correction procedure to solve the undesired head's movements in the fMRI sessions according to the same procedure used in Calderón et al. (2020). All non-brain tissue was removed to obtain an anatomic brain mask that would be used to parcel and segment the T1 data images. Moreover, T1 images were reoriented and a resampled AC-PC aligned image with 6 degrees of freedom and all structural data images were corregistered to the normalized space using the Montreal Neurological Institute (MNI) reference brain (Ashburner & Friston, 1999). In this case, the use of a standard atlas such as MNI can be a source of uncontrolled error. To avoid this possible effect, it was studied whether normalization in the MCI group with atlas MNI generated different results if normalization based on a DARTEL model was used. Both processes led to the same results, so the MNI atlas was maintained to guarantee replication options. As usual, the preprocess, apart from maximizing the signal-to-noise ratio, eliminates the presence of extracerebral physiological activities, white matter, and Cerebrospinal Fluid. Regarding the use of low and high pass filters for the elimination of outliers, the elimination of participants with excessive movement allowed confirming that the analysis of outliers was unsuccessful since the final frequencies all ranged between 0.1 and 0.8Hz.
Statistical analysisData treatment and statistical analysis of the participants’ demographic and clinical characteristics, as well as their preprocessed fMRI sequences, were performed with R software (version 3.5.0).
Network Change Points in functional connectivity dynamics were detected through NCPD method (Cribben & Yu, 2017) which performs a spectral clustering to extract the network community structure and principal angles are used as the criterion for change points in the network community structure. Statistical significance of the candidate change points is tested with stationary bootstrap. R function for the NCPD method were provided by the authors and used under their authorization.
For each participant we applied the Automated Anatomical Labelling (AAL) atlas to the preprocessed fMRI sequences to obtain time series of 300 time points (TR=2) for 90 cortical and subcortical regions. Network change points were detected for each participant through spectral clustering with 7 expected communities and a minimum distance of 50 time points between candidate change points. Statistical significance of these change points was tested through stationary bootstrap with 1000 iterations and an outlier threshold of α=.05.
Significant change points were used to segment each participant's rs-fMRI time series. In each segment, we computed the network weighted adjacency matrix though the Pearson correlation between the BOLD signal of each pair of ROIs. These matrices were filtered through TMFG algorithm (Massara, Di Matteo, & Aste, 2016) to obtain a sparse weighted graph between each significant change point.
We characterized the topological properties of each individual's Functional Connectivity networks though their network strength, transitivity, characteristic path length, small-worldness and modularity. Differences in these measures were analyzed with mixed linear models with clinical group and time State as a fixed effects and participant cluster as a random effect. Models were adjusted by neuropsychological variables.
In order to account for the difference in scale between the response variable and the continuous predictors, all continuous numerical variables, including the response, were standardized. Therefore, the model estimates must be interpreted in standard scale.
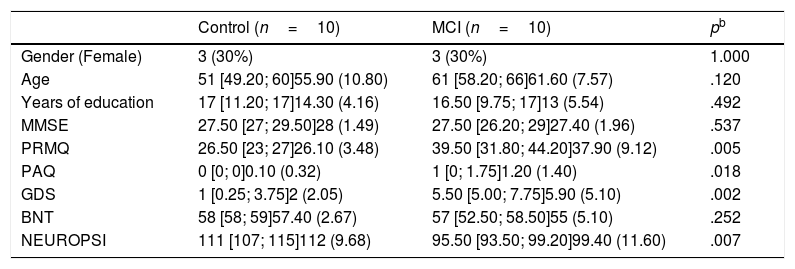
ResultsTen patients were included in each group of the study, 30% were women (Table 1). The median age was 51 (Q1=49.20; Q3=60) in the control group and 61 (Q1=58.20; Q3=66) in the MCI group. Participants in MCI group had a median of 16.50 (Q1=9.75; Q3=17.0) years of education, while those in the control group had a median of 17 (Q1=11.20; Q3=17) years of education.
Demographic and clinical characteristics.a
| Control (n=10) | MCI (n=10) | pb | |
|---|---|---|---|
| Gender (Female) | 3 (30%) | 3 (30%) | 1.000 |
| Age | 51 [49.20; 60]55.90 (10.80) | 61 [58.20; 66]61.60 (7.57) | .120 |
| Years of education | 17 [11.20; 17]14.30 (4.16) | 16.50 [9.75; 17]13 (5.54) | .492 |
| MMSE | 27.50 [27; 29.50]28 (1.49) | 27.50 [26.20; 29]27.40 (1.96) | .537 |
| PRMQ | 26.50 [23; 27]26.10 (3.48) | 39.50 [31.80; 44.20]37.90 (9.12) | .005 |
| PAQ | 0 [0; 0]0.10 (0.32) | 1 [0; 1.75]1.20 (1.40) | .018 |
| GDS | 1 [0.25; 3.75]2 (2.05) | 5.50 [5.00; 7.75]5.90 (5.10) | .002 |
| BNT | 58 [58; 59]57.40 (2.67) | 57 [52.50; 58.50]55 (5.10) | .252 |
| NEUROPSI | 111 [107; 115]112 (9.68) | 95.50 [93.50; 99.20]99.40 (11.60) | .007 |
Although no statistical differences were detected in the distribution of MMSE or BNT scores, statistical differences were found in PRMQ, PAQ, GDS and NEUROPSI. More specifically, MCI participants scored higher in PRMQ, PAQ and GDS, while they showed lower scores in NEUROPSI. Therefore, these scores were incorporated as covariates in the models.
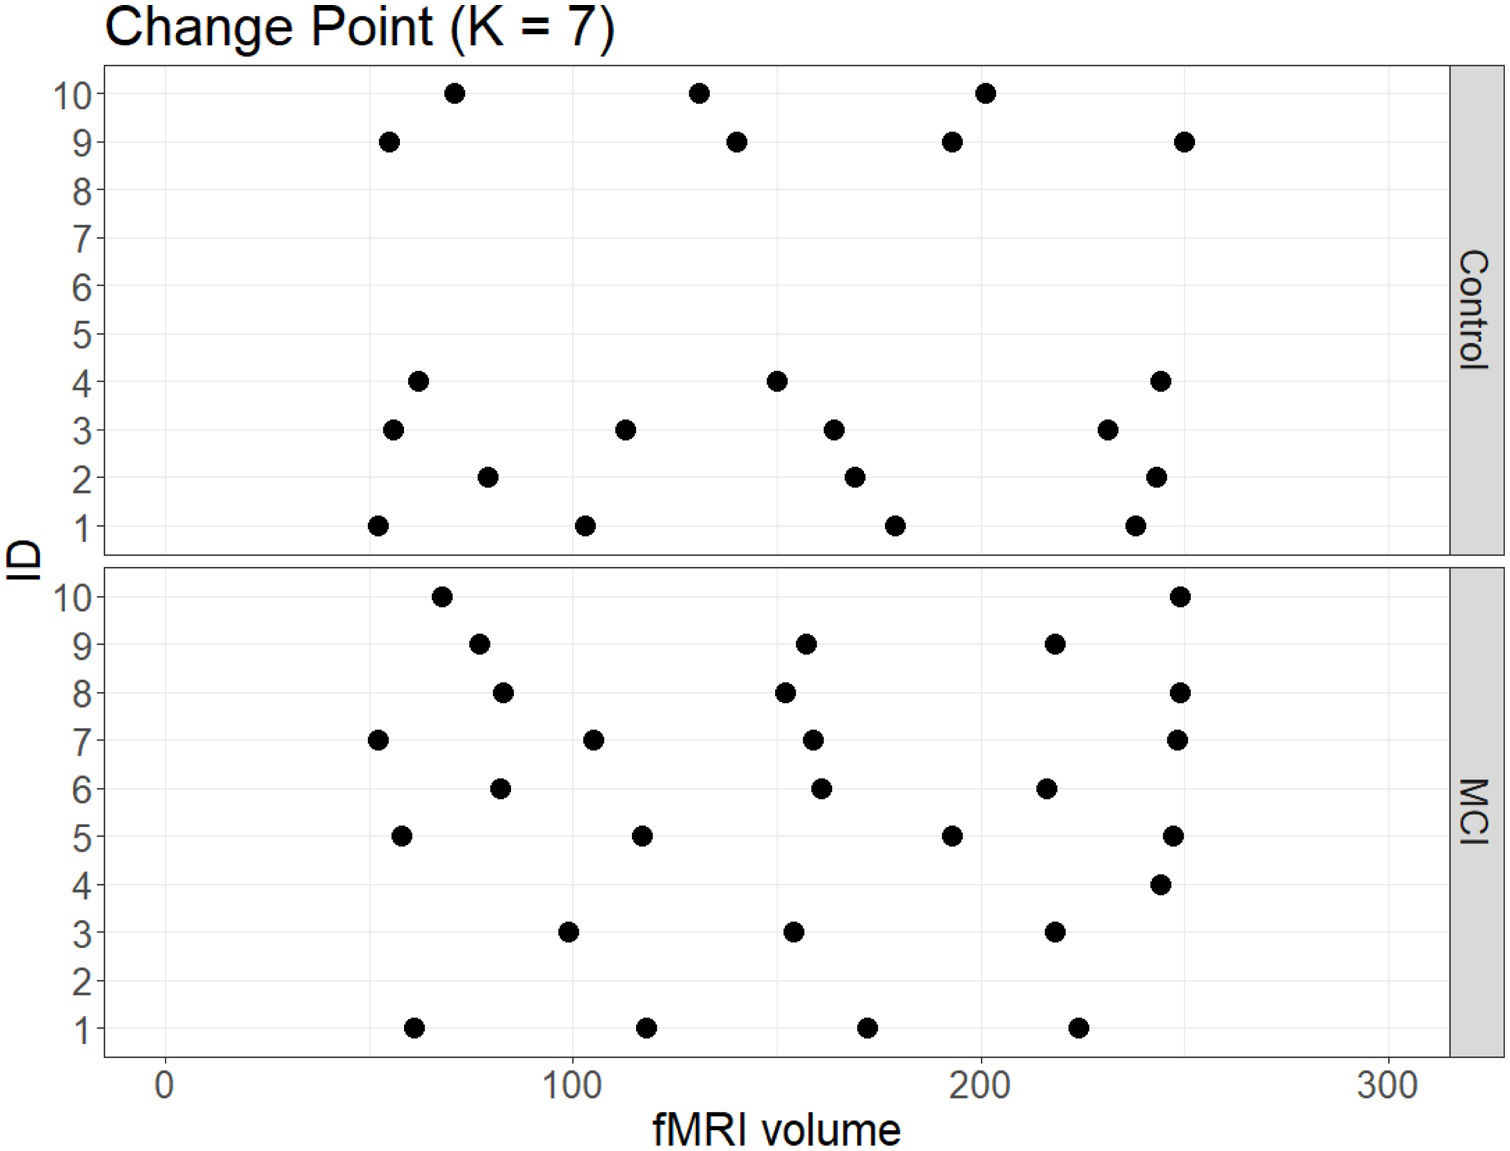
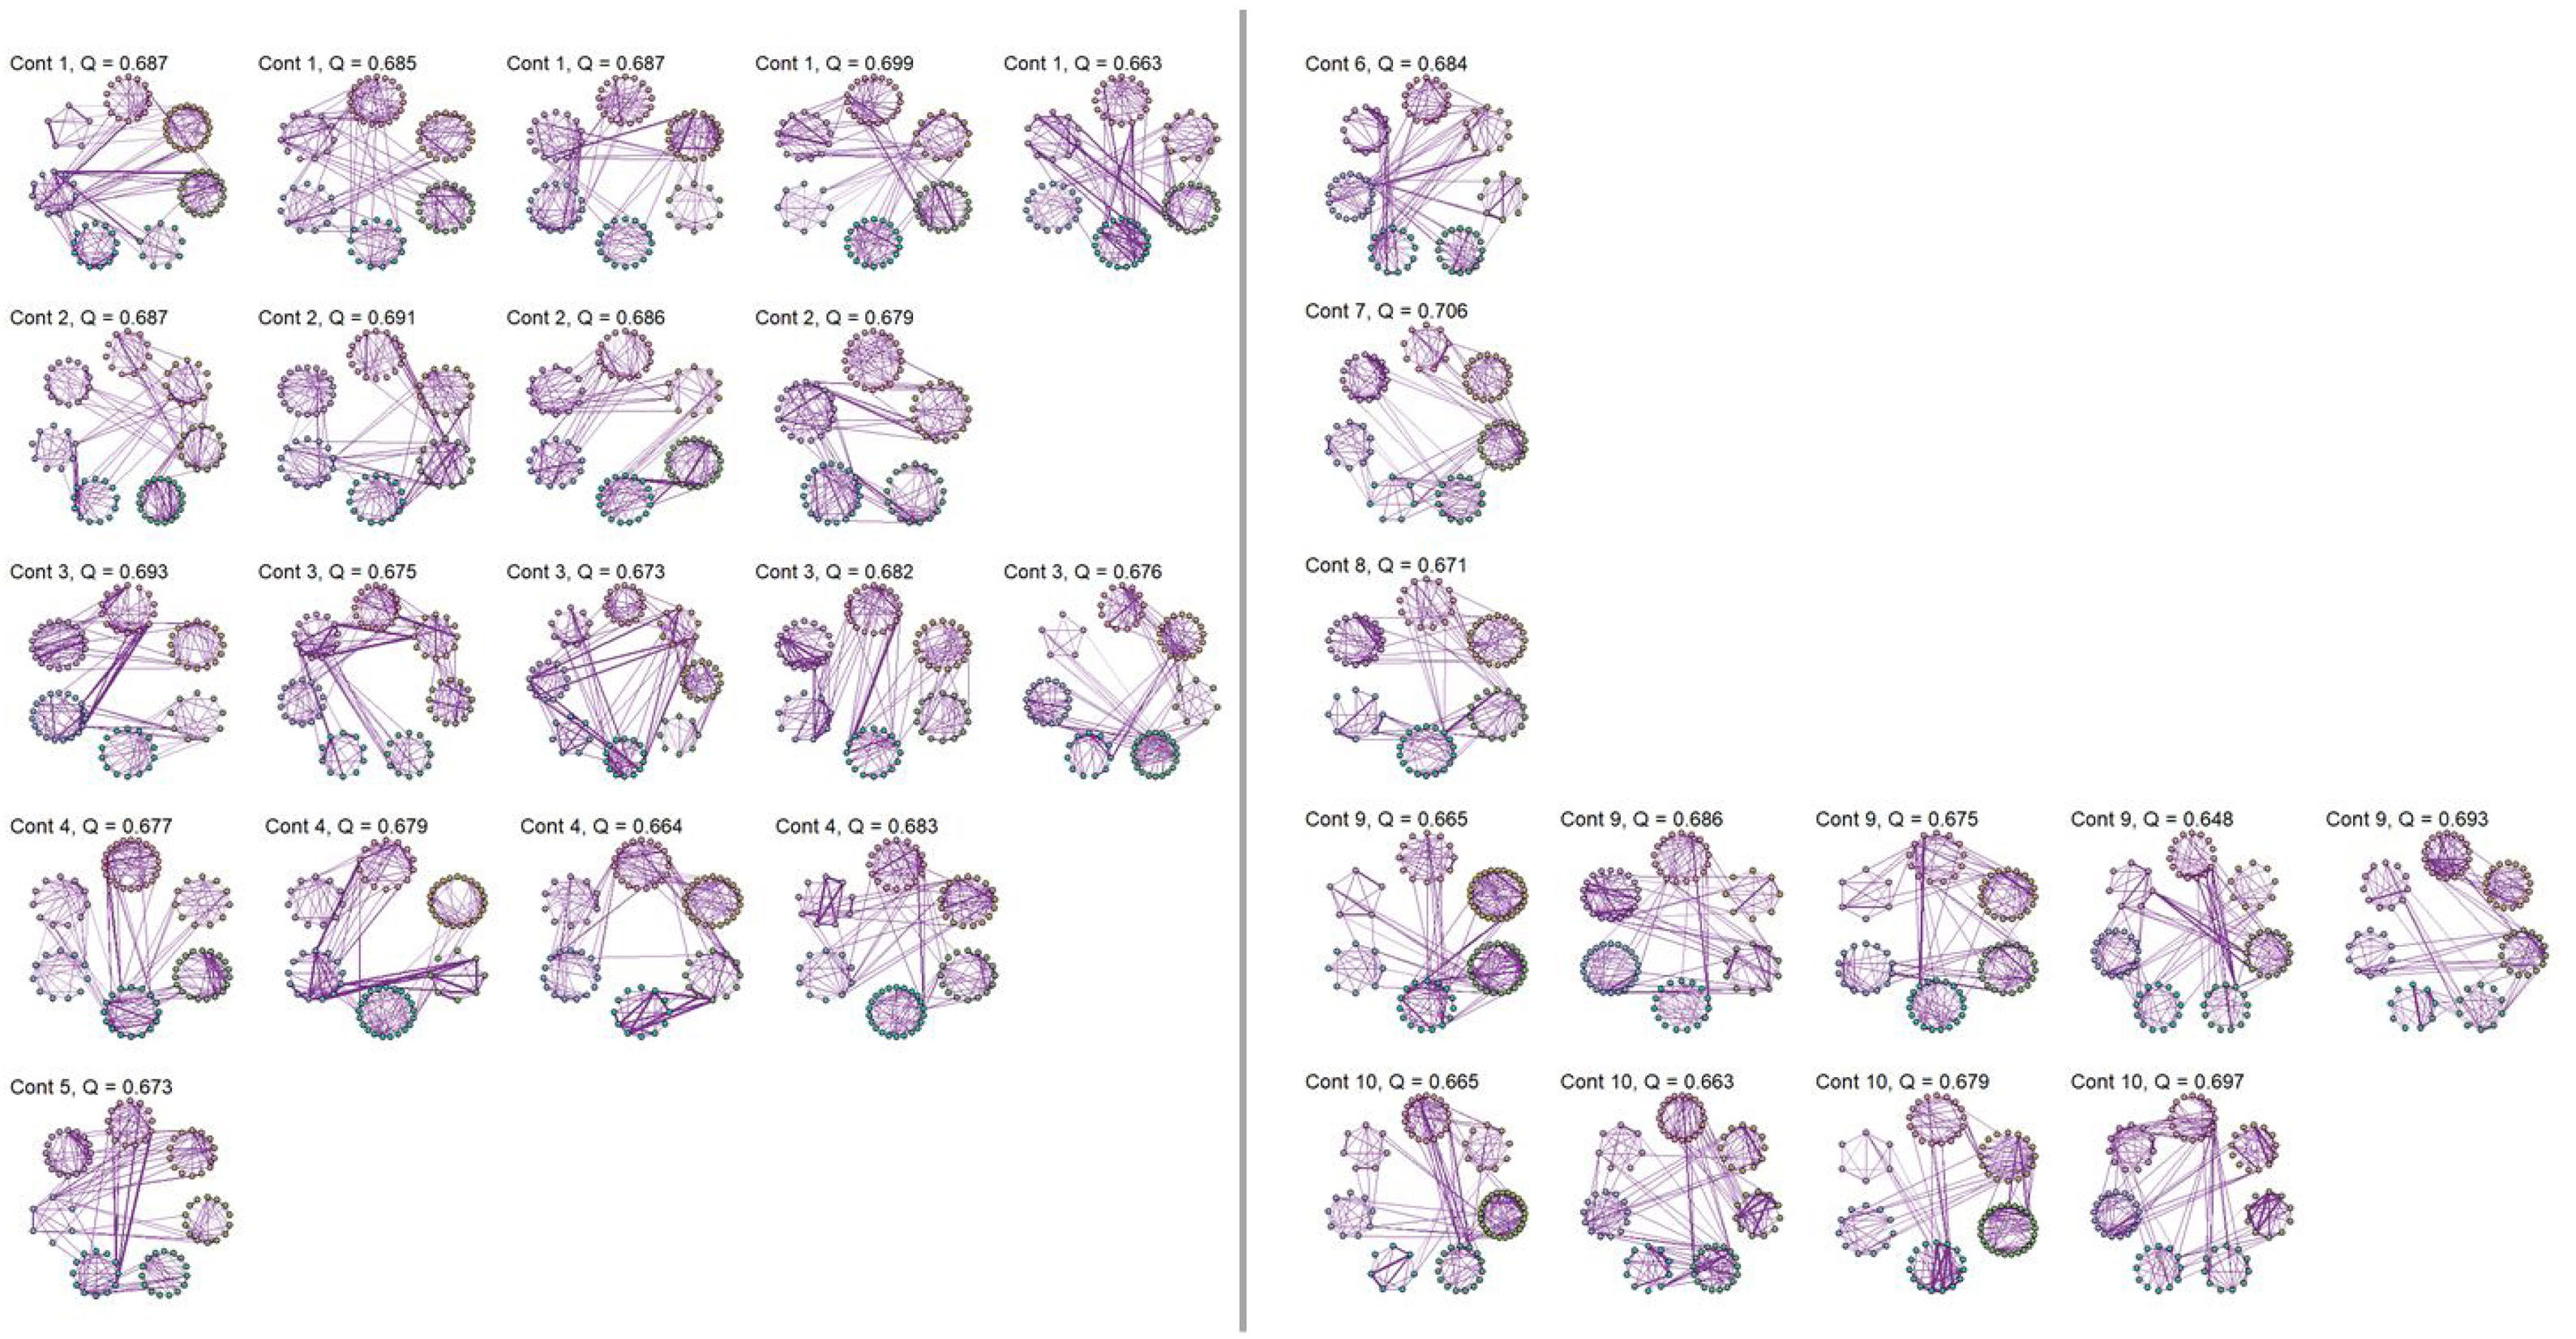
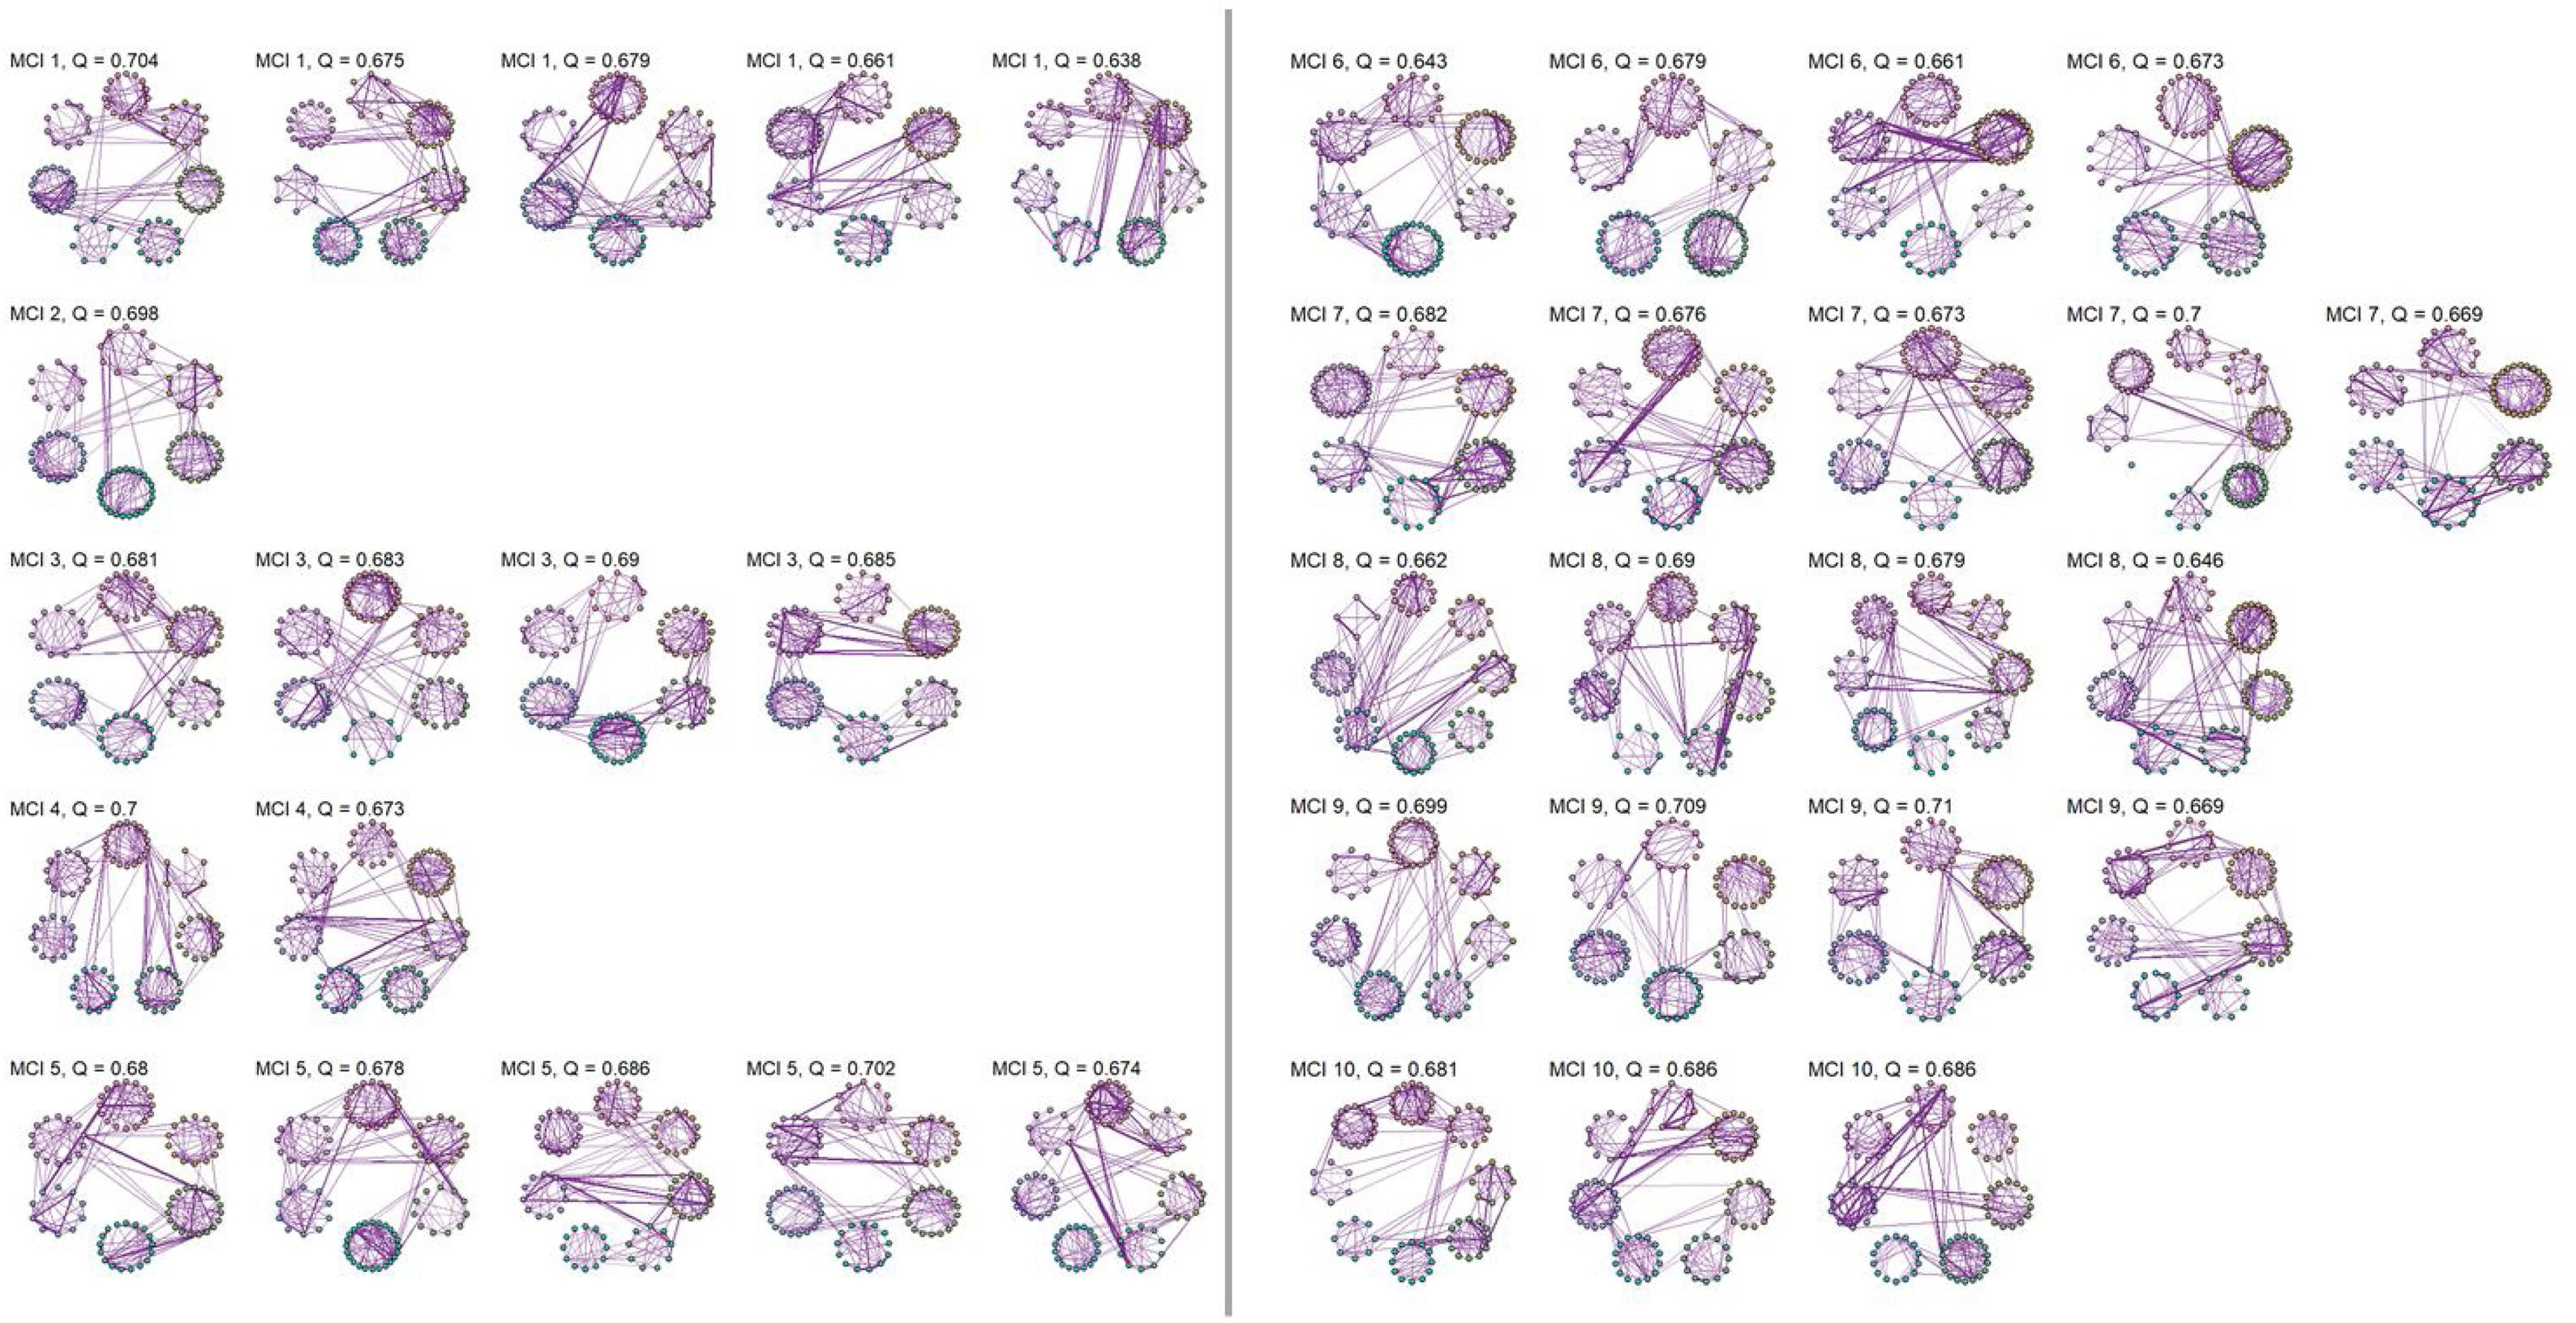
No significant change points were de detected in four participants in the control group and one participant in the MCI group (Figure 1). Additionally, there were no statistical differences between the MCI and controls in the number of change points during the rs-fMRI register, according to Wilcoxon rank sum test (W=42.50, p-value=.581). Figures 2 and 3 show the community structure and the TMFG filtered FC links of the control and MCI patients, respectively. It must be noted that the values of Q were maximized separately for each subnetwork of each participant. Therefore, Q values cannot be directly compared. However, this procedure permits the extraction of the network community structure in relation to the modularity scores, which we assume as stable between change points and allow us to model he network properties of these FC states.


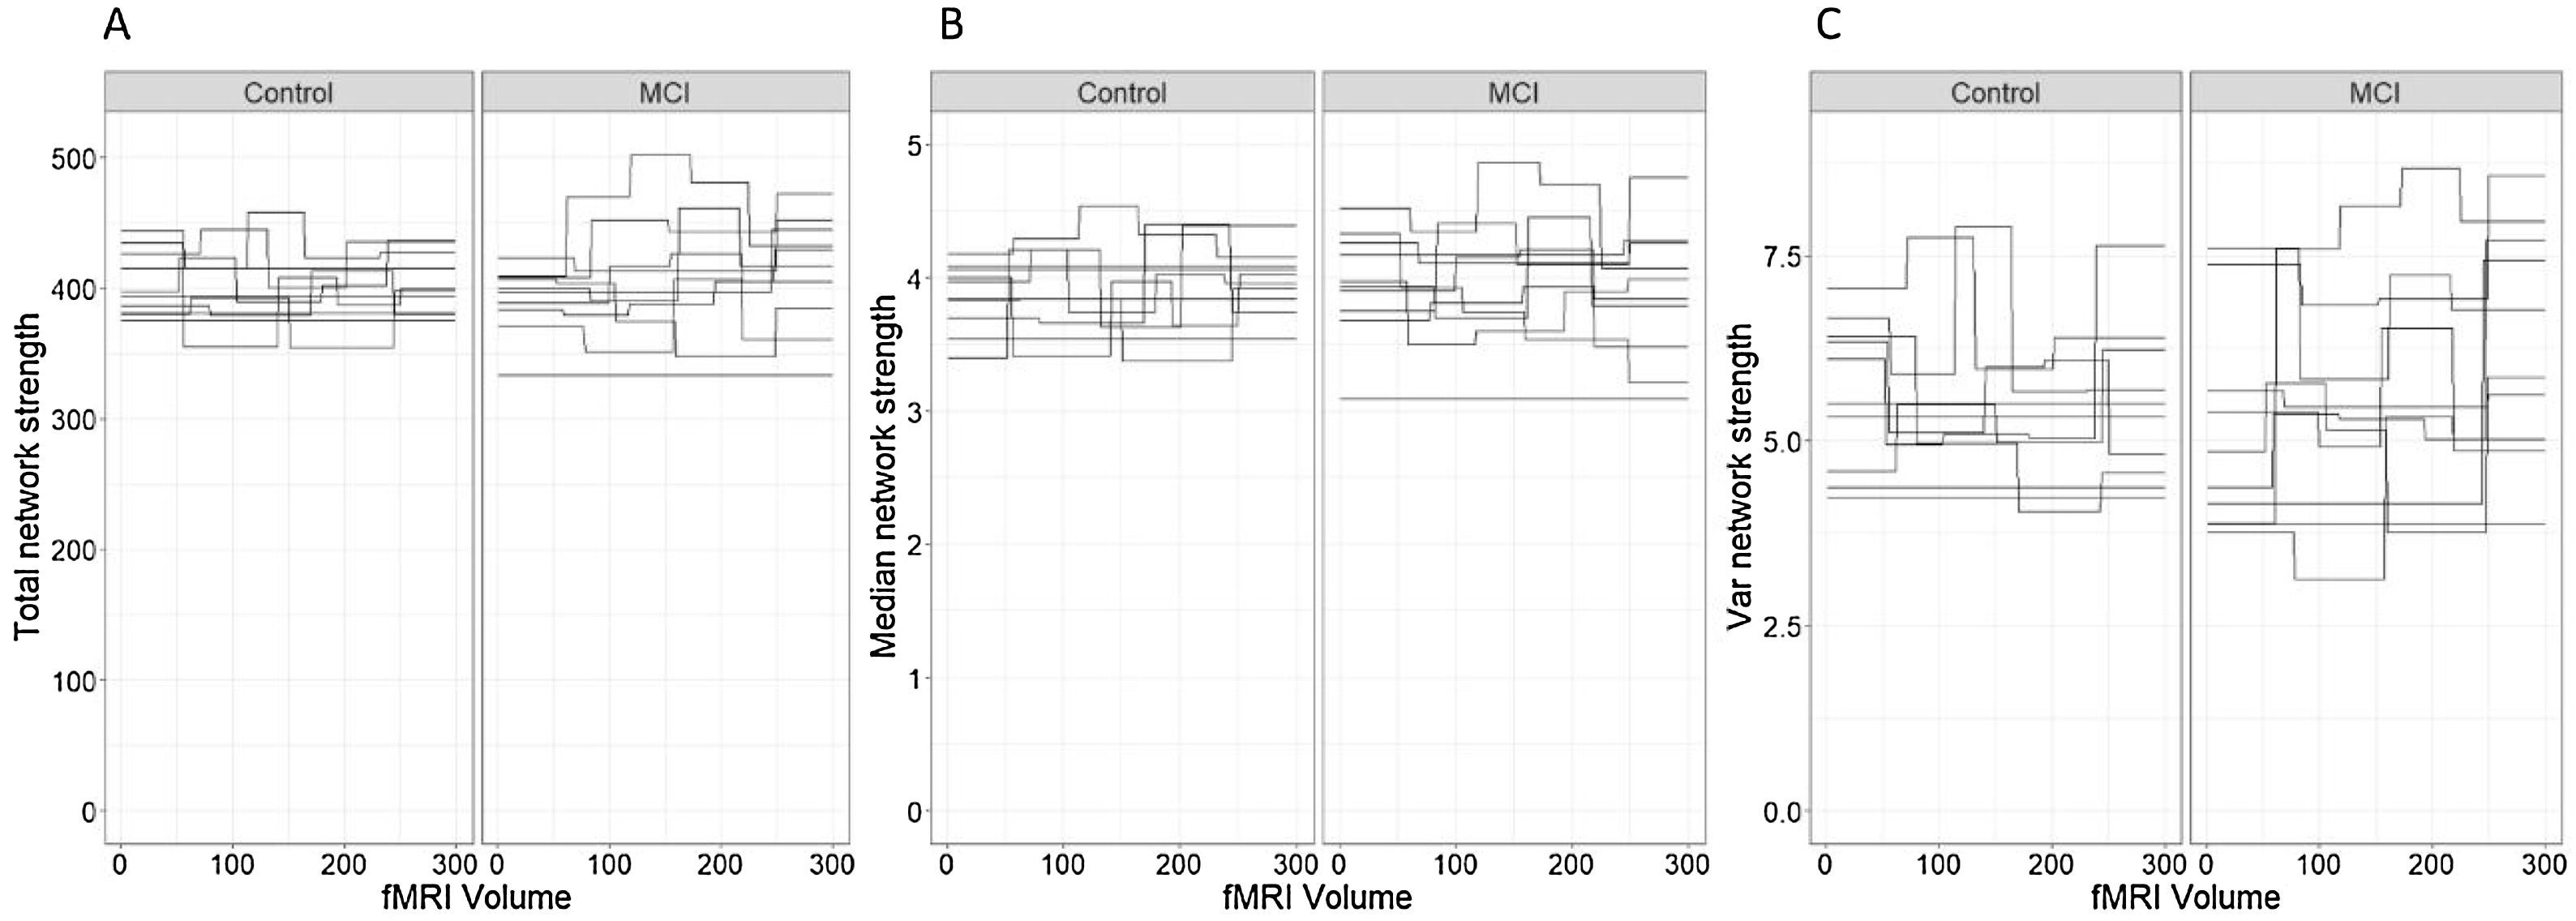
Network connectivity density was studied with three different approaches. First, we studied the total strength of the network to characterize the global density of the functional connectivity networks in each time segment of each participant. Secondly, we computed the median node strength to identify the central tendency of each network. Median was preferred over mean as it is a robust estimator of central tendency in non-symmetric distributions, as was the case in the node strength distribution of all the participants in this study. Finally, we analyzed the intra-patient variance of the node strength of the networks.
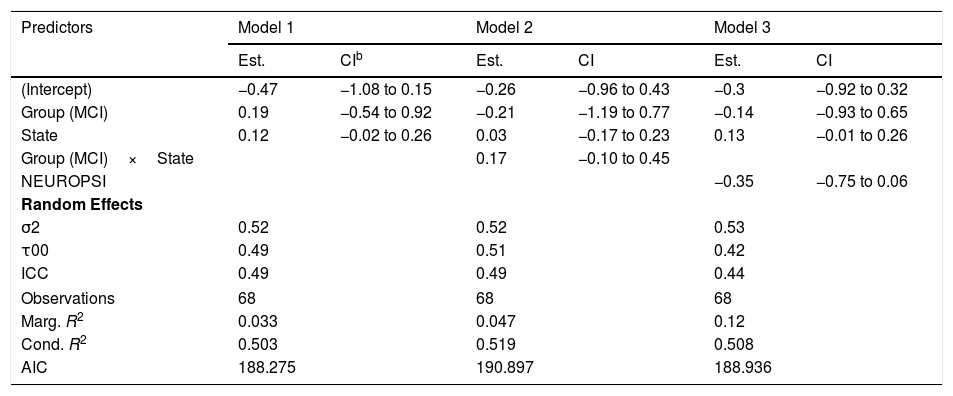
In relation to the total network strength (Figure 4A), the best model in terms of the reduction of the AIC was the baseline model with group and state in the linear predictor (Table 2, Model 1). Although the effect of the state was close to significance (βˆ=0.12; 95% CI: −0.02, 0.26), the marginal R2=.033 indicates an extremely low predictive value of the fixed effects.

Models for total network strength.a
| Predictors | Model 1 | Model 2 | Model 3 | |||
|---|---|---|---|---|---|---|
| Est. | CIb | Est. | CI | Est. | CI | |
| (Intercept) | −0.47 | −1.08 to 0.15 | −0.26 | −0.96 to 0.43 | −0.3 | −0.92 to 0.32 |
| Group (MCI) | 0.19 | −0.54 to 0.92 | −0.21 | −1.19 to 0.77 | −0.14 | −0.93 to 0.65 |
| State | 0.12 | −0.02 to 0.26 | 0.03 | −0.17 to 0.23 | 0.13 | −0.01 to 0.26 |
| Group (MCI)×State | 0.17 | −0.10 to 0.45 | ||||
| NEUROPSI | −0.35 | −0.75 to 0.06 | ||||
| Random Effects | ||||||
| σ2 | 0.52 | 0.52 | 0.53 | |||
| τ00 | 0.49 | 0.51 | 0.42 | |||
| ICC | 0.49 | 0.49 | 0.44 | |||
| Observations | 68 | 68 | 68 | |||
| Marg. R2 | 0.033 | 0.047 | 0.12 | |||
| Cond. R2 | 0.503 | 0.519 | 0.508 | |||
| AIC | 188.275 | 190.897 | 188.936 | |||
As an ancillary analysis, we adjusted the models incorporating the results of the neuropsychological assessment to study if these variables modified the effects of group and time. In the case of network total strength, we detected no statistically significant effects of MINIMENTAL (βˆ=0.16; 95% CI: −0.20, 0.53), PRMQ (βˆ=0.29; 95% CI: −0.21, 0.79), PAQ (βˆ=0.29; 95% CI: −0.10, 0.68), GDS (βˆ=0.04; 95% CI: −0.50, 0.58), BNT (βˆ=−0.14; 95% CI: −0.51, 0.22). However, the effect of NEUROPSI was close to statistical significance (βˆ=−0.35; 95% CI: −0.75, 0.06).
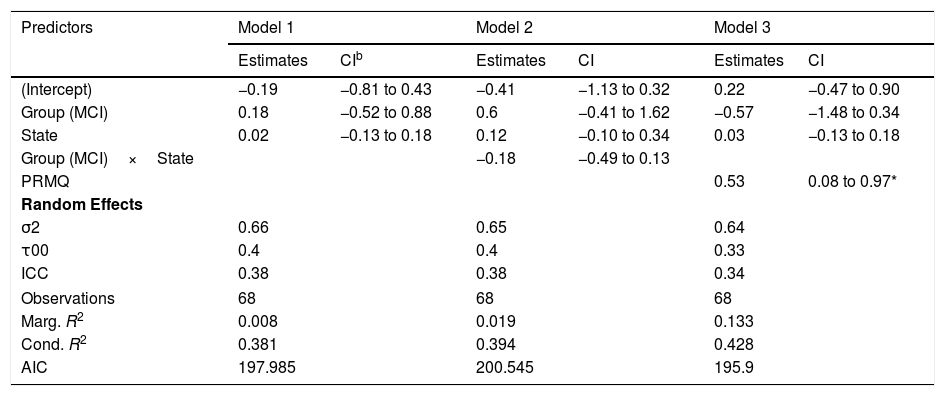
Regarding the median node strength, the best model in terms of the reduction of the AIC included the fixed effects of group, state and PRMQ (Table 3, Model 3).
Models for median strength.a
| Predictors | Model 1 | Model 2 | Model 3 | |||
|---|---|---|---|---|---|---|
| Estimates | CIb | Estimates | CI | Estimates | CI | |
| (Intercept) | −0.19 | −0.81 to 0.43 | −0.41 | −1.13 to 0.32 | 0.22 | −0.47 to 0.90 |
| Group (MCI) | 0.18 | −0.52 to 0.88 | 0.6 | −0.41 to 1.62 | −0.57 | −1.48 to 0.34 |
| State | 0.02 | −0.13 to 0.18 | 0.12 | −0.10 to 0.34 | 0.03 | −0.13 to 0.18 |
| Group (MCI)×State | −0.18 | −0.49 to 0.13 | ||||
| PRMQ | 0.53 | 0.08 to 0.97* | ||||
| Random Effects | ||||||
| σ2 | 0.66 | 0.65 | 0.64 | |||
| τ00 | 0.4 | 0.4 | 0.33 | |||
| ICC | 0.38 | 0.38 | 0.34 | |||
| Observations | 68 | 68 | 68 | |||
| Marg. R2 | 0.008 | 0.019 | 0.133 | |||
| Cond. R2 | 0.381 | 0.394 | 0.428 | |||
| AIC | 197.985 | 200.545 | 195.9 | |||
Although the effects of group (βˆ=−0.57; 95% CI: −1.48, 0.34) and state (βˆ=0.03; 95% CI: −0.13, 0.18) were not statistically significant, we detected a significant effect of PRMQ where an increase of one unit implied a 0.53 increase (95% CI: 0.08, 0.97) in the network median strength. However, according to the marginal R2, the fixed effects of this model can only explain a 13.30% of the variability in the response variable. The changes in median node strength in both groups can be seen in Figure 4(B).
We detected no statistically significant effects of MINIMENTAL (βˆ=0.13; 95% CI: −0.23, 0.149), PAQ (βˆ=0.25; 95% CI: −0.13, 0.64), GDS (βˆ=0.18; 95% CI: −0.34, 0.70), BNT (βˆ=−0.11; 95% CI: −0.47, 0.24), or NEUROPSI (βˆ=−0.23; 95% CI: −0.63, 0.17).
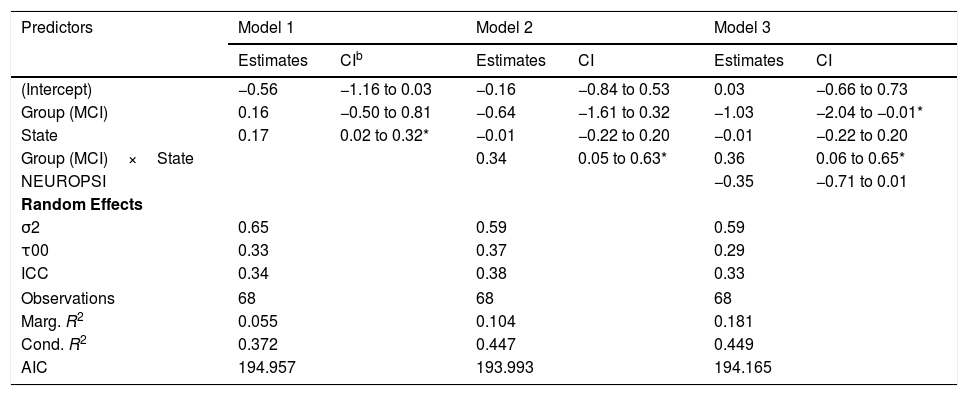
As to the intra-patient variance of the node strength, the best model in terms of the reduction of the AIC included the effects of group, state and the interaction between group and state (Table 4, Model 2).
Models for intra-patient Variance of Node Strength.a
| Predictors | Model 1 | Model 2 | Model 3 | |||
|---|---|---|---|---|---|---|
| Estimates | CIb | Estimates | CI | Estimates | CI | |
| (Intercept) | −0.56 | −1.16 to 0.03 | −0.16 | −0.84 to 0.53 | 0.03 | −0.66 to 0.73 |
| Group (MCI) | 0.16 | −0.50 to 0.81 | −0.64 | −1.61 to 0.32 | −1.03 | −2.04 to −0.01* |
| State | 0.17 | 0.02 to 0.32* | −0.01 | −0.22 to 0.20 | −0.01 | −0.22 to 0.20 |
| Group (MCI)×State | 0.34 | 0.05 to 0.63* | 0.36 | 0.06 to 0.65* | ||
| NEUROPSI | −0.35 | −0.71 to 0.01 | ||||
| Random Effects | ||||||
| σ2 | 0.65 | 0.59 | 0.59 | |||
| τ00 | 0.33 | 0.37 | 0.29 | |||
| ICC | 0.34 | 0.38 | 0.33 | |||
| Observations | 68 | 68 | 68 | |||
| Marg. R2 | 0.055 | 0.104 | 0.181 | |||
| Cond. R2 | 0.372 | 0.447 | 0.449 | |||
| AIC | 194.957 | 193.993 | 194.165 | |||
According to this model, there was a statistically significant positive effect (βˆ=0.34; 95% CI: 0.05, 0.63) of the interaction between group and state on the variability of the network strength. However, the marginal R2=.104 indicates a low predictive value of the fixed effects.
The changes in intra-individual variability of the node strength in both groups can be seen in Figure 4(C).
As a complementary analysis, we adjusted the models incorporating the results of the neuropsychological assessment to study if these variables modified the effects of group and time. In the case of intra-patient variance of node strength, we detected no statistically significant effects of MINIMENTAL (βˆ=0.17; 95% CI: −0.17, 0.50), PRMQ (βˆ=−0.07; 95% CI: −0.53, 0.39), PAQ (βˆ=0.22; 95% CI: −0.14, 0.58), GDS (βˆ=−0.19; 95% CI: −0.67, 0.30), BNT (βˆ=−0.23; 95% CI: −0.55, 0.09), or NEUROPSI (βˆ=−0.35; 95% CI: −0.71, 0.01).
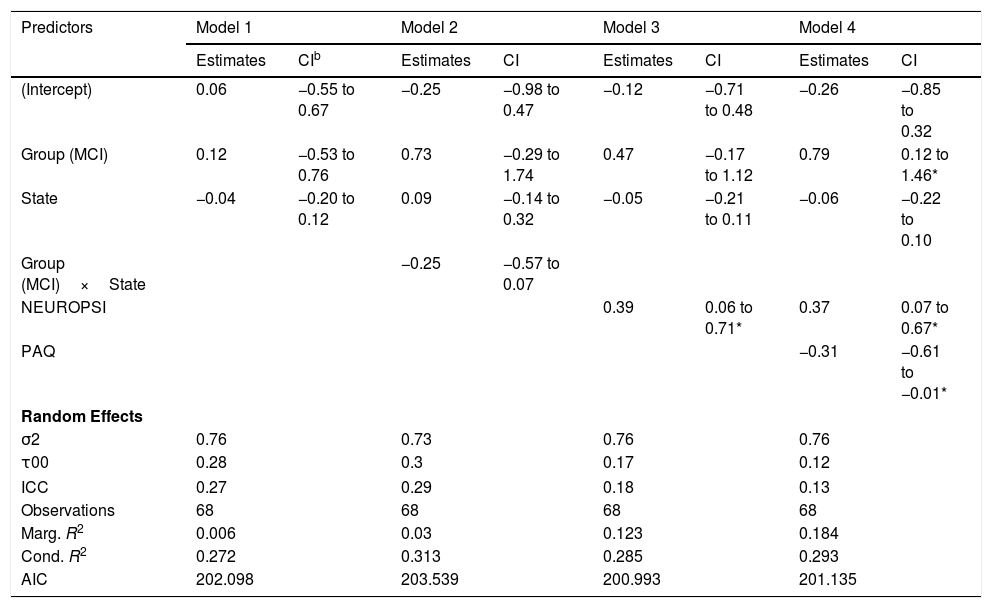
Characteristic path lengthThe best model for the characteristic path length of the networks in terms of the reduction of the AIC included only the effects of group, state and NEUROPSI score (Table 5, Model 3). Although the effects of group and state were not statistically significant, an increase of one standard unit in the NEUROPSI score implied a 0.39 (95% CI: 0.06, 0.71) increase in the characteristic path length of the network. The marginal R2=.123 indicates a low predictive capacity of the fixed effects.
Models for characteristic path length.a
| Predictors | Model 1 | Model 2 | Model 3 | Model 4 | ||||
|---|---|---|---|---|---|---|---|---|
| Estimates | CIb | Estimates | CI | Estimates | CI | Estimates | CI | |
| (Intercept) | 0.06 | −0.55 to 0.67 | −0.25 | −0.98 to 0.47 | −0.12 | −0.71 to 0.48 | −0.26 | −0.85 to 0.32 |
| Group (MCI) | 0.12 | −0.53 to 0.76 | 0.73 | −0.29 to 1.74 | 0.47 | −0.17 to 1.12 | 0.79 | 0.12 to 1.46* |
| State | −0.04 | −0.20 to 0.12 | 0.09 | −0.14 to 0.32 | −0.05 | −0.21 to 0.11 | −0.06 | −0.22 to 0.10 |
| Group (MCI)×State | −0.25 | −0.57 to 0.07 | ||||||
| NEUROPSI | 0.39 | 0.06 to 0.71* | 0.37 | 0.07 to 0.67* | ||||
| PAQ | −0.31 | −0.61 to −0.01* | ||||||
| Random Effects | ||||||||
| σ2 | 0.76 | 0.73 | 0.76 | 0.76 | ||||
| τ00 | 0.28 | 0.3 | 0.17 | 0.12 | ||||
| ICC | 0.27 | 0.29 | 0.18 | 0.13 | ||||
| Observations | 68 | 68 | 68 | 68 | ||||
| Marg. R2 | 0.006 | 0.03 | 0.123 | 0.184 | ||||
| Cond. R2 | 0.272 | 0.313 | 0.285 | 0.293 | ||||
| AIC | 202.098 | 203.539 | 200.993 | 201.135 | ||||
The incorporation of PAQ scores in the model increased the marginal R2 to 0.184 but failed to reduce the deviance of the model (Table 5, Model 4). However, given the limitations of our sample size, this effect should be considered in further research.
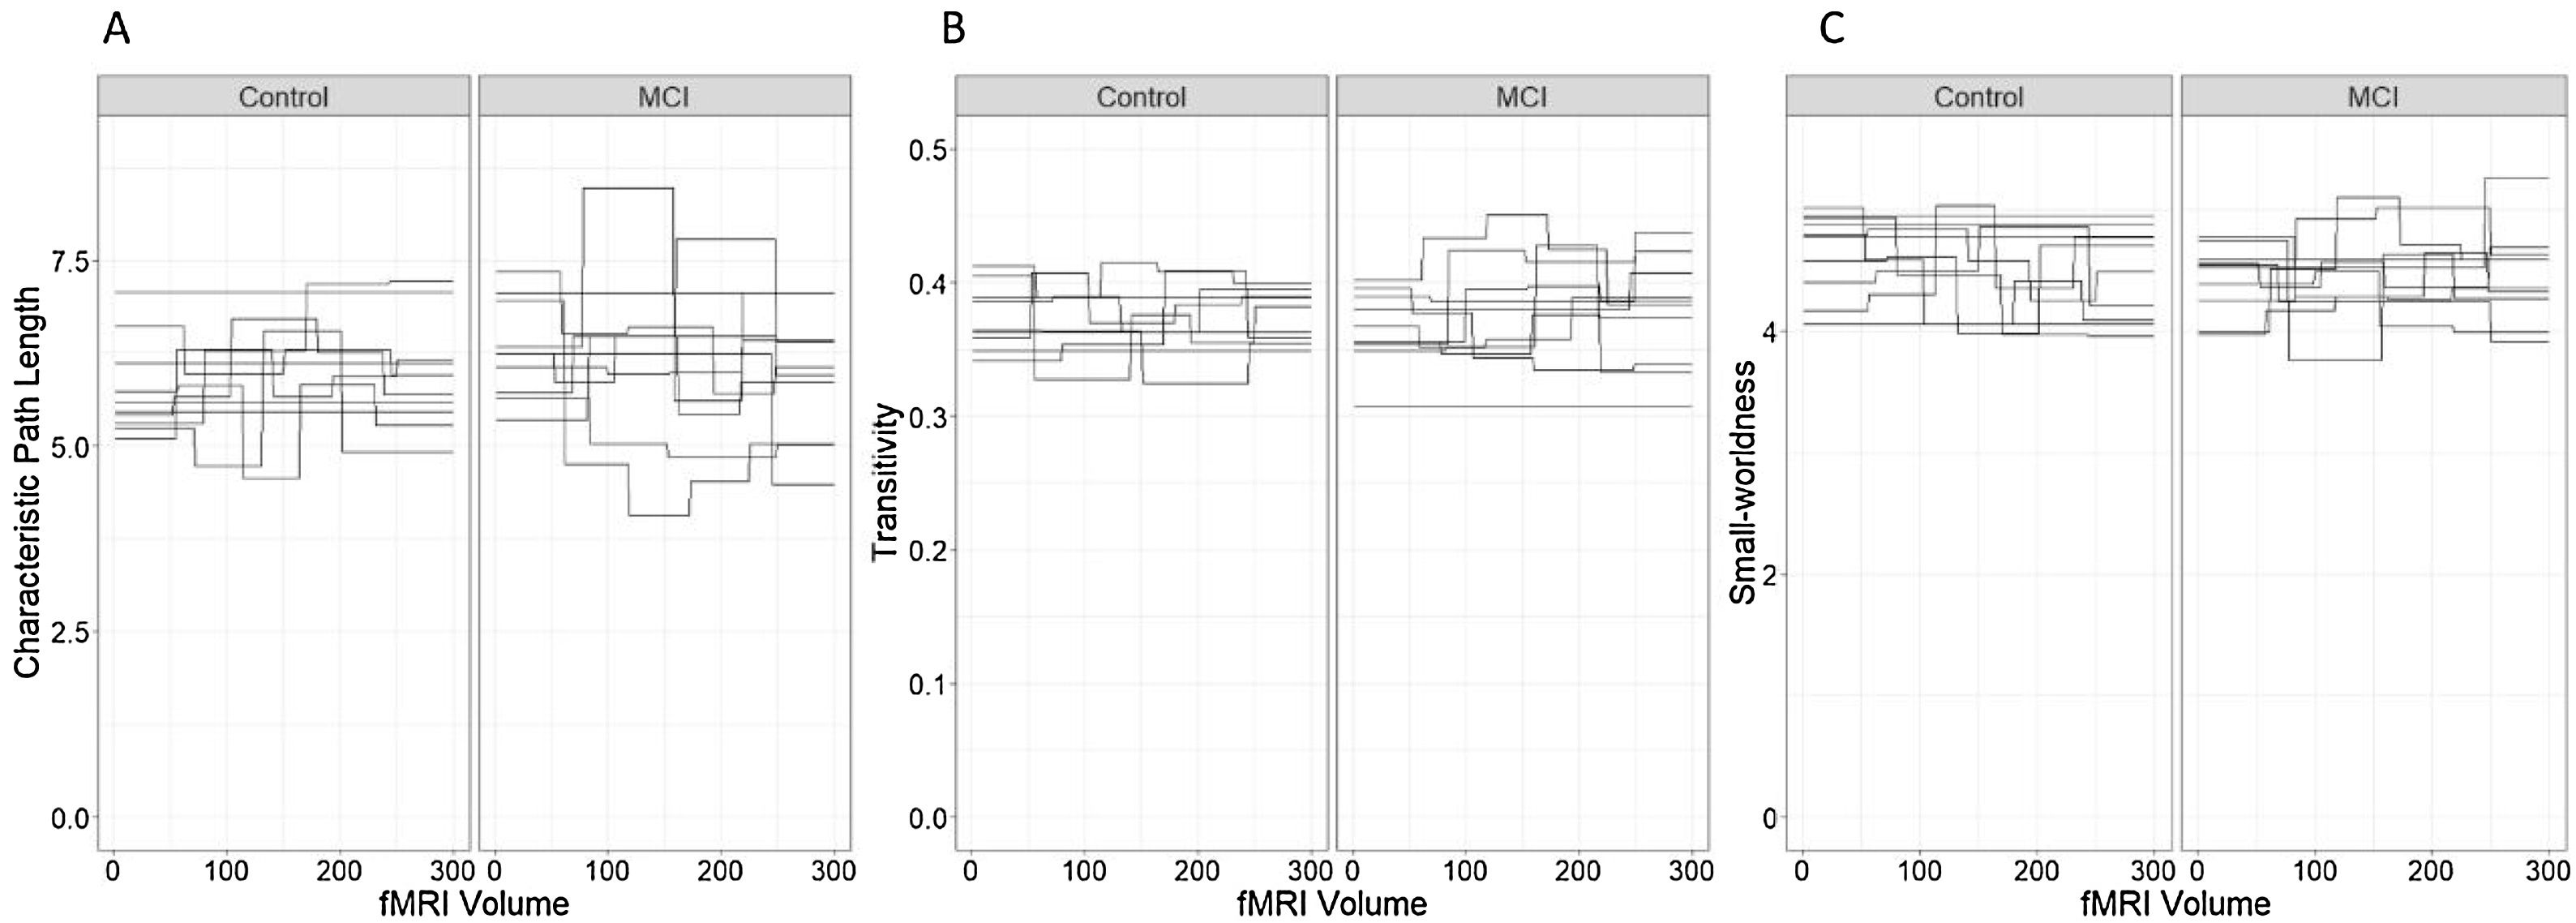
The fluctuations in the characteristic path length in both groups can be seen in Figure 5(A).
 Characteristic path length, (B) transitivity and (C) small-world coefficient. Each line represents a single individual and brakes in the lines correspond to changes in the network measure after a significant change point.")
Characteristic path length, transitivity and Small-worldness. (A) Characteristic path length, (B) transitivity and (C) small-world coefficient. Each line represents a single individual and brakes in the lines correspond to changes in the network measure after a significant change point.
Ancillary analysis concluded that there was no effect of MINIMENTAL (βˆ=−0.15; 95% CI: −0.45, 0.15), PRMQ (βˆ=0.19; 95% CI: −0.33, 0.43), GDS (βˆ=0.26; 95% CI: −0.16, 0.67) and BNT (βˆ=0.07; 95% CI: −0.22, 0.37).
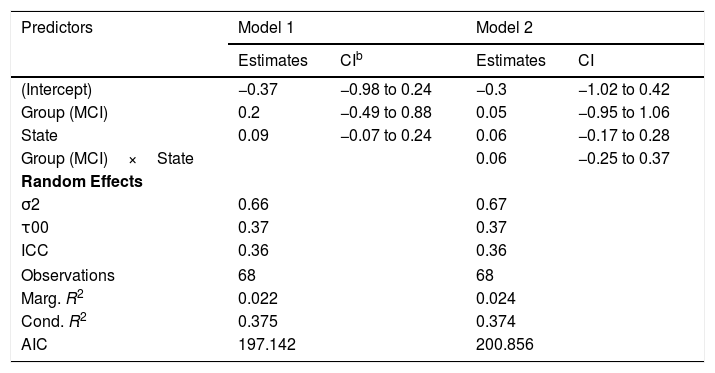
TransitivityThe best model for the transitivity of the networks in terms of the reduction of the AIC included only the effects of group and state (Table 6, Model 1). However, none of these effects were statistically significant and the marginal R2=.022 indicates a low predictive capacity of the fixed effects. The fluctuations in the transitivity coefficient in both groups can be seen in Figure 5(B).
Models for transitivity.a
| Predictors | Model 1 | Model 2 | ||
|---|---|---|---|---|
| Estimates | CIb | Estimates | CI | |
| (Intercept) | −0.37 | −0.98 to 0.24 | −0.3 | −1.02 to 0.42 |
| Group (MCI) | 0.2 | −0.49 to 0.88 | 0.05 | −0.95 to 1.06 |
| State | 0.09 | −0.07 to 0.24 | 0.06 | −0.17 to 0.28 |
| Group (MCI)×State | 0.06 | −0.25 to 0.37 | ||
| Random Effects | ||||
| σ2 | 0.66 | 0.67 | ||
| τ00 | 0.37 | 0.37 | ||
| ICC | 0.36 | 0.36 | ||
| Observations | 68 | 68 | ||
| Marg. R2 | 0.022 | 0.024 | ||
| Cond. R2 | 0.375 | 0.374 | ||
| AIC | 197.142 | 200.856 | ||
Complementary analysis led to conclude the absence of significant effects of NEUROPSI (βˆ=−0.28; 95% CI: −0.66, 0.10), MINIMENTAL (βˆ=0.21; 95% CI: −0.12, 0.54), PRMQ (βˆ=0.36; 95% CI: −0.11, 0.83), PAQ (βˆ=0.29; 95% CI: −0.08, 0.65), GDS (βˆ=0.13; 95% CI: −0.38, 0.64) and BNT (βˆ=0.08; 95% CI: −0.43, 0.27).
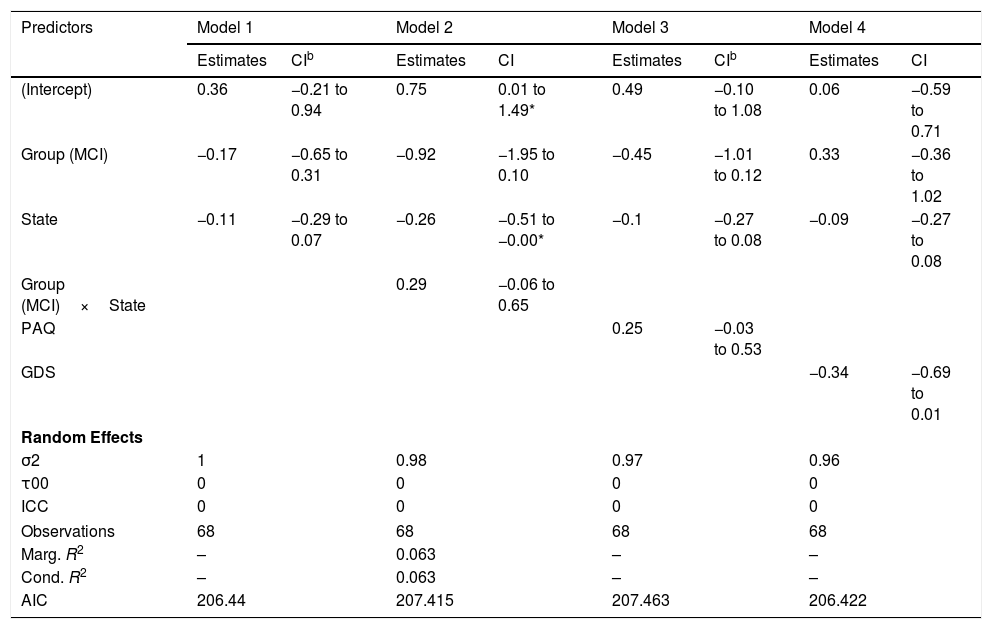
Small-worldnessGiven that some of the variance components for the random structure are zero, the linear mixed models for the network small-worldness dynamics are compromised and the R2 cannot be computed. Therefore, the models shown in Table 7 should be considered with caution.
Models for small-worldness.a
| Predictors | Model 1 | Model 2 | Model 3 | Model 4 | ||||
|---|---|---|---|---|---|---|---|---|
| Estimates | CIb | Estimates | CI | Estimates | CIb | Estimates | CI | |
| (Intercept) | 0.36 | −0.21 to 0.94 | 0.75 | 0.01 to 1.49* | 0.49 | −0.10 to 1.08 | 0.06 | −0.59 to 0.71 |
| Group (MCI) | −0.17 | −0.65 to 0.31 | −0.92 | −1.95 to 0.10 | −0.45 | −1.01 to 0.12 | 0.33 | −0.36 to 1.02 |
| State | −0.11 | −0.29 to 0.07 | −0.26 | −0.51 to −0.00* | −0.1 | −0.27 to 0.08 | −0.09 | −0.27 to 0.08 |
| Group (MCI)×State | 0.29 | −0.06 to 0.65 | ||||||
| PAQ | 0.25 | −0.03 to 0.53 | ||||||
| GDS | −0.34 | −0.69 to 0.01 | ||||||
| Random Effects | ||||||||
| σ2 | 1 | 0.98 | 0.97 | 0.96 | ||||
| τ00 | 0 | 0 | 0 | 0 | ||||
| ICC | 0 | 0 | 0 | 0 | ||||
| Observations | 68 | 68 | 68 | 68 | ||||
| Marg. R2 | – | 0.063 | – | – | ||||
| Cond. R2 | – | 0.063 | – | – | ||||
| AIC | 206.44 | 207.415 | 207.463 | 206.422 | ||||
The fluctuations in the small-worldness coefficients in control and MCI participants can be seen in Figure 5(C) and they do not appear to indicate different patterns in the small-world network topology across groups.
DiscussionThis study aimed to characterize the differences in the resting-state network properties between MCI and healthy control participants through a dynamic functional connectivity approach. rs-fMRI states in each individual were identified through the NCPD algorithm (Cribben & Yu, 2017) and the subnetworks between change points were described in terms of their connectivity strength, characteristic path length, transitivity, small-worldness and modularity. The effects of group, state and neuropsychological assessment on graph measures were tested through mixed linear models.
Overall, no significant differences were found between control and MCI participants in the number of change points during the fMRI time register.
Although no significant effects of group or the state were found in either the total or the median network strength, higher scores in the PRMQ seemed to be associated to higher median strength of the networks. We also found a significant interaction effect of group and state on the variance of the network strength. However, the low marginal R2 (R2=.133 and R2=.104, respectively) lead to conclude that the fixed effects of the model could poorly predict the response variable. Therefore, further studies are required in order to assess whether these effects fall in line with the loss of variability and the altered fluctuations patterns found in Brenner et al. (2018), Córdova-Palomera et al. (2017), and Niu et al. (2018).
In relation to the fluctuation in the segregation and integration properties of the networks, no significant effects of group and state were found on either the Characteristic Path Length or the Transitivity coefficients. Therefore, we could not confirm the higher CPL and transitivity in MCI found in Wee et al. (2016). However, a higher performance in the NEUROPSI scale was associated to higher characteristic path length of the network. Additionally, our results suggested a possible effect of the level of dependency in daily life activities in this indicator that should be explored in subsequent studies in dynamic FC.
Finally, the linear mixed models for the network small-worldness dynamics are compromised due to the lack of variance in the response. Therefore, we cannot test whether our study falls in line with the increased small-worldness coefficient found in Wee et al. (2016).
There are some limitations in this study that should be considered. In relation to modularity, this measure allows to study the structure of a network or graph. Each network can be partitioned into modules, also called communities. Networks with higher modularity are characterized by stronger and more solid connections between nodes inside the community and having sparse links and connections between other communities. Thus, a network with higher modularity is composed by sparsely connected communities, while in networks with lower modularity have highly connected modules.
However, this measure has limitations when small communities are considered, as these can be easily masked. In our case, the estimations of modularity should be interpreted as an assessment of the possible independence between communities of reasonable size. From this perspective and being dynamic rs-fMRI networks with restricted variability, both the magnitude and the intra-participant variability of these values are relatively low.
All things considered, we employed the modularity in our study to visualize the structure of the network of each participant in each state, but it was not be used in our modelling approaches.
Secondly, we acknowledge that our sample size poses a methodological challenge. However, we deemed necessary to apply strict inclusion and exclusion criteria in order to guarantee a correct MCI diagnosis and matching strategy in our study design. Therefore, the tentative effects of MCI and state on the variance of the network strength that we have detected in this work, as well as the effects of the neuropsychological assessment scores, suggest that the dynamic fluctuations of the FC should be further analyzed.
From a more clinical point of view, we must mention that the diagnosis of MCI was not confirmed using biomarkers. It was based on psychiatric and neuropsychological evaluations. This could be a confounding factor since some of the MCI patients could meet criteria for prodomal AD or some controls could be in the preclinical AD phase. This aspect should be controlled in future studies.
Finally, FC networks were obtained by regionally averaging the BOLD voxel signals through the AAL parcellation scheme of 90 cortical regions of interest. Although this atlas was preferred for simplicity, choices in parcellation can lead to different network configurations that can greatly impact the results of the spectral clustering and, therefore, the network properties and the network change points detection. In the future, these results should be replicated with other atlases that provide more functionally meaningful parcellation schemes, such as Glasser et al. (2013) and Gordon et al. (2016).
FundingThis research was supported by Ministerio de Ciencia, Innovación y Universidades, Agencia Estatal de Investigación, Ground code: PGC2018-095829-B-I00.
We would like to thank Grupo Rio (Guadalajara, Jalisco, Mexico) for facilitating the collection of fMRI data.
