


Background/Objective: Anxiety symptoms in adolescence have been found to be associated with heart rate variability (HRV) linear features, but more basic properties of the cardiac system remain unexplored. This study focused on the fractal nature of 90 minute-long interbeat fluctuations from 24 adolescents with high anxiety and 26 with low anxiety to (a) evaluate if allometric scaling exponents and linear HRV measures allow for distinction between groups, and (b) assess the associations between these measures and sensitivity to punishment (SP), a temperamental characteristic strongly correlated with anxiety. Method: Cardiac functioning was recorded and allometric exponents and vagally mediated HRV as indexed by the high frequency (HF) band power were calculated. Results: While the exponents from the high anxiety group were significantly higher than those from low anxiety participants (p<.05), just marginal differences were found for the HF measure (p=.057). Furthermore, exponents were positively correlated with SP scores and several anxiety scale scores, but no more correlations were found. Conclusions: These results show that beyond parasympathetic functioning, basic properties of the cardiac system may be altered in young, anxious adolescents. These properties, therefore, can provide useful information for assessing adolescents at risk of anxiety disorders.
Introducción/Objetivo: Se ha asociado la existencia de sintomatología ansiosa con algunas propiedades lineales de la variabilidad cardiaca (VC), sin prestar demasiada atención a propiedades más esenciales del sistema cardiaco, como su naturaleza fractal. En este trabajo se pretendía evaluar si medidas de fractalidad (exponentes alométricos) y medidas de VC (potencia en la banda de altas frecuencias, AF) permitían distinguir entre 24 adolescentes con alta sintomatología ansiosa y 26 adolescentes con baja. Además, se perseguía explorar las asociaciones de estas medidas con sensibilidad al castigo (SC), un factor de riesgo para ansiedad. Método: Se tomó la actividad cardiaca de los adolescentes en contexto ecológico y se calcularon dichas medidas sobre registros de 90 minutos. Resultados: Se encontraron exponentes alométricos significativamente mayores para los adolescentes con alta ansiedad (p<0,05), sin observarse diferencias significativas en potencia de AF (p=0,057). Además, sólo se encontraron correlaciones positivas significativas entre los exponentes alométricos con SC, y dichos exponentes con varias escalas de ansiedad. Conclusiones: Estos resultados muestran que propiedades más básicas del sistema cardiaco parecen estar alteradas en adolescentes ansiosos más allá de la mera influencia parasimpática. Estas propiedades pueden aportar información relevante para la detección y prevención de trastornos de ansiedad.
Fluctuations in the length of successive interbeat intervals are not random but fractal-like, i.e. similar patterns of fluctuations can be seen at different temporal resolutions (Goldberger, 1996; West, 2010; West, Brown, & Enquist, 1999). In other words, there is multistability and the heart does not beat within one single time scale: different set points (at different time scales) are available to the heart system providing flexibility to respond effectively to the incoming demands. In addition, altered fractal dynamics in the heartbeat have been found to be associated with disease and aging (Goldberger et al., 2002; Sturmberg, Bennett, Picard, & Seely, 2015).
Based on these findings, West (2006) introduced the concept of allometric control. Classical explanations for heart beat fluctuations embraced homeostasis as the key control mechanism of the seemingly random deviations from the mean interbeat interval length. Homeostatic control would operate at just one single, real-time scale and the system producing those fluctuations would be memoryless. Allometric control, conversely, means that there are control mechanisms that operate at different time scales and that the system has a built-in long-term memory. West (2006) suggested that scale-free fluctuations would emerge mainly from the interaction of the two branches of the autonomous nervous system (ANS), the sympathetic and the parasympathetic branches (see also Ivanov, Chen, Hu, & Stanley, 2004; Lehrer & Eddie, 2013).
Fractal objects look the same at different spatial scales or resolutions. Similarly, fractal time series should look the same when seen at different temporal resolutions. Therefore, perhaps the most intuitive way to check if a signal shows multistability (and hence to get some evidence that it is under allometric control mechanisms) is to examine this signal at different time resolutions and test the invariance of the relationship between its mean and its variance along those resolutions. This procedure is very similar to the one introduced by B. Mandelbrot to demonstrate the fractal nature of the coast of Great Britain (Mandelbrot, 1967). The relationship between the length of the coast and the scale that we use to measure it remains invariant, so that when we plot the length obtained using each scale on log-log axes a straight line can be traced that crosses all these points, and the slope of this line (which is invariant all along the line) provides a calculation of the fractal dimension of the shape of the coast. Allometric aggregation (West, 2006) allows for testing fractality in temporal objects (i.e. time series) by plotting the means and the variances for successively aggregated values (i.e. different resolutions) from a time series on log-log axes. The slope of the straight line that fits these values on the plot is the scaling exponent that gives a quantitative measure of the scale invariance present in the data (a detailed explanation of the allometric aggregation procedure can be found in the Methods section). This procedure is more straightforward and less time-consuming than other methods like detrended fluctuation analysis (Peng, Havlin, Stanley, & Goldberger, 1995) and could be performed using any standard spreadsheet. This may seem trivial, but sophisticated mathematical procedures are not easy for most Clinical Psychology researchers, and this is probably one of the reasons that could explain why they are reluctant to use nonlinear measures based on those complex procedures. However the main reason why most research addressing the relationships between the heart system and anxiety has not taken into account the fractal-like properties of the cardiac system is the leading existence of the influential models developed by Thayer and Lane (2000, 2009) or Porges (2001).
These models emphasize the parasympathetic or vagally-mediated heart rate variability (vmHRV). In truth, there is a large body of research pointing at an association between diminished vmHRV and several anxiety disorders (see Beauchaine & Thayer, 2015; Chalmers, Quintana, Abbott, & Kemp, 2014). Furthermore, most studies on general population and clinical samples have found a positive association between the behavioral inhibition system (BIS) sensitivity or sensitivity to punishment (SP) and anxiety symptomatology (Bijttebier, Beck, Claes, & Vandereycken, 2009; Panayiotou, Karekla, & Panayiotou, 2014), and associations have also been found between the BIS sensitivity and vmHRV (Balle, Tortella-Feliu, & Bornas, 2013; Beauchaine, 2001), although Kristensen, Oerbeck, Torgersen, Hansen, and Wyller (2014) could not find any evidence of autonomous alterations in anxious children, measuring from the 0.15–0.4Hz frequency domain band (usually called the high frequency or HF band). This band exclusively, or overwhelmingly, reflects the vagal influence on HR (Shaffer, McCraty, & Zerr, 2014). It should be noticed that the HF band power is usually calculated using short recordings taken in lab settings. These measurements may not reflect the properties of the heartbeat in the ecology of everyday life.
In agreement with Nardelli et al. (2015) who showed the interest of using nonlinear analysis of HRV for the study of psychological dimensions, we think that there is room for the study of the relationships between complex heart properties other than vmHRV and anxiety symptoms, as well as for the study of the associations between those properties and BIS sensitivity. Recently, in a study focused on attentional orienting Balle, Morillas, Tortella-Feliu, and Bornas, (2015) pointed out that the influence of the parasympathetic system should be considered within the complex, multiscale structure of the heartbeat system.
This study was aimed at (a) elucidating if heartbeat allometric-related scaling properties are different in low anxiety adolescents when compared to high anxiety adolescents, and (b) comparing the associations between physiological indexes of the heartbeat (vmHRV and scaling exponents) and anxiety symptoms, as well as sensitivity to punishment. Heartbeat activity was recorded in everyday life conditions to ensure the ecological validity of the measures calculated on the resulting interbeat intervals time series.
Based on previous results (Bornas, Balle, de la Torre-Luque, Fiol-Veny, & Llabrés, 2015), and taking into account the relationship between fractal dimension (FD) and scaling exponents h (FD=2-h), our hypothesis as to the first aim was that heartbeat scaling exponents from high anxiety adolescents would be higher than the exponents from their low anxiety counterparts. Regarding the associations between physiological and psychological measures, we hypothesized that scale-free behavior (or scaling) in long ecological recordings would be more strongly associated with anxiety and SP than vmHRV, as the former reflects a more basic property and more fundamental control mechanisms (i.e. allometric control) of the heartbeat than the latter.
MethodThis study is defined by an ex post facto design with two groups, one of them a quasi-control group (Montero & León, 2007).
ParticipantsThis study was part of a longitudinal project among young adolescents (Bornas, Llabrés, Balle, de la Torre-Luque, & Fiol-Veny, 2014). We initially recruited 192 participants from 13 high schools across the island of Mallorca (Spain). All of them were Caucasian, from middle socioeconomic backgrounds and both urban and rural areas. All of them consented to take part in this study as did their parents/legal guardians. In order to match the requirements to test our hypotheses, the final sample was selected by means of the Revised Child Anxiety and Depression Scale (RCADS; Chorpita, Yim, Moffitt, Umemoto, & Francis, 2000). Therefore, the participants selected were the ones who showed scores above the 75th percentile (scores ≥ 30) in total anxiety symptomatology (they made up the so-called high anxiety group) and those with scores below the 25th percentile (scores ≤ 22) as well (they made up the so-called low anxiety group). Additionally, some exclusions were taken into account, which were diagnosis of severe mental retardation; diagnosis of neurological, developmental, or psychiatric disorder (American Psychiatric Association, 2000), or being diagnosed with any severe cardiovascular or respiratory disease. As a result of selection, and after applying all the study protocols, the sample was composed of 24 high anxiety participants (17 females, M=12.89 years old, SD=0.42; and 7 males, M=12.99 years old, SD=0.40) and 26 low anxiety participants (14 females, M=13.03 years old, SD=0.60; and 12 males, M=12.95 years old, SD=0.55). It was significantly different proportions according to gender in the high anxiety group, χ2 (1)=4.17, p=.041, ϕ=.42; but not regarding the low anxiety group, χ2 (1)=.15, p>.69, ϕ=.09. None of the potential participants were ruled out due to the exclusion criteria (for further details, see Bornas et al., 2015).
The University Bioethics Committee approved all the procedures conducted in this research.
Instruments- -
The Mini-International Neuropsychiatric Interview for Children and Adolescents (M.I.N.I. Kid; Sheehan et al., 1998) was used to evaluate the presence of psychiatric disorders. The tool was administered to each participant by a trained postgraduate psychologist in face-to-face sessions. M.I.N.I. Kid consists of a structured diagnostic interview for children and adolescents from 6 to 17 years old to assess 25 psychiatric disorders in keeping with the DSM-IV and ICD-10 criteria: major depressive episode, suicide risk, dysthymia, (hypo) manic episode, panic disorder, agoraphobia, separation anxiety disorder, social phobia, specific phobia, obsessive-compulsive disorder, posttraumatic stress disorder, alcohol dependence/abuse, substance dependence/abuse (non-alcohol), tic disorders, attention-deficit hyperactivity disorder, conduct disorder, oppositional defiant disorder, psychotic disorders, anorexia nervosa, bulimia nervosa, generalized anxiety disorder, and adaptive disorders. The interview evaluates the bulk of these psychiatric disorders by two to four initial screening questions. When these questions are answered negatively the diagnosis is ruled out. Conversely, positive responses to them involved administering all the disorder-related questions in order to get further information about whether the diagnosis was present.
- -
The Revised Children's Anxiety and Depression Scale (RCADS; Chorpita et al., 2000; Sandín, Valiente, & Chorot, 2009) was used to assess anxiety symptoms. The questionnaire allows different anxiety disorder symptomatology (separation anxiety disorder, social anxiety disorder, generalized anxiety disorder, panic disorder, obsessive compulsive disorder) and major depressive disorder to be explored, by means of 47 self-report items. Additionally, RCADS provides a composite scale of anxiety symptomatology. The RCADS asks for respondents to rate how often each symptom is present regularly. Symptoms are scored by means of a 4-point Likert-type scale (from ‘never’ to ‘always’). The internal consistency of the overall anxiety scale within this study sample was α=.93. For the purposes of this study, scales related to anxiety symptomatology were used.
- -
The Sensitivity to Punishment and Sensitivity to Reward Questionnaire Junior (SPSRQ-J; Torrubia, García-Carrillo, Ávila, Caseras, & Grande, 2008) was used to measure temperamental tendencies in keeping with the Grey's framework. The instrument is made up of 30 dichotomous items (yes–no scale of response). Two scales can be extracted using this instrument: sensitivity to punishment (SP), and sensitivity to reward (SR). In this study, only the SP scale (Cronbach's α=.81) was relevant to the hypothesis and therefore used for analyses.
- -
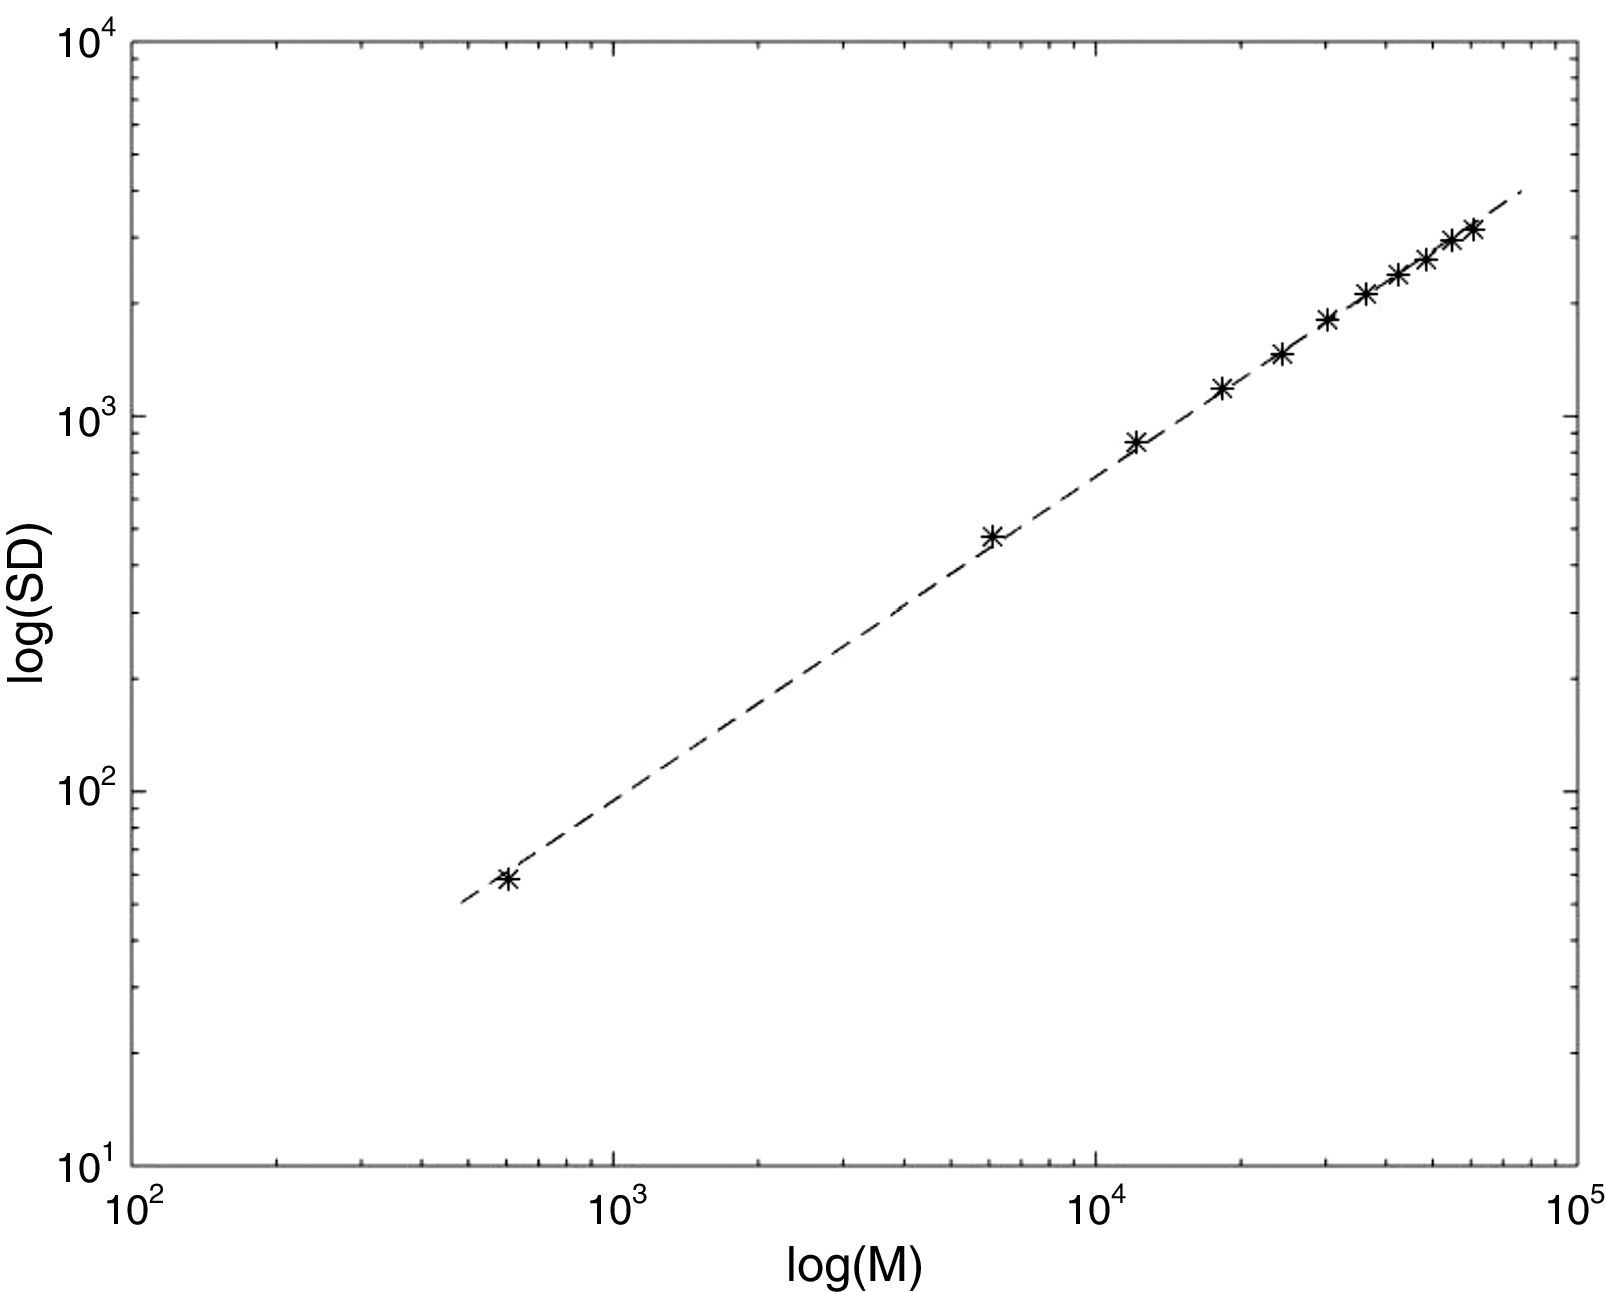
Cardiac measures. In addition to the mean heart rate (HR) the standard deviation of the averages for normal-to-normal beat intervals in all 5-minute segments (SDANN) of the entire recording was provided as a measure of the time-domain HRV. Vagally-mediated HRV (vmHRV). The HF (0.15-0.40Hz) power was calculated using Kubios HRV 2.1 Release software (Tarvainen, Niskanen, Lipponen, Ranta-aho, & Karjalainen, 2014), an advanced tool for analyzing the variability of heartbeat intervals. HF-related data were normalized by means of log-linear transformations (lnHF). The scaling exponents of each interbeat interval (IBIs) time series (see the Data acquisition devices and Data preprocessing section below) were calculated by means of the allometric aggregation method. Allometric aggregation examines the invariance of the relationship between the mean and the variance, or the standard deviation, of a data series as the data points are iteratively aggregated, thus decreasing the resolution (the scale) of the series. First, the mean and the standard deviation (the square root of the variance) of the time series of length N (x1, x2, x3, …, xn) are calculated. Second, every two adjacent points are aggregated (x1+x2, x3+x4, …, xn-1+xn) to get a time series of length N/2, and the mean and the standard deviation of this time series are calculated. This aggregation process is repeated for 3, 4, 5, and usually up to N/10 adjacent data points. As the IBI time series were rather long (around 9000 values) the aggregation process was repeated for 1, 10, 20, 30, 40, 50, 60, 70, 80, 90, and 100 adjacent data points in this study. Figure 1 depicts the logarithm of the mean (horizontal axis) versus the logarithm of the standard deviation (vertical axis), for each level of aggregation of an IBI time series from one participant. At the extreme left, the first dot denotes the value of the mean and standard deviation obtained using all data. Moving from left to right, the next dot corresponds to the mean and standard deviation for the time series with ten adjacent values added together, and so on. As can be seen, when the number of aggregated values increases, the relationship between mean and standard deviation remains the same (invariant) and can therefore be described as a linear relationship between log (mean) and log (standard deviation). The slope of the line representing that linear relationship is the scaling exponent h. Notice that the scaling exponent for random fluctuations is 0.50, and for deterministically regular processes is 1 (in both cases the time series would not be self-similar or fractal). If we take the variance instead of the standard deviation then the slope of the line would be 2h.
 and standard deviation (y axis) for ten levels of aggregation (1, 10, 20 … 100) of the interbeat intervals time series from one participant (h=0.86).")
To conduct the study, we randomly selected 20 high schools across the Mallorca Island (Spain) and contacted with their boards to give information about the protocols, requirements, etc., and to encourage them to participate. Thirteen high schools accepted to participate.
Online versions of the aforementioned self-reports were administered to participants. Additionally, parents and high school boards provided some socio-demographic data. Afterwards, the M.I.N.I. Kid was applied individually to each participant. Once it was ratified that participants matched the study criteria, cardiac recordings were scheduled. These recordings were conducted on a regular class day within the academic context, but there were no programmed exams or physical or extraordinary activities scheduled at the time the device was recording. Therefore, participants left the classroom in the early morning (around 8:30 a.m.) and went to a secluded room. First of all, researchers ensured that participants had not consumed alcohol, drugs and/or caffeinated beverages in the 4hours prior to their participation in the study and also that there was no acute illness or menstruation (recording was postponed to another day just in case of acute illness/menstruation). Afterwards, participants were weighed and measured, and body mass index (BMI) was subsequently calculated. Two electrodes and the portable heart-recording device (see description below) were put on the participant's chest later on and their correct functioning was checked. At this moment, the participants returned to their classroom to attend regular class. Cardiovascular functioning was taken throughout two hours continuously and after this time (around 10.30 a.m.) the researcher brought the participant to the secluded room again and removed the device. Finally, recorded data were transferred and stored on a computer.
Data acquisition devices and data preprocessingCardiac recordings were taken by using the Firstbeat Bodyguard 2© (Firstbeat Technologies Ltd., Jyväskylä, Finland) device. This portable device was attached to the skin with two electrodes: one on the left side of the chest and the other under the collar bone on the right side of the chest. The device continuously recorded beat-to-beat heart rate (i.e. interbeat intervals) at a sample rate of 1000Hz. As mentioned above, recordings were 2hours long and the resulting IBI time series were processed and analyzed offline. The first 15minutes of each time series as well as the last 15minutes were removed from the analyses in order to avoid data being influenced by the experimental protocols carried out in this study (adaptation to the device, leaving the classroom to go to the secluded room, and so on).
Hence, 90 minute-long time series were processed and analyzed (the number of IBIs in each time series depended on the participant's heart rate). Time series were filtered by using the Physionet (Goldberger et al., 2000) HRV toolkit (http://www.physionet.org/tutorials/hrv-toolkit/) as follows. First, any IBI less than 400ms or greater than 1100ms was ignored. Next, using a window of 11 intervals (5 intervals on either side of the central interval), the average over the window was calculated excluding the central interval. If the central interval lay outside 20% of the window average, this interval was excluded, then the window went forward to the next interval. As a result, the total excluded IBIs was 7,541 (out of 556,407, i.e. 1.35%). HR, SDANN, lnHF power and scaling exponents were calculated on these time series.
Analytic strategyFirstly, the influence of socio-demographic variables on cardiac measures was tested by analyzing the presence of significant differences between study groups. Accordingly, we used the χ2 independency tests for categorical variables, and between-group t-tests for BMI. If any of these variables showed different distributions between groups, that one would be controlled as covariate. Secondly, t-tests were used to compare the mean vmHRV (lnHF) and scaling exponents from the low and high anxiety groups. Effect size estimations were calculated by using Cohen's d statistic for numerical variables and Cramer's ϕ for categorical ones (for further details, see Fritz, Morris, & Richler, 2012).
Finally, a correlational analysis was performed by means of bivariate Pearson's product-moment correlations between cardiac measures and psychological measures (self-reported anxiety and sensitivity to punishment scores). Normality assumptions were previously checked to account for running those analyses.
All analyses were run using the IBM SPSS Statistics v. 20.0.0 statistical package.
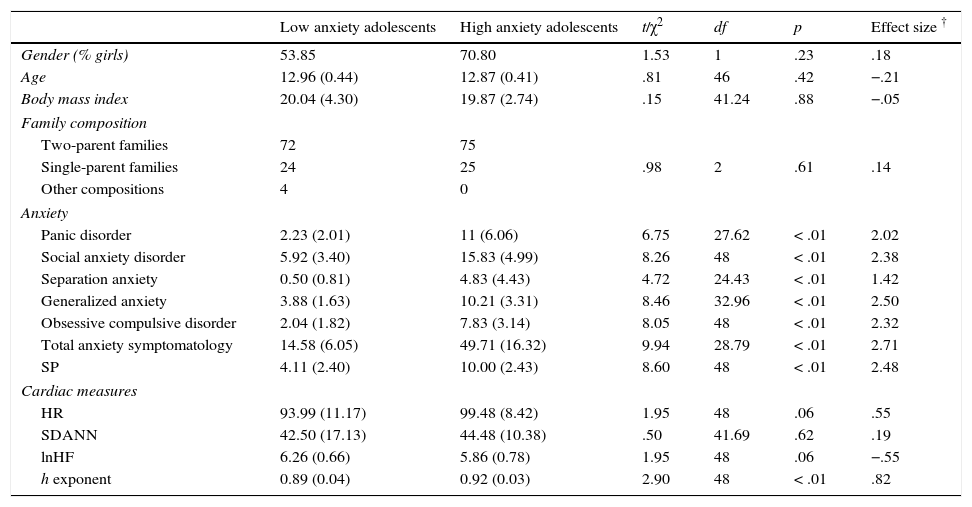
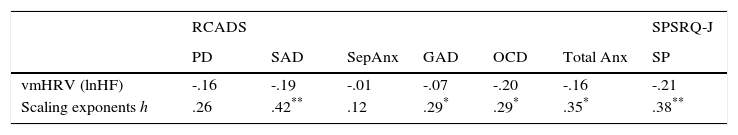
ResultsTable 1 summarizes the socio-demographic features of samples presented by the study groups. Moreover, scores arising from the psychological collected data are shown. As can be observed, there were no significant differences between groups, but expected significant differences in terms of psychological measures (p<.05 for all these measures).Regarding the cardiac measures, non-significant differences were found between groups with respect to the mean heart rate and SDANN throughout the recording (see Table 1). Conversely, significant differences were found between the scaling exponents h from the study groups (p<.01), observing higher exponents in the high anxiety group in comparison to low anxiety group. On the other hand, differences in lnHF power were marginally significant (p=.057) as the lnHF power of the low anxiety group was slightly higher than the lnHF power of the high anxiety group.All psychological variables and cardiac measures showed a normal-like distribution. Pearson's correlation analyses (see Table 2) revealed significant associations between the scaling exponents and the scores derived from the sensitivity to punishment and the overall anxiety scale, as well as the scales related to social anxiety disorder, generalized anxiety, and obsessive compulsive disorder (p<.05, for all correlations). No significant associations were found between the lnHF and the psychological variables studied.
General socio-demographic, psychological and cardiac descriptive statistics for the study groups.
| Low anxiety adolescents | High anxiety adolescents | t/χ2 | df | p | Effect size † | |
|---|---|---|---|---|---|---|
| Gender (% girls) | 53.85 | 70.80 | 1.53 | 1 | .23 | .18 |
| Age | 12.96 (0.44) | 12.87 (0.41) | .81 | 46 | .42 | −.21 |
| Body mass index | 20.04 (4.30) | 19.87 (2.74) | .15 | 41.24 | .88 | −.05 |
| Family composition | ||||||
| Two-parent families | 72 | 75 | ||||
| Single-parent families | 24 | 25 | .98 | 2 | .61 | .14 |
| Other compositions | 4 | 0 | ||||
| Anxiety | ||||||
| Panic disorder | 2.23 (2.01) | 11 (6.06) | 6.75 | 27.62 | < .01 | 2.02 |
| Social anxiety disorder | 5.92 (3.40) | 15.83 (4.99) | 8.26 | 48 | < .01 | 2.38 |
| Separation anxiety | 0.50 (0.81) | 4.83 (4.43) | 4.72 | 24.43 | < .01 | 1.42 |
| Generalized anxiety | 3.88 (1.63) | 10.21 (3.31) | 8.46 | 32.96 | < .01 | 2.50 |
| Obsessive compulsive disorder | 2.04 (1.82) | 7.83 (3.14) | 8.05 | 48 | < .01 | 2.32 |
| Total anxiety symptomatology | 14.58 (6.05) | 49.71 (16.32) | 9.94 | 28.79 | < .01 | 2.71 |
| SP | 4.11 (2.40) | 10.00 (2.43) | 8.60 | 48 | < .01 | 2.48 |
| Cardiac measures | ||||||
| HR | 93.99 (11.17) | 99.48 (8.42) | 1.95 | 48 | .06 | .55 |
| SDANN | 42.50 (17.13) | 44.48 (10.38) | .50 | 41.69 | .62 | .19 |
| lnHF | 6.26 (0.66) | 5.86 (0.78) | 1.95 | 48 | .06 | −.55 |
| h exponent | 0.89 (0.04) | 0.92 (0.03) | 2.90 | 48 | < .01 | .82 |
Note. Numerical data are presented using the average and standard deviations (between brackets). Categorical variables (gender and family composition) are showed as percentage of cases.
Effect sizes were calculated using the Cramer's ϕ statistic for categorical data and Cohen's d statistic for numerical data.
SP=Sensitivity to punishment.
HR=Heart rate (measured in bpm); SDANN=standard deviation of the averages of normal-to-normal beat intervals in all 5-minute segments of the entire recording; lnHF=logarithm of high frequency band power.
Pearson's correlations between cardiac measures and psychological variables.
| RCADS | SPSRQ-J | ||||||
|---|---|---|---|---|---|---|---|
| PD | SAD | SepAnx | GAD | OCD | Total Anx | SP | |
| vmHRV (lnHF) | -.16 | -.19 | -.01 | -.07 | -.20 | -.16 | -.21 |
| Scaling exponents h | .26 | .42** | .12 | .29* | .29* | .35* | .38** |
Note. RCADS=Revised Children's Anxiety and Depression Scale; SPSRQ-J=Sensitivity to Punishment and Sensitivity to Reward Questionnaire Junior.
PD=Panic disorder; SAD=Social anxiety disorder; SepAnx=Separation anxiety; GAD=Generalized anxiety disorder; OCD=Obsessive compulsive disorder; Total Anx=Total anxiety symptomatology scale.
SP=Sensitivity to punishment.
vmHRV=Vagally-mediated heart rate variability.
The association between anxiety symptoms and diminished vmHRV has received increasing attention over the last decades, following the influential theoretical models developed by Porges (2001) and Thayer and Lane (2000, 2009). Despite the valuable information provided by this research, with the growth of nonlinear dynamic systems-based research (Bornas, Noguera, Pincus, & Buela-Casal, 2014; Bravi, Longtin, & Seely, 2011; Nardelli et al., 2015; Stadnitski, 2012; West, 2010), the search for nonlinear biomarkers of psychological disorders has become a promising complementary area where complex cardiac features associated with anxiety symptoms might be found also. In this study we evaluated the scaling properties of the heartbeat output from low and high anxiety groups of adolescents, and the associations between anxiety symptomatology and SP, on one hand, and vmHRV and heartbeat scaling exponents on the other.
As expected, inter-group comparisons revealed significantly higher scaling exponents for the high anxiety group while vmHRV was only marginally reduced in this group when compared to the low anxiety group. On the other hand, we hypothesized that the associations between the scaling exponents and the psychological variables should be stronger than those between these variables and the vmHRV since the former reflect more fundamental properties (e.g. multistability) of the cardiac dynamics than the latter.
The results from our correlational analyses provide some evidence that support this hypothesis as no correlations were found for vmHRV whereas several anxiety symptoms (those specifically seen in either social anxiety disorder, generalized anxiety, or OCD symptoms), the total anxiety scores, and the sensitivity to punishment scores had a significant positive correlation to the scaling exponents h, and therefore the higher the exponents, the higher the anxiety symptoms and the SP scores.
As the h values ranged from 0.78 to 0.96, higher exponents were closer to 1 (thus indicating a lower fractal dimension value). If scaling exponents reflect allometric control, then this finding shows that a fractal (or multistability) loss would be associated with anxiety and SP. Therefore, it is not (or not only) the real-time homeostatic control provided by the parasympathetic system that is altered in highly anxious adolescents but the allometric control that depends on the interaction among multiple sources (the parasympathetic and the sympathetic branches of the autonomous nervous system among others) and that operates at multiple time scales (see Ivanov et al., 2004).
The lack of associations between vmHRV and anxiety and SP scores deserves a comment as it appears to be contrary to many findings reported in the last decade. Usually, vmHRV has been estimated from the calculation of the HF band power on short recordings taken in lab conditions (participants seated in resting conditions for five minutes or so). Actually, this is a good way to measure the participants’ vagal tone, i.e. the influence of the parasympathetic system on HRV at rest, when participants are not engaged in any school-related activity. This measure, however, may not be a good way to evaluate vmHRV in everyday life conditions as it encompasses tonic but also phasic (reactive) influences of the parasympathetic system. Therefore, the findings we report here are not contrary but complementary to the vmHRV-related findings, as the latter refer to vagal tone while the former should be seen within the wider context of the parasympathetic system operating during longer periods (1.5hours) in everyday activities. Other studies with clinical samples of adults and long-term recordings under ecological conditions provided similar findings (Agorastos et al., 2013; Yeragani, Nadella, Hinze, Yeragani, & Jampala, 2000).
Regarding the study limitations, we must discuss the absence of randomized sample selection in a twofold way: high schools which accepted to participate into the study; and participants by themselves. However, we initially selected randomly a collection of 20 high schools across the Mallorca Island. Thirteen high school boards deliberately accepted (and perhaps these were biased someway), and all of the participants that filled out the questionnaires and satisfied the selection criteria participated in the study to match the sample size requirements for conducting the appropriate hypotheses test analyses (see Bornas et al., 2015, for a wider picture of sample selection flow). Future research should incorporate larger samples in order to assign randomized groups to study conditions. On the other hand, one group showed different proportions of participants according to gender (high anxiety group). However, between-group differences in terms of gender were not found in cardiac measures, supporting the lack of influence of that variable in this study. Nevertheless, future research should take into account the gender in the sample selection process.
As to the clinical implications of the findings of the study, allometric scaling exponents may be useful for assessing adolescents at risk for anxiety disorders (i.e. students with high symptomatology but without an anxiety disorder). It is noteworthy to remember that inexpensive recording devices are already available to assess heartbeat properties in daily settings, and that allometric scaling exponents can be easily calculated using any regular spreadsheet (specific Matlab code is available from the corresponding author). On the other hand, diminished allometric control of the heartbeat may reflect a lack of flexibility needed to cope with the anxiety generating demands that occur in school settings throughout any regular school day. Adolescents who are highly sensitive to punishment show inflexible response patterns (e.g. avoidance) when they have to face anxious situations (Bijttebier et al., 2009). We cannot infer any causal relationship between physiological scaling properties and behavioral patterns from this study, but we have found an association between both kinds of inflexibility that should be the focus of further studies. Even so, our study entails the first approach to addressing how adolescent anxiety-related problems are exhibited in ecological contexts considering nonlinear biomarkers.
FundingThis study was supported by the Spanish Ministry of Economy and Competitiveness grant ref. PSI2012-34780.
