


Background/Objective: Continuous Performance Tests (CPTs) have demonstrated validity when differentiating children with ADHD from healthy controls. However, these CPTs have limitations such as low ecological validity. New CPTs based on the use of Virtual Reality (VR) have appeared as supposedly improved methods for assessing ADHD. This study aims to compare the discriminant value of attentional variables produced by a VR CPT (Aula Nesplora) with that of variables from a traditional CPT (Test of Variables of Attention; TOVA) for identifying ADHD. Method: A total of 338 children aged between 6 and 16 years old (M = 10.84, SD = 3.01) participated in the study: 31.95% correspond to the inattentive presentation, 15.38% to the impulsive-hyperactive presentation, 22.78% to the combined presentation, and the remaining 29.88% correspond to children without ADHD. Results: Results indicated that Aula Nesplora predicts ADHD presentations better than TOVA. It also differentiates better between ADHD and non-ADHD students. Conclusions: These findings show the potential advantages of using virtual reality in ADHD assessment, as it facilitates the diagnosis of ADHD and the differentiation of its presentations in a realistic environment.
Antecedentes/objetivos: Los tests de ejecución continua (Continuous Perfomance Test; CPT) han mostrado utilidad en la diferenciación de los niños con TDAH de los controles. Sin embargo, este tipo de tarea no está exenta de limitaciones como su baja validez ecológica. Para la mejora de la evaluación del Trastorno por Déficit de Atención con Hiperactividad (TDAH) surgen en los últimos años los CPTs en realidad virtual. Este estudio tiene como objetivo comparar el valor discriminativo de las variables proporcionadas por un CPT basado en la realidad virtual (Aula Nesplora) con respecto a aquellas recogidas por un CPT tradicional (Test de variables de atención; TOVA) para identificar las distintas presentaciones de TDAH. Método: Participaron un total de 338 estudiantes de entre 6 y 16 años (M = 10,84; DT = 3,01): 31,95% correspondientes a la presentación inatenta, 15,38% presentación hiperactiva-impulsiva, 22,78% presentación combinada y 29,88% controles. Resultados: Los resultados indicaron que el Aula Nesplora predice mejor que el TOVA las presentaciones de TDAH, así como a los estudiantes sin TDAH. Conclusiones: Se discuten las ventajas del uso de la realidad virtual en evaluación del TDAH, ya que facilitan el diagnóstico del trastorno y la diferenciación de sus presentaciones.
ADHD is a common disorder in childhood and one of the most frequent conditions affecting school performance. International studies cite prevalence rates ranging from 5% to 7% in the school-age population (Polanczyk, Willcutt, Salum, Kieling, & Rohde, 2014). This disorder is leading to three subcategories or presentations: the combined presentation, the predominantly inattentive presentation, and the predominantly impulsive/hyperactive presentation (American Psychiatric Assocation, APA, 2013). The symptoms of ADHD can often be masked by numerous conditions that may also produce these symptoms (Biederman, Petty, Evans, Small, & Faraone, 2010), and this gives rise to the need for professionals to be provided with valid, objective instruments for diagnosing this disorder.
Many studies have focused on the origin and basis of ADHD with the aim of improving and described the existence of an executive function (EF) impairment in the ADHD population (Hall et al., 2016), which would explain the difficulty children with ADHD have controlling impulsive responses, resisting interference or distraction, organizing activities in a sequential manner, and sustaining cognitive effort while performing an activity. Studies have also shown that ADHD symptoms continue throughout life in up to 60% of cases (Miranda, Colomer, Berenguer, Roselló, & Roselló, 2016), and that this persistence has been associated with functional impairment in psychosocial, educational, professional and family functioning (Álvarez-García, Barreiro-Collazo, Núnez, & Dobarro, 2016; Dalsgaard, Nielsen, & Simonsen, 2014).
Given the variation in causes and behavioral consequences of ADHD, it is important to have instruments for an accurate diagnosis. In ADHD detection, clinical guidelines encourage professionals to collect behavioral information about the child in multiple surroundings, especially in the family and at school (Morales-Hidalgo, Hernández-Martínez, Vera, Voltas, & Canals, 2017).
Currently, there is no single test used to diagnose the disorder, and the clinician’s judgment is the most widely accepted method of assessment (Hall et al., 2016). However, some studies and systematic reviews have demonstrated the usefulness of Continuous Performance Tests (CPT) to differentiate children with ADHD from children with other diagnoses or healthy controls (Berger, Slobodin, & Cassuto, 2017; González-Castro, Rodríguez, López, Cueli, & Álvarez, 2013).
CPTs are neuropsychological tests aimed at measuring attention and impulsivity in a sustained attention and neutral task which allows information to be gathered from the individual’s performance. Typically, a CPT is a computer-based program which involves rapid presentation of visual or auditory stimuli target vs. non-target (Hall et al., 2016). This kind of test provides quantitative data on different variables of interest which have been shown to be useful in the detection of ADHD (Rapport, Chung, Shore, Denney, & Isaacs, 2000). The most important variables include omission errors (missed responses), and reaction times (RT; latency response), which are related to sustained attention deficits; as well as commission errors (responding when the target is not present), and variability in the RT, which are indicative of impulsive and hyperactive symptoms. Although they have definite advantages, there are currently many varieties of CPTs, which might complicate matters when making decisions about what sort of measure to use for the diagnosis of ADHD. For instance, some versions include a single (either visual or auditory) sensorial modality, while others integrate both modalities (Berger & Cassuto, 2014).
Hall et al. (2016), in a systematic review, provided an overview of the evidence for commercially available CPTs, with similar structures but different target stimuli, that have been used for the clinical diagnosis of children and young people with ADHD. Like other cognitive tests, the CPT may serve as an aid in the diagnosis but is still considered controversial by some authors, mainly due to questions regarding limited sensitivity, specificity, and ecological validity (Díaz-Orueta et al., 2014; Rizzo et al., 2000). More specifically, Rodríguez, Gonzalez-Castro, Cueli, Areces, and González-Pienda (2016) highlighted the importance of clinicians carefully analysing the results from CPTs, as the majority of professionals saw cases in which children performed well despite clinical deterioration, and cases of low scores without clinical problems. These results are closely related to the numbers of “false positives” and “false negatives”. Moreover, many authors (Riccio & Reynolds, 2001) have reported that CPT tools demonstrated sufficient sensitivity to ADHD, but inadequate specificity. For this reason, tools which provide better sensitivity and specificity levels are necessary to reduce the proportion of false positives and false negatives. Although CPTs should ideally have both high sensitivity and specificity, the clinician must often sacrifice one or the other, thus adding to false positive diagnostic errors (if they opt for higher sensitivity) or to false negative errors (if they choose higher specificity) (Riccio & Reynolds, 2001).
Ecological validity describes the degree to which a psychological test offers results similar to those found in real life (Negut, Jurma, & David, 2017). In an attempt to improve assessment methods offering better ecological validity new CPTs have been produced based on Virtual Reality (VR), such as the Virtual Classroom developed by Rizzo et al. (2000) or the Aula Nesplora test (Climent, Banterla, & Iriarte, 2011). Virtual reality is a relatively new technology that enables individuals to immerse themselves in a virtual world (Bioulac et al., 2012). The virtual classroom developed by Rizzo has been shown to be a good measure for the diagnosis and characterization of ADHD symptoms (Rizzo et al., 2000). Similarly, Aula Nesplora has exhibited good discriminatory power in the differential diagnosis of ADHD and its presentations (Areces, Rodríguez, García, Cueli, & González-Castro, 2016). These virtual CPTs offer some advantages compared to traditional neuropsychological assessment measures and represent an important innovation in the diagnosis of ADHD, as they involve sustained attention and response inhibition tasks, like traditional CPTs, but take place in the context of a virtual classroom, providing a more realistic and ecologically-valid assessment environment (Bioulac et al., 2012; Negut et al., 2017).
Purpose of this studyTherefore, following on from findings from the literature (Bioulac et al., 2012) which show that neuropsychological testing using virtual reality had better ecological validity than traditional CPTs, the aim of the current study was to compare the discriminant value of attentional variables provided by a traditional CPT test (TOVA; Greenberg, 1993) with those from a virtual reality test (Aula Nesplora; Climent et al., 2011. For this purpose, two different samples of participants were used, who were randomly assigned to the different assessment tools (traditional CPT and virtual CPT) so that the groups were equivalent in terms of age and gender. In addition, considering the causal heterogeneity in ADHD (Nigg, Willcutt, Doyle, & Sonuga-Barke, 2005) each group (the group assessed by the virtual reality test and the group assessed by the traditional CPT) was split into four groups: a Control group and three ADHD groups (corresponding to each of the three ADHD presentations).
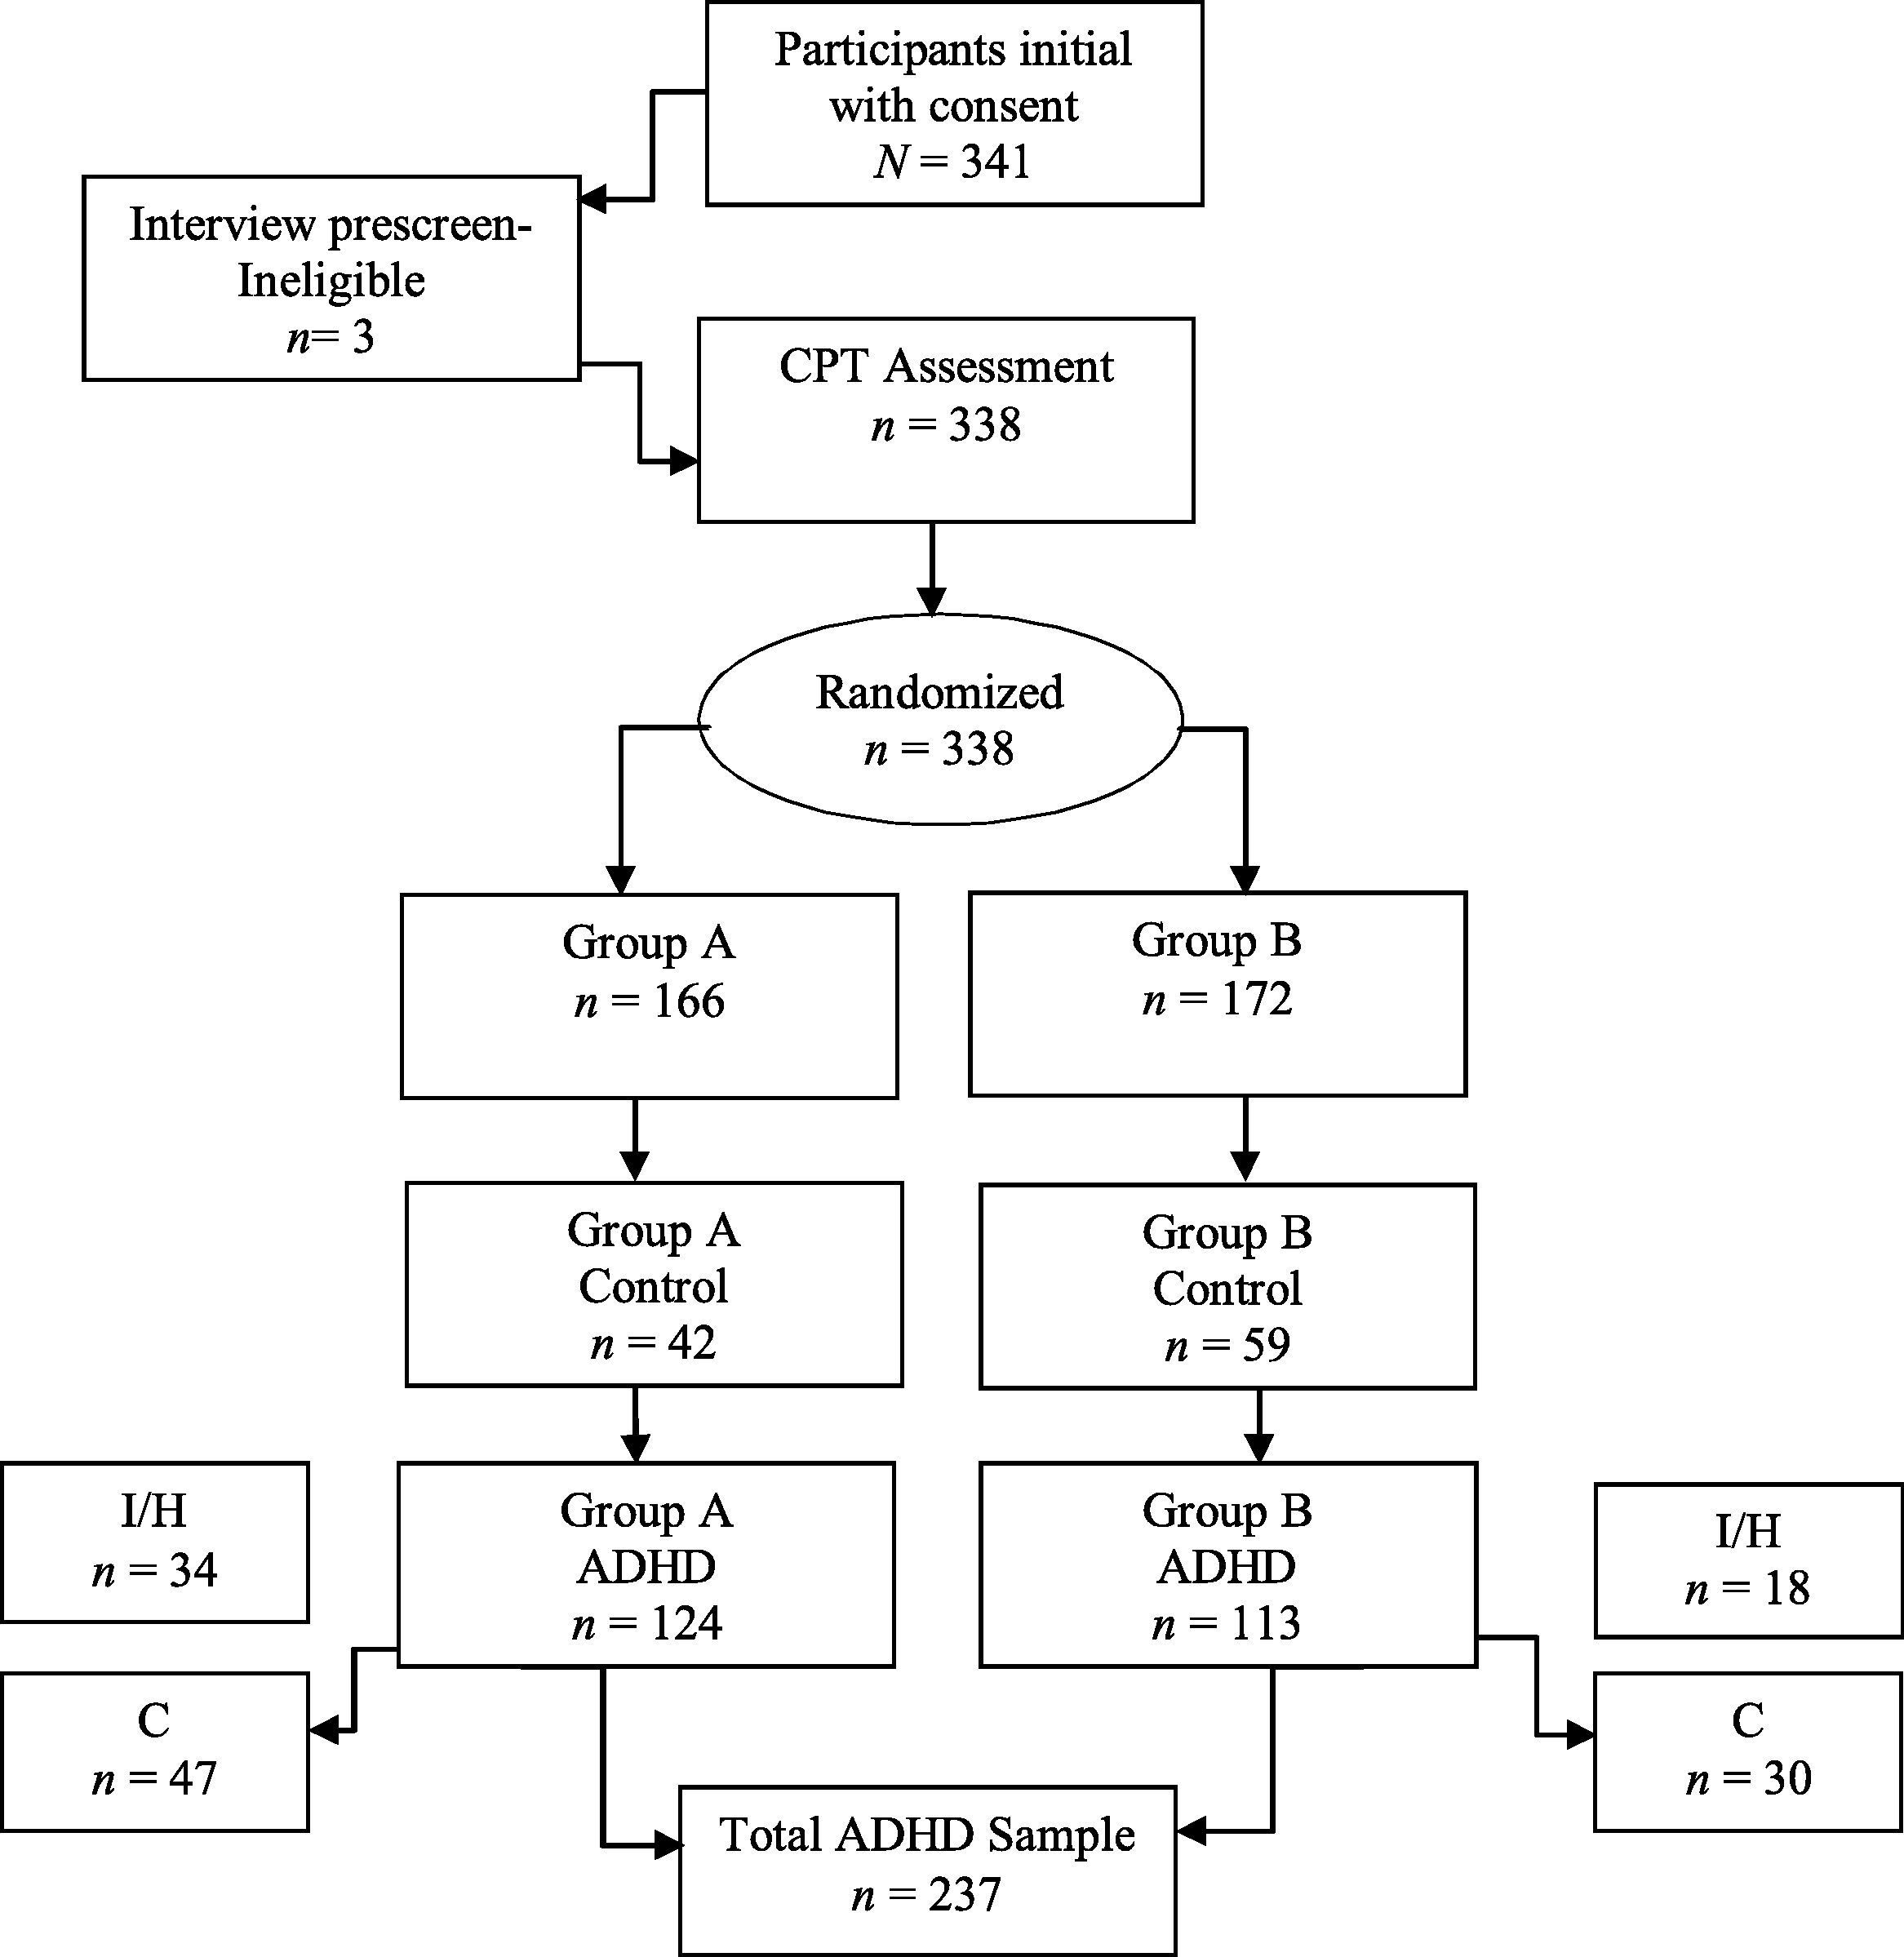
MethodParticipantsA total of 241 (71.30%) boys and 97 (28.70%) girls aged between 6 and 16 (M = 10.84, SD = 3.01) participated in the study, with an average IQ of 104.11 (SD = 11.85). A total of 101 (29.88%) participants were in the Control group (non-ADHD group), and 237 (70.12%) in the ADHD group (Table 1). 31.95% of the children in the ADHD group corresponded to the inattentive presentation, 15.38% to the impulsive-hyperactive presentation and 22.78% to the combined presentation (Fig. 1). Participants were randomly assigned to two different conditions. In one condition children with and without ADHD (N = 172; 67.40% boys and 32.60% girls) were assessed with TOVA, while in the other condition, children were assessed with Aula Nesplora (N = 166; 75.30% boys and 41% girls).
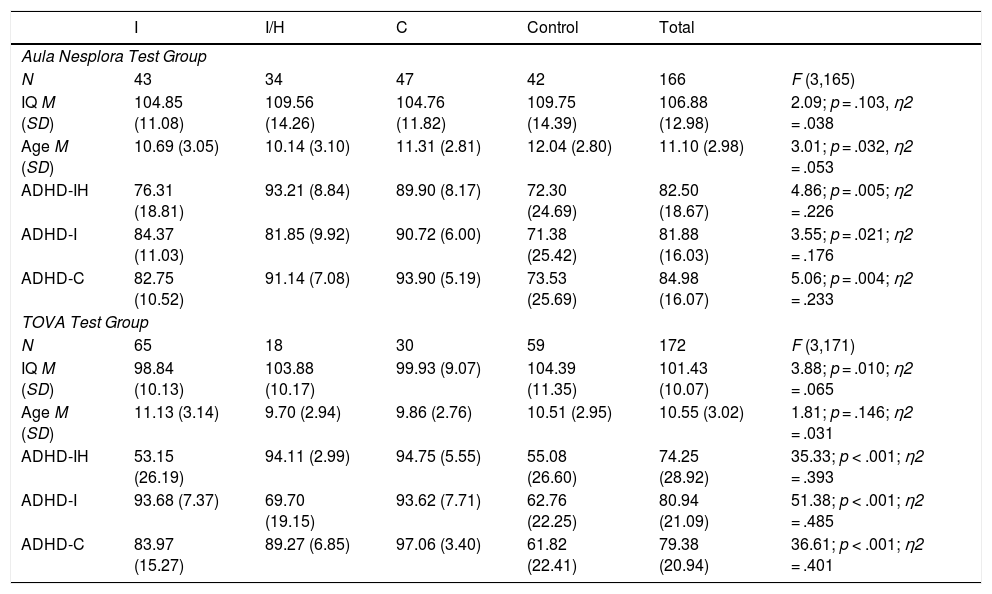
Means (M) and Standard Deviation (SD) of IQ scores, age, and ADHD percentile scores of the four groups assessed using Aula Nesplora Test and TOVA Test.
| I | I/H | C | Control | Total | ||
|---|---|---|---|---|---|---|
| Aula Nesplora Test Group | ||||||
| N | 43 | 34 | 47 | 42 | 166 | F (3,165) |
| IQ M (SD) | 104.85 (11.08) | 109.56 (14.26) | 104.76 (11.82) | 109.75 (14.39) | 106.88 (12.98) | 2.09; p = .103, η2 = .038 |
| Age M (SD) | 10.69 (3.05) | 10.14 (3.10) | 11.31 (2.81) | 12.04 (2.80) | 11.10 (2.98) | 3.01; p = .032, η2 = .053 |
| ADHD-IH | 76.31 (18.81) | 93.21 (8.84) | 89.90 (8.17) | 72.30 (24.69) | 82.50 (18.67) | 4.86; p = .005; η2 = .226 |
| ADHD-I | 84.37 (11.03) | 81.85 (9.92) | 90.72 (6.00) | 71.38 (25.42) | 81.88 (16.03) | 3.55; p = .021; η2 = .176 |
| ADHD-C | 82.75 (10.52) | 91.14 (7.08) | 93.90 (5.19) | 73.53 (25.69) | 84.98 (16.07) | 5.06; p = .004; η2 = .233 |
| TOVA Test Group | ||||||
| N | 65 | 18 | 30 | 59 | 172 | F (3,171) |
| IQ M (SD) | 98.84 (10.13) | 103.88 (10.17) | 99.93 (9.07) | 104.39 (11.35) | 101.43 (10.07) | 3.88; p = .010; η2 = .065 |
| Age M (SD) | 11.13 (3.14) | 9.70 (2.94) | 9.86 (2.76) | 10.51 (2.95) | 10.55 (3.02) | 1.81; p = .146; η2 = .031 |
| ADHD-IH | 53.15 (26.19) | 94.11 (2.99) | 94.75 (5.55) | 55.08 (26.60) | 74.25 (28.92) | 35.33; p < .001; η2 = .393 |
| ADHD-I | 93.68 (7.37) | 69.70 (19.15) | 93.62 (7.71) | 62.76 (22.25) | 80.94 (21.09) | 51.38; p < .001; η2 = .485 |
| ADHD-C | 83.97 (15.27) | 89.27 (6.85) | 97.06 (3.40) | 61.82 (22.41) | 79.38 (20.94) | 36.61; p < .001; η2 = .401 |
Note. I = Inattentive presentation; IH = Impulsive and Hyperactivity presentation; C = Combined presentation; ADHD-IH = percentile in items related to Impulsive- Hyperactive symptoms (EDAH); ADHD-I = percentile in items related to Inattentive symptoms (EDAH); ADHD-C = percentile in items related to Combined symptoms (EDAH).

Participants were equivalent in terms of age and gender. There were no statistically significant differences between the samples with respect to age, t (336) = -1.66, p = .097 (mean age of the children assessed by TOVA = 10.55 years vs. mean age of the children assessed by Aula Nesplora = 11.10). However, some significant differences in IQ were found, t (338) = -4.297, p < .001 (mean IQ of children assessed by TOVA = 101.43 vs. mean IQ of children assessed by Aula Nesplora = 106.88). The statistical analysis performed on the Aula Nesplora test and TOVA test samples are showed in Table 1.
None of the ADHD children were taking any medication during the 72 hours before the assessment in order to collect objective information (without effects of medication) about the behavior of the children.
Inclusion criteria: The ADHD group was composed of children with a diagnostic report (by a Clinical Center) specifying the type of ADHD presentation. Using this information, the researchers confirmed the diagnosis and its presentation using the symptomatology described in DSM-5 and scoring the subject on the scale (EDAH; Farré & Narbona, 2001). Children without ADHD were recruited from elementary schools, while children with ADHD were recruited from clinical and treatment centers in Northern Spain. The criteria for inclusion in the Control group were to be in a similar age-range and not have a psychiatric diagnosis in order to compare the performance of those with ADHD to a peer group without ADHD.
Exclusion criteria: First, the Wechsler Intelligence Scale for Children–IV (WISC-IV; Wechsler, 2005) was used to eliminate participants with IQs below 70 or over 130 from the control and ADHD groups. ADHD children were excluded if they presented ADHD with a comorbid disorder. Similarly, children from the Control group were excluded if they presented problems such as anxiety, depression, or learning difficulties. In order to do that, it was necessary to assess them using the Interview for Children (DISC-IV; Shaffer, Fisher, Lucas, Dulcan, & Schwab-Stone, 2000). Three children were eliminated due to the presence of learning difficulties.
InstrumentsExecutive measures using Virtual Reality. Aula Nesplora (Climent et al., 2011) is a CPT based on a VR environment that reproduces the conditions of a classroom. Aula Nesplora evaluates attention, impulsivity, processing speed, and motor activity in children and adolescents between 6 and 16 years of age. The virtual environment is shown through 3D glasses (Head Mounted Display, HMD). Motion sensors and headphones are also included in order to make the task as realistic as possible. The participant takes the perspective of a student sitting at one of the desks looking at the blackboard. Head movements are registered by sensors located in the glasses and the software updates the angle of vision, giving the subject the feeling of actually being in a virtual classroom. The test consists of two tasks that are gradually explained by a virtual teacher. The first phase task is based on the “x-no” paradigm (traditionally known as “no-go”) in which the participant must press a button when they see (in the virtual blackboard presented by 3D glasses) or hear (through headphones) a stimulus, only if the stimulus is not “apple”. In the second phase, an “x” paradigm (or “go” task) is incorporated, with participants being asked to press a button whenever they see or hear the number “seven.” The variables provided by the instrument are no different from those of other CPTs, however, it completes this information, providing different measures by sensory modality (visual vs. auditory), presence/absence of distractors, and task type (go vs. no-go). The distribution of the distractors is different depending on the type of task (“no-go”, or “go”). During the first (no-go) task there are 9 distractors (two visual, three auditory, and four combined visual and auditory distractors). However, in the second (go) task there are 7 distractors (two visual, three auditory and one combined). In the present study the following measures were examined: omissions, response time, commissions, and variability according to task type, which represents the performance in the two halves of the test. Cronbach alpha for the test was .72.
Executive measures using traditional CPT. TOVA (Greenberg, 1993) is a CPT which provides objective measures of attention and inhibitory control normed by gender for ages 4 to 80. This test presents two simple images. The first shows the stimulus at the top of the screen and the second at the bottom. The participant is given a push-button that should only be pressed when the first image appears. The stimuli are presented for 100 milliseconds (ms) at a between-stimuli interval of 2,000 ms. The test lasts approximately 22.5 min with a 3-minute training session before testing. The TOVA incorporates both a ‘rare target’ and ‘response inhibition’ paradigm by presenting 22.5% targets and 77.5% non-targets in the first half of the test, and then 77.5% of targets and 22.5% of non-targets in the second half of the test. Once the test is finished, TOVA provides the following indicators: omissions (number of missed targets), response time (mean response latency), commissions (responses to non-targets), and variability (standard deviation of response times) and gives the performance in each variable splitting the scores of the test into four quartiles and two halves. It also indicates the number of multiple responses (number of stimuli to which the participant responded more than once) and anticipatory responses (very short latency responses). The TOVA provides an ADHD score using the formula of response time Z-score (Half 1) +D′Z score (half 2) + variability Z-score (total). The ADHD score is a comparison of the participant’s performances and that of a known ADHD sample. Alpha for this test was .82.
ProcedureThe authorities from participating schools and clinical centers signed to confirm their agreement to collaborate in the study. Prior to signing the informed consent for participating in the study, the children’s parents or guardians were informed of the aims of the project, what this experiment involved, and the benefits of taking part (parents would receive a report summarizing the main results from the neuropsychological tests administered). Once informed consents were signed, groups were formed according to the inclusion and exclusion criteria. The study was conducted in accordance with The Code of Ethics of the World Medical Association (Declaration of Helsinki), which reflects the ethical principles for research involving humans (Williams, 2008); approved and according to ethics committee guidelines (CEIC Ethics Committee of the Principality of Asturias; Approval No. CPMP/ICH/135/95. CODE: TDAH).
Data analysisThis study used an ex post facto descriptive–comparative design of four groups, three corresponding to the ADHD presentations, and a control group. Data analyses were conducted in two steps: first, the descriptive statistics for the variables under study were analyzed, paying special attention to skewness and kurtosis. Following the statistical recommendation for Behavioral Sciences (Gravetter & Wallnau, 2014), the maximum scores accepted for skewness and kurtosis were between ±2; second, two discriminant analyses were conducted to determine the specificity and sensitivity levels of each dependent variable (omissions, commissions, response time and variability -based on Virtual Reality vs. the Traditional CPT-) identifying the ADHD group and its presentation. The squared canonical correlation was included as an effect size estimation for the discriminant analyses. Following Cohen (1988), p. 79-80), r2 between .01 and .09 is small, between .09 and .25 is medium, and above .25 is large.
ResultsInitial data screeningTable 2 shows that most of the variables met criteria of normality with some exceptions in omissions in the sample assessed by the Aula Nesplora test.
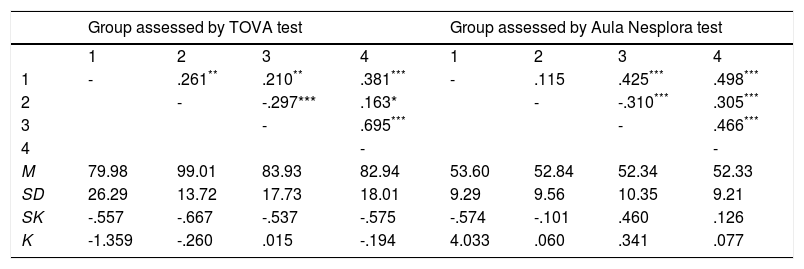
Correlation matrix corresponding to the variables from CPTs (TOVA Vs Aula Nesplora) and descriptive data (means, standard deviation, skewness and kurtosis).
| Group assessed by TOVA test | Group assessed by Aula Nesplora test | |||||||
|---|---|---|---|---|---|---|---|---|
| 1 | 2 | 3 | 4 | 1 | 2 | 3 | 4 | |
| 1 | - | .261** | .210** | .381*** | - | .115 | .425*** | .498*** |
| 2 | - | -.297*** | .163* | - | -.310*** | .305*** | ||
| 3 | - | .695*** | - | .466*** | ||||
| 4 | - | - | ||||||
| M | 79.98 | 99.01 | 83.93 | 82.94 | 53.60 | 52.84 | 52.34 | 52.33 |
| SD | 26.29 | 13.72 | 17.73 | 18.01 | 9.29 | 9.56 | 10.35 | 9.21 |
| SK | -.557 | -.667 | -.537 | -.575 | -.574 | -.101 | .460 | .126 |
| K | -1.359 | -.260 | .015 | -.194 | 4.033 | .060 | .341 | .077 |
Note. 1 = Omissions; 2 = Commissions; 3 = Response Time; 4 = Variability. M = Mean; SD = Standard Deviation; SK = Skewness; K = Kurtosis.
In both CPTs, the stronger correlations are between the variables response time and variability, and between omissions and variability.
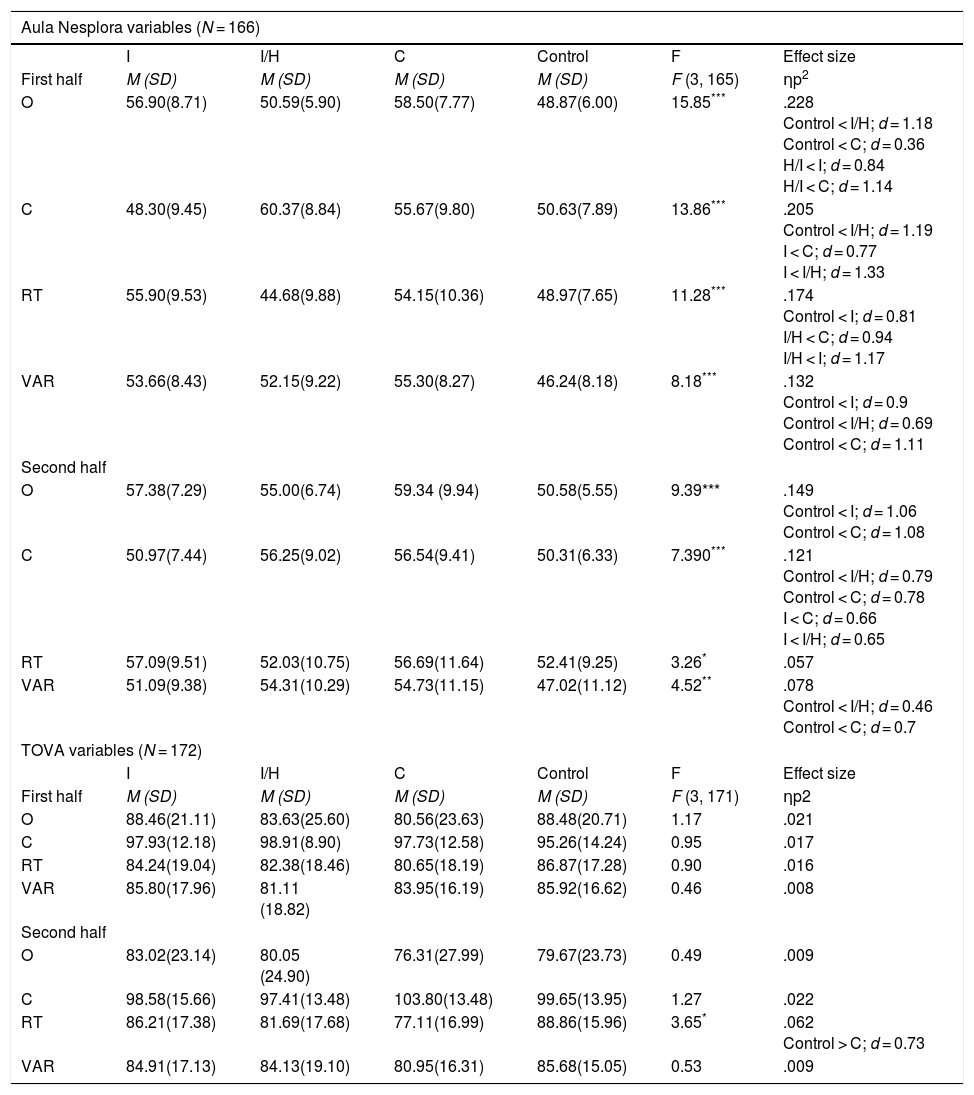
Differences between groups for dependent variables provided by Aula Nesplora vs. TOVA in the two halves of the testsTable 3 shows descriptive statistics of the dependent variables and results from two MANCOVAs. Only the variables that generated statistically significant differences among the groups were included as covariates (age in the case of Aula Nesplora, and IQ in the case of TOVA) (Table 1).
Differences between groups in Aula Nesplora and TOVA variables.
| Aula Nesplora variables (N = 166) | ||||||
|---|---|---|---|---|---|---|
| I | I/H | C | Control | F | Effect size | |
| First half | M (SD) | M (SD) | M (SD) | M (SD) | F (3, 165) | ηp2 |
| O | 56.90(8.71) | 50.59(5.90) | 58.50(7.77) | 48.87(6.00) | 15.85*** | .228 Control < I/H; d = 1.18 Control < C; d = 0.36 H/I < I; d = 0.84 H/I < C; d = 1.14 |
| C | 48.30(9.45) | 60.37(8.84) | 55.67(9.80) | 50.63(7.89) | 13.86*** | .205 Control < I/H; d = 1.19 I < C; d = 0.77 I < I/H; d = 1.33 |
| RT | 55.90(9.53) | 44.68(9.88) | 54.15(10.36) | 48.97(7.65) | 11.28*** | .174 Control < I; d = 0.81 I/H < C; d = 0.94 I/H < I; d = 1.17 |
| VAR | 53.66(8.43) | 52.15(9.22) | 55.30(8.27) | 46.24(8.18) | 8.18*** | .132 Control < I; d = 0.9 Control < I/H; d = 0.69 Control < C; d = 1.11 |
| Second half | ||||||
| O | 57.38(7.29) | 55.00(6.74) | 59.34 (9.94) | 50.58(5.55) | 9.39*** | .149 Control < I; d = 1.06 Control < C; d = 1.08 |
| C | 50.97(7.44) | 56.25(9.02) | 56.54(9.41) | 50.31(6.33) | 7.390*** | .121 Control < I/H; d = 0.79 Control < C; d = 0.78 I < C; d = 0.66 I < I/H; d = 0.65 |
| RT | 57.09(9.51) | 52.03(10.75) | 56.69(11.64) | 52.41(9.25) | 3.26* | .057 |
| VAR | 51.09(9.38) | 54.31(10.29) | 54.73(11.15) | 47.02(11.12) | 4.52** | .078 Control < I/H; d = 0.46 Control < C; d = 0.7 |
| TOVA variables (N = 172) | ||||||
| I | I/H | C | Control | F | Effect size | |
| First half | M (SD) | M (SD) | M (SD) | M (SD) | F (3, 171) | ηp2 |
| O | 88.46(21.11) | 83.63(25.60) | 80.56(23.63) | 88.48(20.71) | 1.17 | .021 |
| C | 97.93(12.18) | 98.91(8.90) | 97.73(12.58) | 95.26(14.24) | 0.95 | .017 |
| RT | 84.24(19.04) | 82.38(18.46) | 80.65(18.19) | 86.87(17.28) | 0.90 | .016 |
| VAR | 85.80(17.96) | 81.11 (18.82) | 83.95(16.19) | 85.92(16.62) | 0.46 | .008 |
| Second half | ||||||
| O | 83.02(23.14) | 80.05 (24.90) | 76.31(27.99) | 79.67(23.73) | 0.49 | .009 |
| C | 98.58(15.66) | 97.41(13.48) | 103.80(13.48) | 99.65(13.95) | 1.27 | .022 |
| RT | 86.21(17.38) | 81.69(17.68) | 77.11(16.99) | 88.86(15.96) | 3.65* | .062 Control > C; d = 0.73 |
| VAR | 84.91(17.13) | 84.13(19.10) | 80.95(16.31) | 85.68(15.05) | 0.53 | .009 |
Note. I = Inattentive presentation; IH = Impulsive and Hyperactivity presentation; C = Combined presentation; O = Omissions; C = Commissions; RT = Response Time; VAR = Variability; M = Mean; SD = Standard Deviation. Scores above 60 in Aula Nesplora are indicative of deficit. Scores above 85 in TOVA are indicative of good executive functioning.
The first MANCOVA for the dependent variables from Aula Nesplora, taking age, F(8,160) = 1.53, p = .148, η2 = .074, as a covariate, showed statistically significant differences between the four groups, λ = .506, F(24,429) = 4.93, p < .001, η2 = .203. It is important to point out that high scores in Aula Nesplora variables are related to poor performance. Taking each variable separately, ANOVAs indicated that all variables from Aula Nesplora generated statistically significant differences between groups.
A second MANCOVA was carried out, using the dependent variables from TOVA and IQ, F(8, 162) = 1.04, p = .405, η2 = .050, as a covariate. In this case, the results did not reveal statistically significant differences between the four groups, λ = .050, F(24, 465) = 1.18, p = .249, η2 = .057. Using ANOVAs, only response time from the second half of the TOVA test gave statistically significant differences between the four groups, F(3, 171) = 3.65, p = .014, η2 = .062. Table 3 shows differences between pairs of groups and post hoc comparisons.
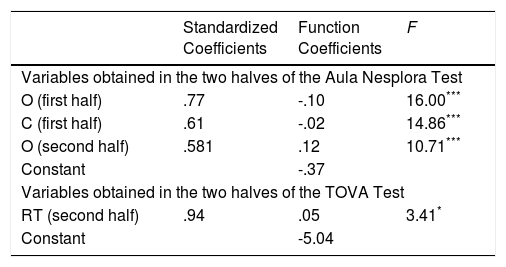
Discriminatory value of attentional variables from a traditional CPT (TOVA) vs. attentional variables from a VR CPT (Aula Nesplora)Table 4 shows results from discriminant analyses, which were aimed at comparing the explanatory power of the attentional variables (omissions, commissions, response time and variability) provided by TOVA and those produced by Aula Nesplora. The attentional variables were added to the analysis differentiating the performance of each variable in the two halves of the tests. Function coefficients provide the resulting discriminant function.
Results of two discriminant analyses using stepwise method. Analyses with attentional variables provided by Aula Nesplora (VR CPT) Vs. attentional variables provided by TOVA test (Traditional CPT).
| Standardized Coefficients | Function Coefficients | F | |
|---|---|---|---|
| Variables obtained in the two halves of the Aula Nesplora Test | |||
| O (first half) | .77 | -.10 | 16.00*** |
| C (first half) | .61 | -.02 | 14.86*** |
| O (second half) | .581 | .12 | 10.71*** |
| Constant | -.37 | ||
| Variables obtained in the two halves of the TOVA Test | |||
| RT (second half) | .94 | .05 | 3.41* |
| Constant | -5.04 | ||
Note. O = omissions; C = commissions; RT = response time associated with a correct answer. Only the variables that resulted statistically significant are shown.
**p <.01.
Looking at the first model (variables from Aula Nesplora), omissions in the two halves and commissions in the first half of the test were statistically significant predictors of group membership. The squared canonical correlation of the discriminant function was used as an indicator of effect size. Its value was high for omissions ( r2 = .261) in the first half, medium for commissions ( r2 = .205) in the first half, and small for omissions ( r2 = .005) in the second half of the test. Omissions in the first half of the test also exhibited the highest standardized coefficient, being the most important variable identifying the ADHD presentations. This model was statistically significant, λ = .58, χ² (9) = 86.95, p < .001), and classified 56.60% of the sample correctly (66.70% from the control group, 41.90% from the inattentive presentation, 44.10% from the impulsive-hyperactive presentation, and 57.40% from the combined presentation group). Finally, the highest absolute correlation between each variable and any discriminant function were found between omissions in the first half and the first discriminant function ( r = .91); between commissions in the first half and the second function (r = .99); and between omissions in the second half and the third function ( r = .69).
The second model (with TOVA variables) showed that only response time in the second half was a statistically significant predictor of group membership. The squared canonical correlation of the discriminant function was small for this variable ( r2 = .057). This model was statistically significant, λ = .943, χ² (3) = 9.97, p = .019), although only a 33.70% of the sample was correctly classified (60.30% from the control group; 9.10% from the inattentive presentation; 10.60% from the impulsive-hyperactive presentation; and 50% from the combined presentation group).
On the whole, results indicated that the model which best classified the ADHD presentations was the model based on variables from Aula Nesplora test. While the identification percentages for the control group and the combined presentations of ADHD were similar in both models, it is the first model in which the explanatory power of the variables to predict inattentive and impulsive-hyperactive presentations is greater.
The results from the first model indicate the important role of omissions and commissions in identifying and discriminating between the three ADHD presentations as well as the group without ADHD. The discriminatory analyses for the TOVA test showed that response time was a significant predictor for identifying the combined presentation and the control group.
DiscussionThis study compared the discriminant value of attentional variables provided by a traditional CPT test (TOVA) with those from a virtual reality test (Aula Nesplora) to identify the ADHD presentations along with the presence or absence of ADHD symptomatology.
According to the analysis, the Aula Nesplora test showed better sensitivity and specificity than the TOVA test. The percentages of correctly identified children with the combined presentation of ADHD and children without ADHD were similar for both tests. However, the percentage of identification of inattentive and impulsive-hyperactive presentations was significantly higher using Aula Nesplora.
Some studies and systematic reviews have demonstrated the usefulness of traditional CPTs such as TOVA in differentiating children with ADHD from other diagnoses or healthy controls with better results than TOVA produced in the current study (Berger et al., 2017; González-Castro et al., 2013). For example, Berger et al. (2017) showed high accuracy in identifying participants aged between 7 and 12 with ADHD (with sensitivity and specificity rates of 85% or more). Previous research has shown that incorporating environmental distractors improved the test’s utility in differentiating ADHD from control children (Berger & Cassuto, 2014; Berger et al., 2017). Also, according to Slobodin, Cassuto, and Berger, (2015) the negative effect of environmental distractors on CPT performance of ADHD children did not diminish with age, suggesting that distractibility is a persistent deficit in ADHD. It could be one of the reasons for the lower power of TOVA compared to AULA, given that the TOVA test does not incorporate distractors.
Studies such as González-Castro et al. (2013) showed significant differences between the ADHD presentation types. The authors also indicated that variability and response time were the variables with greater explanatory power, which is similar to the results in the current study where the response time in the second half was the most significant variable in the TOVA test. This could be explained by the inner structure of the TOVA test, in which the first half used a “rare target” paradigm where only 22.5 % of the presented stimuli are targets and 77.5 % non-targets (Hall et al., 2016). Finally, the absence of differences between the types of presentation could be related to the fact that children are becoming more and more expert in and used to using computers. Thus, putting children in this kind of environment might advantage some students who are very familiar with technology.
In contrast, Aula Nesplora demonstrated good explanatory power in the identification of ADHD and ADHD presentations showing the additional usefulness of virtual reality CPTs in providing significant information for the differentiation of the ADHD presentations. Also, Negut et al. (2017) noted that the virtual classroom developed by Rizzo et al. (2000) and a traditional CPT discriminates between children with ADHD and developmentally typical children, with the virtual classroom being more powerful than traditional CPT. However, as those authors pointed out, that study is not without limitations, such as the fact that 70% of the ADHD sample had pharmacological support during the evaluation or scarce interaction between clinical status and test condition.
In the case of the Aula Nesplora, the most important variable to identify the ADHD presentations was omissions. This could be related to the incorporation of potential distractors in the virtual reality environment, aspect that is not present in traditional CPTs (Berger & Cassuto, 2014).
These findings are supported by previous studies showing that virtual reality tools represent a breakthrough in the diagnosis of ADHD, precisely because they allow control and ADHD groups to be compared in a realistic environment (Areces et al., 2016). Other advantages of these new measures are related to the additional information provided by the instrument. For example, instruments like Aula Nesplora incorporate measurements of head movement (registered by sensors located in the glasses) and the angle of vision or ocular movement. This improves the interpretation of the results given that we can discover whether the child failed to respond to the stimulus because they were absorbed or because they had a very high activity level. Despite the higher cost of this kind of system, it provides additional information that can prevent false positive or false negative diagnostic errors (Riccio & Reynolds, 2001).
In essence, at the present a single test cannot be used as a sole measure to diagnose ADHD. Although the most commonly-used and widely-accepted method of assessment is the clinician’s judgment nowadays (Hall et al., 2016), clinical assessments have vulnerabilities, such as those related to the use of interviews and questionnaires administered to family or teachers, who may have significant biases. These vulnerabilities may lead to under-diagnosis, over-diagnosis, and to under or over treatment of ADHD (Lange et al., 2014). Hall et al. (2016) carried out a systematic review to provide an overview of the evidence for commercially available CPTs. They included two studies in which the CPT was combined with other measures such as information provided by a teacher or parents and suggested that rating scales and TOVA are measuring distinct but important aspects of ADHD, and the addition of TOVA makes a valuable contribution to assessment of ADHD. Also, according to Vogt (2017), questionnaires are based on behavioral presentations and the correlation with neurocognitive tests is known to be low to moderate. In the future it would be interesting to compare the information provided by parents and teachers with performance in traditional and virtual CPTs.
In summary, given that both tests (TOVA and Aula Nesplora) have demonstrated their usefulness in identifying children with ADHD, it may be wise to incorporate this kind of tasks into current assessment protocols. This would allow clinicians and researchers to reach a more accurate diagnosis and adjust treatment (Rodríguez et al., 2016).
Finally, it is necessary to acknowledge some limitations of the present study that should be addressed in future studies. Firstly, additional studies with a wider sample size are needed to test whether the statistical power of the variables is similar to that found in this study. In addition, a direct comparison between both tests (Virtual Reality and Traditional CPTs) within the same sample would provide more information regarding the different benefits of each one in ADHD diagnosis.
In general, these results have some significant implications for clinical management of ADHD. It has been shown that the use of CPTs –regardless their differential characteristics- allows us to accurately identify those participants who may be suffering from the disorder, and to examine in depth the characteristics of each individual’s symptoms (e.g., predominantly inattentive presentation). Once a particular profile is established, this information will be particularly useful for tailoring specific interventions, adjusted to the child’s characteristics.
This work was supported by a project of the Principality of Asturias [FC-15 GRUPIN14-053]; Ministry of Economy, Industry and Competitiveness [EDU2015-65023-P] and a predoctoral grant from the Severo Ochoa Program [BP14-030], Asturias, Spain.
