


Background/Objective: The purpose of this study is to evaluate changes of psychological well-being (PWB) in older Lithuanian city dwellers during ten years of follow-up, and to establish factors associated with it. Method: 7,115 men and women of age 45-72 years participated in the initial survey in 2006-2008. In 2016 the follow-up survey was performed among all 6,210 participants who survived. 4,266 individuals responded to postal questionnaires. PWB was evaluated by using CASP-12 questionnaire. Depressive symptoms were evaluated by CES-D-10 scale. Quality of life, self-rated health, and social activity were evaluated.Socio-demographic, socio-economic factors were included into standard questionnaire. Results: PWB deteriorated in all age groups during 10-years follow-up. Poor quality of life, poor self-rated health, having depressive symptoms, and not being member of social organization are associated with lower PWB after 10 years in men and women. Employed-retired, retired, and not socially active women have higher possibility to have lower PWB over 10 years. Conclusions: PWB in older Lithuanian city dwellers deteriorates as many other socio-economic and psychosocial indicators during ten-year follow-up. Mostly psychosocial factors, but not the socio-demographic, and socio-economic ones predict PWB over 10 years. It is crucial to understand and promote predictors of PWB in older age.
Antecedentes/Objetivo: Evaluar los cambios en el bienestar psicológico (BP) de los habitantes de las ciudades lituanas más antiguas en un seguimiento de diez años e identificar factores asociados. Método: Inicialmente participaron 7.115 hombres y mujeres de 45-72 años de edad durante los años 2006-2008. En 2016, la encuesta de seguimiento se realizó entre 6.210 participantes. De ellos, 4.266 personas respondieron a los cuestionarios. El BP fue evaluado mediante el cuestionario CASP-12. Los síntomas depresivos mediante la escala CES-D-10. Se evaluó la calidad de vida, la salud y la actividad social. Resultados: El BP se deterioró en todos los grupos de edad a los 10 años de seguimiento. Mala calidad de vida, mala autoevaluación de la salud, síntomas depresivos y la no pertenencia a una organización social se asocian con BP más bajo. Mujeres jubiladas y socialmente inactivas tienen mayor probabilidad de peor BP. Conclusiones: El BP de los habitantes de las ciudades lituanas más antiguas se deteriora, al igual que otros muchos indicadores socioeconómicos y psicosociales a los diez años de seguimiento. La mayoría de los factores psicosociales, aunque no los sociodemográficos y socioeconómicos, predicen el BP. Es crucial promover predictores de bienestar psicológico en la vejez.
When life expectancy is getting longer, factors related with healthy aging become more important. One of the factors leading to successful aging is psychological well-being (PWB; Bowling & Dieppe, 2005). PWB consists of autonomy, self-acceptance, purpose in life, environmental mastery, positive relationships and personal growth (Ryff & Singer, 2008). It reflects person's attitudes towards his life, feeling well (Huppert, 2009). In the last decades’ maintenance of PWB in older age became one of the public health priorities (Adler & Seligman, 2016). Previous studies linked PWB with various health conditions, especially cardiovascular health (Boehm & Kubzansky, 2012; Boehm, Peterson, Kivimaki, & Kubzanky, 2011), and healthy lifestyle habits (Sapranaviciute-Zabazlajeva, Luksiene, Virviciute, Bobak, & Tamosiunas, 2017). Moreover, PWB is associated not only with healthier, but also with longer life (Steptoe, Deaton, & Sone, 2015; Tamosiunas, Sapranaviciute-Zabazlajeva, Luksiene, Virviciute, & Peasey, 2017; Zaninotto, Wardle, & Steptoe, 2016). Therefore, PWB draws not only scientists’ attention but is one of the priorities in health policy.
It is known that PWB changes with age; however, it is not clear whether it improves or worsens with age (Ryff, 2014). Dynamic model of the concept varies across the nations (Karasawa et al., 2011; Schönfeld, Brailovskaia, & Margraf, 2017; Steptoe et al., 2015). In English-speaking developed countries, PWB shows a U-shaped pattern with the worst PWB being at the age of around 50 years, but in Lithuania, as in other post-Soviet countries, PWB exhibits a decline with an increasing age (Steptoe et al., 2015). Why? What factors influence dramatic decrease of PWB in older ages? Some studies have analysed the determinants of well-being in older age (Carlin et al., 2011; Snowden, Dhingra, Keyes, & Anderson, 2010), but little is known about well-being among older adults in the post-Soviet region.
Even there are many factors leading to the successful transition to older age and retirement (Heaven et al., 2013), not all changes of well-being are successfully explained by demographic or health factors (Snowden et al., 2010). As the population is aging, along PWB being one of the factors leading to successful aging, it is important to understand dynamics and predictors of PWB in the light of aging. The purpose of this study - is to evaluate changes of PWB in older Lithuanian urban adults during ten years of follow-up, and to establish factors associated with it.
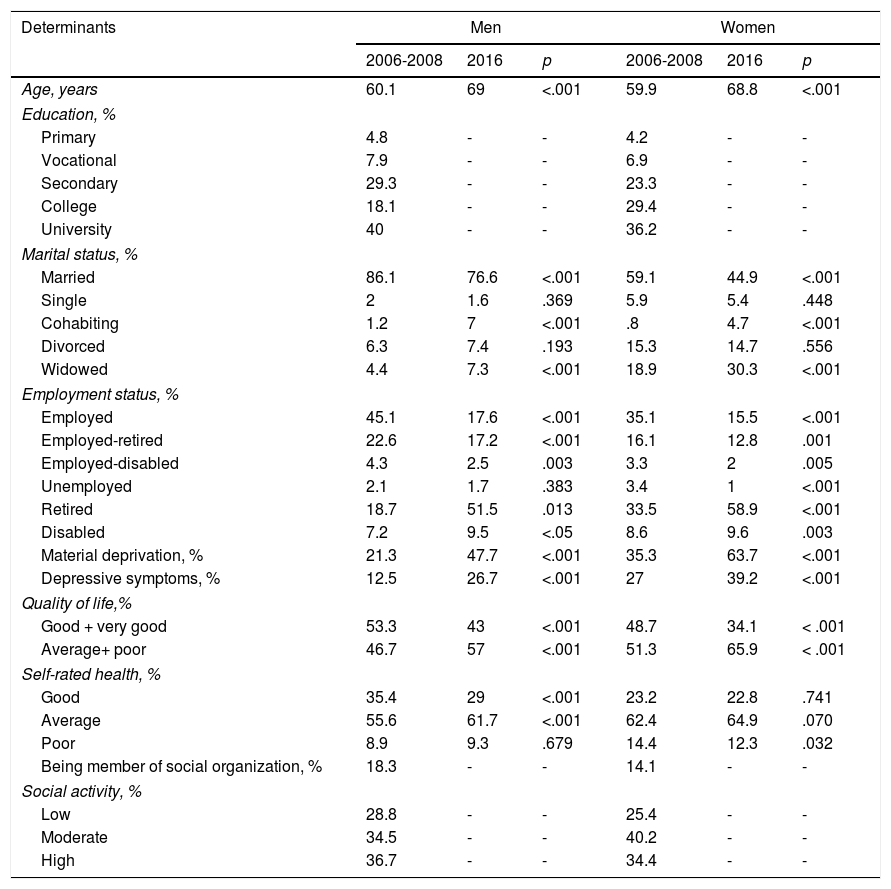
MethodParticipantsData from the surveys performed in the framework of the international HAPIEE (Health, Alcohol and Psychosocial Factors in Eastern Europe) study are presented (Peasey et al., 2006). A random sample of 10,940 Kaunas city (Lithuania) men and women aged 45–72 years, stratified by gender and age was selected from Lithuanian register of population as sample for initial survey. The response rate was 65%, thus 7,115 respondents participated in this health survey from 2006 to 2008. In 2016 the follow-up survey was performed among all 6,210 participants (2,569 male; 3,551 female) from the initial survey who survived till April of 2016. 4,266 individuals (1,793 male; 2,473 female) responded to postal questionnaires mailed during the follow-up survey (response rate was 68.7%). The final number of individuals in the analysis included all participants both during the initial and follow-up survey with all variables used in the logistic regression models or other analysed groups – 3,405 (1,480 male; 1,925 female). Distribution of study participants during the initial (2006-2008) and follow-up surveys (2016) by socio-demographic, socio-economic, and psychosocial characteristics is presented in Table 1.
Distribution of study participants at initial survey (2006-2008) and follow-up survey (2016) by socio-demographic, socioeconomic, and psychosocial characteristics.
| Determinants | Men | Women | ||||
|---|---|---|---|---|---|---|
| 2006-2008 | 2016 | p | 2006-2008 | 2016 | p | |
| Age, years | 60.1 | 69 | <.001 | 59.9 | 68.8 | <.001 |
| Education, % | ||||||
| Primary | 4.8 | - | - | 4.2 | - | - |
| Vocational | 7.9 | - | - | 6.9 | - | - |
| Secondary | 29.3 | - | - | 23.3 | - | - |
| College | 18.1 | - | - | 29.4 | - | - |
| University | 40 | - | - | 36.2 | - | - |
| Marital status, % | ||||||
| Married | 86.1 | 76.6 | <.001 | 59.1 | 44.9 | <.001 |
| Single | 2 | 1.6 | .369 | 5.9 | 5.4 | .448 |
| Cohabiting | 1.2 | 7 | <.001 | .8 | 4.7 | <.001 |
| Divorced | 6.3 | 7.4 | .193 | 15.3 | 14.7 | .556 |
| Widowed | 4.4 | 7.3 | <.001 | 18.9 | 30.3 | <.001 |
| Employment status, % | ||||||
| Employed | 45.1 | 17.6 | <.001 | 35.1 | 15.5 | <.001 |
| Employed-retired | 22.6 | 17.2 | <.001 | 16.1 | 12.8 | .001 |
| Employed-disabled | 4.3 | 2.5 | .003 | 3.3 | 2 | .005 |
| Unemployed | 2.1 | 1.7 | .383 | 3.4 | 1 | <.001 |
| Retired | 18.7 | 51.5 | .013 | 33.5 | 58.9 | <.001 |
| Disabled | 7.2 | 9.5 | <.05 | 8.6 | 9.6 | .003 |
| Material deprivation, % | 21.3 | 47.7 | <.001 | 35.3 | 63.7 | <.001 |
| Depressive symptoms, % | 12.5 | 26.7 | <.001 | 27 | 39.2 | <.001 |
| Quality of life,% | ||||||
| Good + very good | 53.3 | 43 | <.001 | 48.7 | 34.1 | < .001 |
| Average+ poor | 46.7 | 57 | <.001 | 51.3 | 65.9 | < .001 |
| Self-rated health, % | ||||||
| Good | 35.4 | 29 | <.001 | 23.2 | 22.8 | .741 |
| Average | 55.6 | 61.7 | <.001 | 62.4 | 64.9 | .070 |
| Poor | 8.9 | 9.3 | .679 | 14.4 | 12.3 | .032 |
| Being member of social organization, % | 18.3 | - | - | 14.1 | - | - |
| Social activity, % | ||||||
| Low | 28.8 | - | - | 25.4 | - | - |
| Moderate | 34.5 | - | - | 40.2 | - | - |
| High | 36.7 | - | - | 34.4 | - | - |
The study was approved by the Ethics Committee at University College London, UK and by Kaunas Regional Biomedical Research Ethics Committee.
InstrumentsPsychological well-being scale. Psychological well-being (PWB) was evaluated both during the initial, and follow-up surveys by a Control Autonomy Self-realization and Pleasure (CASP-12) questionnaire (Hyde, Wiggins, Higgs, & Blane, 2003). It is composed of 12 statements. For instance: “I feel free to plan for future.” Participants indicate how often (1-often, 2 - sometimes, 3 - not often, 4 - never) each statement applies to them. The total score ranges from 12 to 48, where a higher score represents higher PWB. The internal consistency of the scale was good (Cronbach's (α = .74). Participants were classified as having a higher PWB if the CASP-12 score was higher or equal to the median: ≥40 in men and ≥38 in women (in the initial survey), and >36 in men and >35 in women (in the follow-up survey). We evaluated changes of PWB over 10 years: between initial, and follow-up survey. Changes in PWB were classified into 3 categories: 1. No overall change (lower or higher PWB both at initial, and follow-up survey); 2. Improved (lower PWB at initial survey, and higher PWB at follow-up survey); 3. Deteriorated (higher PWB at initial survey, and lower PWB at follow-up survey).
Depressive symptoms. Depressive symptoms were measured using the 10-item Center for Epidemiologic Studies Depression Scale (CES-D 10; Carpenter et al., 1998) in both surveys. The participants were asked to evaluate the presence of 10 depressive symptoms during the past week on a two-point scale: yes or no. Each symptom was scored from 1 (yes) to 0 (no), resulting total score of 0 to 10. Example of the item: “I felt sad”. The scale showed good enough internal consistency (Cronbach's (α = .72). The subjects with CES-D 10 scores of 4 or more were classified as having depressive symptoms (Sapranaviciute-Zabazlajeva et al., 2014).
Other psychosocial factors. The questionnaire used both during the initial and follow-up surveys included questions for evaluation of self-rated health and self-rated quality of life.
Self-rated quality of life was evaluated by the question ‘How you would describe your quality of life?’ (categories of answers: 5-very good; 4-good; 3-average; 2-poor; and 1-very poor). The respondents were categorised into four groups according to answers regarding their quality of life: very good, good, average, and poor. Due to small number of individuals with very poor self-rated quality of life, we combined individuals with very poor and poor self-rated quality of life as group of poor self-rated quality of life. Self-rated health of respondents was assessed with the question: ‘Over the last 12 month, would you say your health has been’ – very good, good, average, poor, and very poor. Answers rated by Likert scale, respectively 1, 2, 3, 4, and 5. Those who responded “very good” or “good” were included in the good self-rated health group, and those who responded “poor” or “very poor” were included in the poor self-rated health group. So finally, respondents were classified to three groups according to their self-rated health: good, average, and poor. During the initial survey only, we evaluated social activity and social participation of study participants. Social activity was evaluated by statements about participating in clubs, going to church, restaurants, theatres, and sports clubs. Participants were divided into three groups: low, moderate, and high social activity. Social participation shows the proportion of participants in the sample being a member of a social organization.
Socio-demographic and socioeconomic factors. The standard questionnaire included questions regarding the respondent's age, education, marital status, material deprivation, and employment status. Education was classified into five education levels: primary, vocational, secondary, college, and university. Marital status of all study participants was divided into five groups: single, married, cohabited, divorced, and widowed. Employment status was derived by classifying participants into employed, employed-retired, employed-disabled, disabled, retired, and unemployed groups. An indicator of material deprivation was assessed by questions about how often the person's household had difficulties in buying enough food or clothes and paying bills for housing, heating, and electricity. A higher deprivation score means a lower level of deprivation.
Statistical analysisDescriptive statistics were calculated for variables included in the data analysis. The prevalence of socio-demographic, socio-economic factors, and other factors was compared in gender groups between initial and follow-up surveys via Wilcoxon Signed Ranks and Z tests. The only continuous variable – age – was tested via Wilcoxon Signed Ranks test as it was not normally distributed. Changes in PWB in 45-72 years cohort after 10 years according to their age were tested via chi2 test. Separate analyzes by gender was carried out, because of statistically significant differences of the confounding factors in male and female groups which are explained in the previous paper (Sapranaviciute-Zabazlajeva et al., 2017).
Odds ratios (OR) and 95% confidence intervals (CI) were estimated by the two logistic regression models for lower PWB during the follow-up survey (lower than median) as dependent variables separately for men and women. As PWB predictors may vary between the age groups we have controlled the age in the analysis. In Model 1, we entered age with each socioeconomic, psychosocial, and other variable during the initial survey. In Model 2, we entered only in univariate analysis significant factors (possible covariates) as age, education level, social activity, social participation, employment status, material deprivation, quality of life, self-rated health, and PWB variables which were determined during the initial survey in one multivariate logistic regression model separately for each gender group.
In the analysis of PWB only participants who answered more than 75% of the questions were included. Missing values were changed with the average of row. Participants with the missing data in other variables were excluded from the analysis.
Data were analyzed using the IBM SPSS Statistics 20.0; p <.05 values were considered statistically significant.
ResultsTable 1 shows changes in marital, employment, and material deprivation status; and in proportions of the prevalence of depressive symptoms, and in description of quality of life, and self-rated health. In men and women groups, the proportion of widowhood increased and the proportion of married individuals in study cohort decreased from 2006 to 2016. Significantly lower proportions of men and women were employed, employed-retired, and employed-disabled. However, over 10 years there was a noticeable increase in the number of individuals who were retired and disabled. In men and women groups, the proportion of material deprivation and depressive symptoms increased over 10 years. Furthermore, increased proportion of men and women who described their quality of life and self-rated health as average and poor was also noted.
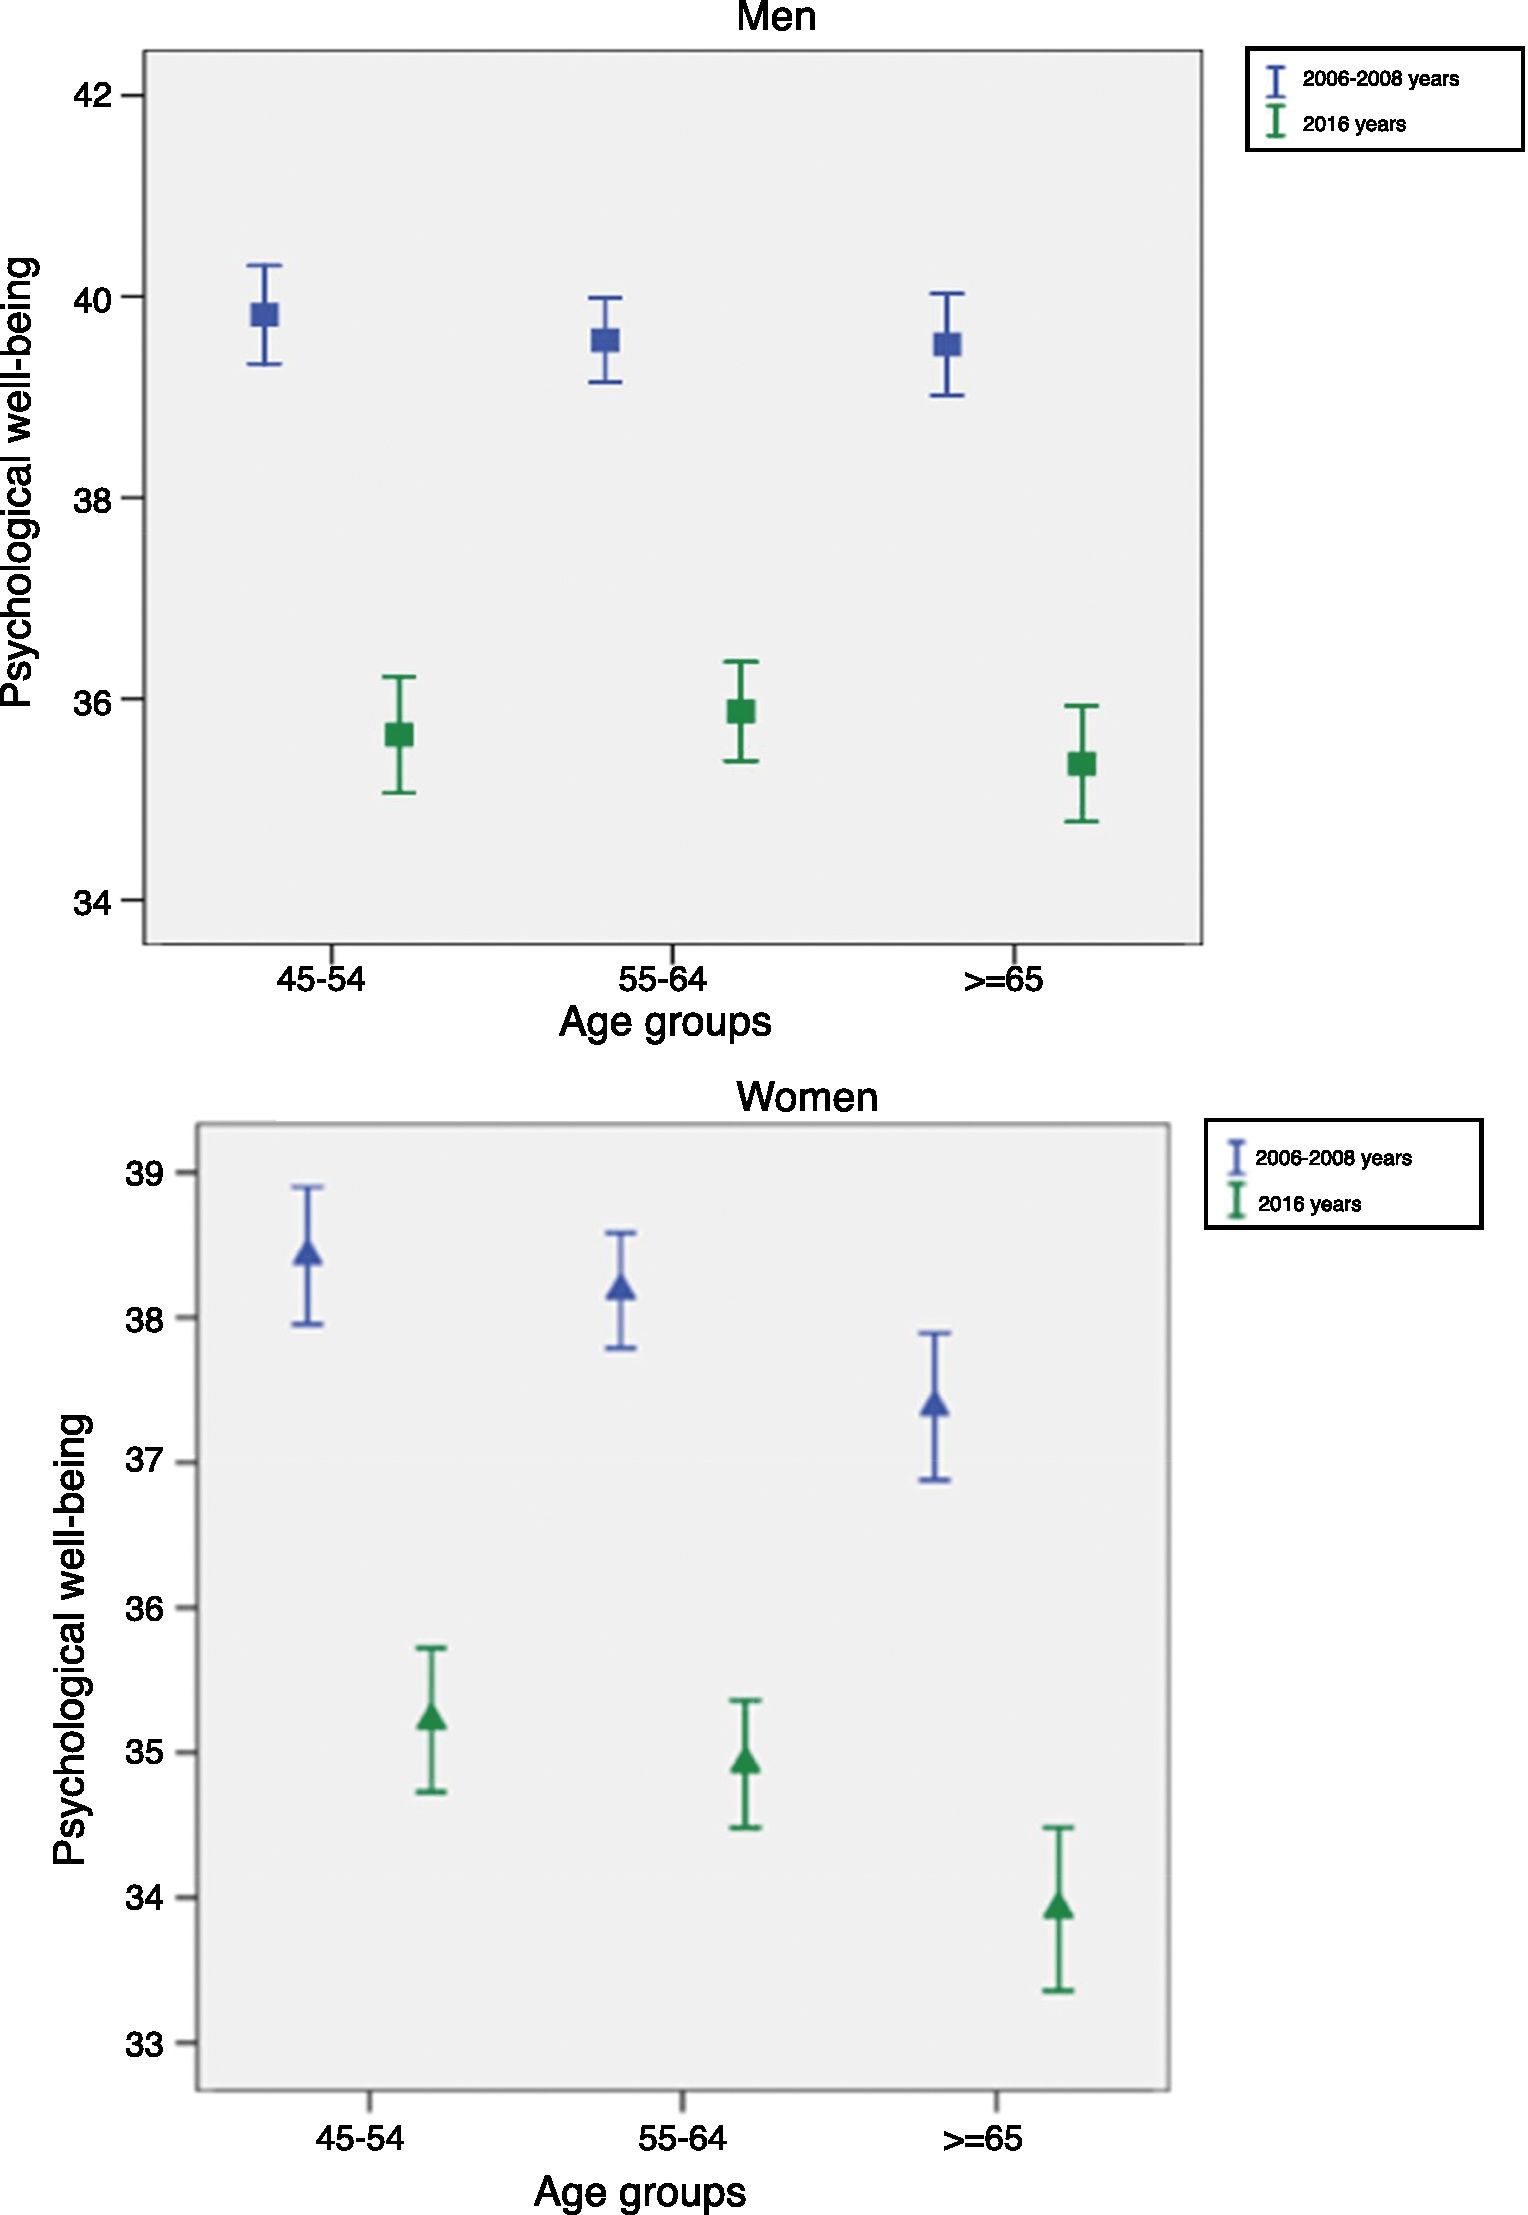
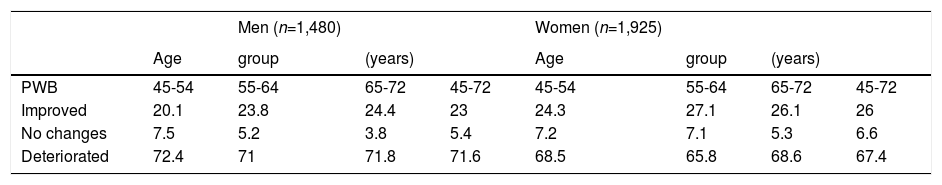
Figure 1 illustrates the mean score of PWB in different age groups of men and women in the initial survey (2006-2008), and during the follow-up survey (2016). The mean score of PWB significantly decreased in all age groups of men and women in 2016 compared to 2006-2008 years. Thus, PWB deteriorated in all age groups over 10 years. Changes in PWB in 45-72 years cohort after 10 years according to their age are presented in Table 2. The PWB improved for 23% of men and for 26% of women and deteriorated for 71.6% men and for 67.4% of women after 10 years.
 and women (B) according to their age for the initial survey (2006-2008), and during the follow-up survey (2016).")
Changes in psychological well-being (PWB) in 45-72 years cohort over 10 years according to age in the initial survey.
| Men (n=1,480) | Women (n=1,925) | |||||||
|---|---|---|---|---|---|---|---|---|
| Age | group | (years) | Age | group | (years) | |||
| PWB | 45-54 | 55-64 | 65-72 | 45-72 | 45-54 | 55-64 | 65-72 | 45-72 |
| Improved | 20.1 | 23.8 | 24.4 | 23 | 24.3 | 27.1 | 26.1 | 26 |
| No changes | 7.5 | 5.2 | 3.8 | 5.4 | 7.2 | 7.1 | 5.3 | 6.6 |
| Deteriorated | 72.4 | 71 | 71.8 | 71.6 | 68.5 | 65.8 | 68.6 | 67.4 |
Note. For men: χ2=7.68, p=.104. For women: χ2=3.679, p=.451.
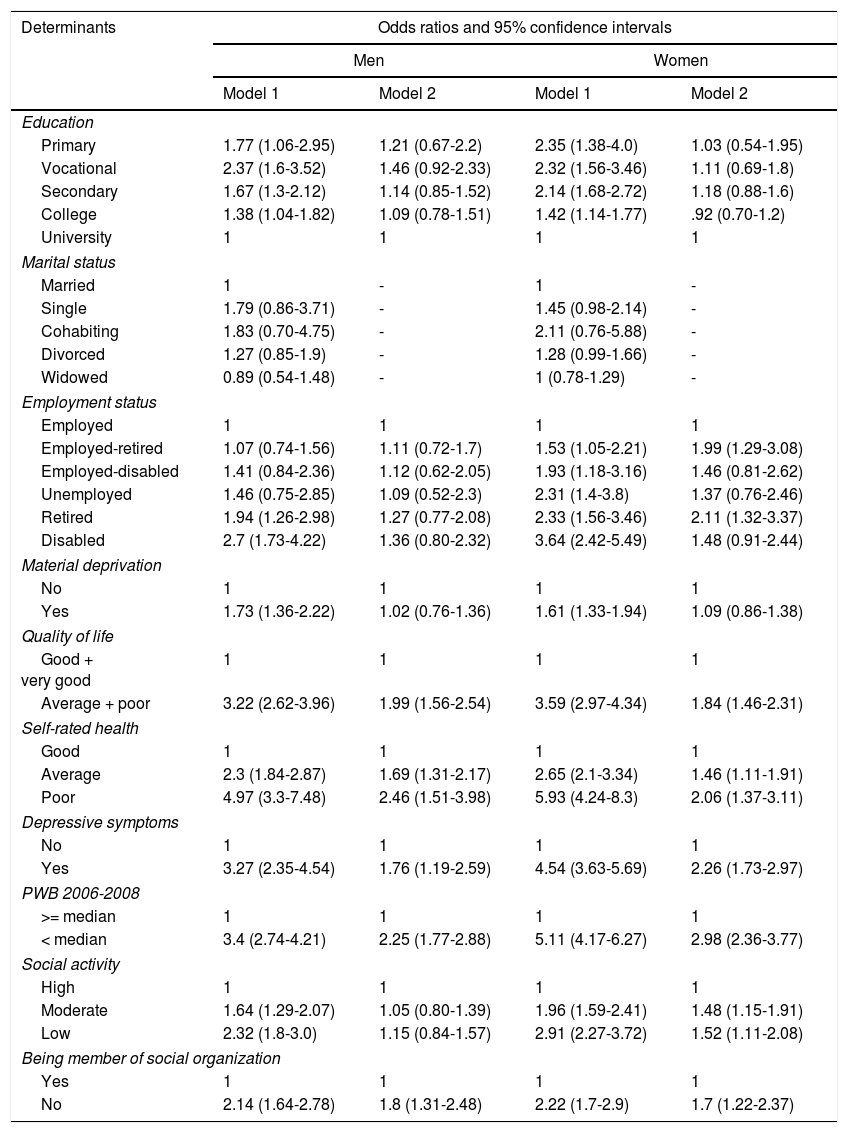
The odds ratio of lower PWB in relation to socio-demographic, socio-economic and psychosocial determinants over 10 years is presented in Table 3. First we analyzed the odds ratio of lower PWB over 10 years after adjustment for age (Model 1). Men and women who had not obtained university level education have higher odds ratio of lower PWB over 10 years. Also employment status of responders was associated with lower PWB over 10 years. Men and women who were retired and disabled have higher possibility to have lower PWB over 10 years compared with employed participants. Women who were employed-retired, employed-disabled, and unemployed also have higher possibility to have lower PWB over 10 years compared with employed women. Responders who were materially deprived, and who described their quality of life as average and poor; and self-rated health as average and poor compared with those who described it as very good and good have more possibility to have lower PWB over 10 years. Responders who have depressive symptoms have higher odds of lower PWB after 10 years compared with responders who did not have these symptoms. Responders who had moderate and low social activity, and responders who were not members of social organization have higher odds of lower PWB after 10 years compared with responders who had high social activity and were members of social organization.
Odds ratios of lower psychological well-being (PWB) (
| Determinants | Odds ratios and 95% confidence intervals | |||
|---|---|---|---|---|
| Men | Women | |||
| Model 1 | Model 2 | Model 1 | Model 2 | |
| Education | ||||
| Primary | 1.77 (1.06-2.95) | 1.21 (0.67-2.2) | 2.35 (1.38-4.0) | 1.03 (0.54-1.95) |
| Vocational | 2.37 (1.6-3.52) | 1.46 (0.92-2.33) | 2.32 (1.56-3.46) | 1.11 (0.69-1.8) |
| Secondary | 1.67 (1.3-2.12) | 1.14 (0.85-1.52) | 2.14 (1.68-2.72) | 1.18 (0.88-1.6) |
| College | 1.38 (1.04-1.82) | 1.09 (0.78-1.51) | 1.42 (1.14-1.77) | .92 (0.70-1.2) |
| University | 1 | 1 | 1 | 1 |
| Marital status | ||||
| Married | 1 | - | 1 | - |
| Single | 1.79 (0.86-3.71) | - | 1.45 (0.98-2.14) | - |
| Cohabiting | 1.83 (0.70-4.75) | - | 2.11 (0.76-5.88) | - |
| Divorced | 1.27 (0.85-1.9) | - | 1.28 (0.99-1.66) | - |
| Widowed | 0.89 (0.54-1.48) | - | 1 (0.78-1.29) | - |
| Employment status | ||||
| Employed | 1 | 1 | 1 | 1 |
| Employed-retired | 1.07 (0.74-1.56) | 1.11 (0.72-1.7) | 1.53 (1.05-2.21) | 1.99 (1.29-3.08) |
| Employed-disabled | 1.41 (0.84-2.36) | 1.12 (0.62-2.05) | 1.93 (1.18-3.16) | 1.46 (0.81-2.62) |
| Unemployed | 1.46 (0.75-2.85) | 1.09 (0.52-2.3) | 2.31 (1.4-3.8) | 1.37 (0.76-2.46) |
| Retired | 1.94 (1.26-2.98) | 1.27 (0.77-2.08) | 2.33 (1.56-3.46) | 2.11 (1.32-3.37) |
| Disabled | 2.7 (1.73-4.22) | 1.36 (0.80-2.32) | 3.64 (2.42-5.49) | 1.48 (0.91-2.44) |
| Material deprivation | ||||
| No | 1 | 1 | 1 | 1 |
| Yes | 1.73 (1.36-2.22) | 1.02 (0.76-1.36) | 1.61 (1.33-1.94) | 1.09 (0.86-1.38) |
| Quality of life | ||||
| Good + very good | 1 | 1 | 1 | 1 |
| Average + poor | 3.22 (2.62-3.96) | 1.99 (1.56-2.54) | 3.59 (2.97-4.34) | 1.84 (1.46-2.31) |
| Self-rated health | ||||
| Good | 1 | 1 | 1 | 1 |
| Average | 2.3 (1.84-2.87) | 1.69 (1.31-2.17) | 2.65 (2.1-3.34) | 1.46 (1.11-1.91) |
| Poor | 4.97 (3.3-7.48) | 2.46 (1.51-3.98) | 5.93 (4.24-8.3) | 2.06 (1.37-3.11) |
| Depressive symptoms | ||||
| No | 1 | 1 | 1 | 1 |
| Yes | 3.27 (2.35-4.54) | 1.76 (1.19-2.59) | 4.54 (3.63-5.69) | 2.26 (1.73-2.97) |
| PWB 2006-2008 | ||||
| >= median | 1 | 1 | 1 | 1 |
| < median | 3.4 (2.74-4.21) | 2.25 (1.77-2.88) | 5.11 (4.17-6.27) | 2.98 (2.36-3.77) |
| Social activity | ||||
| High | 1 | 1 | 1 | 1 |
| Moderate | 1.64 (1.29-2.07) | 1.05 (0.80-1.39) | 1.96 (1.59-2.41) | 1.48 (1.15-1.91) |
| Low | 2.32 (1.8-3.0) | 1.15 (0.84-1.57) | 2.91 (2.27-3.72) | 1.52 (1.11-2.08) |
| Being member of social organization | ||||
| Yes | 1 | 1 | 1 | 1 |
| No | 2.14 (1.64-2.78) | 1.8 (1.31-2.48) | 2.22 (1.7-2.9) | 1.7 (1.22-2.37) |
Note. Model 1 – data adjusted by age; Model 2 – data adjusted by socio-demographic factors (age, education), socio-economic factors in initial study (material deprivation, employment status), and psychosocial determinants in 2006-2008 (depressive symptoms, quality of life, self-rated health, PWB, social activity, being member of social organization).
Second, we analyzed the odds ratio of lower PWB over 10 years after additional adjustment (Model 2). We entered age, education level, and socio-economic factors (material deprivation, employment status), and psychosocial variables (depressive symptoms, quality of life, self-rated health, PWB (2006-2008), social activity, and social participation) in one multivariate logistic regression model. Thus after additional adjustment (Model 2) the results remained similar. Results show that quality of life as average and poor; self-rated health as average and poor; depressive symptoms and not being member of social organization are associated with lower PWB after 10 years in men and women groups. Furthermore, in women group employed-retired and retired status, and moderate and low social activity have increased the possibility to have lower PWB.
DiscussionIn our study PWB deteriorated in all age groups, in comparison, in American study MIDUS decline in PWB was significant only in oldest age group (Snowden et al., 2010). Most of the studies show a U-shaped relationship between PWB and age, especially in rich, English speaking countries (Karrpinen et al., 2017). Results of current research concur with previous hypothesis, that in former Soviet Union and Eastern Europe PWB decline with age (Steptoe et al., 2015). According to geopolitical position of current population we might presume that deterioration of PWB is highly influenced by environmental factors, yet there were many evidence that attitude has more influence on well-being compared to the environment (Huppert, 2009).
In the population during 2006-2016, almost all analysed socio-demographic, socio-economic and psychosocial indicators deteriorated. Is it ageing responsible for the decline? From previous studies it is known that ageing might be successful and it does not necessary result in a loss. On the contrary, many populations show increase of various health and well-being components in older age (Kusumastuti et al., 2016). So, what made older Lithuanian city dwellers look so negative in terms of socio-demographic, socio-economic, and psychosocial indicators change during the ten-year period? Last 10-year was not easy for Lithuania economics. During this 10-year period, Lithuania experienced a strong economical crisis, and has not recover yet. Inequality is still one of the largets in Europe. Poverty rates are high especially among disabled, pensioners, and older women (European Commission, 2017). In this study we also observed increased rates in disability, retirement and material deprivation from 2006 to 2016.
Previously it was suggested that economical crisis might have an effect on PWB, it could touch mostly vulnerable and deprived population (Deaton, 2012; Gudmundsdottir, 2013). Although in Iceland economical crisis did not have an affect on happiness (Gudmundsdottir, 2013), but health in other countries were affected negatively by crisis. It was explained by a lot of different confounding factors between the countries (Karanikolos et al., 2013). Our country was strongly touched by recession.
Shockingly high percentages of material deprivation in our population, which doubled during 10-year follow-up (more than 50 percentages) might be presumed to be one of the reasons for such a dramatic deterioration of PWB. Although material deprivation was associated with lower PWB in model 1, yet model 2 did not reveal significant association when all covariates were included. So material deprivation did not directly affect PWB as it was established in previous studies (Carlin et al., 2011).
Moreover, more predictors of lower PWB was found in women than in men. We believe that established differences could emerge due to significant health inequality problem in our country. Women vulnerability to lower levels of mental health might be due to the effect of health inequality and traditional gender roles on women (Lee, Kim, Yoo, Lee, & Park, 2016).
Mental illness, such as depression, was seen as a predictor of change in PWB (Snowden et al., 2010). Depressive symptoms were associated with lower PWB in our study too. Results revealed that people who had depressive symptoms in the initial study have more possibilities to have lower PWB after 10 years even after adjustment for various socio-demographic, socio-economic and psychosocial factors. As positive mental health and negative mental health are closely related, and dependent from age (Schönfeld et al., 2017), we believe that PWB and depressive symptoms factors may affect each other.
The same situation was established with quality of life and self-rated health. Participants who were in poor and moderate quality of life group in the initial study tent to have more possibilities to have lower PWB over 10 years. Research results correspond to Gates, Valenzuela, Sacdev, and Sinh (2014) model of PWB, where PWB is being predicted by depressive symptoms and quality of life. Also previous longitudinal study show that PWB predicts quality of life and self-rated health in older age (Steptoe, Demakakos, & Oliveira, 2012). So people who are happier, more satisfied with their life, and less depressed tend to feel happier after many years independently from age, employment, marital status or other socio-demographic, or socio-economic factors.
Earlier it was established, that being socially active leads to positive mood and well-being in older age (Kinderman, Tai, Pontin, Schwannauer, & Lisbao, 2015; Pinquart & Sorensen, 2000). In our study low and moderate social activity in 2006-2008 were associated with lower PWB in the follow-up survey. However, association holds its statistical significance after adjusting for other socio-demographic, socio-economic, and psychosocial factors only in women group. Maybe in men social activity is more like a mediator between PWB and other variables. Also in the older age PWB is more associated with quality of social contacts (Pinquart & Sorensen, 2000), which was not analysed in our study. Yet, not being a member of social organization in the initial survey had increased the odds to be in lower PWB group after 10 years even after adjustment. Our results confirm previous findings that socially productive activity like being a member of some kind of social organization is associated with better PWB (Wahrendorf & Siegrist, 2010). Social activity might act as a remedy for maintenance of PWB and work as a buffer from negative effects of aging. Even in presence of illness and other aging burdens personal recourses might help older people to maintain PWB (Carmel, Raveis, O’Rourke, & Tavel, 2017). We believe, that social activity is one of the coping factors.
In current research, the proportion of widowhood increased during ten years. It is known from previous studies that PWB is associated with family status (Steptoe et al., 2012; Wahrendorf & Siegrist, 2010). Decline of PWB might be predicted by current widowhood status (Burns, Browning, & Kendig, 2015). However, this was not the case in this study, because family status in the initial study was not associated with PWB during ten years even in univariate analysis. Studies marks out that widowhood has a strong and a short-term influence on PWB, but not a long-term one (Burns et al., 2015). So maybe our participants already had time to adjust to the changed family status and long-term widowhood did not have an effect on PWB after 10 years.
Retirement can also be a reason for decline of well-being, studies say. On the other hand, PWB can even improve if a person is adjusting well in pension (Heaven et al., 2013). Other studies have shown that job insecurity is strongly related with well-being and an individual after losing employment lost difficulty adjusting over time (Burchel, 2010). In our study women who were employed-retired and retired had lower odds to be in group of lower PWB compared to women who were employed. So retirement negatively affects PWB of older women.
Disability is also being associated with lower PWB in previous researches (Karrpinen et al., 2017). In our population participants who were disable in the initial study have more chances to be in lower PWB group compared with employed men and women. However, disability did not predict changes of PWB as disability in the initial study was not associated with PWB after controlling for other covariates. There is a probability that disability in older age is just a mediator between PWB and other significant factors like quality of life.
This dramatic deterioration of PWB established in our population cannot be explained only by analysed socio-demographic, socio-economic or psychosocial factors. As Huppert (2009) says, external environment can affect PWB, but personality, attitude, and actions might have a stronger influence. However, we can conclude that depressive symptoms, self-rated quality of life, self-rated health, and being a member of social organization predicts lower PWB in older Lithuanian city dwellers during 10 years’ follow-up. Moreover, in women two more predictors can be added. Retirement and social inactivity is associated with lower PWB during ten years in older Lithuanian urban women. People who are socially active, satisfied, and not depressed tend to maintain their PWB better despite aging.
Limitation of the study is that causality of PWB changes cannot be established. We only can talk about possible predictors. Not all the important predictors of PWB were included in our study as personality (Huppert, 2009), stress (Schönfeld, Brailovskaia, Bieda, Zhang, & Margraf, 2016), physical health (Carmel et al., 2017). However, the purpose was to analyse socio-demographic, socio-economic and psychosocial variables. Missing data was eliminated from the study, so it might be a reason for some lost information. One of the essential limitations of our study is only one point of follow-up during 10 years. There was no intermediate study. During follow-up only one study after 10 years was completed. However, to our knowledge, this is the first longitudinal study with a 10-year follow-up period analysing dynamics of PWB and quite a wide range of possible predictors in older population, in an Eastern Europe country. For future studies it is necessary to include more possible predictors of PWB. Efficiency evaluation of promotion programs for PWB maintenance should be a priority of further works.
FundingResearch Council of Lithuania; grant number SEN-02/2015. Wellcome Trust, 081081/Z/06/Z. US National Institute on Aging, 1R0I AG23522. The EU-funded ATHLOS Project.
