


Una investigación fue conducida para establecer y comparar una línea base de calibración a partir de mediciones realizadas a los GPS (Sistemas de Posicionamiento Global) y de taquímetro electrónico o EDM (Medición Electrónica de Distancia). El experimento se realizó en el campus de la Universidad Autónoma de Sinaloa (UAS) en Culiacán, México. El objetivo principal recae en la necesidad de establecer una línea base de calibración (∼125 m), que permita la realización continua y permanente de mediciones con receptores geodésicos GPS y con EDM para garantizar y validar las precisiones especificadas por los fabricantes de tales instrumentos. Dentro de los instrumentos de medición de diferente tipo y marca comercial utilizados y comparados se encuentran tres tipos de receptores geodésicos GPS: Topcon Hiper Lite +, Ashtech Z-Xtreme y Leica SR500 y tres tipos de EDM: Topcon GTS-236W, Pentax R-326EX y Leica TC-407. Para el experimento, los componentes de la línea base de calibración fueron calculados usando las observaciones GPS de fase de diferencias dobles libres de ionosfera y procesadas utilizando el software científico PAGES (Program for the Adjustment of GPS EphemerideS). Las mediciones GPS fueron procesadas considerando intervalos de medición de 1 segundo, un ángulo de elevación de 10 grados, y órbitas precisas GPS diseminadas por el IGS (International GNSS Service). Por otra parte, la longitud de la línea base de calibración también fue directamente determinada con base en el promedio de 20 mediciones realizadas con cada EDM sobre los monumentos BASE1 y BASE2. Resultados obtenidos con GPS concuerdan entre las diferentes marcas de equipos con diferencias de ±2mm, en contraste con los resultados obtenidos con EDM, los cuales difieren entre ±3mm.
We conducted a baseline comparison for instrument calibration using GPS (Global Positioning System) and EDM (Electronic Distance Measurement) observations. The experiment was carried out at campus of the Autonomous University of Sinaloa (UAS) in Culiacan, Mexico. The main objective of this research was to establish a short (∼125 m) baseline for calibration of geodetic-grade GPS and EDM instruments of different commercial brands to validate the precision specifications offered by the manufacturers of such instruments. We compared three types of geodetic-grade GPS receivers: Topcon Hiper Lite +, Ashtech Z-Xtreme and Leica SR500 and three types of EDM: Topcon GTS-236W, Pentax R-326EX and Leica TC-407. For the experiment, the baseline components were computed by using ionosphere-free double-difference (DD) GPS carrier phase observations processed using the PAGES software (Program for the Adjustment of GPS EphemerideS). The GPS data were processed with a 1-second sampling rate, 10-degree cutoff angle, and precise GPS orbits disseminated by IGS (International GNSS Service). The length of the calibration baseline was also obtained by averaging 20 measurements of line length directly recorded by the three different EDM instruments. GPS results agree among different brands with differences of ±2mm in contrast with the resulting EDM values that differ within ±3mm.
The calibration of geodetic instruments such as geodetic-grade GPS receivers and EDM is of importance for applications requiring the highest precision. The accuracy specifications of the instruments provided by the manufacturers may be unachievable due to errors arising from environmental conditions (e.g., atmospheric water vapor and multipath characteristics) and experience of the instrument operator. Therefore, it is useful to understand the differences between the inherent instrument precision and the actual precision according to the type of instrument used in the presence of local environmental error sources. In order to quantify environmental error sources and verify manufacturer reported precision of such geodetic instruments, it is useful to cross validate measurements by means of a well-defined calibration baseline. A calibration-baseline is composed of two or more stable geodetic monuments at which measurements with multiple instruments of high precision are made in order to infer the absolute value of the resulting measurement. With a precisely calibrated baseline, the precisions performance of diverse types of geodetic instruments can be inter-compared. For the present study, we established a calibration-baseline at campus of the Autonomous University of Sinaloa (UAS); based on measurements with three different types of geodetic-grade GPS receivers, using a differential GPS technique, as well as series of EDM observations to cross validate the baseline length.
Previous investigators sought to validate calibration baselines using high-precision tape measuring techniques (Poling, 1965). When EDM became available in the United States of America in 1952, many errors with these geodetic electronic instruments were detected, because the technique is affected by variable atmospheric moisture and other uncertainties requiring detailed evaluation of baseline length repeatability. In 1963, the Coast and Geodetic Survey (C&GS) measured a linear array of monuments, which is registered as the first work of calibration to the EDM. This calibration baseline was originally available for use by federal agencies (Dracup et al., 1994). By the year of 1970, many calibration baselines became available for public use, because several of them satisfied the calibration standards of electronic instruments for short distances required for topographic and geodetic works (Dracup et al., 1994). Nowadays, the National Geodetic Survey (NGS) is responsible for the calibration of the electronic instruments of measurement for the public (Leick, 2004). According to Fronczek (1977), the standard configuration of an NGS calibration baseline consists of one to four established monuments that form a total baseline length of 1,400 m, with intermediate distances of ∼0 m, 150 m, and 430 m. Comparison analysis on short calibration baselines for less than 100 m and 200 m can be found at Psimoulis et al. (2004) and Grejner-Brzezisnka et al. (2006), respectively. Comparisons on longer baselines (10 to 50 km) or (26 to 300 km) are also discussed through Savage et al. (1996) and Eckl et al. (2001).
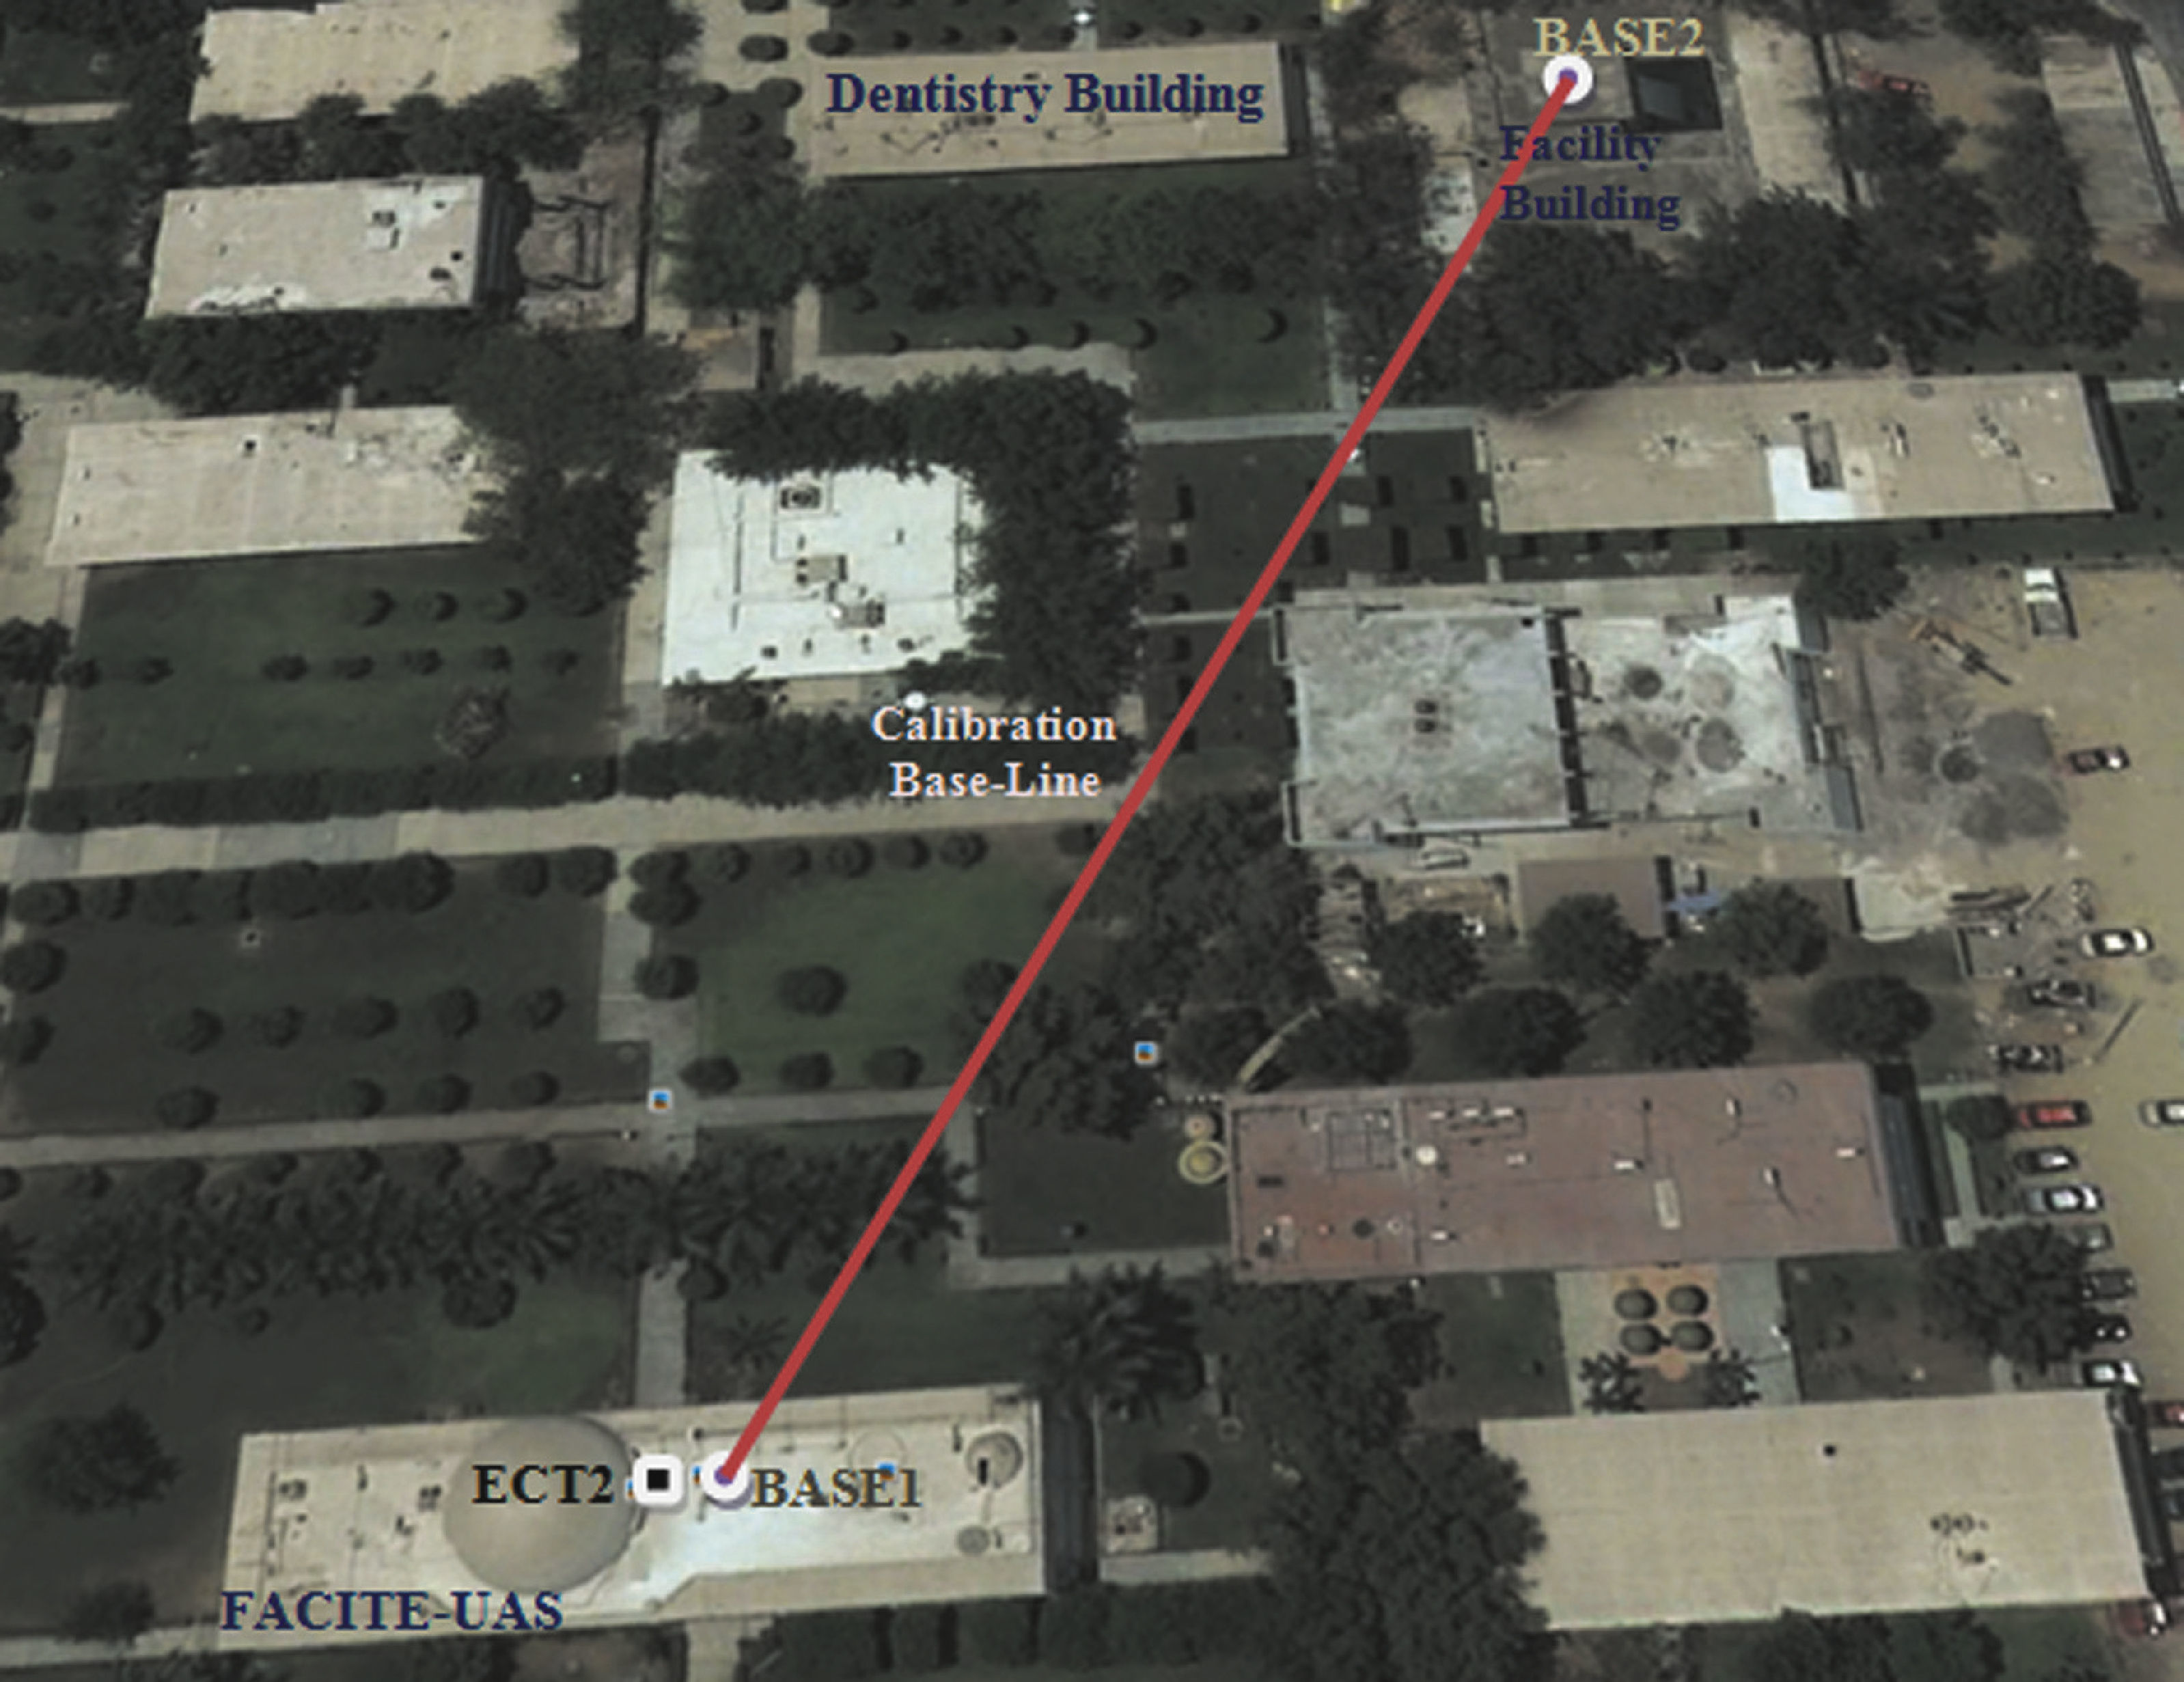
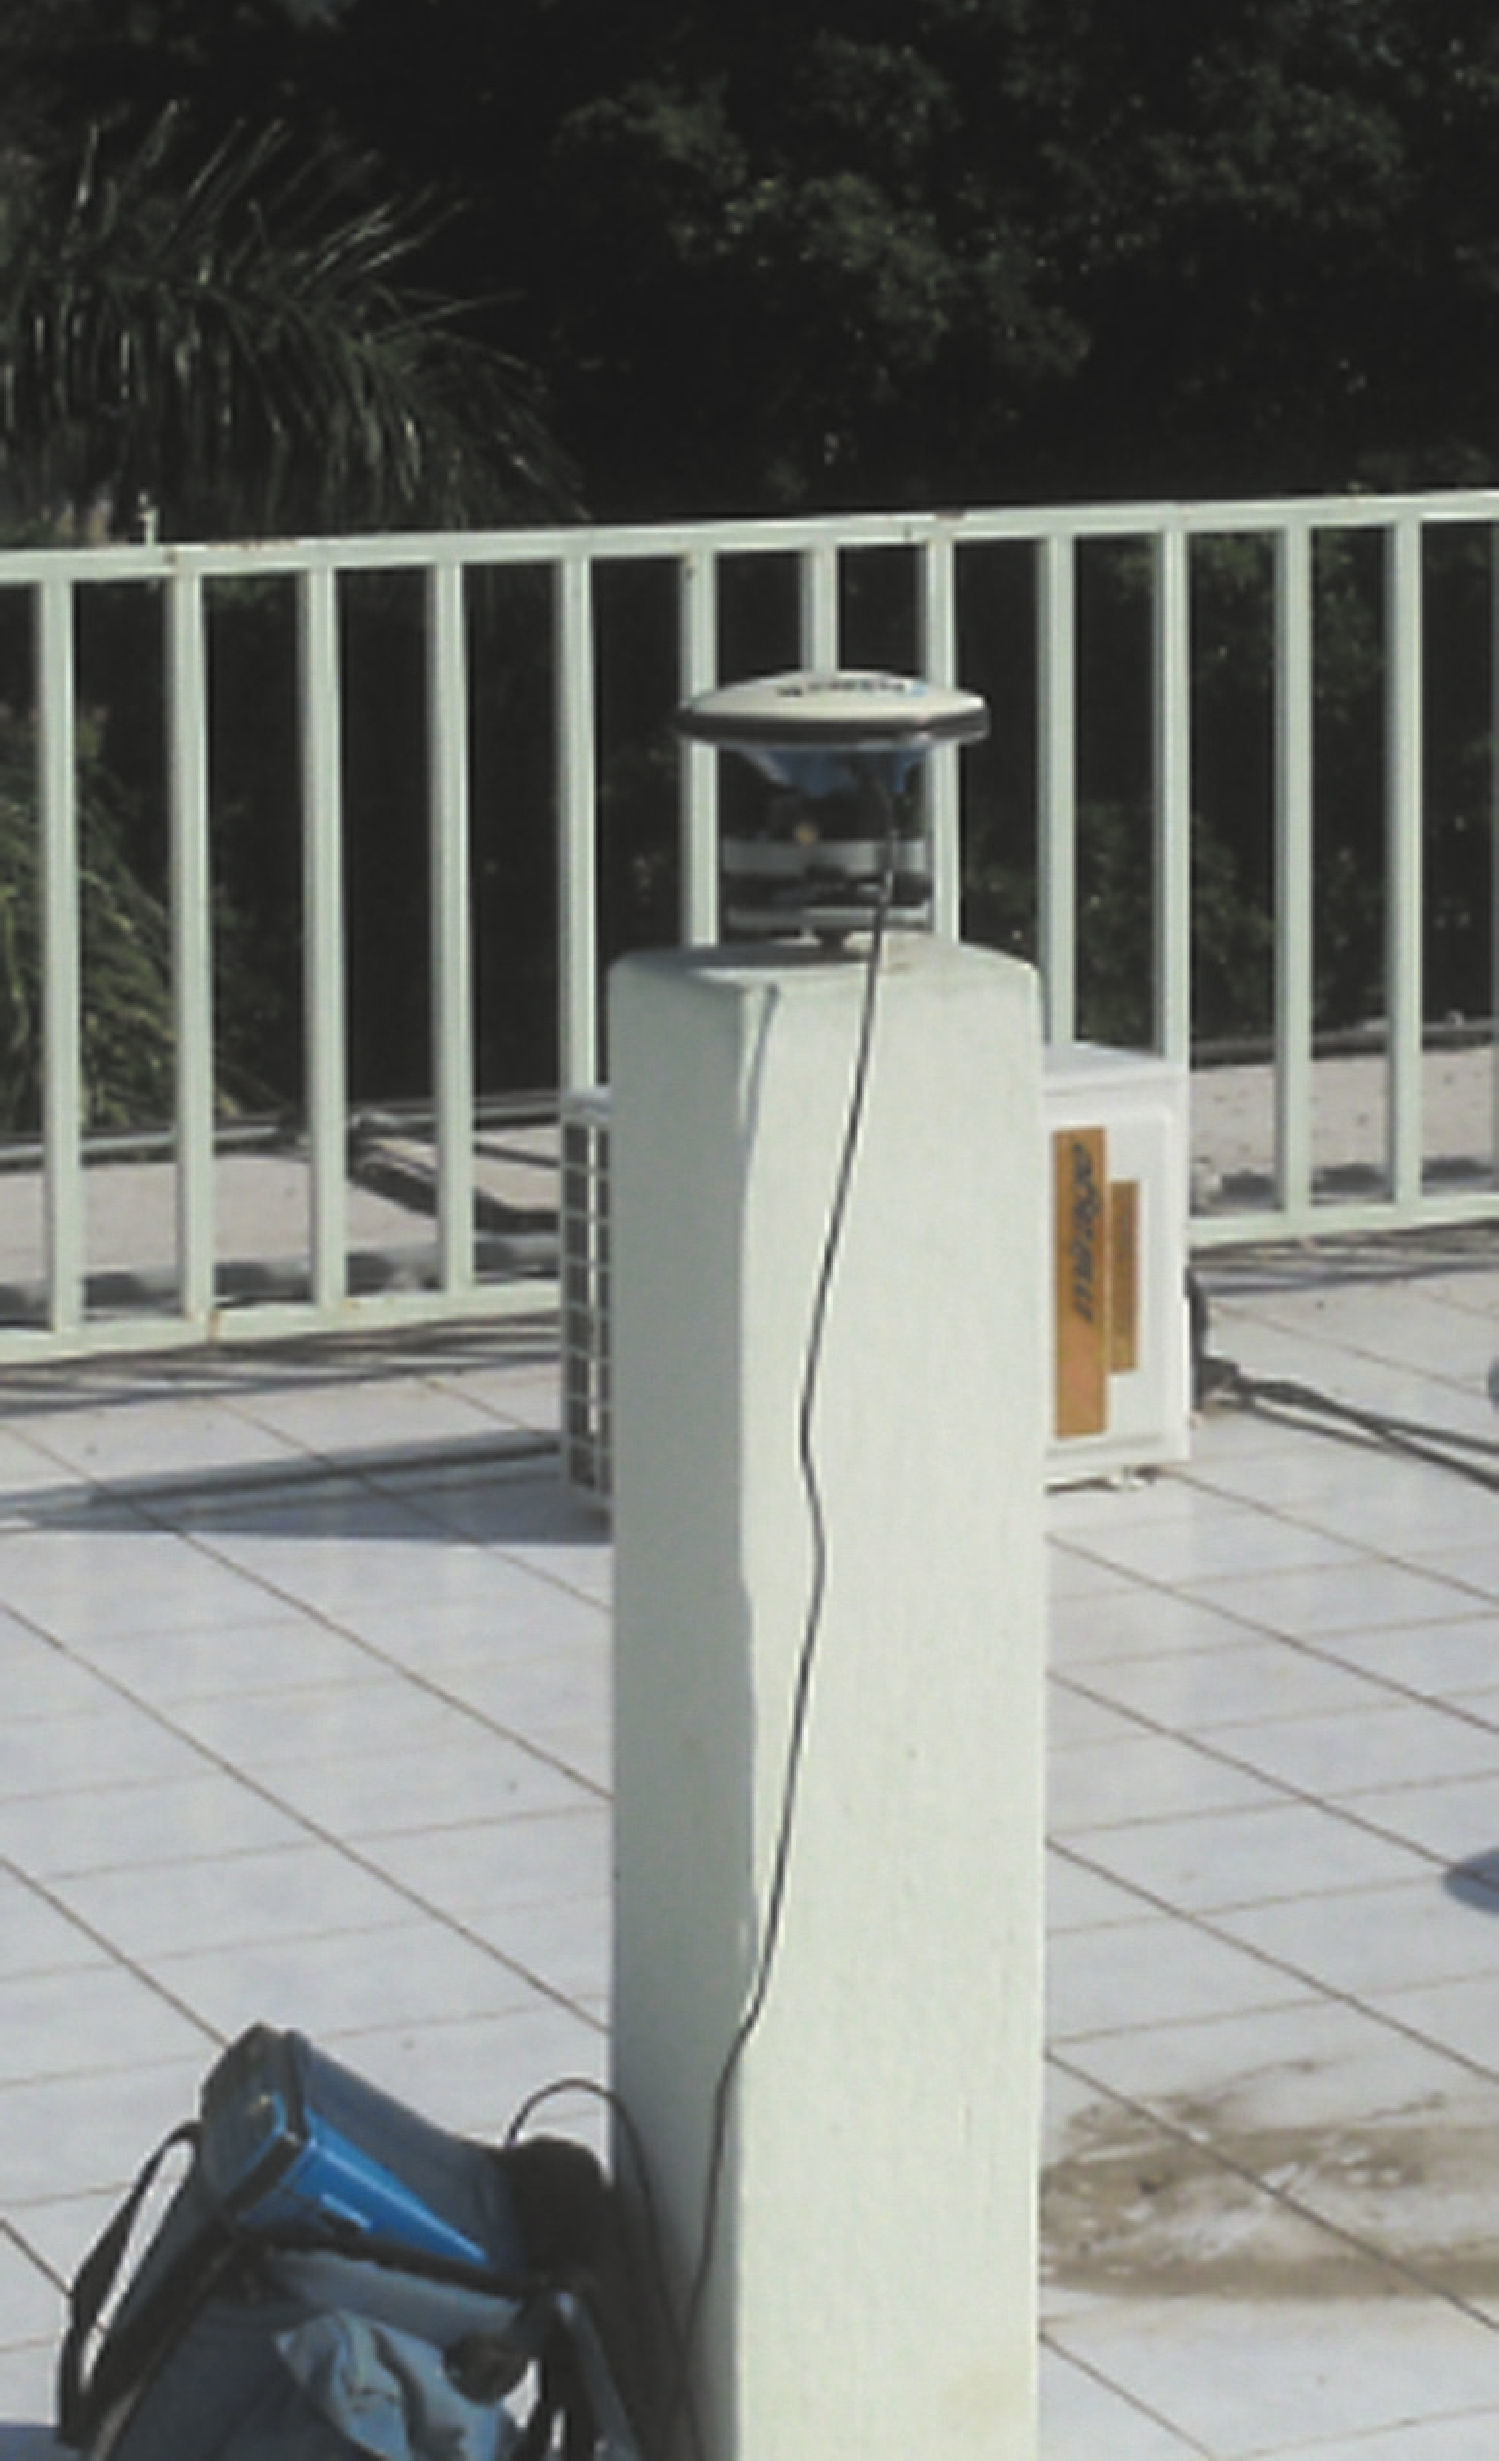
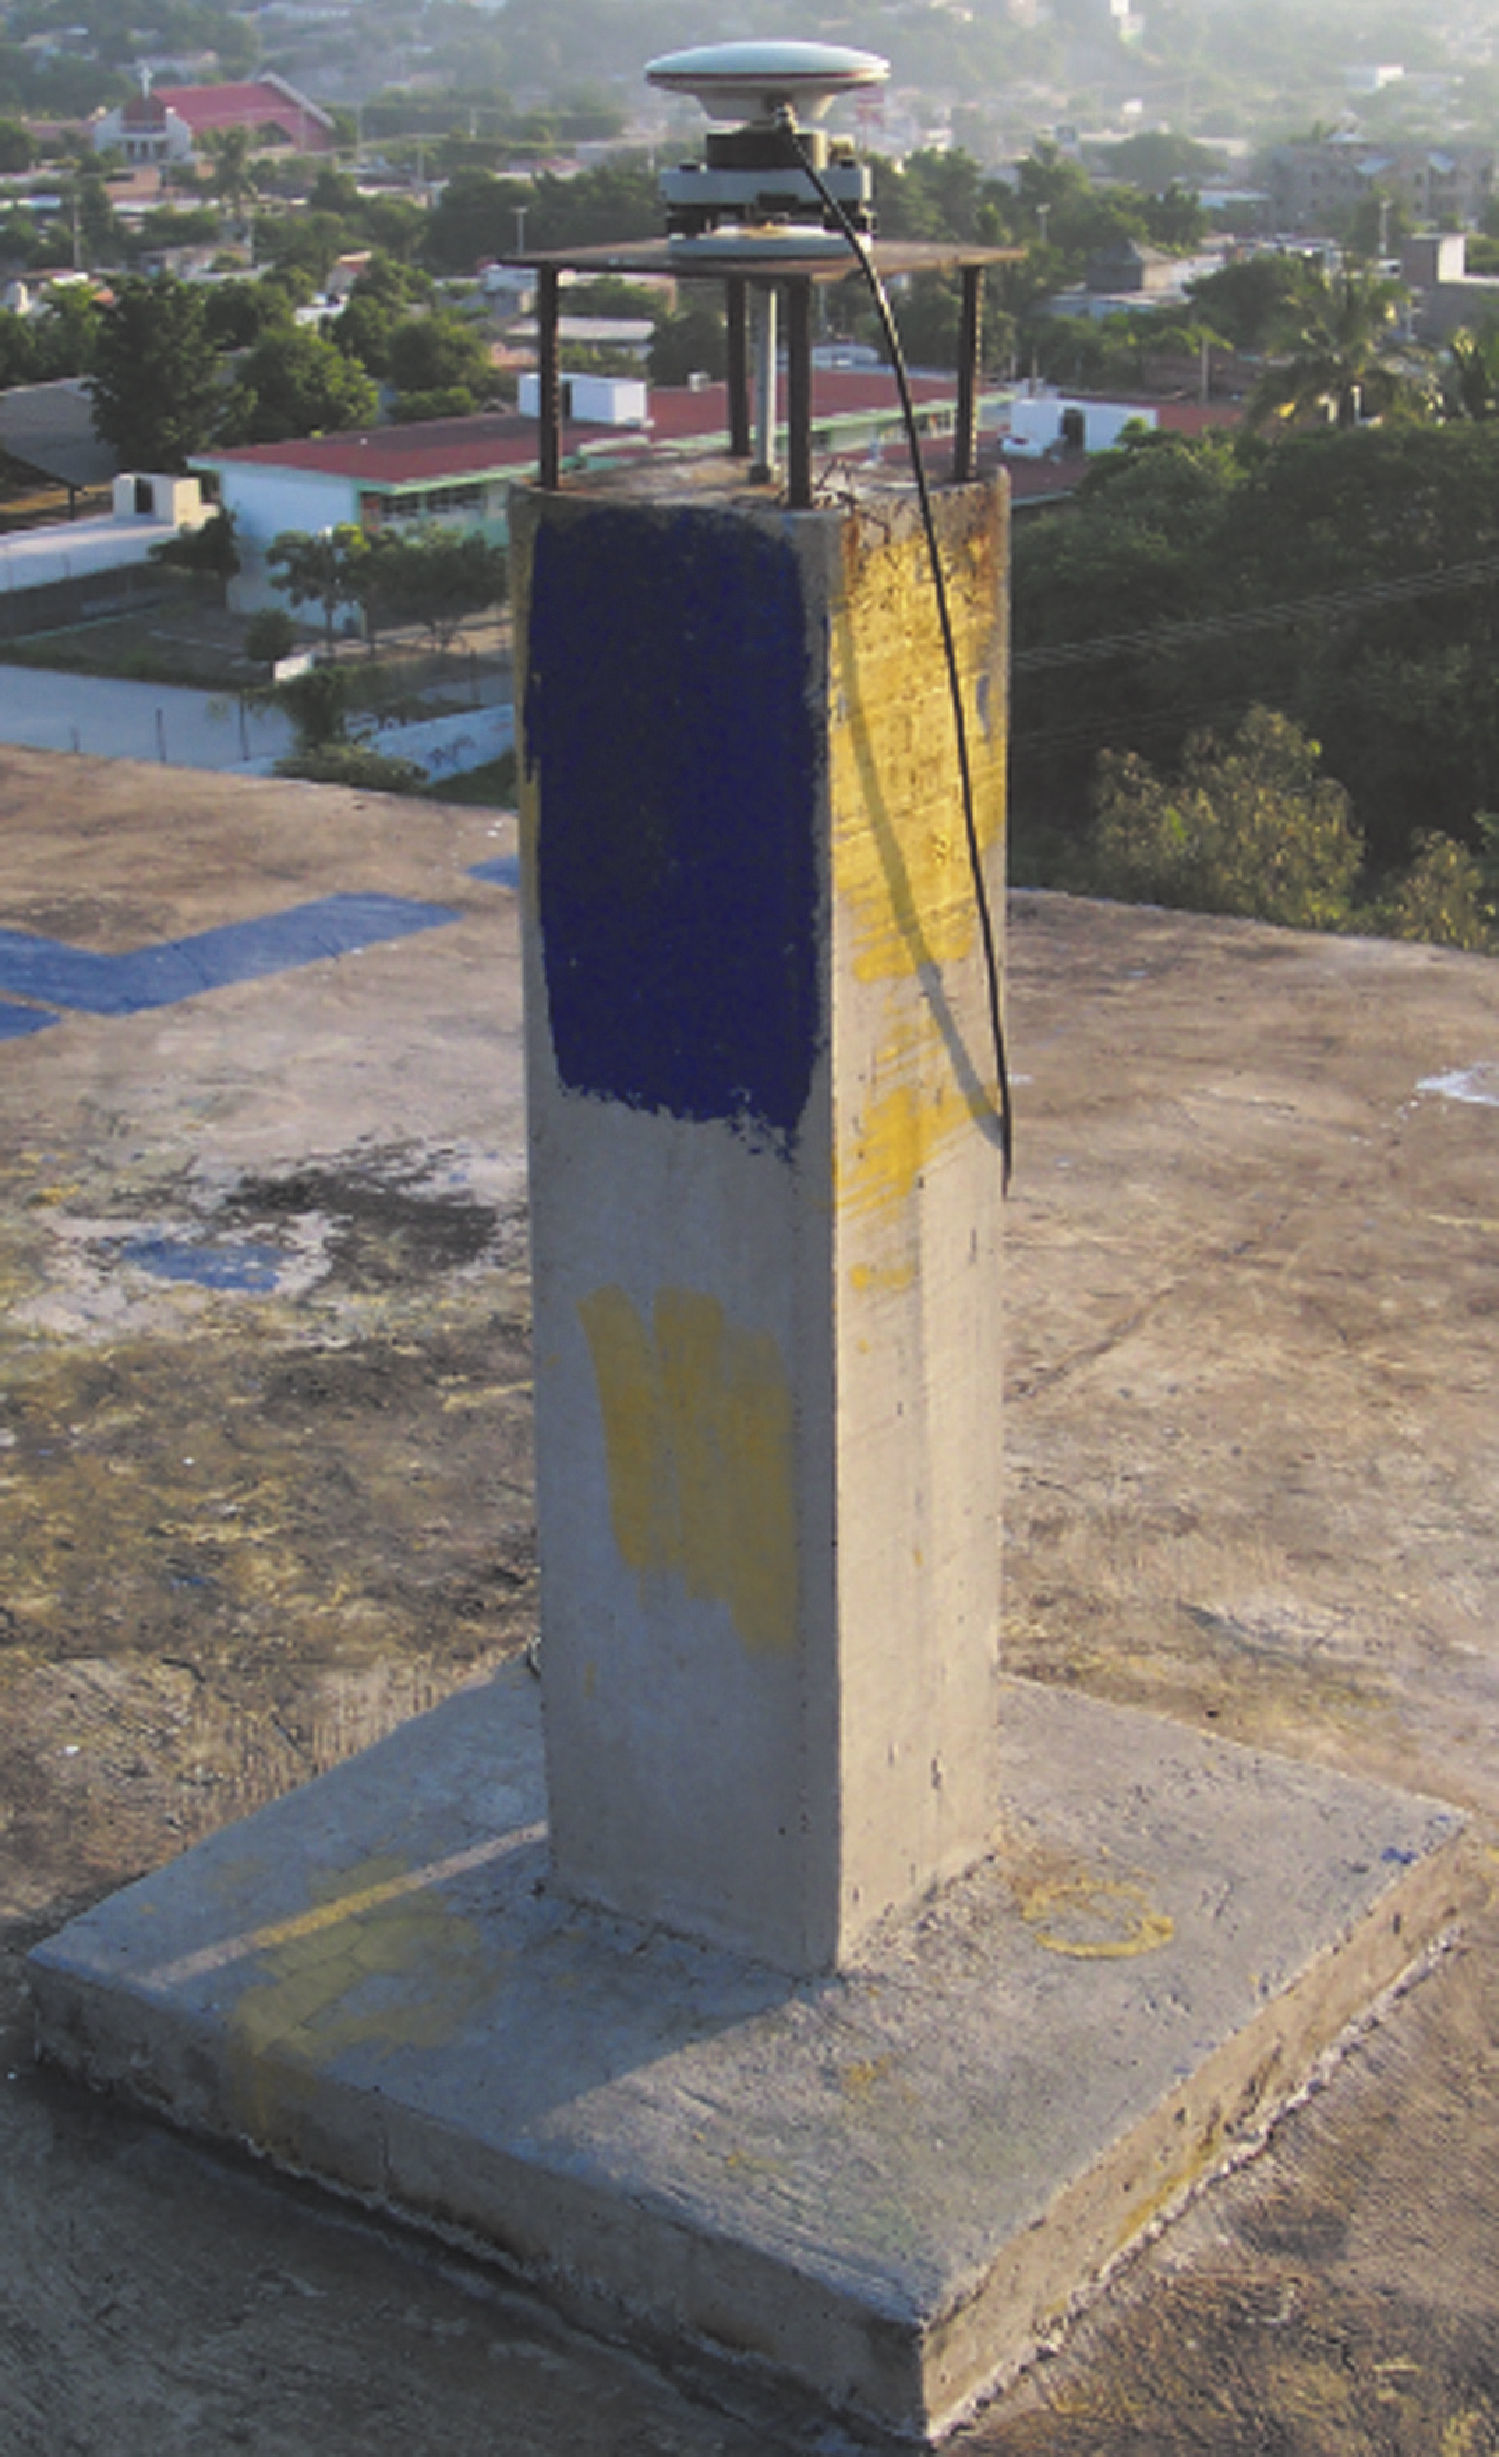
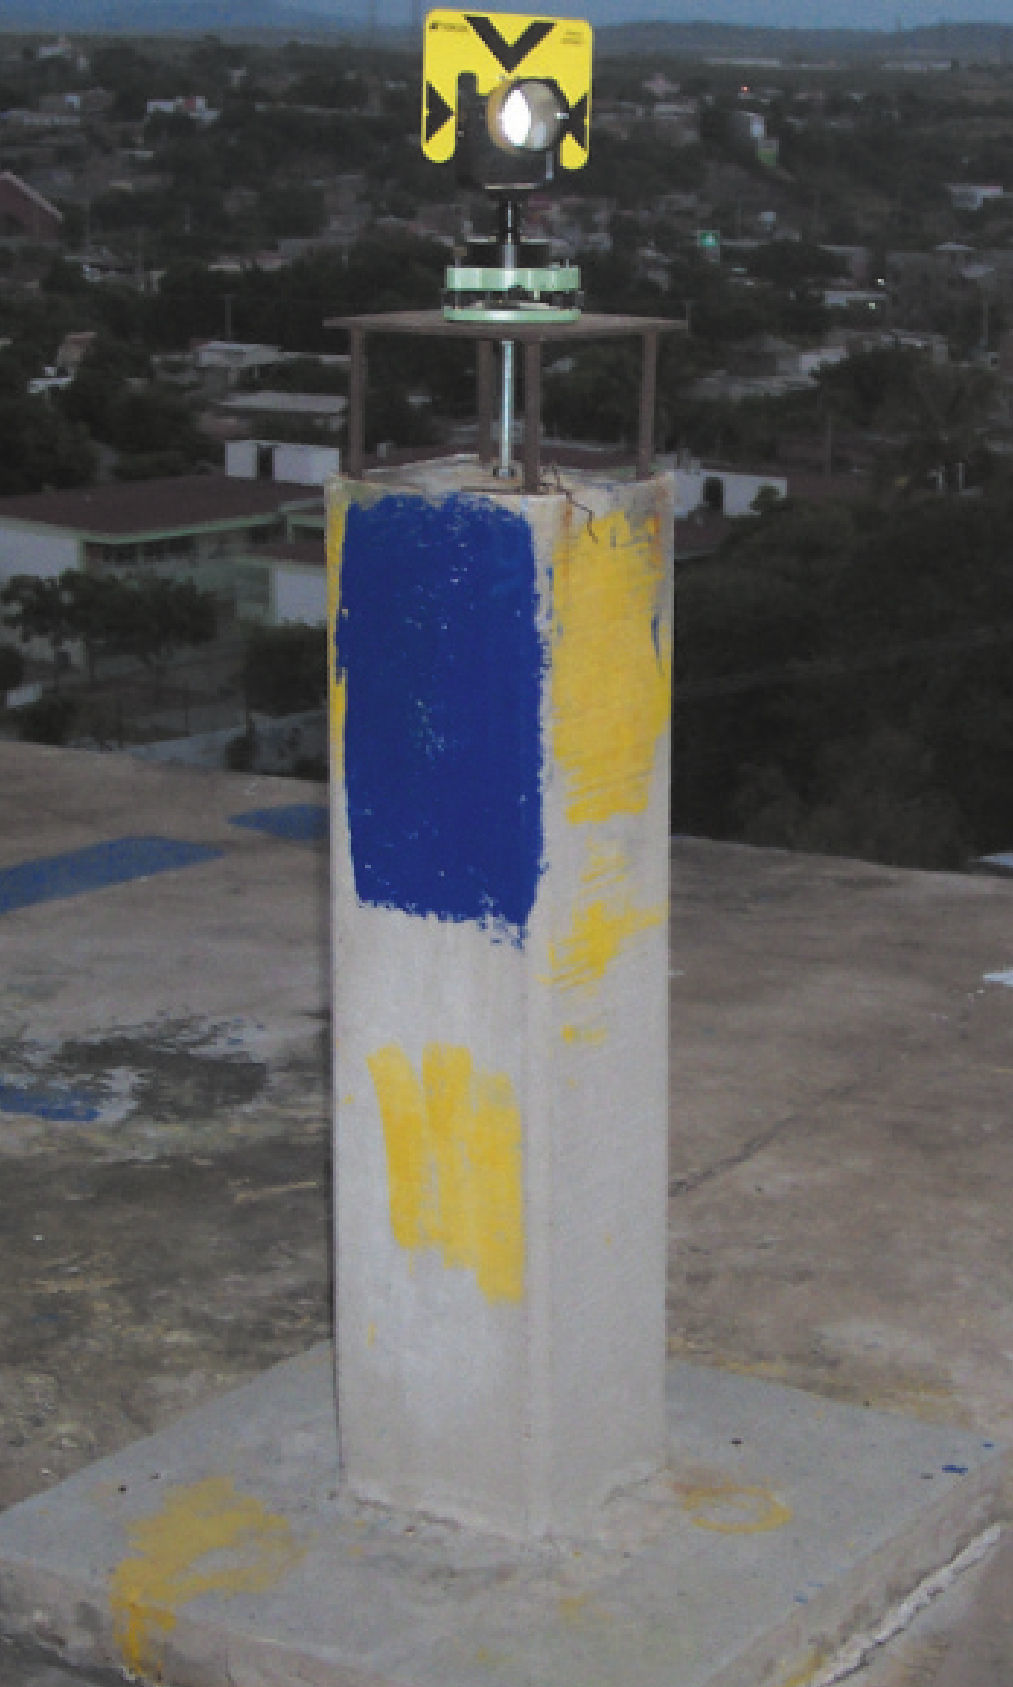
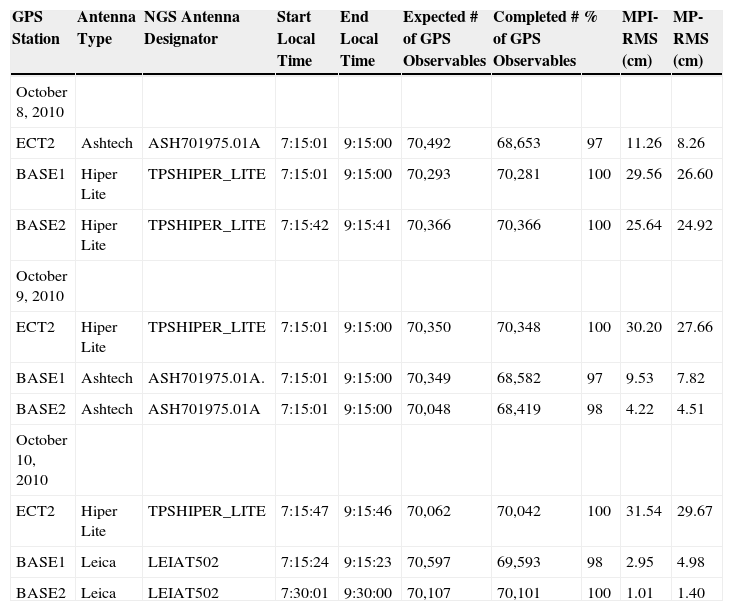
Calibration baseline experimentThe short calibration baseline presented in this study was conducted during three consecutive days: October 8, 9 and 10, 2010. Since the access to some of the equipment and components was limited, our baseline study focused on performing all test under similar atmospheric conditions; therefore, we tested GPS receivers and EDM at the same time periods over three consecutive days. The selected test area for the GPS and EDM measurements is located at UAS campus on top of the Faculty of Earth and Space Sciences (FACITE) and a facility building next to the Dentistry building (see Figure 1), where the surrounding environment represents rather optimal observability conditions with open sky and no obstructions. The monumentation for the short baseline experiment, located at UAS campus, consists of two concrete structural columns denoted as BASE1 and BASE2 (see Figures 2 and 3), that were designed to be part of the structural elements of the main frame of each building. BASE1 pillar is located on top of an educational building erected in a very rigid and reinforced foundation; as well as the BASE2 pillar, which is also part of a main educational facility building. In both cases, the main structure and the foundation of those buildings were designed and constructed following the current construction code in Mexico (RCDF-04, 2004); thus, such structural system provides the stability required to develop the analysis here described. In addition, each pillar also consist of very stable geodetic steel pins (stainless steel, 5/8-inch diameter) sunk directly into concrete pillars, with metal force-centered level mounts to guarantee accurate re-centering of the GPS antenna at each site each session (Zhang et al., 1997). The divot on top of the base pillar is then considered as the reference point for the measurement results, where a tribrach at each pillar was used to maintain the GPS antenna leveled and to keep the same antenna height (0.150 m) for each survey session. First, the coordinates of BASE1 and BASE2 monuments were previously determined with a 2-hour GPS survey session with respect to the fixed base station (ECT2) and subsequently used as known and fixed for computing the calibration baseline length. In other words, we collected GPS data at 1-sec interval for 2-hours data span for 3-consecutive days, resulting in approximately 21,600 measurements for each GPS observable (e.g. L1, L2, C/A, P1 and P2) that were used to precisely define the coordinates of BASE1 and BASE2 pillars. The GPS survey tests performed to determine the coordinates of BASE1 and BASE2, which define the calibration baseline, are illustrated in Table 1. Here, the antenna type, NGS antenna designator and time duration (local time) of each measurement session are also presented including the percentage of GPS observables completed for the entire experiment. The last two columns of Table 1 show the values for the pseudorange multipath (MP1-RMS and MP2-RMS) that can be considered as a potential contributor that might have an impact on GPS positioning results (Vazquez and Grejner-Brzezinska, 2012). The multipath effects presented in Table 1 at BASE1 and BASE2 range up to ∼30cm for the first day of the survey, when Hiper Lite antenna was used, compared to the second and third days that show roughly ∼10cm, when the Ashtech (ASH701975.01A) and Leica (LEIAT502) antennas were respectively used. In general, the experienced amount of pseudorange multipath seems to be reasonable and no reason to think in any negative influence in the positioning results.

 antenna, collecting data on October 9, 2010.")
 antenna, collecting data on October 10, 2010.")
GPS survey tests.
| GPS Station | Antenna Type | NGS Antenna Designator | Start Local Time | End Local Time | Expected # of GPS Observables | Completed # of GPS Observables | % | MPI-RMS (cm) | MP-RMS (cm) |
|---|---|---|---|---|---|---|---|---|---|
| October 8, 2010 | |||||||||
| ECT2 | Ashtech | ASH701975.01A | 7:15:01 | 9:15:00 | 70,492 | 68,653 | 97 | 11.26 | 8.26 |
| BASE1 | Hiper Lite | TPSHIPER_LITE | 7:15:01 | 9:15:00 | 70,293 | 70,281 | 100 | 29.56 | 26.60 |
| BASE2 | Hiper Lite | TPSHIPER_LITE | 7:15:42 | 9:15:41 | 70,366 | 70,366 | 100 | 25.64 | 24.92 |
| October 9, 2010 | |||||||||
| ECT2 | Hiper Lite | TPSHIPER_LITE | 7:15:01 | 9:15:00 | 70,350 | 70,348 | 100 | 30.20 | 27.66 |
| BASE1 | Ashtech | ASH701975.01A. | 7:15:01 | 9:15:00 | 70,349 | 68,582 | 97 | 9.53 | 7.82 |
| BASE2 | Ashtech | ASH701975.01A | 7:15:01 | 9:15:00 | 70,048 | 68,419 | 98 | 4.22 | 4.51 |
| October 10, 2010 | |||||||||
| ECT2 | Hiper Lite | TPSHIPER_LITE | 7:15:47 | 9:15:46 | 70,062 | 70,042 | 100 | 31.54 | 29.67 |
| BASE1 | Leica | LEIAT502 | 7:15:24 | 9:15:23 | 70,597 | 69,593 | 98 | 2.95 | 4.98 |
| BASE2 | Leica | LEIAT502 | 7:30:01 | 9:30:00 | 70,107 | 70,101 | 100 | 1.01 | 1.40 |
The GPS data were converted to the RINEX (Receiver INdependent EXchange) format (Gurtner, 1994). The TEQC software (Test of Quality Check), provided by UNAVCO (University NAVstar Consortium), was used to verify the quality and integrity of the RINEX files (i.e., expected number of GPS observables and percentage completed, receiver multipath, and receiver clock drift). After the verification, the GPS data were processed with the PAGES software, (Mader et al., 1995; Eckl et al., 2001; Schenewerk et al., 2001). This GPS processing package was developed at the NGS and it has been shown by Grejner-Brzezisnka et al. (2006) to be suitable when comparing antenna calibration for baselines under 200 m. In order to provide an optimal solution, the PAGES software was configured to use the iono-free DD carrier phase combination given by Hofmann-Wellenhof et al. (2001):
with
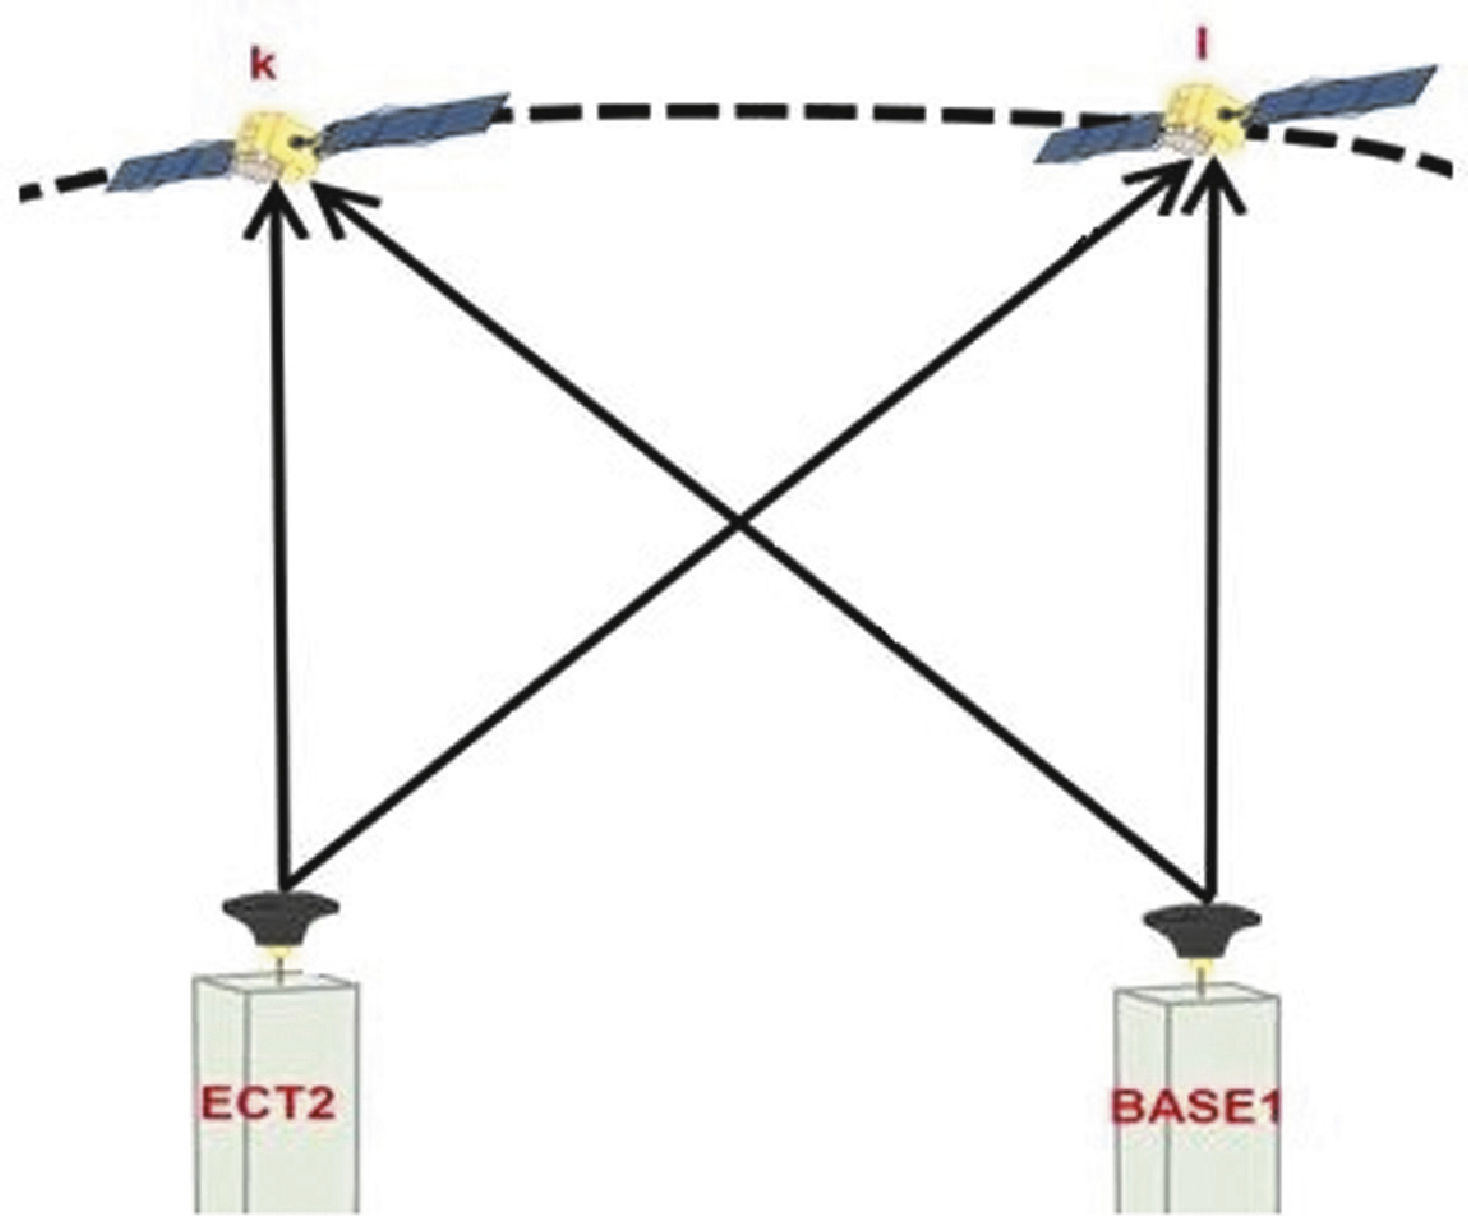
where: i and j are subscripts that denote receivers, k and l are superscripts that denote satellites, is the DD-geometric distance between the respective satellites and receivers, indicate that the carriers L1 and L2 are involved in the combination, is the DD tropospheric refraction term, l1≈19cm and l2≈24cm are the wavelengths of the signals on the L1 and L2 carriers, respectively, N1 and N2 are the integer ambiguities associated with the phase measurements (in cycles) on L1 and L2, respectively, and are the random DD measurement noise terms (in meters) for the observed phases on L1 and L2, respectively. The main specifications for the GPS data processing included the use of a 1-sec sampling rate, 10° cut-off angle and use of precise final orbits disseminated by IGS. Also, the carrier phase ambiguity parameters were fixed at the rate of 99-100% in the three consecutive day processing and antenna calibration parameters provided by NGS were used following Mader (1999).
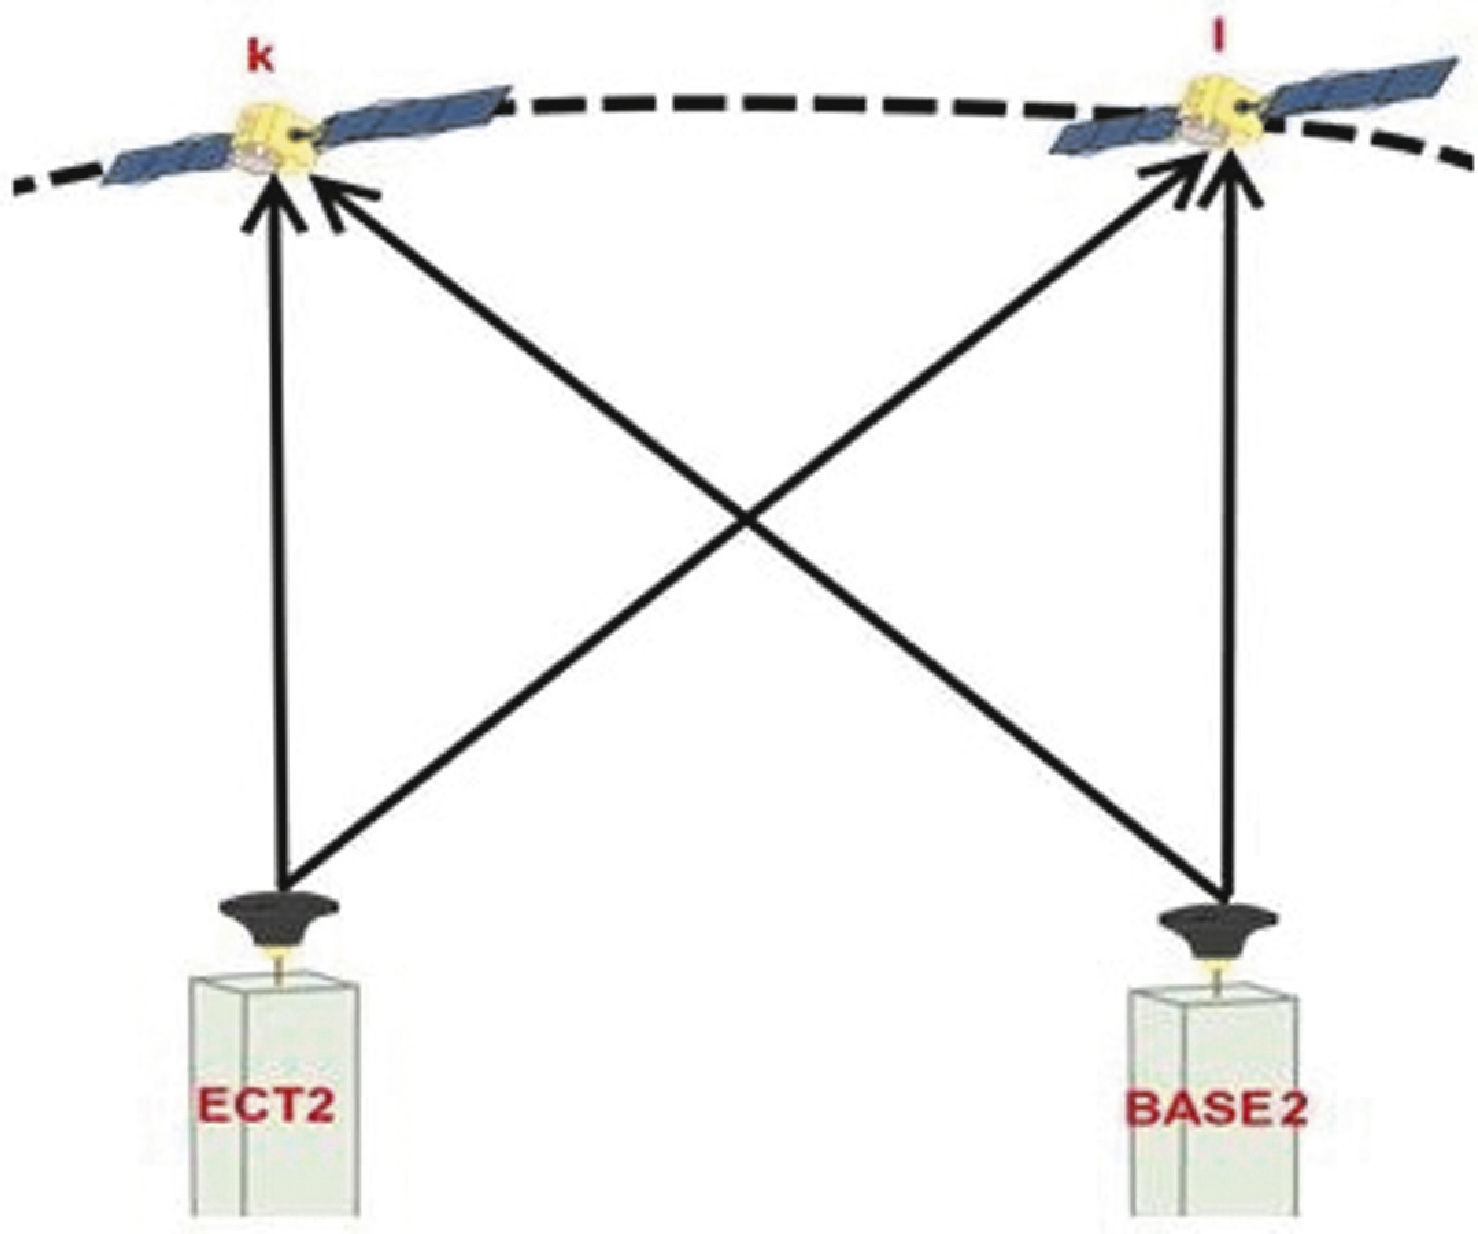
In our case, the DD configuration can be established between the well-known base station (ECT2) with fixed coordinates and the unknown stations (BASE1 and BASE2) as shown in Figures 4 and 5.
 station and unknown (BASE1) station.")
 station and unknown (BASE2) station.")
Based on Equation (1), we can rewrite this equation according to the DD configurations (ECT2-BASE1) and (ECT2-BASE2) resulting:
and
with
and
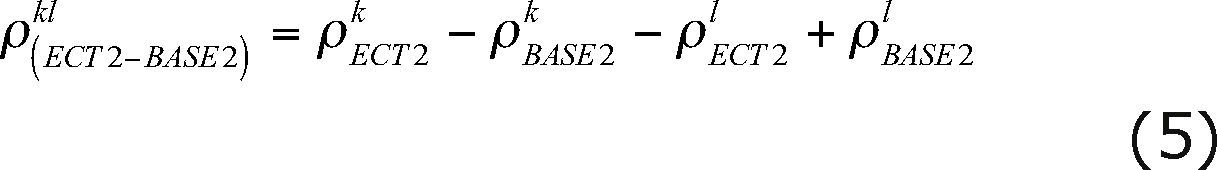
From Equations (4) and (5) we have:
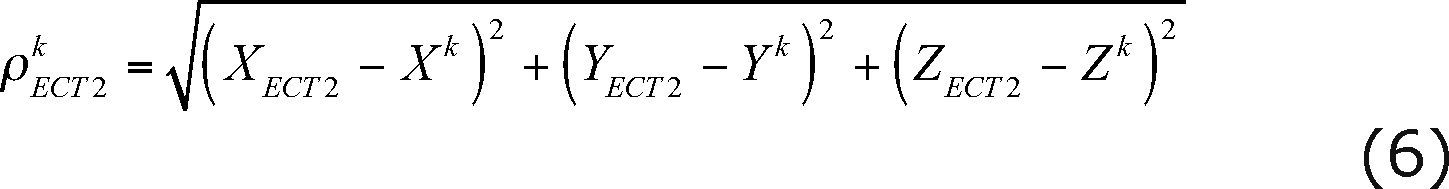
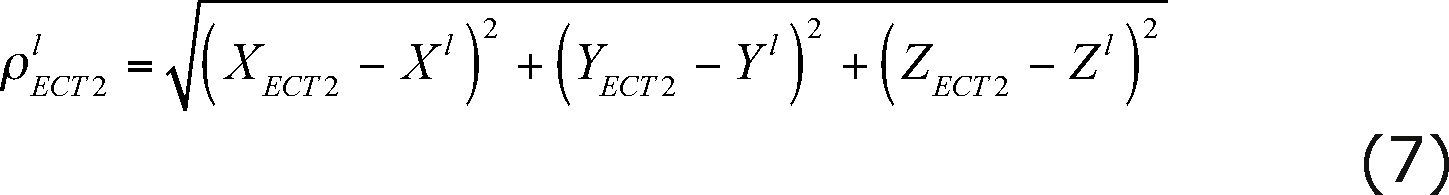
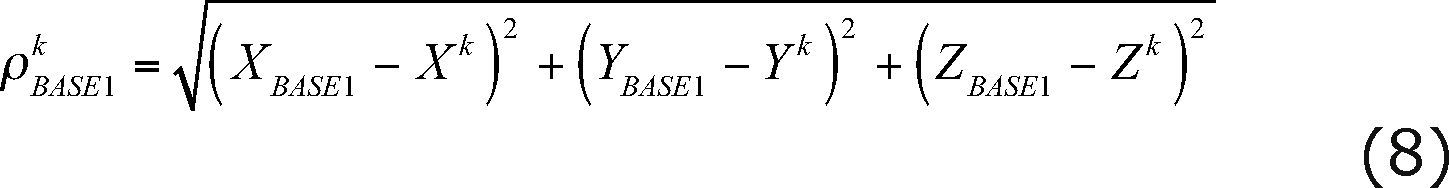
where XETC2, yETC2, ZETC2 are the coordinates of the fixed base station (ECT2); XBASE1, YBASE1, ZBASE1 are the coordinates for the first unknown station (BASE1); XBASE2, YBASE2, ZBASE2 are the coordinates of the second unknown station (BASE2); XK, YK, ZK and Xl, Yl, Zl are the coordinates of satellites k and l, respectively.
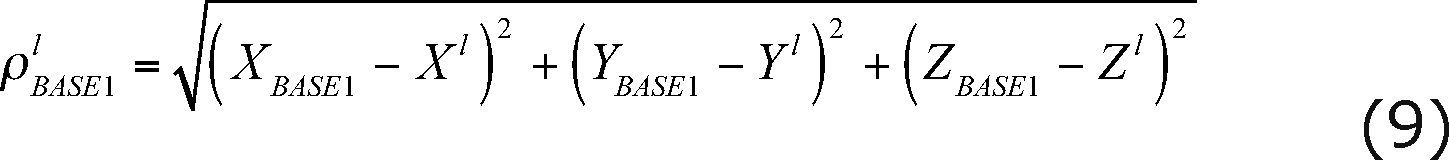
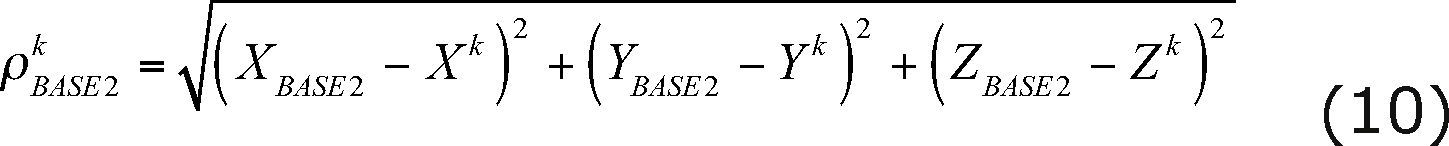
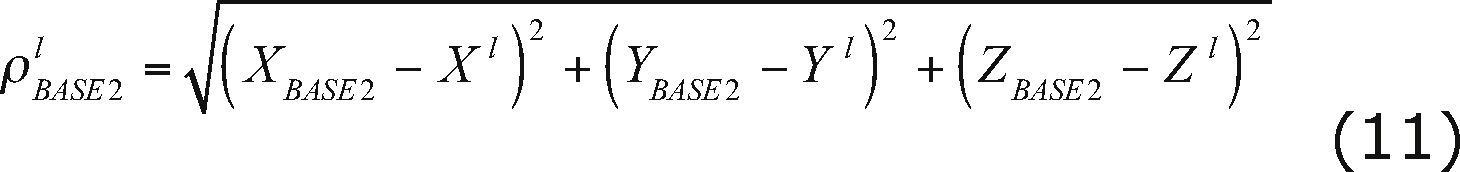
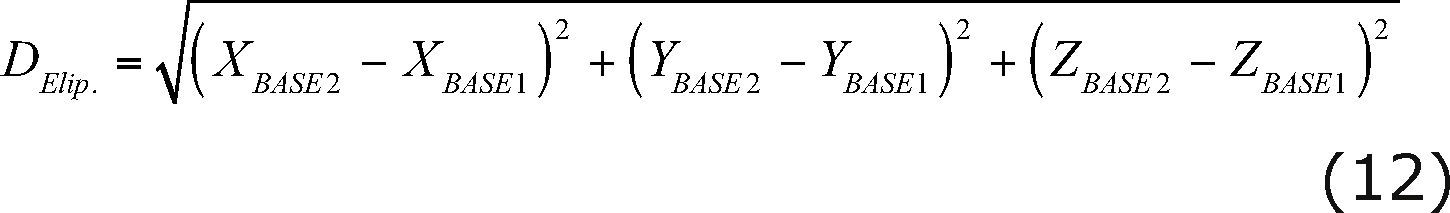
Once we solved for the coordinates of the unknown stations (BASE1 and BASE2), the ellipsoidal distance for the calibration baseline was computed, using the following equation:
Then, we compute the distance in the Universal Transversal Mercator (UTM) projection given by:

where DElip. is the ellipsoidal distance computed from GPS and k0 is the deformation scale factor in the UTM projection.
Equation (13) represents the distance for the calibration baseline in the UTM projection; which is assumed to be represented in a plane to a local scale, because the EDM mea-surements were directly made on the ground. The deformation on DUTM caused by the projection is taking into account by the scale factor k0 that will correct for the GPS ellipsoidal distance when getting away from the central meridian (105˚ W) of the UTM projection. Once achieved this, a comparison between GPS and EDM was stated under such assumption.
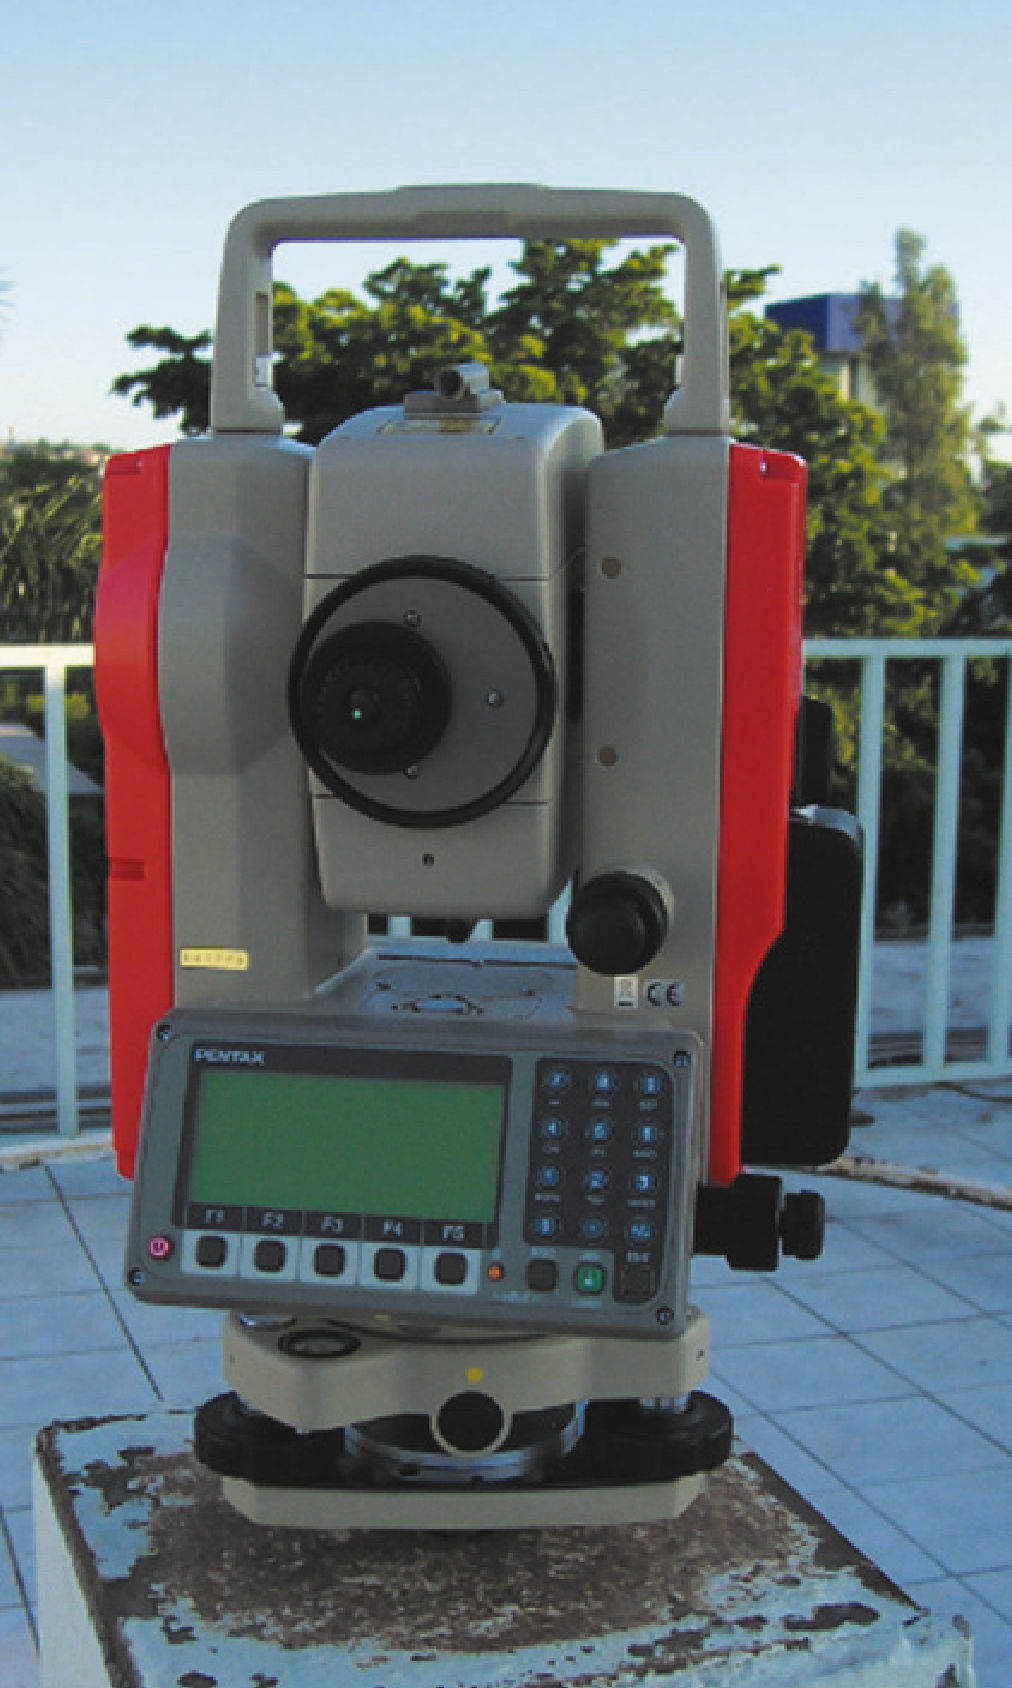
EDM measurementsThe calibration-baseline derived from EDM was estimated from the average of the set of 20 length measurements performed with three different types of EDM (Topcon GTS-236W, Pentax R-326EX and Leica TC-407) between the BASE1 and BASE2 monuments. These measurements were conducted over the course of three consecutive days in order to help mitigating atmospheric errors. The PENTAX R-326EX is presented in Figure 6 as an example of how the EDM measurements were carried out with this instrument. Figure 7 illustrates the type of prism used; here a Topcon prism with 0/-30mm offset is presented as an example. In order to avoid errors from centering the instruments and prisms, we used force-centered level mounts to guarantee accurate re-centering. The prisms on the two pillars were mounted on tribrachs to guarantee the same line (horizontally). We also used prisms that are compatible with each type of EDM, because this allows for accurate determination of the constant error bias associated with each reflector, which represents a common error presented in this type of measurements. In addition, it is assumed in the present experiment that manufacturers were responsible and they properly applied the necessary corrections and reductions for atmospheric conditions (usually performed internally), as well as Earth's curvature and slope were taken into account.
, performed on October 8, 9 and 10, 2010.")

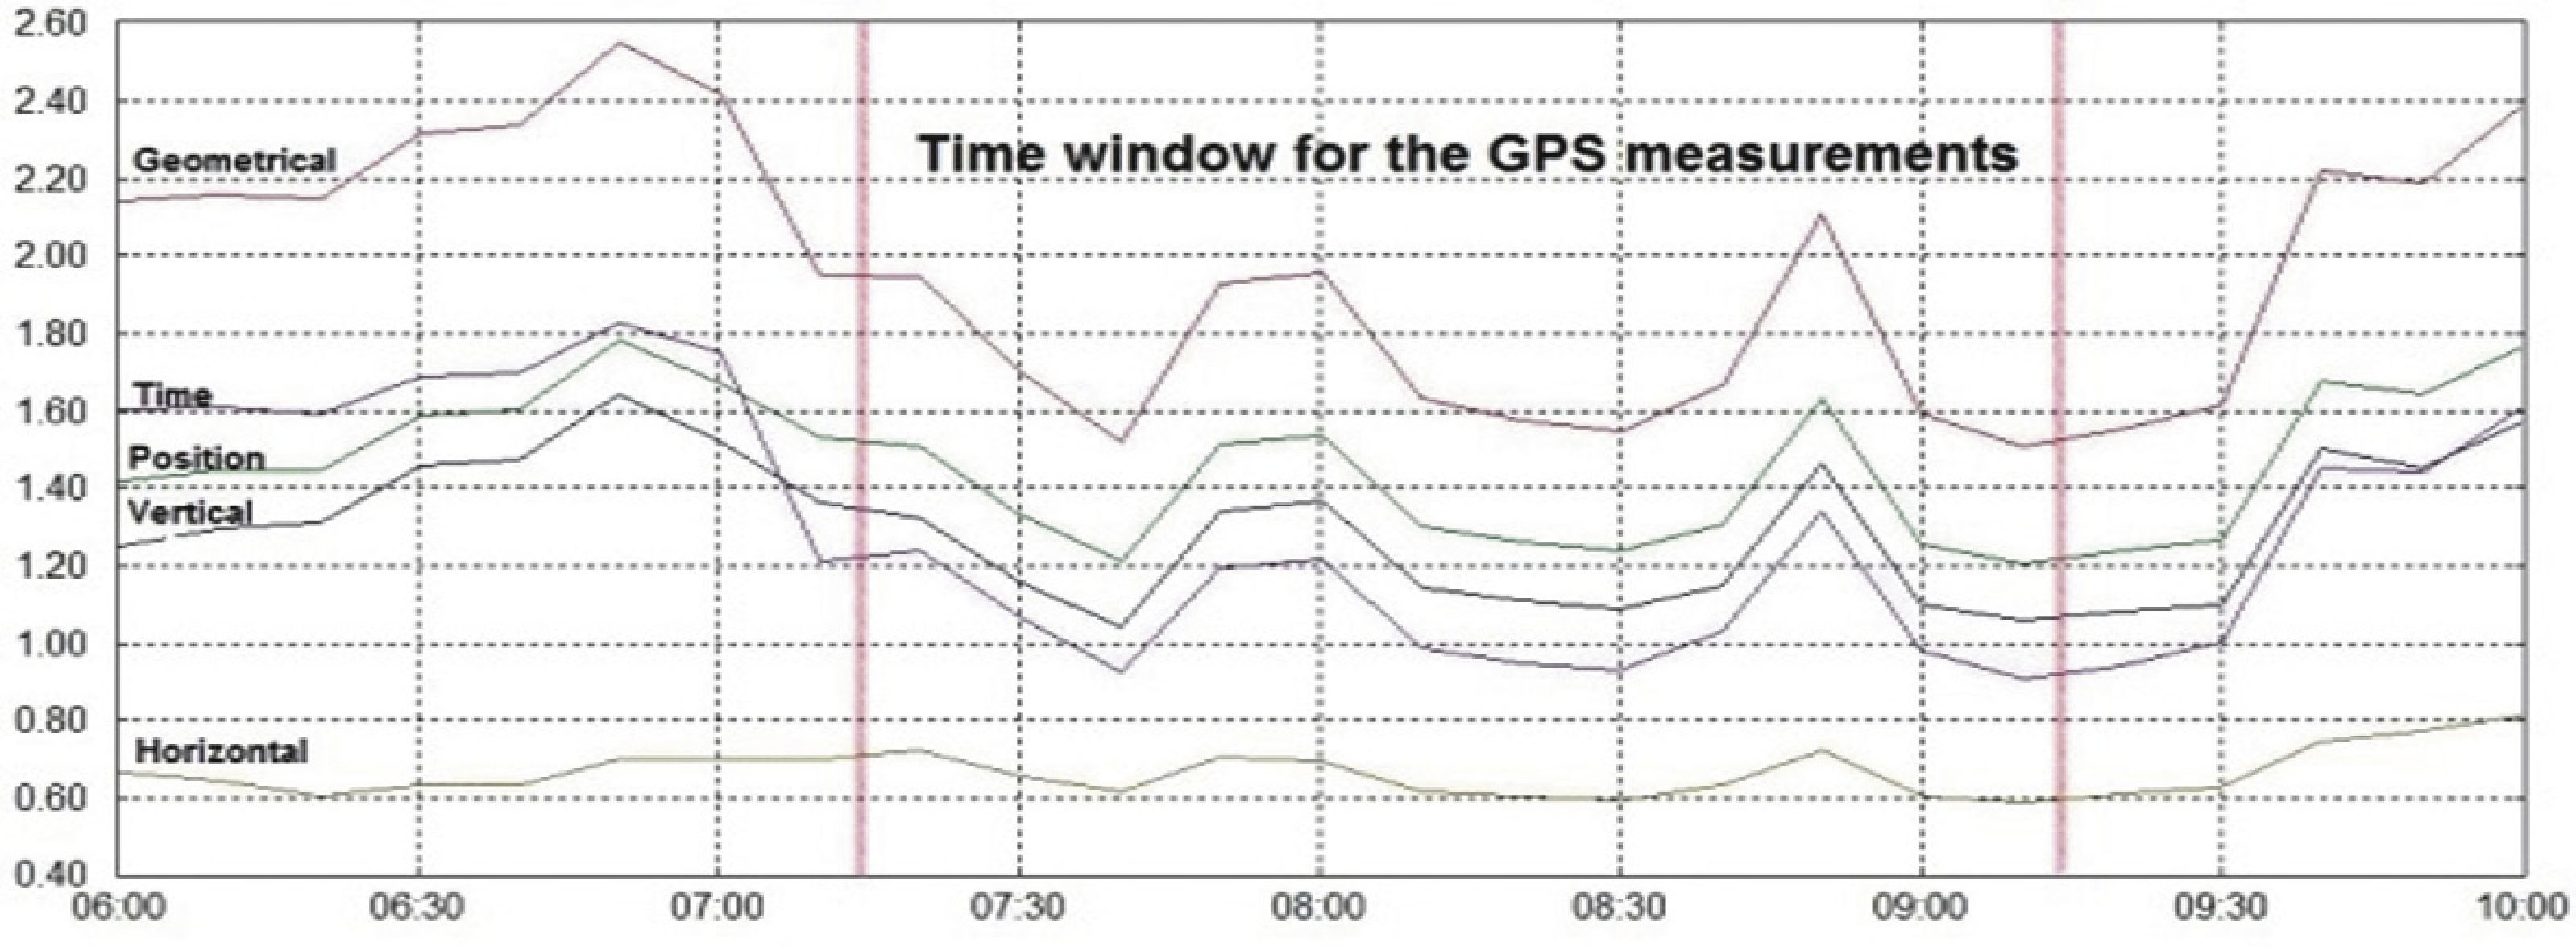
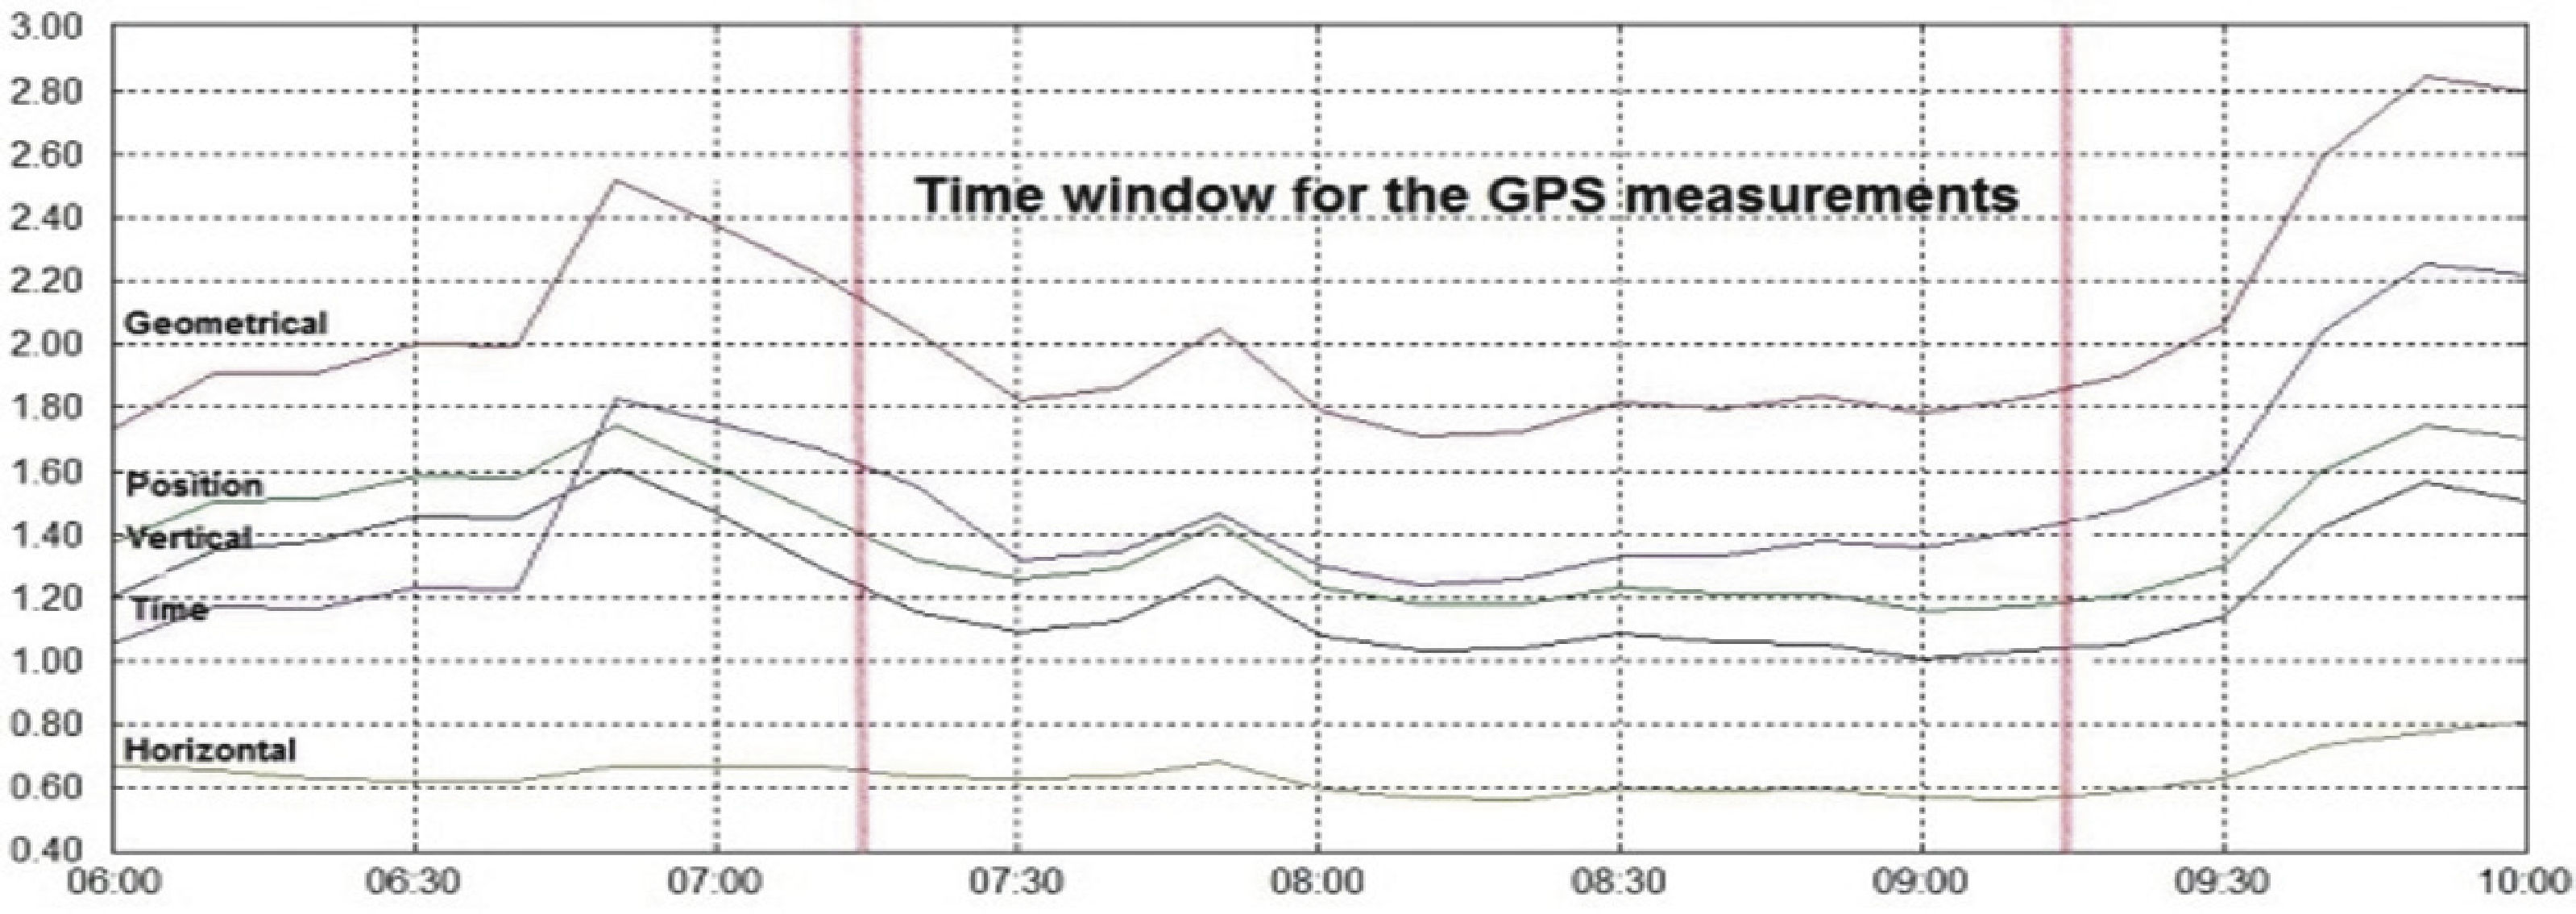
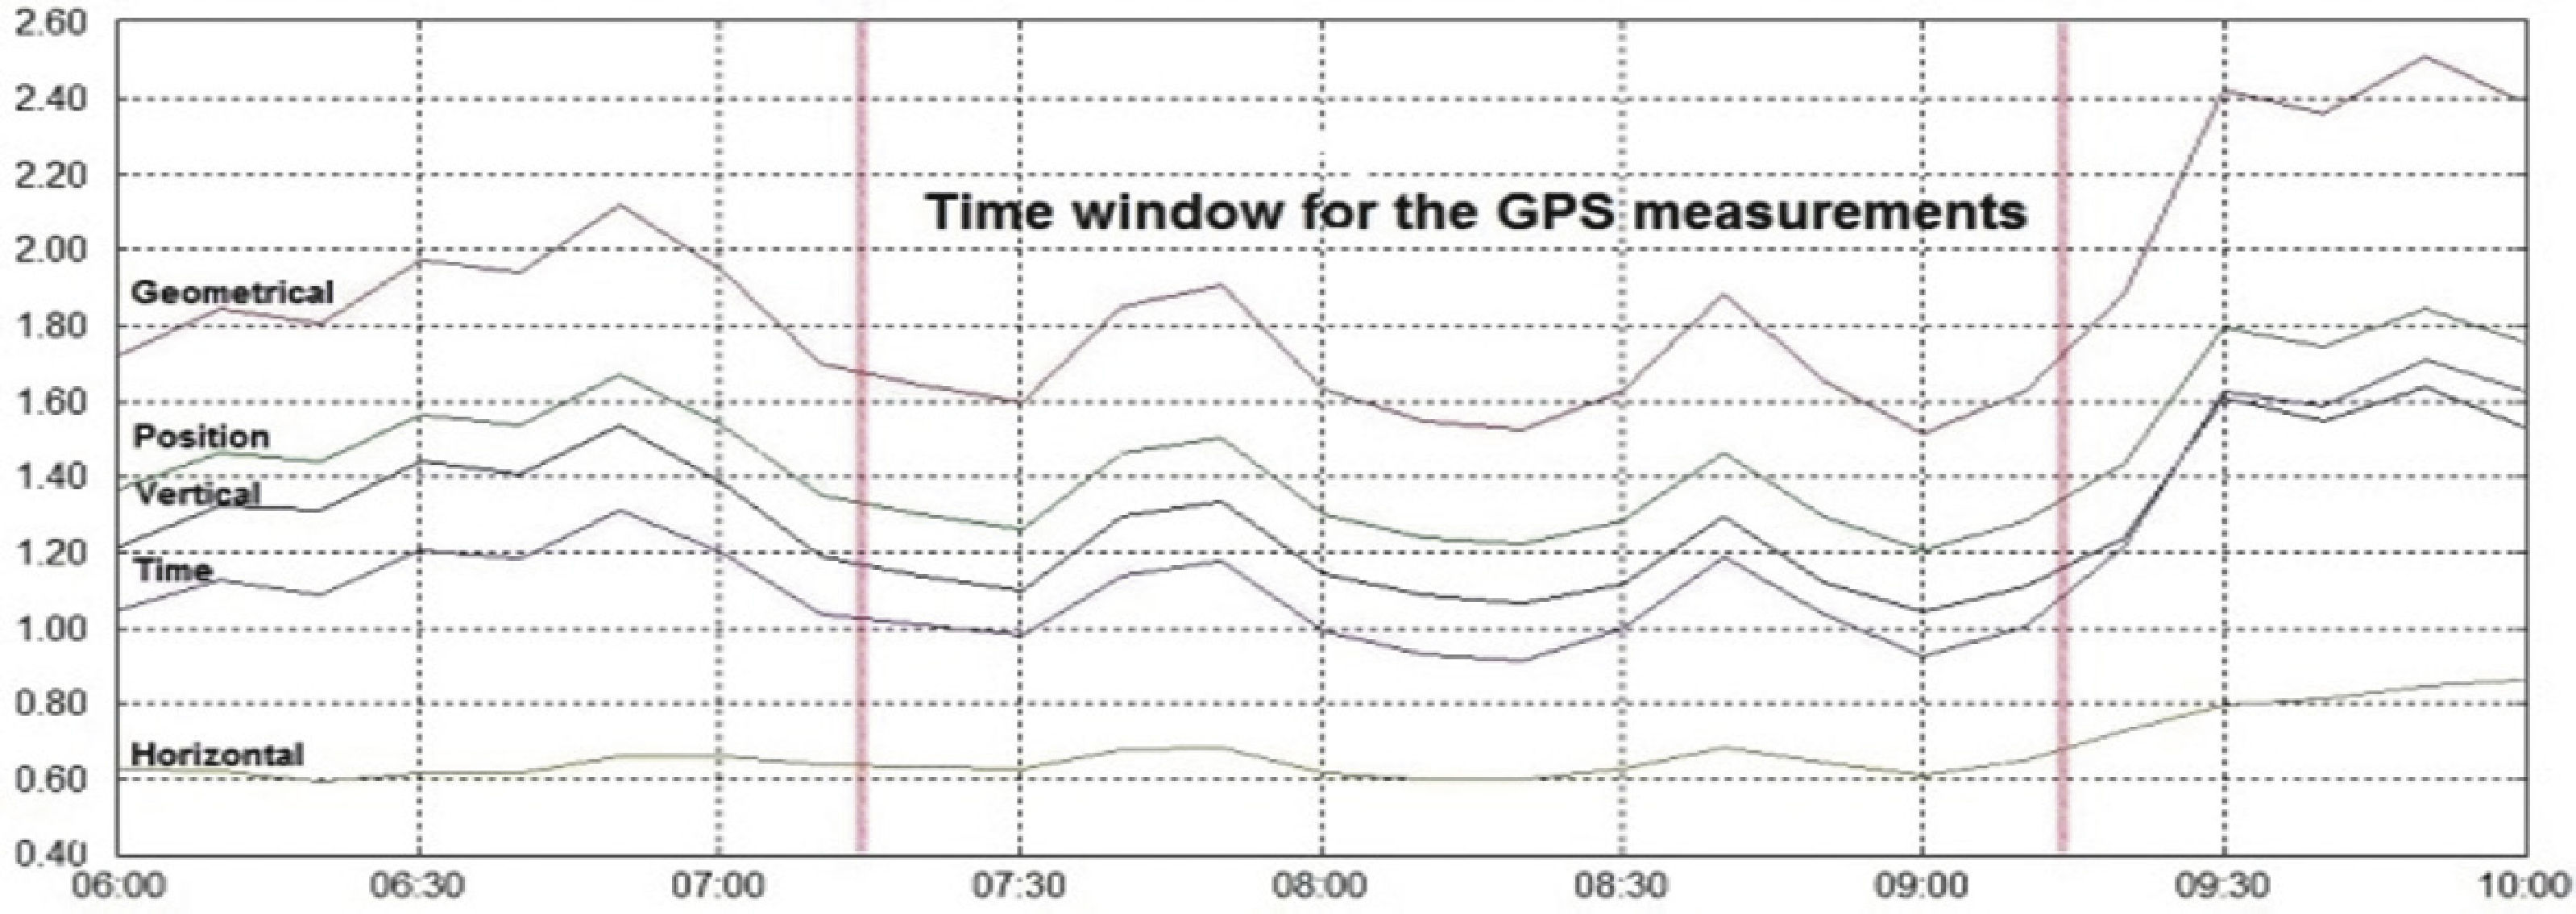
It is well-known that the accuracy of GPS positioning mostly relies on the geometric configuration of the observed satellites for a specific location where the GPS measurements are performed. DOP (dilution of precision) arises from this fact, since it is considered as geometric factor that amplifies the single range observation error that shows the positioning accuracy obtained from multiple GPS observations. DOP is very important for differential GPS, as both stations must use the same satellites. With the current full GPS constellation, the common observability should not be a problematic issue; due to the existing satellite availability. Based on these considerations, we decided to account for the DOP values: position (PDOP), horizontal (HDOP), vertical (VDOP), geometrical (GDOP) and time (TDOP), for the time-window of the three day GPS measurements of the experiment (October 8, 9 and 10, 2010). As a result of accounting for this accuracy factor, Figures 8, 9 and 10 show the computed DOP values, which were found to be less than 2 for the time when the GPS measurements were performed (7:15 a.m. to 9:15 a.m.). However, it was found that the PDOP, which contributes more to determine the coordinates of BASE1 and BASE2, is less than 1.6, for the three days of the experiment. Therefore, with the obtained small PDOP values, it is feasible to expect millimeter accuracy on the positioning results, as it was obtained in all presented solutions.
: geometrical (GDOP), Position (PDOP), Vertical (VDOP), Horizontal (HDOP) and Time (TDOP) for GPS measurements; October 8, 2010.")
: geometrical (GDOP), Position (PDOP), Vertical (VDOP), Horizontal (HDOP) and Time (TDOP) for GPS measurements; October 9, 2010.")
: geometrical (GDOP), Position (PDOP), Vertical (VDOP), Horizontal (HDOP) and Time (TDOP) for GPS measurements; October 10, 2010.")
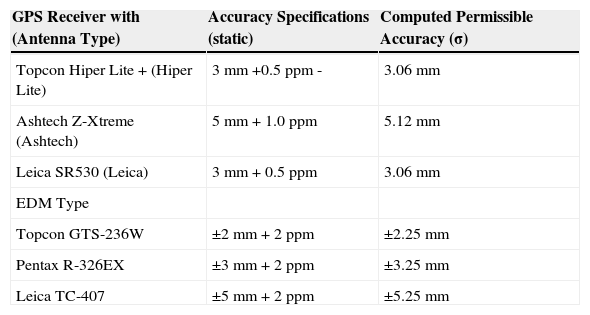
For comparison, the performance or ac-curacy specifications of the different type and commercial brand of geodetic-grade GPS receivers and EDM provided by the manufacturer are shown in Table 2, given in units of millimeters plus parts per million (mm + ppm). These specifications for GPS receivers show that based on the obtained coordinates from two GPS stations (i.e. BASE and BASE2), one can compute the length of the calibration baseline; while specifications for EDM refer to the direct measurement of the baseline between the two stations. The last column of Table 2 shows what we called the permissible accuracy (σ) for a ∼125 m calibration baseline. In other words, σ represents the reference value in terms of accuracy that can be permitted when using a GPS receiver or EDM to determine the magnitude of such calibration baseline. The resulting calibration baseline values from GPS were computed by means of Equation (12), whereas the length of the calibration baseline derived from EDM was directly obtained based on the average of a set of 20 measurements with each type of EDM, between BASE1 and BASE2. Making the corresponding assumptions regarding that the EDM worked properly and it was correctly centered and leveled as well as the prisms located at the two monuments; then the error propagation is presented in Table 3.
GPS and EDM accuracy specifications provided by the manufacturer and computed permissible accuracy (σ) for the ∼125 m calibration baseline.
| GPS Receiver with (Antenna Type) | Accuracy Specifications (static) | Computed Permissible Accuracy (σ) |
|---|---|---|
| Topcon Hiper Lite + (Hiper Lite) | 3mm +0.5ppm - | 3.06 mm |
| Ashtech Z-Xtreme (Ashtech) | 5mm + 1.0ppm | 5.12 mm |
| Leica SR530 (Leica) | 3mm + 0.5ppm | 3.06 mm |
| EDM Type | ||
| Topcon GTS-236W | ±2mm + 2ppm | ±2.25 mm |
| Pentax R-326EX | ±3mm + 2ppm | ±3.25 mm |
| Leica TC-407 | ±5mm + 2ppm | ±5.25 mm |
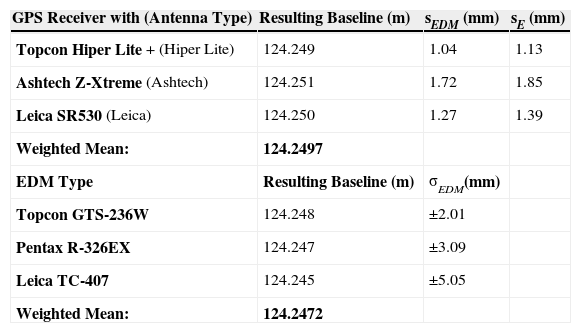
Resulting calibration baseline values from GPS and EDM.
| GPS Receiver with (Antenna Type) | Resulting Baseline (m) | sEDM (mm) | sE (mm) |
|---|---|---|---|
| Topcon Hiper Lite + (Hiper Lite) | 124.249 | 1.04 | 1.13 |
| Ashtech Z-Xtreme (Ashtech) | 124.251 | 1.72 | 1.85 |
| Leica SR530 (Leica) | 124.250 | 1.27 | 1.39 |
| Weighted Mean: | 124.2497 | ||
| EDM Type | Resulting Baseline (m) | σEDM(mm) | |
| Topcon GTS-236W | 124.248 | ±2.01 | |
| Pentax R-326EX | 124.247 | ±3.09 | |
| Leica TC-407 | 124.245 | ±5.05 | |
| Weighted Mean: | 124.2472 |
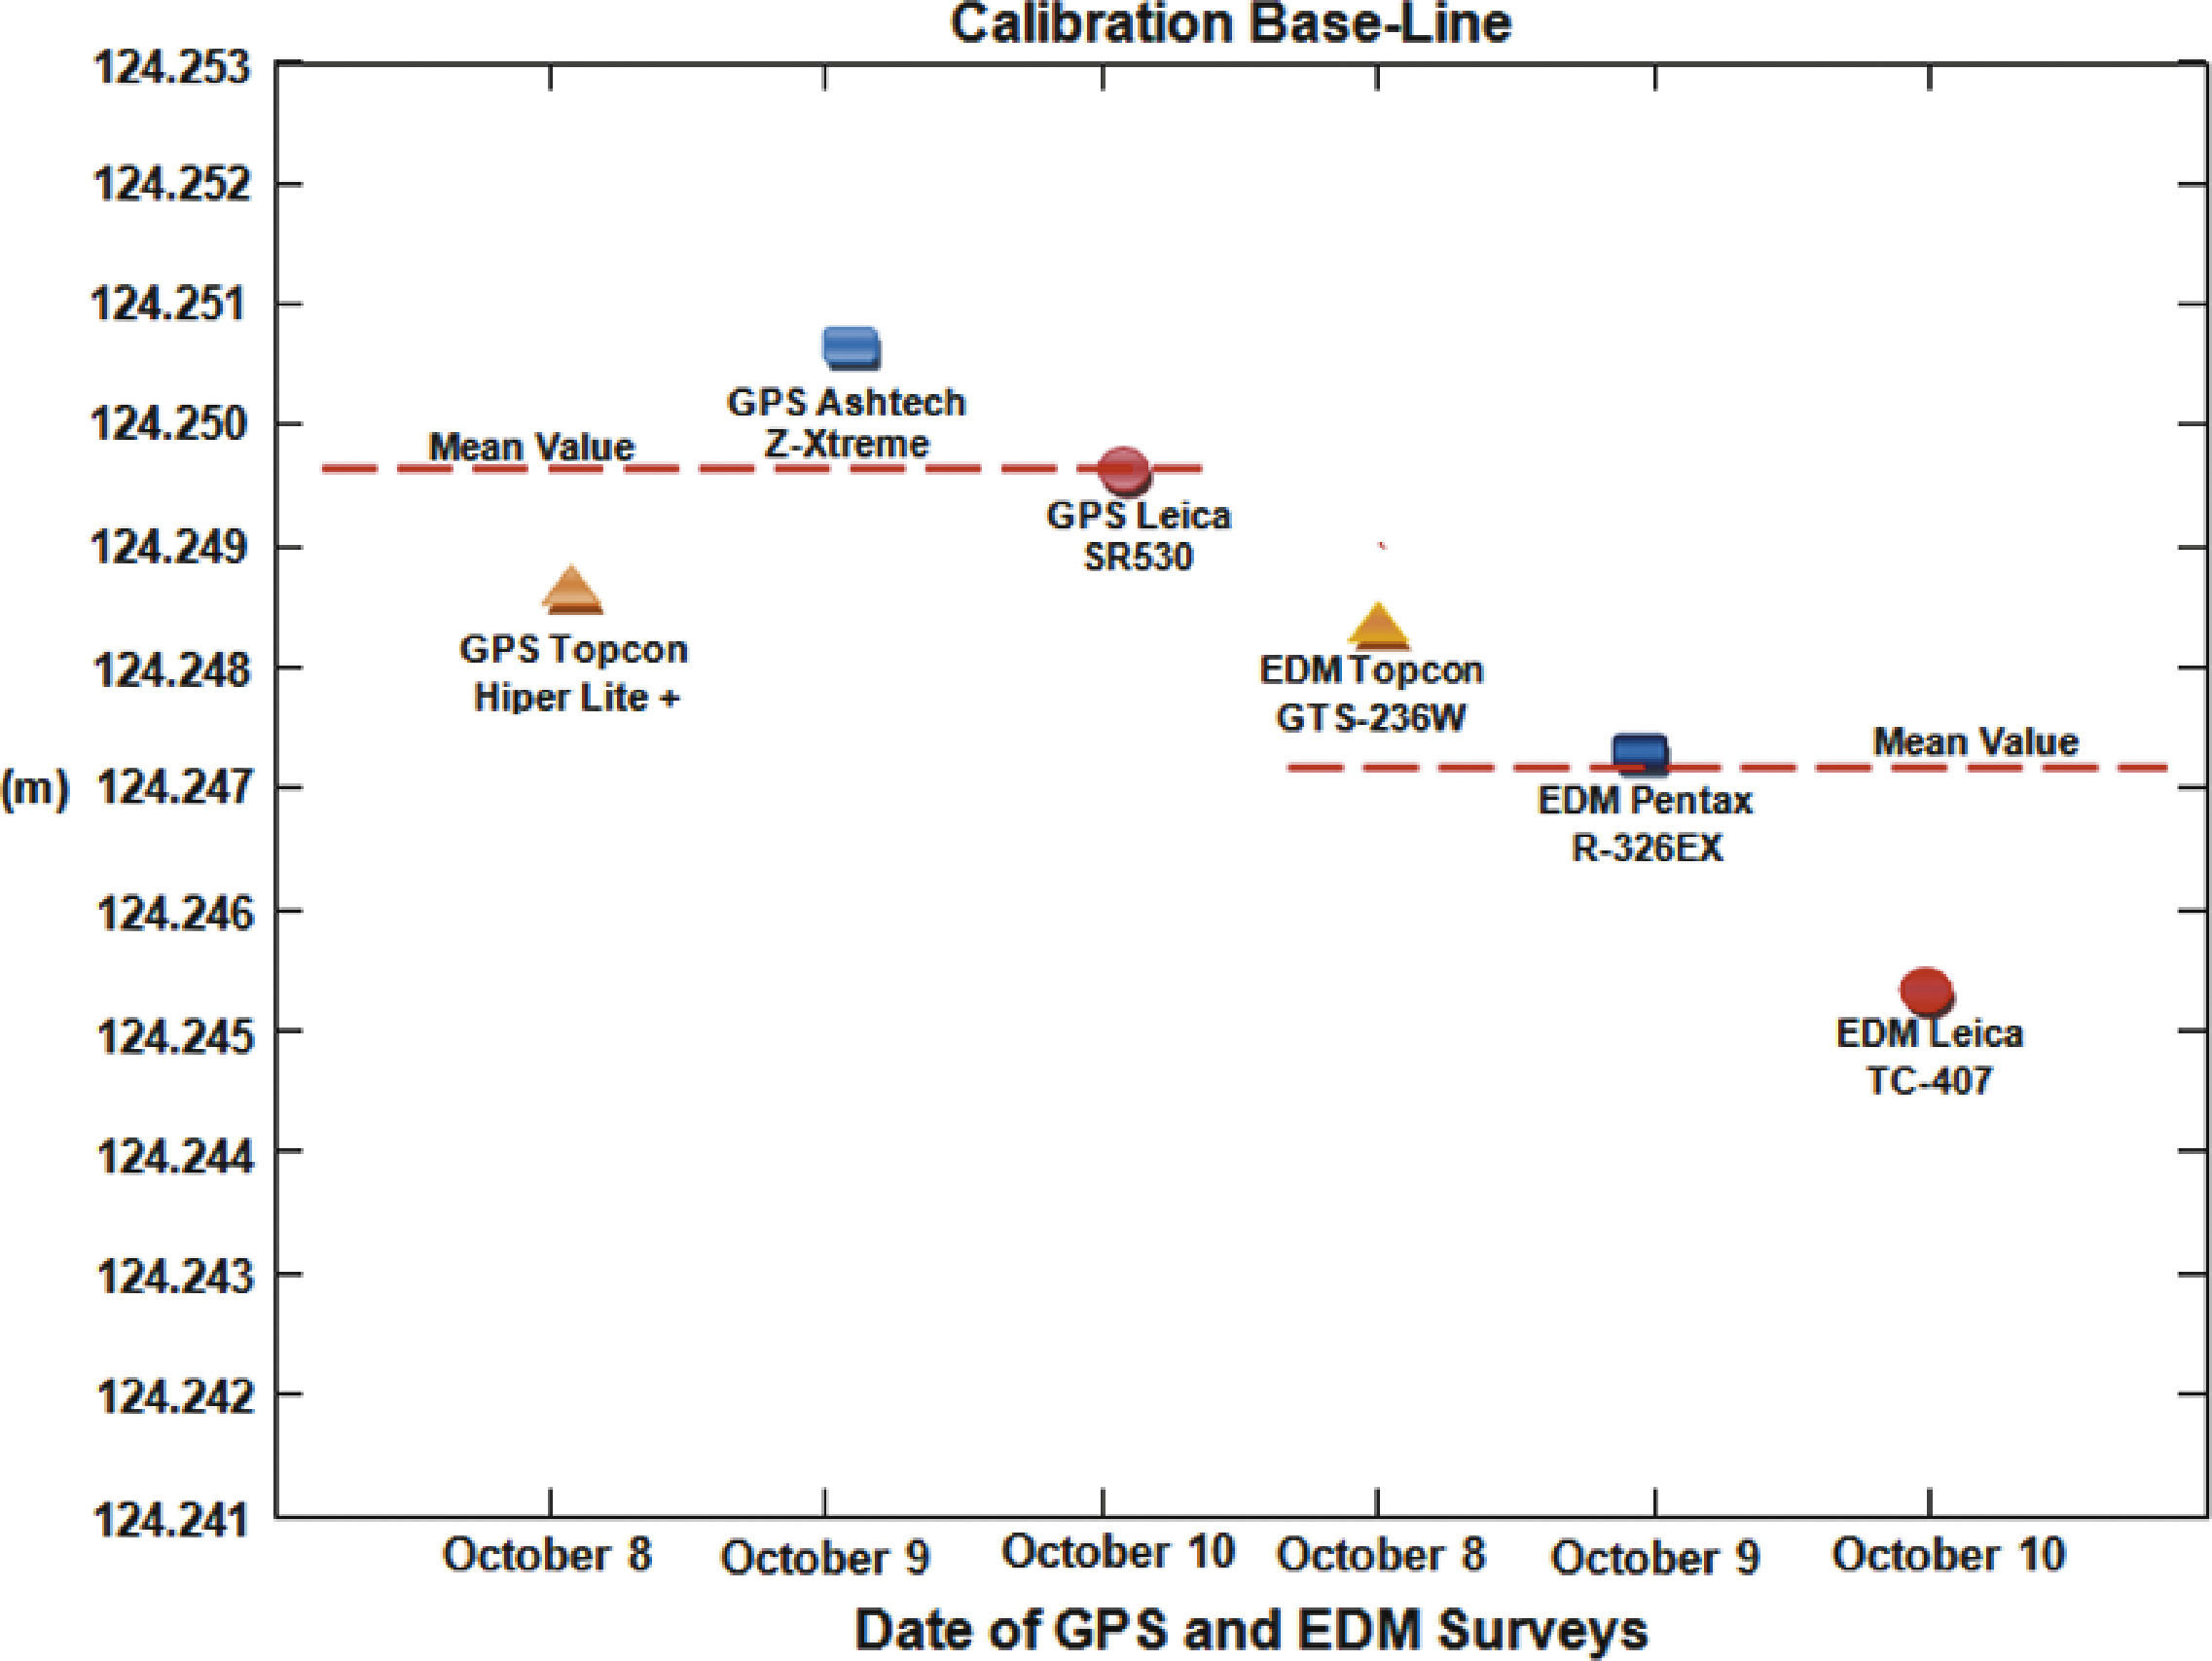
In Table 3, σN and σE represent the standard deviations values obtained when computing the coordinates of BASE1 and BAS2 stations, by using different types of GPS receivers. In contrast, σEDM corresponds to the standard deviation value computed from the set of 20 measurements with each brand of EDM considered in the experiment. Also, it can clearly be observed in Table 3 that all standard deviation values, for both GPS and EDM, are within the computed permissible accuracy (σ) presented in Table 2. Once we obtained the calibration baseline results from both GPS receivers and EDM, we made a comparison between them. In this assessment, the resulting baseline values from GPS are assumed to be the “true or reference” for the comparison. The reported weighted mean value from GPS is 124.2497 m., whereas the mean from EDM is 124.2472 m, which shows a 2.5mm difference (Figure 11). It should be point it out that the weighted mean values were computed assigning more weight to the GPS receivers and EDM's that reported more stable results according to the obtained standard deviations values.

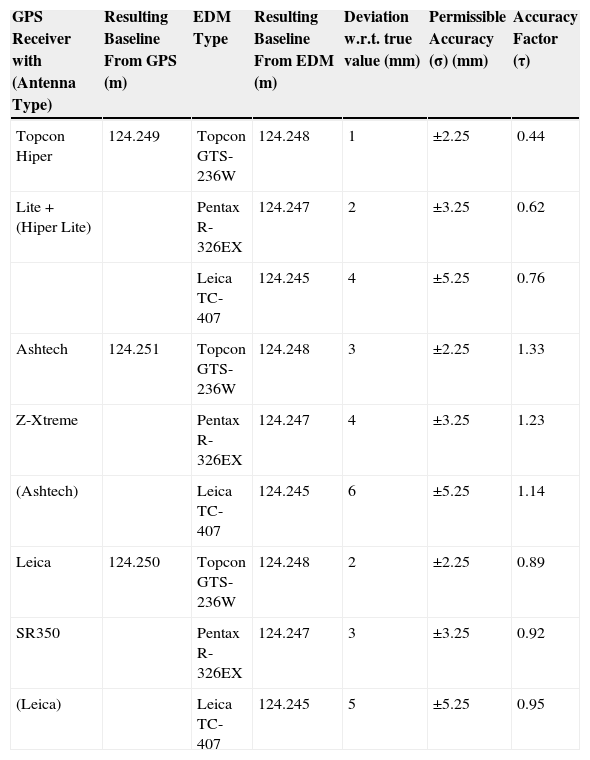
In addition, the standard deviation values from both GPS and EDM results lie within the computed permissible accuracy. When comparing GPS receivers vs. EDM of the same commercial brand, it was found that Topcon Hiper Lite + and the Topcon GTS-236W experienced a 1mm difference for the resulting baseline. If we consider that the computed permissible accuracy when performing measurements with the Topcon GTS-236W is ±2.25mm, then 1mm difference can be interpreted as 44% of such permissible accuracy. Next, a 4mm difference was obtained when comparing the Ashtech Z-Xtreme and the Pentax R-326EX. This 4mm difference represents a little bit more than the defined “tolerable accuracy of 1 σ.”, which is the assumed expected precision value when performing a measurement with the proposed EDM. It should be point out that both instruments are not exactly of the same commercial kind; however, an assumption of treating them as the same brand was made here in the comparison, since the Pentax R-326EX EDM could properly be used to compare to the Ashtech Z-Xtreme receiver. Leica SR530 and Leica TC-407 comparison shows the largest difference (5 mm). Even thought, this 5mm difference is slightly large with respect to the 4mm from the previous comparison, it represents less than (1 σ) because Leica TC-407 has larger range in the permissible accuracy than the Pentax R-326EX.
Finally, when comparing GPS receivers vs. EDM of different commercial brand, Topcon Hiper Lite + vs. Pentax R-326EX gives a 2mm difference, which represents 0.62 σ. On the other hand, there is a difference of 4mm on the comparison between Topcon Hiper Lite + and Leica TC-407. In this case the 4mm difference can be translated to 0.76 σ. The Ashtech Z-Xtreme and Topcon GTS-236W comparison reveals just a 3mm difference. Larger differences (6 mm) occurred when comparing Ashtech Z-Xtreme and Leica TC-407. However, this 6mm value is just 14% above the 1 σ; given the permissible accuracy for the Leica TC-407 is ±5.25mm. When comparing Leica SR500 and Topcon GTS-236W, differences of 2mm can be found (or 0.89 σ) and the comparison between Leica SR500 and Pentax R-326EX gives a difference of 3mm, which represents 0.92 σ. Table 4 shows the summary of the resulting calibration baseline values obtained from GPS vs. EDM, and their comparison, including the permissible accuracy (σ) and the accuracy factor (τ). The accuracy factor (τ) means “times the tolerable accuracy of 1 σ.”, which is the assumed expected deviation value when performing a measurement with EDM. According to the comparison presented in Table 4, there is not a logical correspondence between permissible accuracy (σ) and accuracy factor (τ), based on the deviation with respect to the true value. This issue can be directly attributed to the fact that permissible accuracy (provided by the manufacturer) is not consistently based on the brand of EDM considered in the experiment. A clear example can be observed when comparing deviations with respect to true value for Pentax R-326EX and Leica TC-407. That is, an increment on the deviation values is reflected in a decrement in the accuracy factor (τ), which is the opposite than one may expect.
Summary of the resulting calibration baseline values obtained from GPS vs. EDM.
| GPS Receiver with (Antenna Type) | Resulting Baseline From GPS (m) | EDM Type | Resulting Baseline From EDM (m) | Deviation w.r.t. true value (mm) | Permissible Accuracy (σ) (mm) | Accuracy Factor (τ) |
|---|---|---|---|---|---|---|
| Topcon Hiper | 124.249 | Topcon GTS-236W | 124.248 | 1 | ±2.25 | 0.44 |
| Lite + (Hiper Lite) | Pentax R-326EX | 124.247 | 2 | ±3.25 | 0.62 | |
| Leica TC-407 | 124.245 | 4 | ±5.25 | 0.76 | ||
| Ashtech | 124.251 | Topcon GTS-236W | 124.248 | 3 | ±2.25 | 1.33 |
| Z-Xtreme | Pentax R-326EX | 124.247 | 4 | ±3.25 | 1.23 | |
| (Ashtech) | Leica TC-407 | 124.245 | 6 | ±5.25 | 1.14 | |
| Leica | 124.250 | Topcon GTS-236W | 124.248 | 2 | ±2.25 | 0.89 |
| SR350 | Pentax R-326EX | 124.247 | 3 | ±3.25 | 0.92 | |
| (Leica) | Leica TC-407 | 124.245 | 5 | ±5.25 | 0.95 |
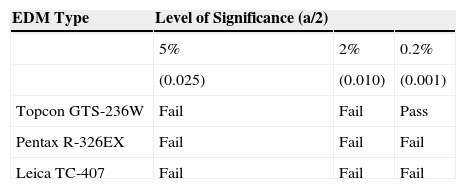
Based on the above analysis where proper measurements and computational procedures were followed, we now performed a hypothesis testing by using a two-tailed test in order to address the concern about if the three types of EDM are working within their accuracy specifications. In other words, we need to determine more rigorously if EDM are providing correct results when comparing to the GPS mean value, which is assumed as the true value for the calibration baseline. It is expected that the EDM observed distances will be rejected if they are statistically either to short or too long as compared to the mean of the resulting calibration baseline from GPS. From the proposed test we need to verify that: H0: μ=ỹ vs. Ha: μ≠ỹ, where H0 is the null hypothesis, Ha is the alternative hypothesis, μ is mean value from GPS and ỹ is the mean value from EDM. After applying the well-known t distribution in the computations and taking into account different levels of significances (5%, 2% and 0.2%), the final decisions for accepting are presenting in Table 5.
According to the results presented in Table 5, only Topcon GTS-236W at 99.8% lies within the indicated confidence interval and it passed the test. Pentax R-326EX was too closed to fulfill the condition of passing the test at 0.2% significance level, but it fail for the three levels of significance (5%, 2% and 0.2%). Additionally, with Leica TC-407 was rejected; thus, it also fails the test. This issue can be attributed to the fact that this EDM was the least accurate when performing the baseline measurements and also provides larger range of computed permissible accuracy derived from accuracy specifications of the manufacturer. However, for those EDM that fails to contain the calibration baseline value (at any specific significance level), there is no a strong reason to be concerned about the calibration status of these instruments, since they diverge within 1 to 5mm with respect to the true value from GPS.
ConclusionsThe establishment of calibration-baseline (BASE1-BASE2) by means of GPS measurements was performed very precisely, and fulfilled the accuracy standards according its dimensions (∼125 m) for the proposed experiment. Resulting calibration baseline values from GPS compared very-well among different brands with differences of ±2mm in contrast with the resulting EDM values that differ within ±3mm. EDM measurements also show a slightly greater discrepancy in comparison with the permissible accuracy. It was also found a difference of 2.5mm in the mean values from GPS vs. EDM. Of the EDM brands tested, the Topcon GTS-236W preformed the best (±1mm up to ±3mm), followed by the Pentax R-326EX (±2mm up to ±4mm) and finally the Leica TC-407 (±4mm up to ±6mm). In the case of the established tolerable accuracy of 1σ, all EDM fulfill this condition when comparing results with true values from Topcon Hiper Lite + and Leica SR350 GPS receivers. The 1σ condition fails for the three EDM when comparing results with respect to mean value from Ashtech Z-Xtreme GPS receiver. From the hypothesis testing, only two EDM: Topcon GTS-236W and Pentax R-326EX contain the calibration baseline value at 2% and 0.2% level of significance, respectively; however, this is not a powerful reason to be concerned about the calibration status of the EDM Leica TC-407 which entirely failed the tests, because of its large accuracy specifications provided by its manufacturer. The methodology, measurements and computations used in this research for the baseline calibration (BASE1 and BASE2) followed the strict requirements according to the accuracies of the employed geodetic-grade GPS receivers and EDM. Therefore, it is recommended that this calibration baseline serves as reference for further calibration of geodetic equipment at the FACITE-UAS.
The authors are indebted to Kat Compton for carefully reviewing the manuscript and for her valuable comments to improve its content.