


Previous studies have suggested an association between MS and vitamin D deficiency, but data are not conclusive. This study was intended to find out if metabolic syndrome, according to the 2009 IDF/AHA/NHLBI, is associated to the presence of vitamin D deficiency.
Material and methodsA cross-sectional study was conducted on a sample of 326 subjects aged 18 years or older, recruited from a health center in Alcalá de Henares. Participants underwent an interview and a standardized clinical examination. In a second visit, blood tests were performed in 255 subjects to quantify serum levels of 25-hydroxyvitamin D (25 OH-VitD) and different laboratory parameters associated to MS. The association between vitamin D deficiency and metabolic syndrome (and each of its components) was examined.
ResultsIn the study population, MS prevalence was 36.1% and prevalence of vitamin D deficiency (25 OH-Vit D<20ng/mL) was 56.3%. MS was more common in the group of patients with vitamin D deficiency (43.4%) than in the group with no deficiency (26.8%, P=0.006), with an estimated prevalence ratio of 1.62 (95% CI: 1.13–2.31). Adjustment for age, sex, and body mass index did not change such association.
ConclusionsThere is a significant association between vitamin D deficiency and MS. Both conditions are highly prevalent in our population.
Estudios previos han sugerido una asociación entre síndrome metabólico (SM) y el déficit de vitamina D, si bien estos datos no son concluyentes. Este estudio pretende conocer si la presencia de SM, según criterios de IDF/AHA/NHLBI de 2009, se asocia con la presencia de déficit de vitamina D.
Material y métodosSe realizó un estudio de corte transversal en el que se incluyeron inicialmente 326 individuos >18 años, seleccionados de un centro de salud de Alcalá de Henares. A los participantes se les hizo una entrevista y un examen clínico estandarizado y, finalmente, en una segunda visita, a 255 sujetos se les realizó un análisis de sangre para cuantificar las concentraciones séricas de 25 hidroxivitamina D (25 OH-VitD) y diferentes parámetros analíticos asociados al SM. Se analizó la asociación entre el déficit de la vitamina D y el SM (y cada uno de sus distintos componentes).
ResultadosEn la población de estudio la prevalencia de SM fue del 36,1% y del déficit de vitamina D, 25 OH-VitD<20ng/ml, del 56,3%. El SM fue más frecuente en el grupo de pacientes con déficit de vitamina D, 43,4%, respecto al grupo sin déficit, 26,8% (p=0,006), siendo la razón de prevalencia de SM de 1,62 (IC 95%: 1,13–2,31). Esta asociación se mantuvo tras el ajuste por edad, sexo e índice de masa corporal.
ConclusionesExiste una asociación significativa entre el déficit de vitamina D y el SM, situaciones clínicas de elevada prevalencia en nuestra población.
Metabolic syndrome (MS) and its consequences have become an increasing health problem in the 21st century. MS is a clinical condition defined by the occurrence of a number of metabolic and vascular changes: central obesity, high blood pressure, dyslipidemia, hyperglycemia, insulin resistance, and a prothrombotic state. The main effect of these changes is an increased risk of cardiovascular disease and type 2 diabetes mellitus, but they have also been associated with non-alcoholic liver disease, gout, and sleep apnea, among others.1 Abdominal obesity, one of the components of MS, has also been recently associated with an increased overall risk of cancer.2 Insulin resistance (IR) is the hypothesis most widely accepted to explain the etiopathogenesis of MS.1
However, the diagnosis of MS, and even its very existence, is controversial, particularly because diagnostic criteria of the syndrome have changed over time. This has made it very difficult to compile data regarding its prevalence. The main scientific bodies involved in MS management (IDF/AHA/NHLBI) recently reached a consensus that harmonizes the different diagnostic criteria currently available.3
On the other hand, the effects of vitamin D on bone health and the maintenance of phosphate and calcium metabolism have been widely studied and are well known today. Many other actions of vitamin D in the body have been discovered in recent years. These other extraskeletal actions are due, among other factors, to the ubiquity of the vitamin D receptor and enzymes that hydroxylate vitamin D, and also to the different regulation of this production depending on the tissue where they are expressed, which causes vitamin D, as hormone, to have not only endocrine functions, but also autocrine and paracrine functions.4,5
The cause of MS is unknown, and although some predisposing genetic and environmental factors have been identified, in recent years it has been proposed that vitamin D deficiency could be one of these factors. Various cross-sectional studies have supported this theory of a relationship between the presence of metabolic syndrome and vitamin D deficiency.6–9 However, few prospective observational studies10–12 and interventional studies13,14 showing this relationship are available.
The purpose of this study was to ascertain whether the presence of MS, according to the harmonized criteria of IDF/AHA/NHLBI, is associated with the presence of vitamin D deficiency, and to ascertain whether an association exists between vitamin D deficiency and any of the components of MS.
Material and methodsStudy description and designThis was an observational, cross-sectional study that analyzed a sample of 326 subjects of both sexes over 18 years of age selected from primary care clinics of the Luis Vives healthcare center in Alcalá de Henares (Madrid, Spain). Both subjects who attended for consultation and those accompanying them could be selected. Data were prospectively collected for 12 weeks, from March to June 2011, and the first six subjects who attended the clinics every day were invited to participate in the study. According to the health census, in 2011 the catchment area of the Luis Vives center had a population of 28,269.
Inclusion criteria were as follows: an age of 18 years or more, and the provision of written consent. Exclusion criteria included: pregnancy or breast-feeding, current treatment with vitamin D in any form or dose, severe chronic kidney failure (defined as glomerular filtration rate <30mL/min, estimated by the MDRD formula), nephrotic syndrome, liver disease and/or GOT or GPT >1.5 times the upper normal limit, conditions causing intestinal malabsorption, immigrants who had moved to Madrid from lower latitude areas in the previous five years, and current treatment with drugs which alter vitamin D metabolism, such as phenytoin, phenobarbital, carbamazepine, isoniazide, theophylline, and rifampin.15
The study consisted of two phases. The first phase consisted of the collection of demographic data, dietary history, anthropometric data (weight, height, the BMI, and waist circumference), and blood pressure, as measured using an automated OMRON device. The waist was measured, using a flexible measuring tape, with the subject standing, the diameter being obtained, parallel to the floor and 2cm above the upper margin of the iliac crest and at midaxillary level.
In the second study phase, each subject had an appointment to give a blood sample to be used for testing the following biochemical parameters: glucose, HbA1c, plasma creatinine, GOT, GPT, GGT, alkaline phosphatase, uric acid, triglycerides, cholesterol, HDL cholesterol (HDL-C), LDL cholesterol (LDL-C), calcium, and phosphorus. These tests were performed using autoanalyzers according to standardized techniques. HbA1c was measured by HPLC using the Variant™ II Turbo system (Bio-Rad Laboratories S.A., California, USA), which provided standardized results according to DCCT/NGSP. All other parameters were tested by immunochemical procedures, using the Olympus AU5400™ autoanalyzer (Olympus Corporation, Tokyo, Japan). Using the same sample, intact PTH levels were measured by an immunochemiluminescence method (Immulite® 1000 analyzer, Siemens, USA), and insulin and 25-hydroxyvitamin D (25 OH-VitD) levels were measured by immunochemiluminescence (Liaison® analyzer, DiaSorin, Italy). Insulin resistance (IR) was estimated by the HOMA method16 using the following formula: basal insulinemia (μU/mL)×plasma glucose (mg/dL)/405.
The study was approved by the ethics committee of Hospital Universitario Príncipe de Asturias (HUPA) (project no. 01/2011) and the central committee for research in primary care of the HUPA healthcare area (project no. 16/11). All subjects gave their written consent.
Sample size estimationThe study was intended to detect a prevalence ratio of MS between subjects with vitamin D deficiency and those with no deficiency of at least 1.5 with a precision of 0.33 (log prevalence ratio). Such precision would allow for obtaining a bilateral 95% confidence interval whose lower limit would be higher than 1 (nil value), therefore reaching a statistical significance of p<0.05. The prevalence of vitamin D deficiency, defined as 25 OH-VitD levels<20ng/mL, in the study population was assumed to be 50%, and the prevalence of MS in the group with no deficiency was assumed to be 30%.6 Based on these assumptions, it was estimated that a sample size of 125 subjects in each comparison group was required. Sample size was estimated using software Ene 3.0 (GlaxoSmithKline, S.A. Tres Cantos, Madrid, Spain).
Diagnostic criteria of metabolic syndromeA diagnosis of MS was defined using the 2009 IDF/AHA/NHLBI criteria.3 MS was diagnosed in the presence of three of the five criteria given below: (a) waist circumference ≥102cm in males or ≥88cm in females; (b) triglyceride levels ≥150mg/dL or drug treatment for hypertriglyceridemia; (c) HDL-C <40mg/dL in males or <50mg/dL in females; (d) systolic blood pressure ≥130mmHg or diastolic blood pressure ≥85mm Hg, or drug treatment for high blood pressure; and (e) fasting blood glucose ≥100mg/dL or drug treatment for hyperglycemia.
Data processing and statistical analysisDescriptive data are given as absolute frequencies, percentages, means (M), and standard deviation (SD). A Kolmogorov–Smirnov test was used to adjust variables to normality. To analyze between-group quantitative variables, parametric (Student's “t”) or nonparametric (Mann–Whitney) tests were used as applicable. To compare qualitative variables, and to verify whether the presence of MS was associated with vitamin D deficiency, that is, if the null hypothesis was accepted or rejected, a Chi-square test was used. A correlation analysis (Pearson) and simple linear regression were used to measure the degree of association between numerical variables, and to assess the association between the presence of MS and vitamin D deficiency, adjusted for confounding factors, a multiple logistic regression model was constructed where MS was the outcome variable (yes/no) and vitamin D deficiency (yes/no) was the main explanatory variable. The strength of association between MS and the explanatory variables was measured through the prevalence ratio (PR) and the odds ratio (OR), with their corresponding 95% confidence intervals (95% CIs). In all hypothesis tests, the null hypothesis was rejected if p<0.05.
Statistical analysis was performed using the software SPSS 15.0 for Windows (SPSS, Chicago, IL).
ResultsOf the 326 subjects initially selected, 255 were enrolled into the study at the end of the two phases. This was because 71 (21.7%) subjects did not keep their appointment for the laboratory tests. An analysis comparing enrolled and non-enrolled subjects showed no significant differences in the clinical variables collected at the initial interview: age, sex, blood pressure, the BMI, waist, the presence of high blood pressure (HBP) or diabetes mellitus (DM). There was a higher proportion of non-Caucasian subjects in the group who did not give blood samples as compared to the group who did (9.8% vs 3.9%).
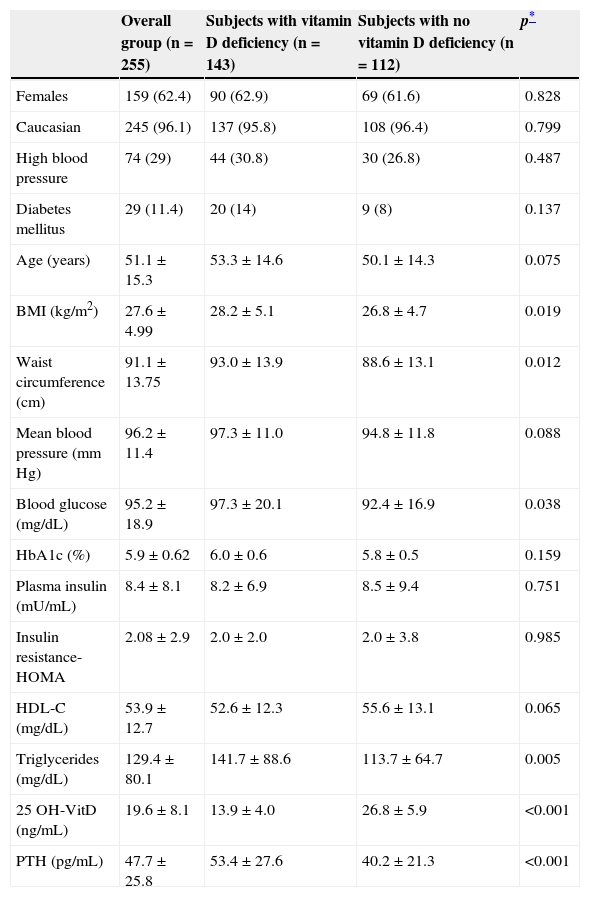
Table 1 shows the characteristics of the study population, mainly consisting of women (62.3%), of Caucasian ethnicity (96.1%) and with a mean age of 51 years (SD=15.3; range 18–83 years). A history of DM and HBP was found in 11.4% and 29.0% of the study sample respectively. Of the 255 subjects, 208 (81.5%) were selected when they attended the healthcare center, and 47 (18.5%) were the companions of attendees. The Annex (see supplemental material) shows that there were no significant differences in clinical and laboratory variables between attending and accompanying subjects.
Characteristics of the main clinical and laboratory variables of the study sample (n=255).
| Overall group (n=255) | Subjects with vitamin D deficiency (n=143) | Subjects with no vitamin D deficiency (n=112) | p* | |
|---|---|---|---|---|
| Females | 159 (62.4) | 90 (62.9) | 69 (61.6) | 0.828 |
| Caucasian | 245 (96.1) | 137 (95.8) | 108 (96.4) | 0.799 |
| High blood pressure | 74 (29) | 44 (30.8) | 30 (26.8) | 0.487 |
| Diabetes mellitus | 29 (11.4) | 20 (14) | 9 (8) | 0.137 |
| Age (years) | 51.1±15.3 | 53.3±14.6 | 50.1±14.3 | 0.075 |
| BMI (kg/m2) | 27.6±4.99 | 28.2±5.1 | 26.8±4.7 | 0.019 |
| Waist circumference (cm) | 91.1±13.75 | 93.0±13.9 | 88.6±13.1 | 0.012 |
| Mean blood pressure (mm Hg) | 96.2±11.4 | 97.3±11.0 | 94.8±11.8 | 0.088 |
| Blood glucose (mg/dL) | 95.2±18.9 | 97.3±20.1 | 92.4±16.9 | 0.038 |
| HbA1c (%) | 5.9±0.62 | 6.0±0.6 | 5.8±0.5 | 0.159 |
| Plasma insulin (mU/mL) | 8.4±8.1 | 8.2±6.9 | 8.5±9.4 | 0.751 |
| Insulin resistance-HOMA | 2.08±2.9 | 2.0±2.0 | 2.0±3.8 | 0.985 |
| HDL-C (mg/dL) | 53.9±12.7 | 52.6±12.3 | 55.6±13.1 | 0.065 |
| Triglycerides (mg/dL) | 129.4±80.1 | 141.7±88.6 | 113.7±64.7 | 0.005 |
| 25 OH-VitD (ng/mL) | 19.6±8.1 | 13.9±4.0 | 26.8±5.9 | <0.001 |
| PTH (pg/mL) | 47.7±25.8 | 53.4±27.6 | 40.2±21.3 | <0.001 |
Data given as No. (%) and M±SD.
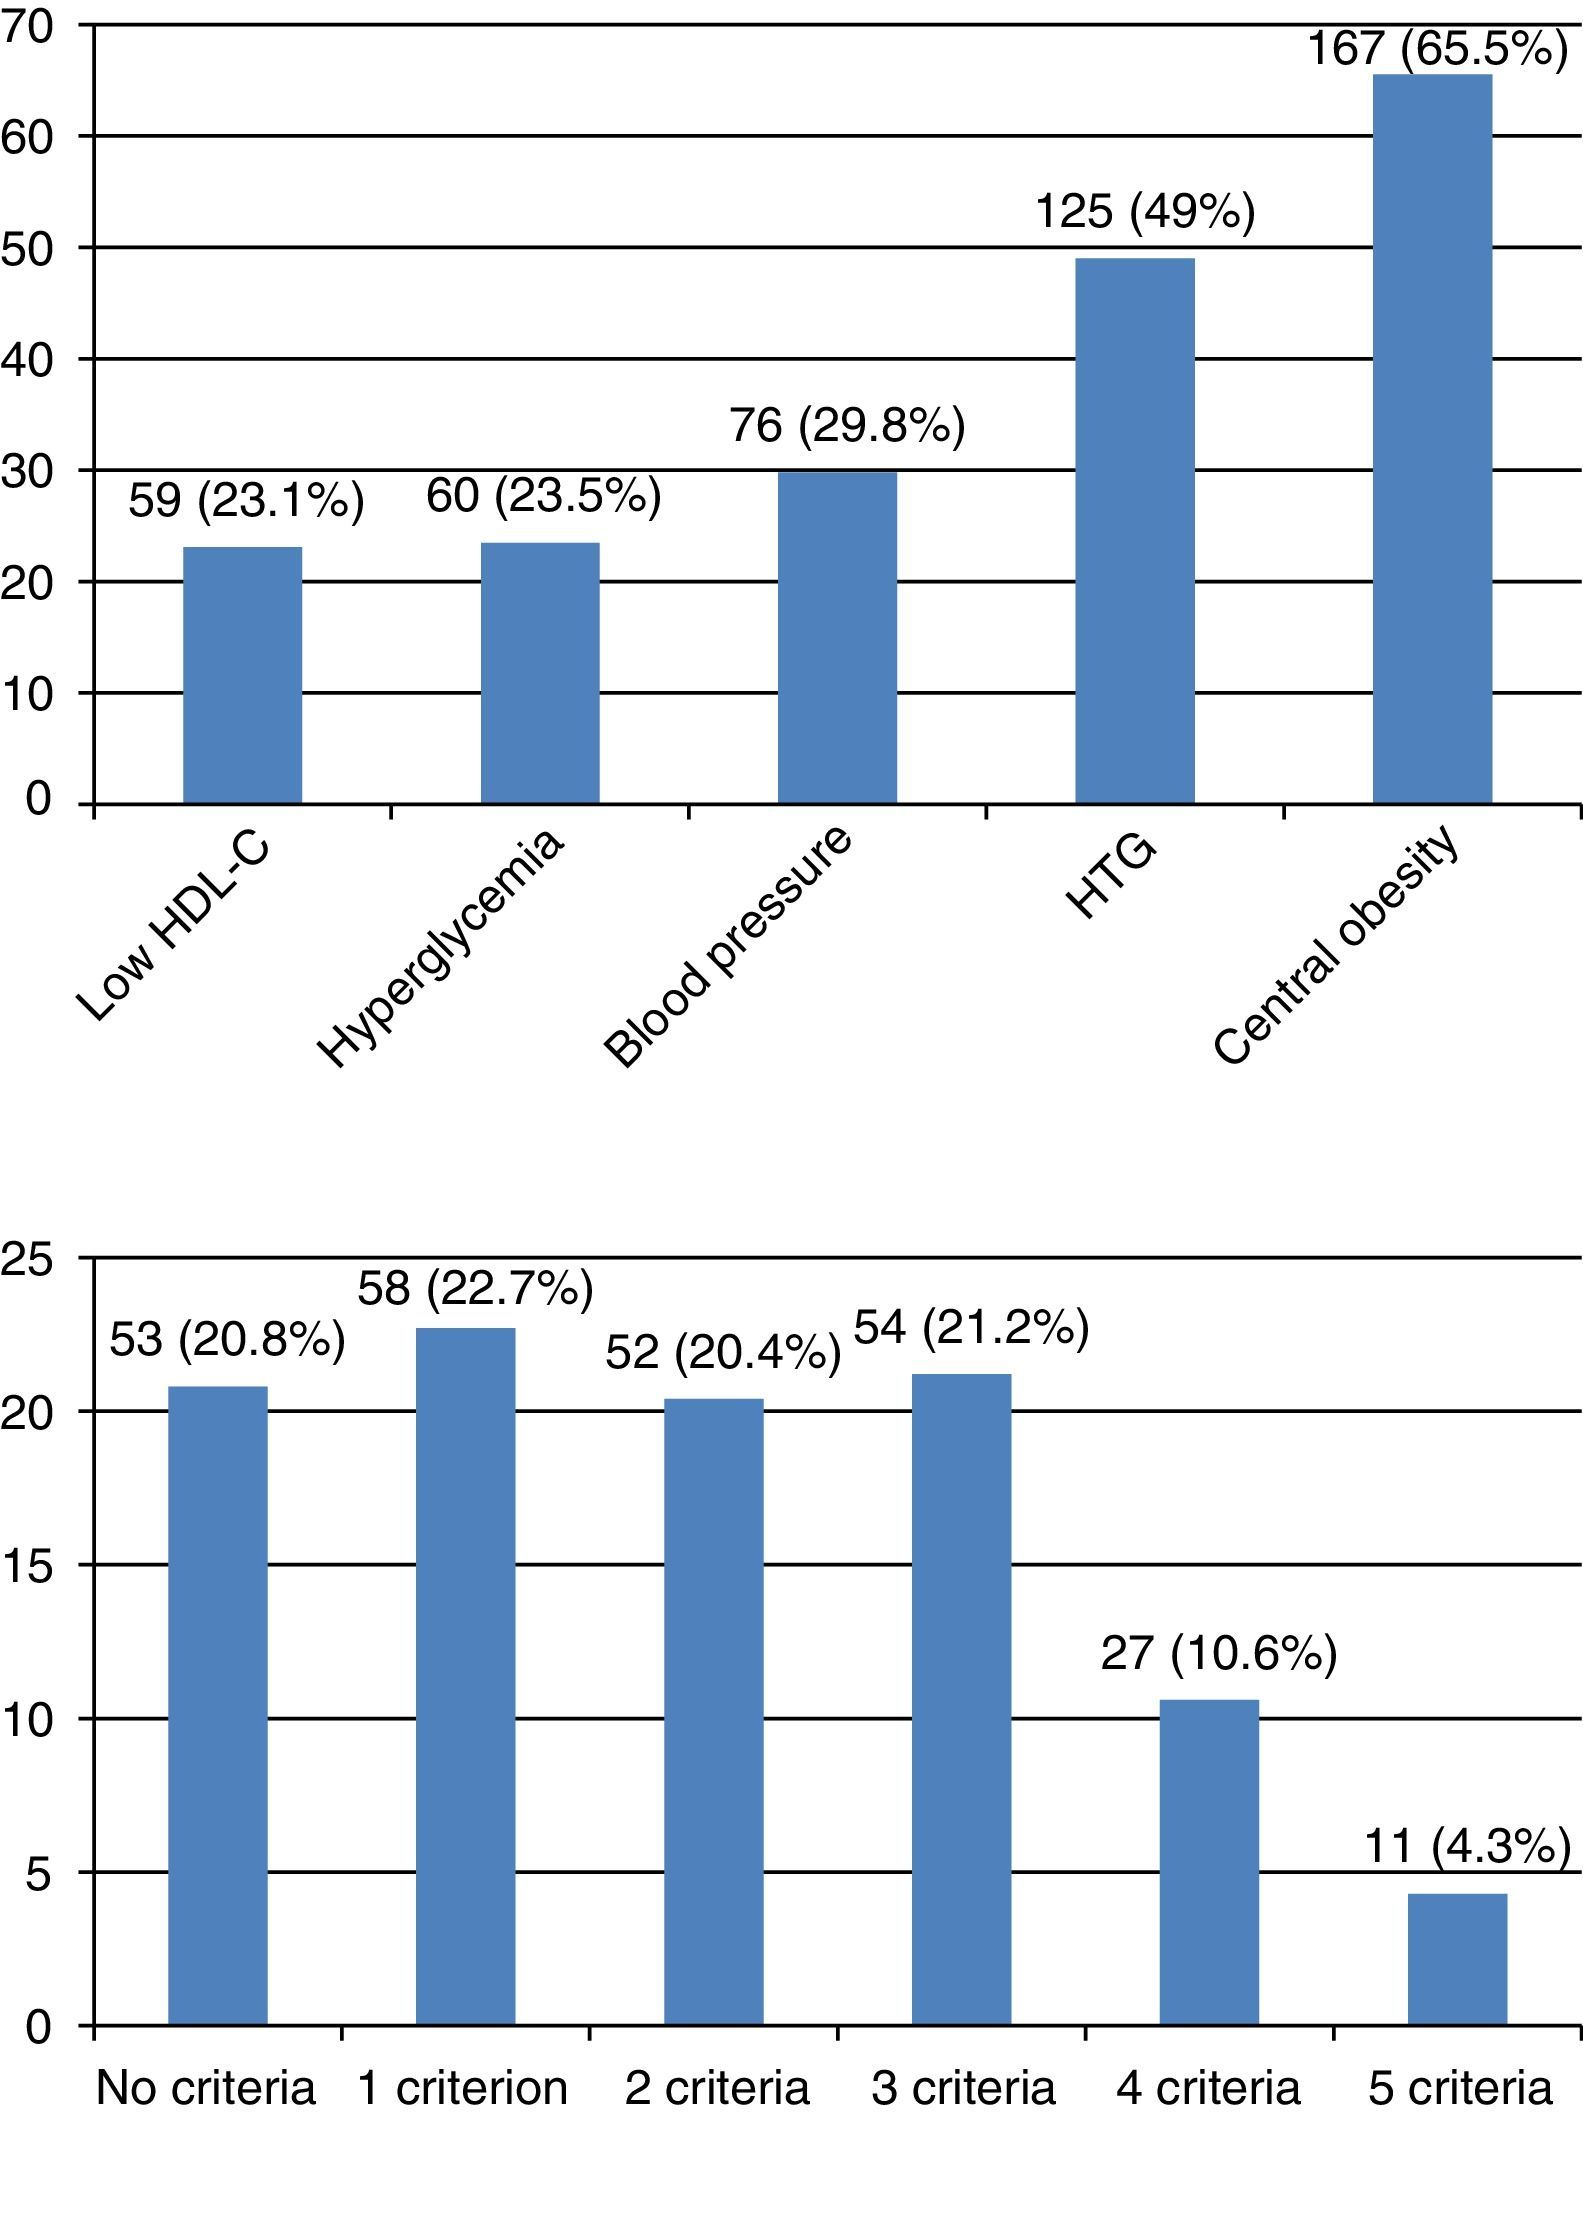
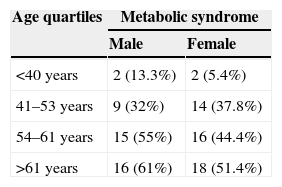
The number of subjects with MS was 92 (36.1%). Central obesity was the most prevalent criterion (65.5%), and HDL-C the least prevalent criterion (23.1%). Most subjects, almost 80%, had some criterion for MS. Four criteria were found in 10.6%, and five criteria in 4.3% of subjects. Fig. 1 shows the prevalence of each criterion, and the distribution of the number of criteria. MS was more common among males (n=42; 43.7%) as compared to females (n=50; 31.4%), with a PR of 1.39 (95% CI: 1.0–1.92) in males as compared to females (p=0.047). When the sample was divided into quartiles, age distribution also showed an increased MS prevalence with age in both males and females (Table 2).
 Prevalence of components of MS. Low HDL-C: <40mg/dL in males or <50mg/dL in females. Hyperglycemia: fasting blood glucose ≥100mg/dL or drug treatment for hyperglycemia. Blood pressure: ≥130mmHg systolic or ≥85mmHg diastolic, or drug treatment for high blood pressure. HTG: hypertriglyceridemia ≥150mg/dL or drug treatment for elevated triglyceride levels. Central obesity: waist circumference ≥102cm in males or ≥88cm in females. (B) Prevalence of number of MS criteria.")
Prevalence of components and number of metabolic syndrome criteria in the study sample. (A) Prevalence of components of MS. Low HDL-C: <40mg/dL in males or <50mg/dL in females. Hyperglycemia: fasting blood glucose ≥100mg/dL or drug treatment for hyperglycemia. Blood pressure: ≥130mmHg systolic or ≥85mmHg diastolic, or drug treatment for high blood pressure. HTG: hypertriglyceridemia ≥150mg/dL or drug treatment for elevated triglyceride levels. Central obesity: waist circumference ≥102cm in males or ≥88cm in females. (B) Prevalence of number of MS criteria.
The mean 25 OH-VitD level was 19.6ng/mL (SD=8.1; range, 4.9–52.3ng/mL). Levels lower than 20ng/mL were found in 143 subjects (56.1%). Sex distribution showed no significant differences. However, an association was found between the 25 OH-VitD level and some physiological variables. Thus, linear regression analysis showed a negative correlation between 25 OH-VitD levels and age (p=0.034), BMI (p=0.003) and serum PTH levels (p<0.001). 25 OH-VitD levels<30ng/mL in the range of vitamin D insufficiency were seen in 228 subjects (89.4%).
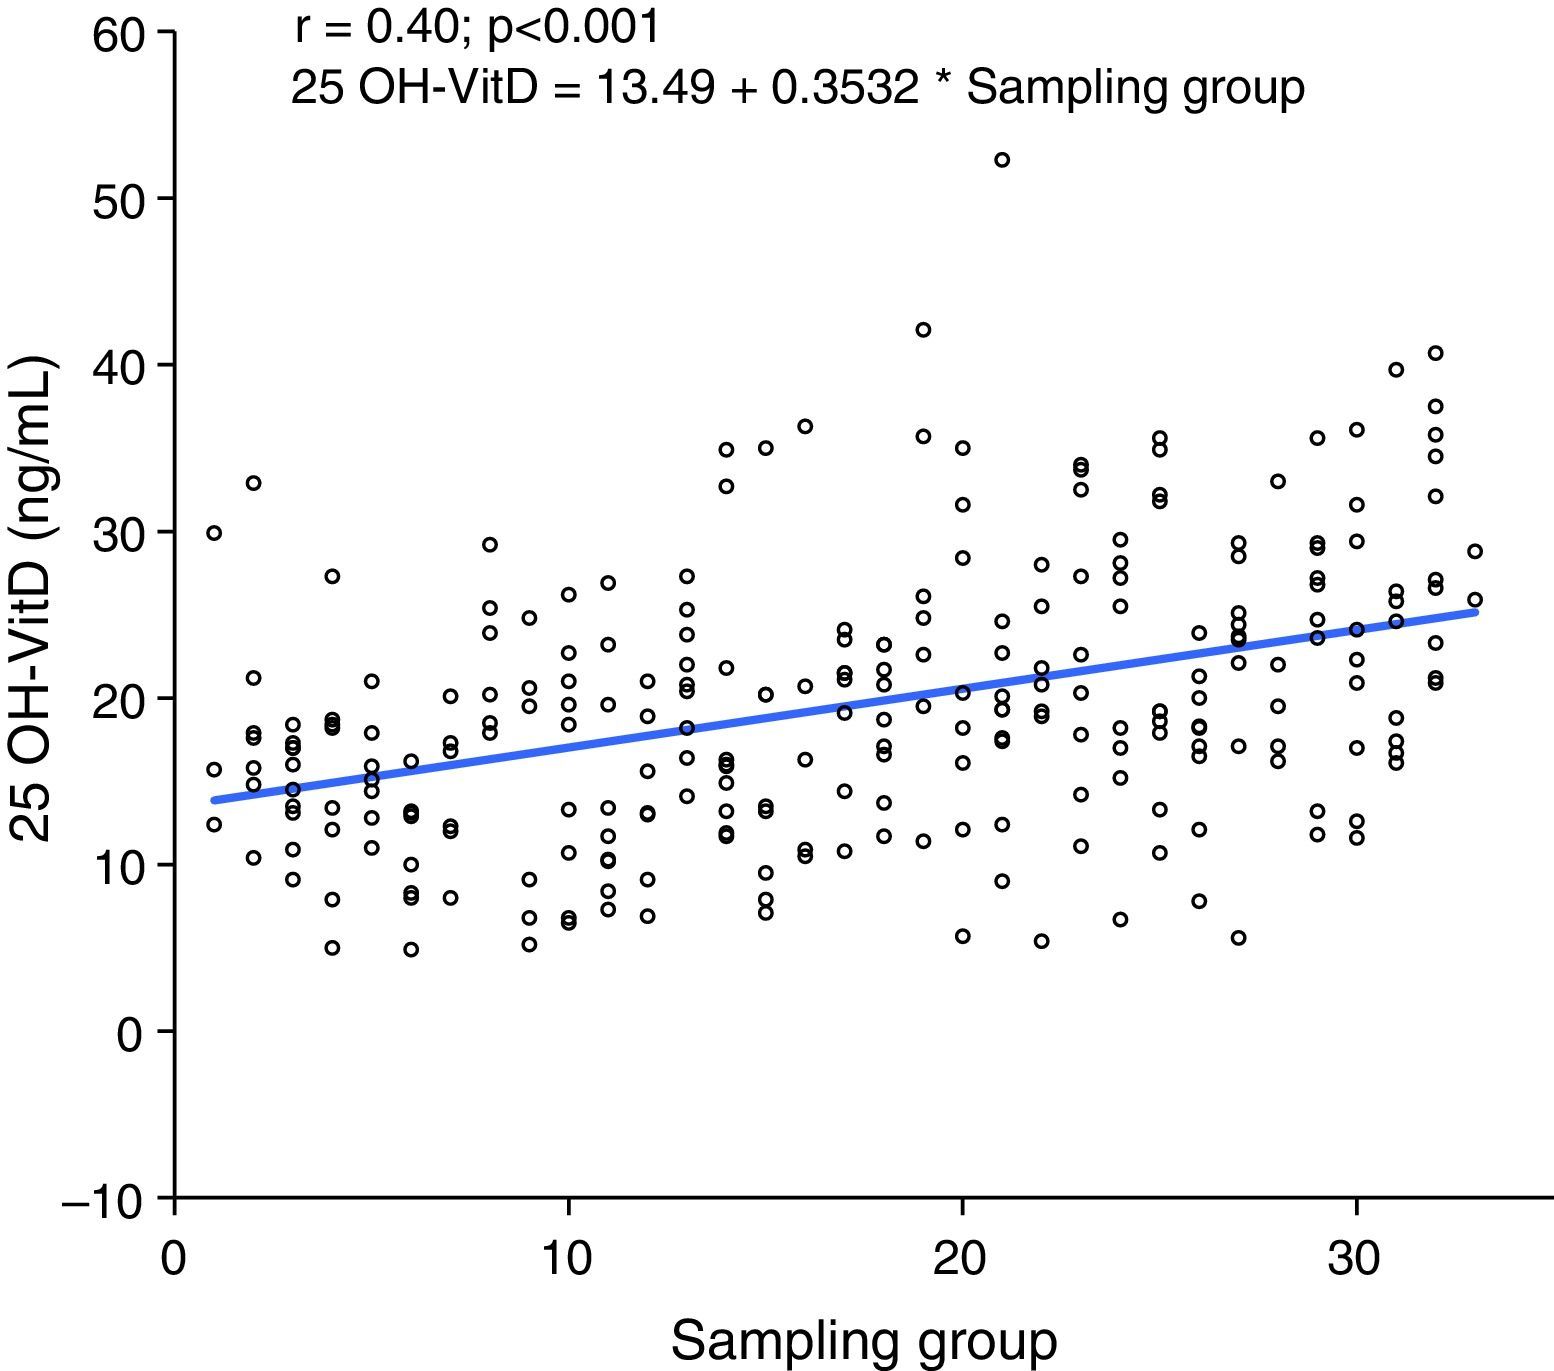
When subjects were pooled into groups of 10 by selection time, which lasted 12 weeks from March 2011, a positive correlation was seen between sampling time and 25 OH-VitD levels, so that levels increased as summer approached (p<0.001) (Fig. 2).
, and 25 OH-VitD levels.")
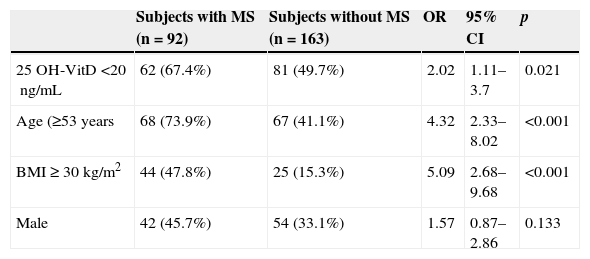
Subjects with 25 OH-VitD deficiency had a greater MS prevalence (62 of 143; 43.4%) than those with no deficiency (30 of 112; 26.8%) (p=0.006), with a PR=1.62 (95% CI: 1.13–2.31) and an OR=2.09 (95% CI: 1.23–3.56). The association was greater between the lowest 25 OH-ViD levels (<13.4ng/mL) (64; 25%) as compared to the intermediate or highest levels (191; 75%) (p=0.001), with a PR of 1.75 (95% CI: 1.27–2.39) and an OR of 2.59 (95% CI: 1.45–4.64). In the multiple logistic regression analysis (Table 3), the association between vitamin D and MS was maintained (OR=2.02; 95% CI: 1.11–3.7) after adjusting for age (≥53 vs <53 years), sex (male vs female), and the BMI (≥30 vs <30kg/m2).
Results of multiple logistic regression analysis to evaluate the association between metabolic syndrome (dependent or outcome variable) and vitamin D deficiency (main explanatory variable) adjusted for various confounding factors.
| Subjects with MS (n=92) | Subjects without MS (n=163) | OR | 95% CI | p | |
|---|---|---|---|---|---|
| 25 OH-VitD <20ng/mL | 62 (67.4%) | 81 (49.7%) | 2.02 | 1.11–3.7 | 0.021 |
| Age (≥53 years | 68 (73.9%) | 67 (41.1%) | 4.32 | 2.33–8.02 | <0.001 |
| BMI≥30kg/m2 | 44 (47.8%) | 25 (15.3%) | 5.09 | 2.68–9.68 | <0.001 |
| Male | 42 (45.7%) | 54 (33.1%) | 1.57 | 0.87–2.86 | 0.133 |
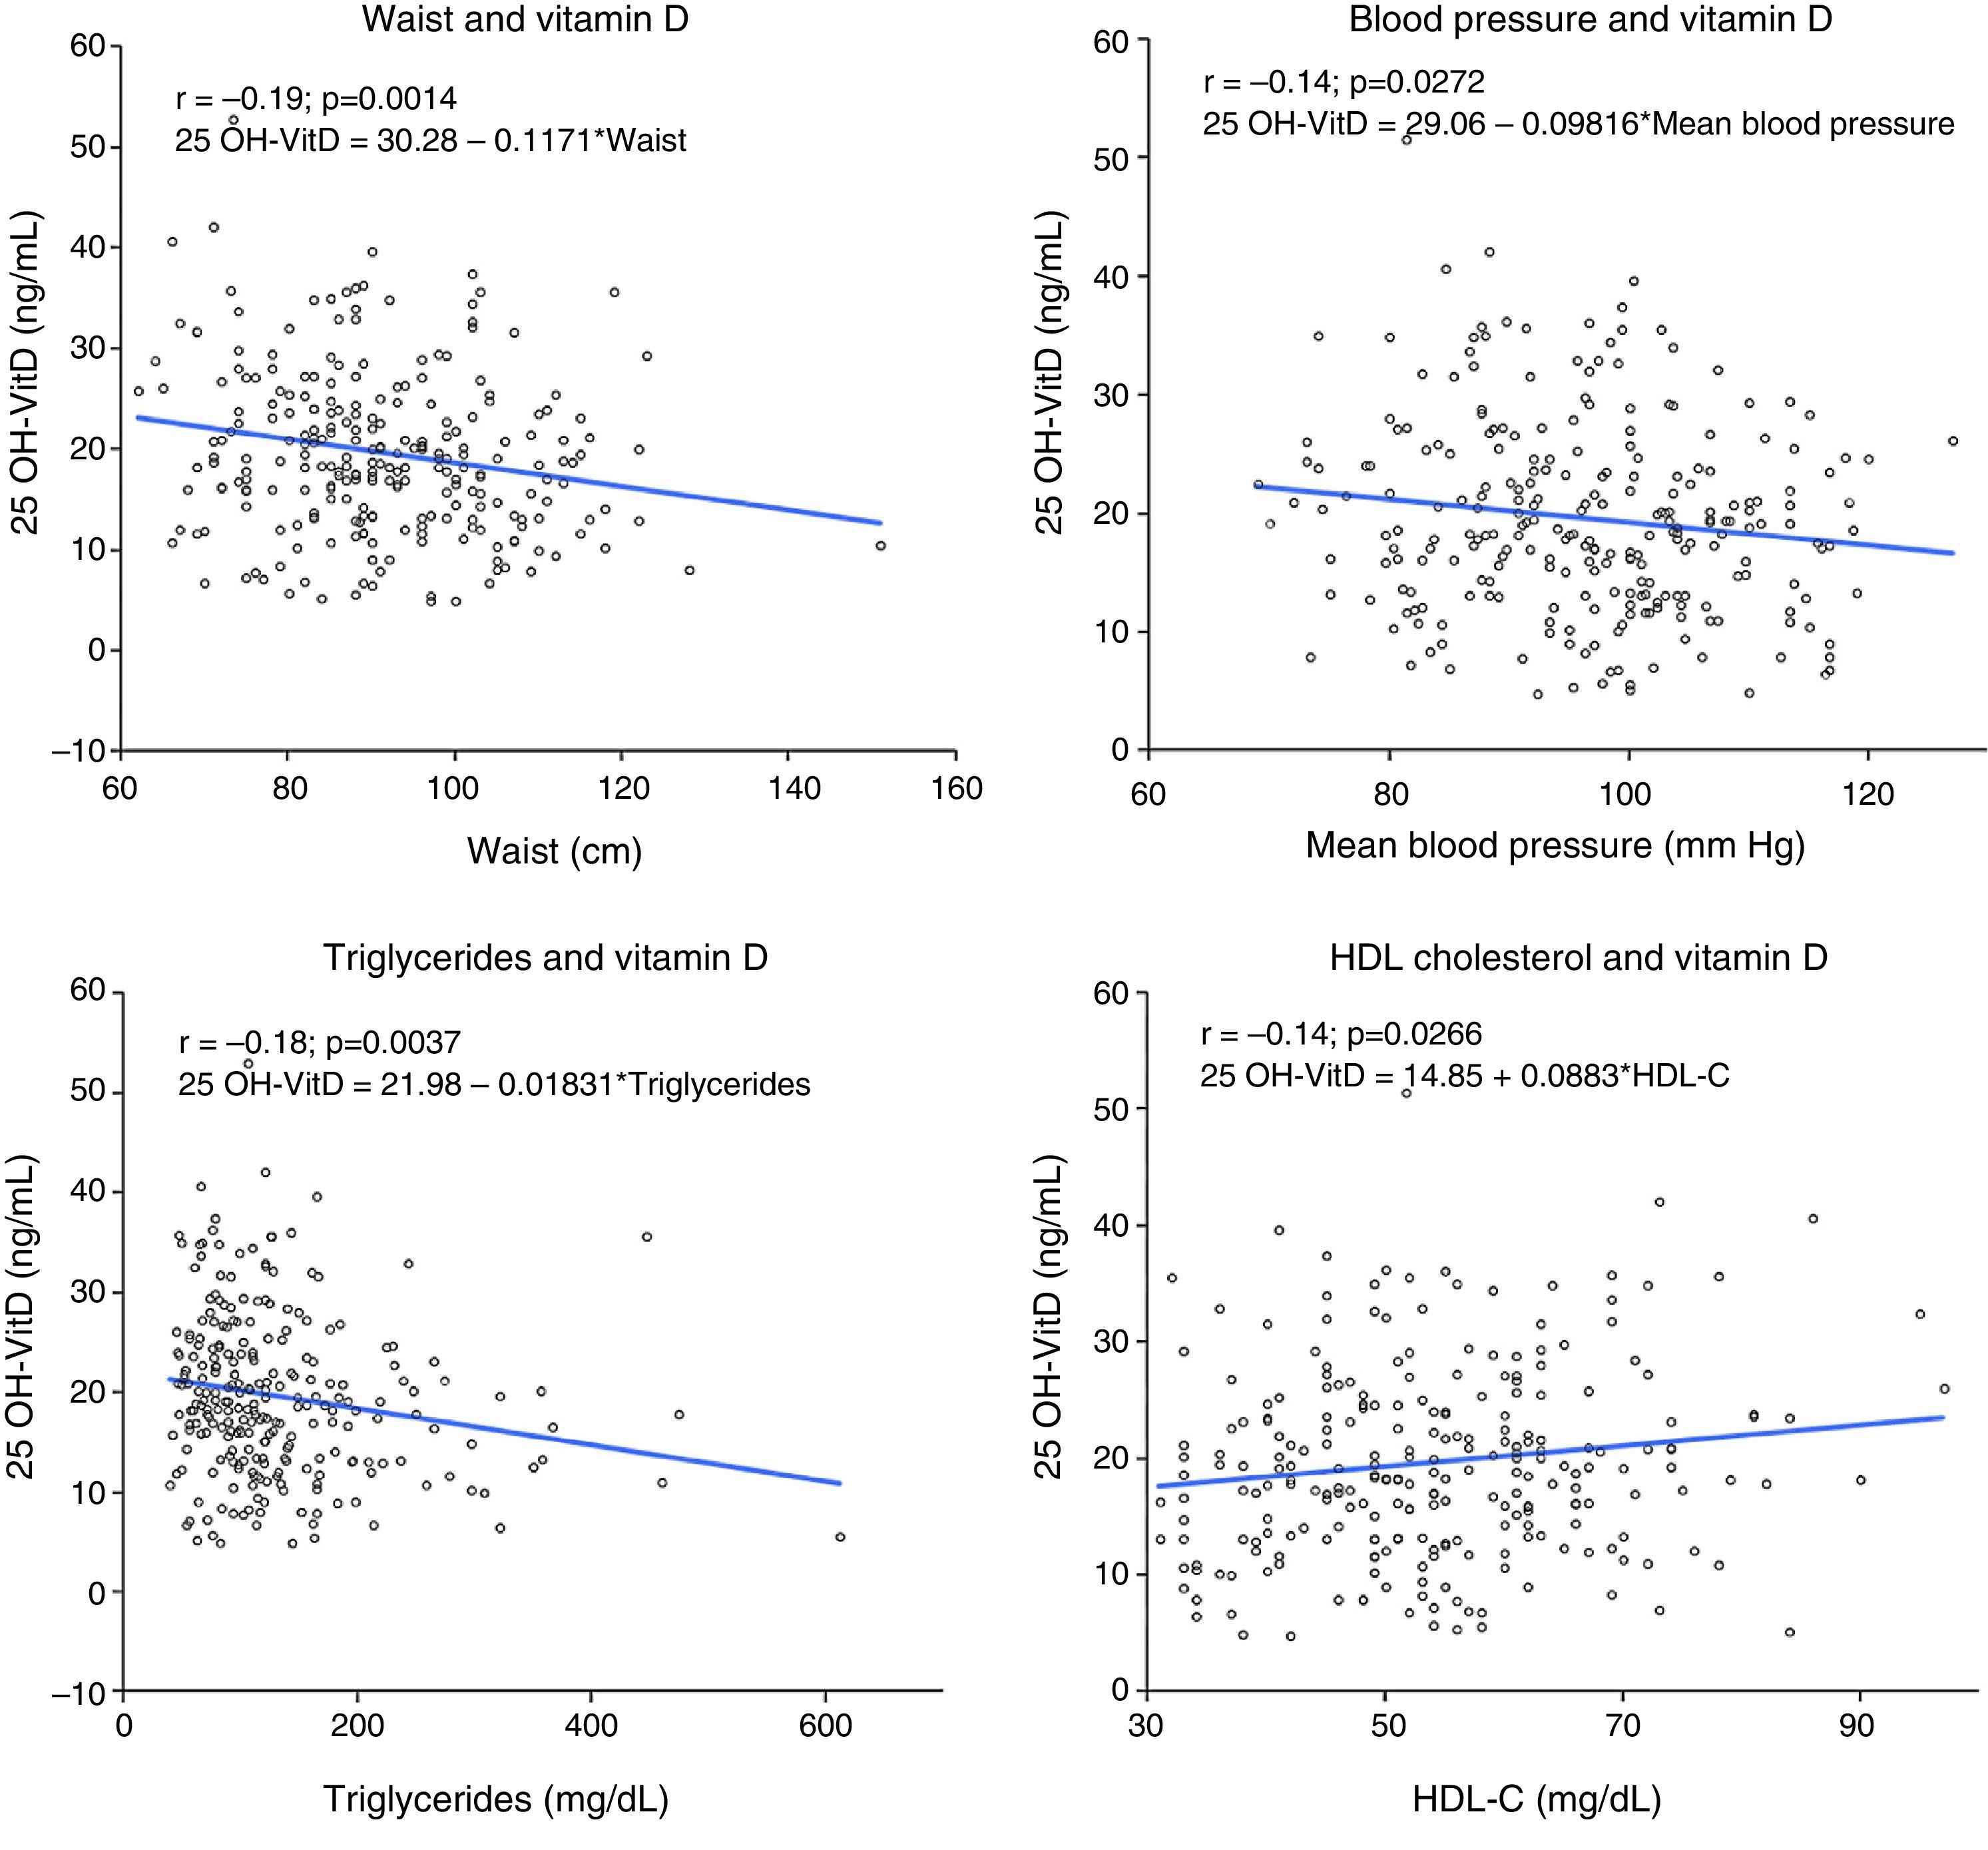
A negative correlation (r=0.14–0.2) was seen between 25 OH-VitD levels and between waist circumference, blood pressure levels, and triglyceride levels, while the correlation was positive (r=0.14) with HDL-C level (Fig. 3). No significant association was found between HbA1c and insulin resistance estimated by HOMA and 25 OH-VitD levels.
 between 25 OH-VitD and waist (A), blood pressure (B), triglycerides (C), and HDL-C (D).")
Correlation and linear regression analysis between 25 OH-VitD levels and various variables associated with MS. Linear regression plots showing line, regression equation, and linear Pearson's correlation coefficient (r) between 25 OH-VitD and waist (A), blood pressure (B), triglycerides (C), and HDL-C (D).
MS is a clinical condition associated with a significant cardiovascular risk, and is highly prevalent, as shown by our results. Little is known about the causes of MS, except for the fact that its main triggering factor is obesity, which is an increasing epidemic.17 A potential contribution of vitamin D deficiency to MS occurrence has become a feasible working hypothesis.9 This study shows the existence of an association between the presence of vitamin D deficiency and MS, as well as its main components, in a group of subjects from the town of Alcalá de Henares.
MS prevalence in our study was 36.1%. These results show a slightly greater prevalence than that reported in the DARIOS study,18 a review of 11 studies published in Spain, which showed a 31% prevalence of vitamin D deficiency (32–29% in the overall Spanish population and 29–23% in the Community of Madrid in males and females respectively). These differences may be due to the distribution by age groups of the population in the DARIOS study (35–74 years), which was markedly different from the distribution in this study, which included a population up to 83 years old. The recently reported ENRICA study,19 also conducted in Spain, found a MS prevalence of 22.7%, 26% in males and 19.4% in females, which was also lower than the one found in our study despite having a similar distribution of the population. These differences found in MS prevalence despite the use of the same harmonized IDF/AHA/NHLBI criteria3 may partly be due to the place where subject selection was done. The subjects in our study came from a healthcare center, and although many of them consulted for minor illnesses or were accompanying the attendees, there was a greater concentration of subjects with chronic conditions, which may partly explain the greater prevalence detected. However, when these results are compared to the prevalence of MS detected in the US (34.3%)20 or in the adult population in Canada (43%),9 these differences are reduced despite the greater prevalence of central obesity in their populations. Thus, in the Canadian study 75% of the subjects with MS had central obesity,9 a higher proportion than the 65% found in our study. Central obesity was also the most prevalent criterion in the ENRICA study in both males (76%) and females (92%). This confirms that central obesity is the most significant and prevalent MS criterion, and may play an essential role in the etiopathogenesis of MS.
The study results show that MS is more prevalent in males as compared to females, and is increasingly common with age. These data agree with those reported in most studies on the subject.9,18,19
The prevalence of vitamin D deficiency in our population was also noticeable, 56.1%, higher than that reported in studies conducted in Spain, in which prevalence rates of vitamin D insufficiency (25 OH-VitD<30ng/mL) up to 90% have been found. Thus, González-Molero et al.21 detected in a similarly distributed population, and using the same vitamin D deficiency criteria, a 34% prevalence (31% in Northern Spain and 35% in Southern Spain), lower than the 43% prevalence of vitamin D deficiency found by the LURIC study in subjects with MS.22 In this study, 92% of subjects had vitamin D insufficiency.22
Aspects such as the time when the sample was taken are important for interpreting the results. Seasonal variations in 25 OH-VitD levels have been widely documented.21 In this regard, our study started at the end of winter and lasted throughout spring, which may have influenced the finding of this greater prevalence of vitamin D deficiency as compared to other studies conducted during months with greater solar radiation or using longer selection periods.21 This study showed a positive correlation between 25 OH-VitD levels and the time of sampling. Greater levels were found as solar radiation increased, which agrees with the results published. Other aspects, such as an increased use of sun protective creams, decreased outdoor physical activity, and a low intake of food containing vitamin D may have contributed to the greater prevalence of vitamin D deficiency. In addition, the influence of the immunoassay used to measure 25 OH-VitD should not be forgotten. The methods which detect the greatest prevalence of vitamin D are those used by Siemens and DiaSorin,23,24 and the latter company's was the one used in our study.
The main finding of this study was the identification of a greater prevalence of MS among subjects with vitamin D deficiency, in agreement with the results reported in the González-Molero et al. study.25 This association persisted after the inclusion in the multivariate analysis of different variables such as age, sex, and the BMI. Lower 25 OH-VitD levels were also shown to be associated with greater MS prevalence. The correlation detected between 25 OH-VitD levels and the different components of MS–waist, mean blood pressure, triglycerides, and HDL-C–, although weak (r coefficient in the range of 0.2), was similar overall to the results reported by most published studies,24 suggesting an association between vitamin D levels and the main clinical variables related to insulin resistance. However, no association was shown between HbA1c and insulin resistance estimated by HOMA, despite the fact that this factor is considered one of the precursors of MS. This may be due to the low prevalence of diabetic patients in our sample and to the fact that a majority of subjects, 75%, had HOMA indices <2.5, which is considered normal, although this same result was obtained in the LURIC study22 on a much more representative sample.
While our study could not establish a causal relationship between vitamin D deficiency and MS because of its cross-sectional nature, the association found suggested that common etiopathogenetic mechanisms exist in both situations. Thus, vitamin D deficiency may lead to or occur as a consequence of MS. The various prospective studies showing an association of vitamin D deficiency with an increased risk of MS would appear to favor the first hypothesis.9 However, the second hypothesis, that the vitamin D deficiency detected is the consequence of MS, is more plausible because: (a) interventional studies with vitamin D supplementation showed no improvement in insulin resistance, the main mediator of MS,26,27 nor decreases in the number of new cases of DM28; (b) some prospective studies did not show that vitamin D deficiency is a risk factor for the occurrence of MS25; and (c) the concentration of vitamin D binding protein, which is the main determinant of 25 OH-VitD levels obtained with the methods used in standard practice, is inversely related to insulin resistance of the subject,29 which suggests that a low 25 OH-VitD level is the consequence of insulin resistance, rather than its cause.
The study limitations included: (a) its cross-sectional design, which makes it impossible to know the nature of the associations detected between vitamin D deficiency and MS and its components; (b) the difficulties in standard practice of assessing vitamin D status in subjects because the methods used to quantify 25 OH-VitD levels only assess total vitamin D, but not free or bioavailable vitamin D, which makes it difficult to know exactly the actual vitamin D status of the subject30; and (c) the fact that because subjects were selected from a population attending a healthcare center either as patients or as people accompanying patients, rather than from a random sample of the census population, prevalence rates of both vitamin D deficiency and MS are likely to have been overestimated. It should be noted, however, that a quite homogeneous group was enrolled, with no differences in clinical and laboratory profile between attendees at the center and those accompanying them.
In conclusion, this study detected a high prevalence of vitamin D deficiency and MS in the population who attended a healthcare center in the town of Alcalá de Henares. An association has also been shown between both clinical conditions, with MS being more common among subjects with vitamin D deficiency. Long-term prospective and interventional studies are needed in order to assess a potential causal relation between both conditions, and to ascertain whether the treatment of vitamin D deficiency could play a role in the prevention and treatment of MS.
Conflicts of interestThe authors state that they have no conflicts of interest.
To all professionals at the Luis Vives healthcare center, physicians, nurses, and clerical staff, who made study subject selection possible thanks to their unselfish collaboration.
The following is supplementary data to this article:
Please cite this article as: Gradillas-García A, Álvarez J, Rubio JA, de Abajo FJ. Relación entre el déficit de vitamina D y el síndrome metabólico en población adulta de la Comunidad de Madrid. Endocrinol Nutr. 2015;62:180–187.