


The main objective was to assess resource use and costs of starting treatment with insulin or injectable GLP-1 receptor analogs (GLP-1 RAs) in a Spanish population of patients with type 2 diabetes mellitus. Treatment adherence and persistence were also determined for both treatment groups.
Patients and methodsA retrospective, non-interventional, observational study was conducted. Patients aged ≥20 years who started treatment with insulin or GLP-1 RAs in the 2010–2012 period were recruited. Use of healthcare resources was estimated to evaluate healthcare costs in these two groups of patients (medical visits, hospital stay, emergency visits, diagnostic or treatment requests, medication). Clinical information including body mass index (BMI, kg/m2), metabolic control (HbA1c), adherence, persistence, and complications hypoglycemia, and cardiovascular events (CVE) was collected. The follow-up period was 12 months. Only direct healthcare costs were considered.
ResultsA total of 1301 patients with a mean age of 67.6 years (51.6% males) were recruited. Of these, 71.9% and 28.1% were on treatment with insulin and GLP-1 RA respectively. After one year of follow-up, patients treated with GLP-1 RAs were found less visits to primary care (8 vs. 11; p<0.001) and specialized care (1.0 vs. 1.8; p<0.001), hospital stays (0.3 vs. 0.7; p=0.030) and less visits to the emergency room (0.8 vs. 1.6; p<0.001). Patients treated with GLP-1 showed greater adherence (88.1% vs. 82.7%; p<0.001) and persistence (62.0% vs. 55.9%; p=0.046), and had less hypoglycemia episodes (13.4% vs. 18.7%; p=0.022), with similar metabolic control (HbA1c: 7.2% vs. 7.4%; p=0.049), BMI (29.1 vs. 30.9kg/m2), and CVE rate (9.1% vs. 11.5%; p=0.330) respectively. The mean corrected direct healthcare cost per patient was €1787 vs. €2005 (p=0.046.)
ConclusionsPatients treated with GLP-1 RAs caused lower direct healthcare costs for the National Health System than patients treated with insulin. The results may be explained by greater treatment adherence and lower hypoglycemia rates in patients treated with GLP-1 RAs. Additional studies are needed to confirm these possibilities.
El objetivo principal fue evaluar el uso de recursos y costes de los pacientes con diabetes mellitus tipo 2 que inician tratamiento con insulina o análogos del receptor de GLP-1 (AR GLP-1) inyectables en un ámbito poblacional español. Por otro lado, se determinó la adherencia y persistencia al tratamiento en ambos grupos de tratamiento.
Pacientes y métodosDiseño observacional, no-intervencionista, de carácter retrospectivo. Se incluyeron pacientes ≥20 años que iniciaron tratamiento con insulina o AR GLP-1 durante 2010-2012. Se determinó el consumo de recursos sanitarios relacionados con la actividad asistencial (visitas médicas, días de hospitalización, visitas a urgencias, solicitudes diagnósticas o terapéuticas, medicación) para evaluar el coste sanitario en estos 2 grupos de pacientes. Se recogió información clínica como índice de masa corporal (kg/m2) control metabólico (HbA1c), adherencia, persistencia y complicaciones (hipoglucemias y eventos cardiovasculares). El seguimiento se realizó durante 12 meses. Solo se tuvo en cuenta los costes sanitarios directos.
ResultadosSe reclutaron 1.301 pacientes, con una edad media de 67,6 años, el 51,6% varones. El 71,9% en tratamiento con insulina y el 28,1% con AR GLP-1. Al año de seguimiento los pacientes tratados con AR GLP-1 tuvieron menos consultas a atención primaria (8 vs 11; p<0,001), a especializada (1,0 vs 1,8; p<0,001), hospitalizaciones (0,3 vs 0,7; p=0,030) y visitas a urgencias (0,8 vs 1,6; p<0,001). Los pacientes tratados con GLP-1 mostraron una mayor adherencia (88,1% vs 82,7%; p<0,001), persistencia (62,0% vs 55,9%; p=0,046) y menor proporción de hipoglucemias (13,4% vs 18,7%; p=0,022) con similar control metabólico (HbA1c: 7,2% vs 7,4%; p=0,049), índice de masa corporal (29,1 vs 30,9kg/m2) y tasa de eventos cardiovasculares (9,1% vs 11,5%; p=0,330), respectivamente. El promedio/unitario de los costes sanitarios directos corregidos fue de 1.787€ vs 2.005€; p=0,046.
ConclusionesLos pacientes en tratamiento con AR GLP-1 ocasionaron menores costes sanitarios directos para el Sistema Nacional de Salud que los pacientes en tratamiento con insulinas. Los resultados obtenidos podrían explicarse por una mayor adherencia al tratamiento y menores tasas de hipoglucemias en los pacientes tratados con AR GLP-1. Se necesitan más estudios para poder confirmar estas posibles razones.
Type 2 diabetes mellitus (T2DM) is one of the health problems with greatest social and healthcare impact in Spain. Incidence of T2DM is expected to increase in the coming decades, and it should therefore be considered as a public health problem.1 The estimated prevalence in the population is approximately 13.8%, with rates varying depending on the different studies and methods used for diagnosis, but may be up to 20% in subjects over 75 years of age.2,3
As regards management, if metabolic goals are not achieved after 3–6 months with non-drug treatment, drug therapy should be started.1,4,5 A number of drugs are currently available to treat T2DM. The vast majority of guidelines recommend use of metformin associated to lifestyle changes (diet, exercise) as first treatment step. When no adequate blood glucose control is achieved, there are several alternatives as second treatment step: sulfonylureas, glinides, thiazolidinediones, disaccharidase inhibitors, dipeptidylpeptidase-4 inhibitors, inhibitors of sodium-glucose co-transporter type 2, GLP-1 receptor agonists and, finally, insulin therapy. According to guidelines, GLP-1 receptor agonists are recommended in patients with body mass index (BMI)>30 because of the weight loss benefits of this drug class.5
Some estimates report annual healthcare costs of diabetes in Spain of €5809million in 2013, or 8.2% of total public health expenses in Spain6. Studies evaluating the healthcare costs associated to T2DM from the perspective of the Spanish healthcare system have found mean annual costs per patient ranging from €1108 and €6268.6–12
Although many scientific reports published on the disease, few data are available on resource utilization and costs in patients with T2DM who start treatment with injectable drugs (insulin or GLP-1 RAs) in standard clinical practice. The study objective was to assess resource utilization and healthcare costs, as well as treatment adherence and persistence, in patients with T2DM who start insulin therapy as compared to GLP-1 receptor agonists in a Spanish population.
Patients and methodsStudy design and populationA multicenter observational, retrospective, longitudinal study was conducted based on a review of computerized clinical histories of patients on outpatient and hospital monitoring. The study population consisted of patients who attended six primary care centers managed by Badalona Serveis Assistencials S.A. and Hospital Municipal in Badalona (a hospital with approximately 140 beds). The study protocol was approved by the ethics committee of Hospital Germans Trias i Pujol.
Inclusion and exclusion criteriaPatients who attended for care were recruited into the study if the following criteria were met: (a) age≥20 years; (b) starting drug treatment with insulin or GLP-1 RAs during 2010–2012; (c) diagnosed with T2DM at least 12 months before study start; (d) regularly following the cardiovascular protocol/risk guide established at the centers; (e) included in the long-term prescription scheme (with verified registry of daily dose, time interval, and duration of each treatment administered); (f) regular patient follow-up could be guaranteed. Patients moved to other centers, died, or lost to follow-up were excluded. Patients treated with insulin and GLP-1 RAs combined (simultaneously) were also excluded.
Study groups and sample size estimationResource utilization and costs were compared between two groups of patients: (a) patients treated with insulin, and (b) patients treated with CLPG-1 RAs (at the time of the study, only exenatide daily and liraglutide were marketed). Patients were followed up for 12 months. Sample size, estimated based on an expected 8% prevalence of T2DM, assuming a 5% random error and a precision less than 2%, was a minimum of 350 patients by study group. Statistical power for the model was 80%. However, all records of patients available in the databases were included.
Diagnosis of T2DM and microvascular complicationsT2DM was diagnosed based on component 7 of diseases and health problems13 (T90) of the International Classification of Primary Care (ICPC-2) and coding of hospital discharge and emergencies according to the International Classification of Diseases, 9th revision, clinical modification (ICD-9-CM). Information on microvascular complications and impaired glomerular filtration was also collected from these diagnostic classifications or internal records.
Clinical and demographic variablesThe main demographic variables collected were age, sex, and time since T2DM onset, as well as the main comorbidities. As summary variable of general comorbidity, the following were used for each patient: (a) Charlson comorbidity index14 as an approximation to patient severity that assesses the 10-year life expectancy; and (b) the individual casuistry index, derived from the Adjusted Clinical Groups (ACG), a system classifying patients by iso-resource consumption.15 The Adjusted Clinical Groups software provides resource utilization bands (RUBs), so that each patient may be assigned, based on his/her general morbidity, to one of five mutually excluding categories (1: healthy or very low morbidity; 2: low morbidity; 3: moderate morbidity; 4: high morbidity; and 5: very high morbidity).
Clinical variables collected included glycosylated hemoglobin (HbA1c), BMI, and disease complications. During the follow-up period (12 months), new cases of hypoglycemia, cardiovascular disease (CVD), or established renal failure were recorded. Records were taken from specialized care discharge reports and/or from ICPC-2.13
Resource utilization and cost modelDirect healthcare costs were defined as those related to care activities (medical visits, hospitalization days, visits to emergency rooms, requests for diagnosis or treatment, medication) performed by healthcare professionals. Cost was given as mean cost by patient (unit cost). The different rates were taken from the analytical accounts, except for medication and days of sick leave. Prescriptions were quantified based on retail price by pack at the time of prescription. The cost of test strips for measuring capillary glucose values was included. Calculation of non-healthcare direct costs was not considered in this study.
Medication administered, treatment adherence and persistenceAllocation of a patient to a specific treatment strategy was based on standard clinical practice (medical judgment). Information on antidiabetic drugs administered to study patients was collected, according to physician recommendations, from pharmaceutical dispensing (prescriptions filled at retail pharmacies). Drugs prescribed and their administration intervals during the follow-up period were collected. Adherence was defined according to the criteria of the International Society of Pharmacoeconomics and Outcomes Research, and was calculated based on the medication possession ratio (MPR).16 MPR was assessed from the first to the last prescription, and represents the number of days of medication supplied divided by the number of days of treatment (from the index date). Treatment persistence was defined as time, measured in months, without discontinuation of initial treatment or with no change to another medication at least 60 days after initial prescription. Treatment persistence rate was collected at 12 months of follow-up. Persistence was also quantified 30 days after baseline prescription.
Statistical analysisTo describe the characteristics of study population, a descriptive univariate statistical analysis was performed with values of the mean, standard deviation, and 95% confidence intervals (CIs). Normal distribution of variables was verified using a Kolmogorov–Smirnov test, while median treatment persistence was determined using a Kaplan–Meier survival analysis. In the bivariate analysis, ANOVA, a Chi-square test, Pearson's linear correlation, and means comparison for paired groups were used to assess relationship between variables. A Cox proportional hazard analysis was performed to estimate median treatment persistence (adjusted for covariates: sex, age, RUBs, Charlson index, and time since diagnosis). Cost comparisons between the treatment groups were done as recommended by Thompson and Barber17 using analysis of covariance (procedure: estimation of marginal means; Bonferroni adjustment). In addition to the above mentioned covariates, the model included persistence and MPR. A multiple linear regression model was also prepared to measure the variables associated to healthcare cost (using the same covariates as listed above). SPSSWIN version 17 software was used, and values of p<0.05 were considered statistically significant.
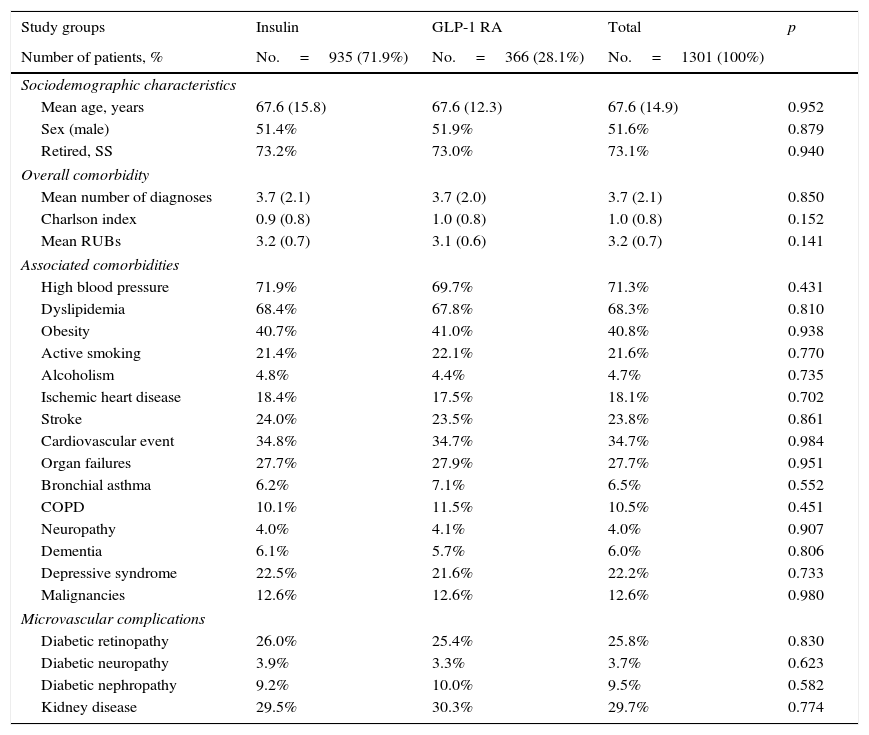
ResultsOf an initial population of 93,505 subjects≥20 years, 84,155 patients were seen at a healthcare center during the 2010–2012 period. Of these, 6817 subjects were diagnosed with T2DM (prevalence: 8.1%; 95% CI: 7.6%–8.5%). Finally, 1301 patients who met the inclusion/exclusion criteria and could be followed up throughout the study period were analyzed. Table 1 shows the baseline characteristics of the study sample as a function of the start of treatment with insulin or GLP-1 RAs. Mean age was 67.6 years, 51.6% were males, and patient comorbidity was moderate (RUB=3.2 points). Overall, high blood pressure (71.3%), dyslipidemia (68.2%), and obesity (40.8%) were the most common comorbidities. Among the 1301 subjects who started the study treatments, 935 (71.9%) were treated with insulin, and 366 (28.1%) with GLP-1 RAs. Of patients who started insulin therapy, 29.9% received NPH, 61.1% long-acting analogs (glargine or detemir), and 9.0% other types, while GLP-1 RAs used were exenatide daily (54.4%) and liraglutide (45.6%).
Baseline characteristics of the study population.
| Study groups | Insulin | GLP-1 RA | Total | p |
|---|---|---|---|---|
| Number of patients, % | No.=935 (71.9%) | No.=366 (28.1%) | No.=1301 (100%) | |
| Sociodemographic characteristics | ||||
| Mean age, years | 67.6 (15.8) | 67.6 (12.3) | 67.6 (14.9) | 0.952 |
| Sex (male) | 51.4% | 51.9% | 51.6% | 0.879 |
| Retired, SS | 73.2% | 73.0% | 73.1% | 0.940 |
| Overall comorbidity | ||||
| Mean number of diagnoses | 3.7 (2.1) | 3.7 (2.0) | 3.7 (2.1) | 0.850 |
| Charlson index | 0.9 (0.8) | 1.0 (0.8) | 1.0 (0.8) | 0.152 |
| Mean RUBs | 3.2 (0.7) | 3.1 (0.6) | 3.2 (0.7) | 0.141 |
| Associated comorbidities | ||||
| High blood pressure | 71.9% | 69.7% | 71.3% | 0.431 |
| Dyslipidemia | 68.4% | 67.8% | 68.3% | 0.810 |
| Obesity | 40.7% | 41.0% | 40.8% | 0.938 |
| Active smoking | 21.4% | 22.1% | 21.6% | 0.770 |
| Alcoholism | 4.8% | 4.4% | 4.7% | 0.735 |
| Ischemic heart disease | 18.4% | 17.5% | 18.1% | 0.702 |
| Stroke | 24.0% | 23.5% | 23.8% | 0.861 |
| Cardiovascular event | 34.8% | 34.7% | 34.7% | 0.984 |
| Organ failures | 27.7% | 27.9% | 27.7% | 0.951 |
| Bronchial asthma | 6.2% | 7.1% | 6.5% | 0.552 |
| COPD | 10.1% | 11.5% | 10.5% | 0.451 |
| Neuropathy | 4.0% | 4.1% | 4.0% | 0.907 |
| Dementia | 6.1% | 5.7% | 6.0% | 0.806 |
| Depressive syndrome | 22.5% | 21.6% | 22.2% | 0.733 |
| Malignancies | 12.6% | 12.6% | 12.6% | 0.980 |
| Microvascular complications | ||||
| Diabetic retinopathy | 26.0% | 25.4% | 25.8% | 0.830 |
| Diabetic neuropathy | 3.9% | 3.3% | 3.7% | 0.623 |
| Diabetic nephropathy | 9.2% | 10.0% | 9.5% | 0.582 |
| Kidney disease | 29.5% | 30.3% | 29.7% | 0.774 |
Values are percentages or mean. Comorbidities, complications, and kidney diseases were collected from discharge reports of specialists and from ICPC-2.
GLP-1 RAs, glucagon-like peptide type 1 receptor agonists; RUBs, resource utilization bands; SD, standard deviation; COPD, chronic obstructive pulmonary disease; p, statistical significance; SS, social security.
Mean time since diagnosis was 10.4 years in both groups. Oral antidiabetic drugs, mainly metformin, were taken by 93.8% of patients; 55.6% were taking two drugs. No statistically significant differences were found in sociodemographic variables between the two study groups analyzed (Table 1).
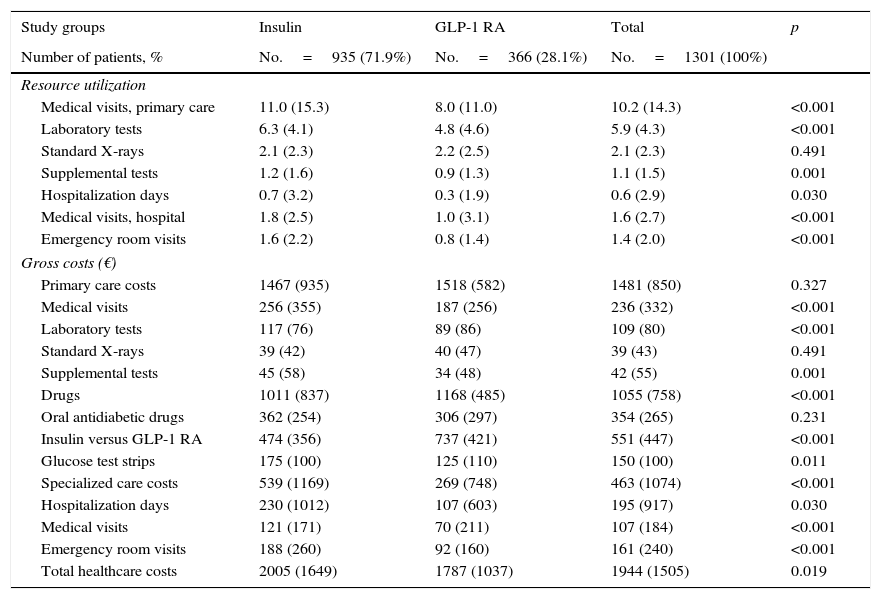
Table 2 details use of resources and direct healthcare costs related to diabetes. In the follow-up period, patients treated with GLP-1 RAs had on average, as compared to those on insulin therapy, less primary care visits (8.0 versus 11.0; p<0.001), hospitalization days (0.3 versus 0.7; p<0.030), specialized care visits (1.0 versus 1.8; p<0.001) and emergency room visits (0.8 versus 1.6; p<0.001). Of direct healthcare costs, 66.3% were primary care costs and 20.7% specialized care costs. Although cost of medication was higher for GLP-1 RAs (€1168 versus €1011; p<0.001), mean total healthcare cost per patient was lower in subjects treated with GLP-1 RAs as compared to insulin (€1787 vs. €2005; p<0.021). Differences persisted in the adjusted model (analysis of covariance), with values of €1785 (95% CI: €1635–€1934) versus €2008 (95% CI: €1914–€2101); p=0.013 (difference: −€223 per patient) respectively.
Resource utilization and costs during follow-up.
| Study groups | Insulin | GLP-1 RA | Total | p |
|---|---|---|---|---|
| Number of patients, % | No.=935 (71.9%) | No.=366 (28.1%) | No.=1301 (100%) | |
| Resource utilization | ||||
| Medical visits, primary care | 11.0 (15.3) | 8.0 (11.0) | 10.2 (14.3) | <0.001 |
| Laboratory tests | 6.3 (4.1) | 4.8 (4.6) | 5.9 (4.3) | <0.001 |
| Standard X-rays | 2.1 (2.3) | 2.2 (2.5) | 2.1 (2.3) | 0.491 |
| Supplemental tests | 1.2 (1.6) | 0.9 (1.3) | 1.1 (1.5) | 0.001 |
| Hospitalization days | 0.7 (3.2) | 0.3 (1.9) | 0.6 (2.9) | 0.030 |
| Medical visits, hospital | 1.8 (2.5) | 1.0 (3.1) | 1.6 (2.7) | <0.001 |
| Emergency room visits | 1.6 (2.2) | 0.8 (1.4) | 1.4 (2.0) | <0.001 |
| Gross costs (€) | ||||
| Primary care costs | 1467 (935) | 1518 (582) | 1481 (850) | 0.327 |
| Medical visits | 256 (355) | 187 (256) | 236 (332) | <0.001 |
| Laboratory tests | 117 (76) | 89 (86) | 109 (80) | <0.001 |
| Standard X-rays | 39 (42) | 40 (47) | 39 (43) | 0.491 |
| Supplemental tests | 45 (58) | 34 (48) | 42 (55) | 0.001 |
| Drugs | 1011 (837) | 1168 (485) | 1055 (758) | <0.001 |
| Oral antidiabetic drugs | 362 (254) | 306 (297) | 354 (265) | 0.231 |
| Insulin versus GLP-1 RA | 474 (356) | 737 (421) | 551 (447) | <0.001 |
| Glucose test strips | 175 (100) | 125 (110) | 150 (100) | 0.011 |
| Specialized care costs | 539 (1169) | 269 (748) | 463 (1074) | <0.001 |
| Hospitalization days | 230 (1012) | 107 (603) | 195 (917) | 0.030 |
| Medical visits | 121 (171) | 70 (211) | 107 (184) | <0.001 |
| Emergency room visits | 188 (260) | 92 (160) | 161 (240) | <0.001 |
| Total healthcare costs | 2005 (1649) | 1787 (1037) | 1944 (1505) | 0.019 |
Values are means.
GLP-1 RA, glucagon-like type 1 peptide receptor agonists; SD, standard deviation; CI, confidence interval; p, statistical significance.
In the multiple linear regression model to determine the variables most affecting healthcare costs, these were found to be mainly related to the number of hypoglycemic episodes (β=0.328), treatment persistence (β=0.275), and comorbidity (β=0.149). The coefficient of determination of the model was 44.5%.
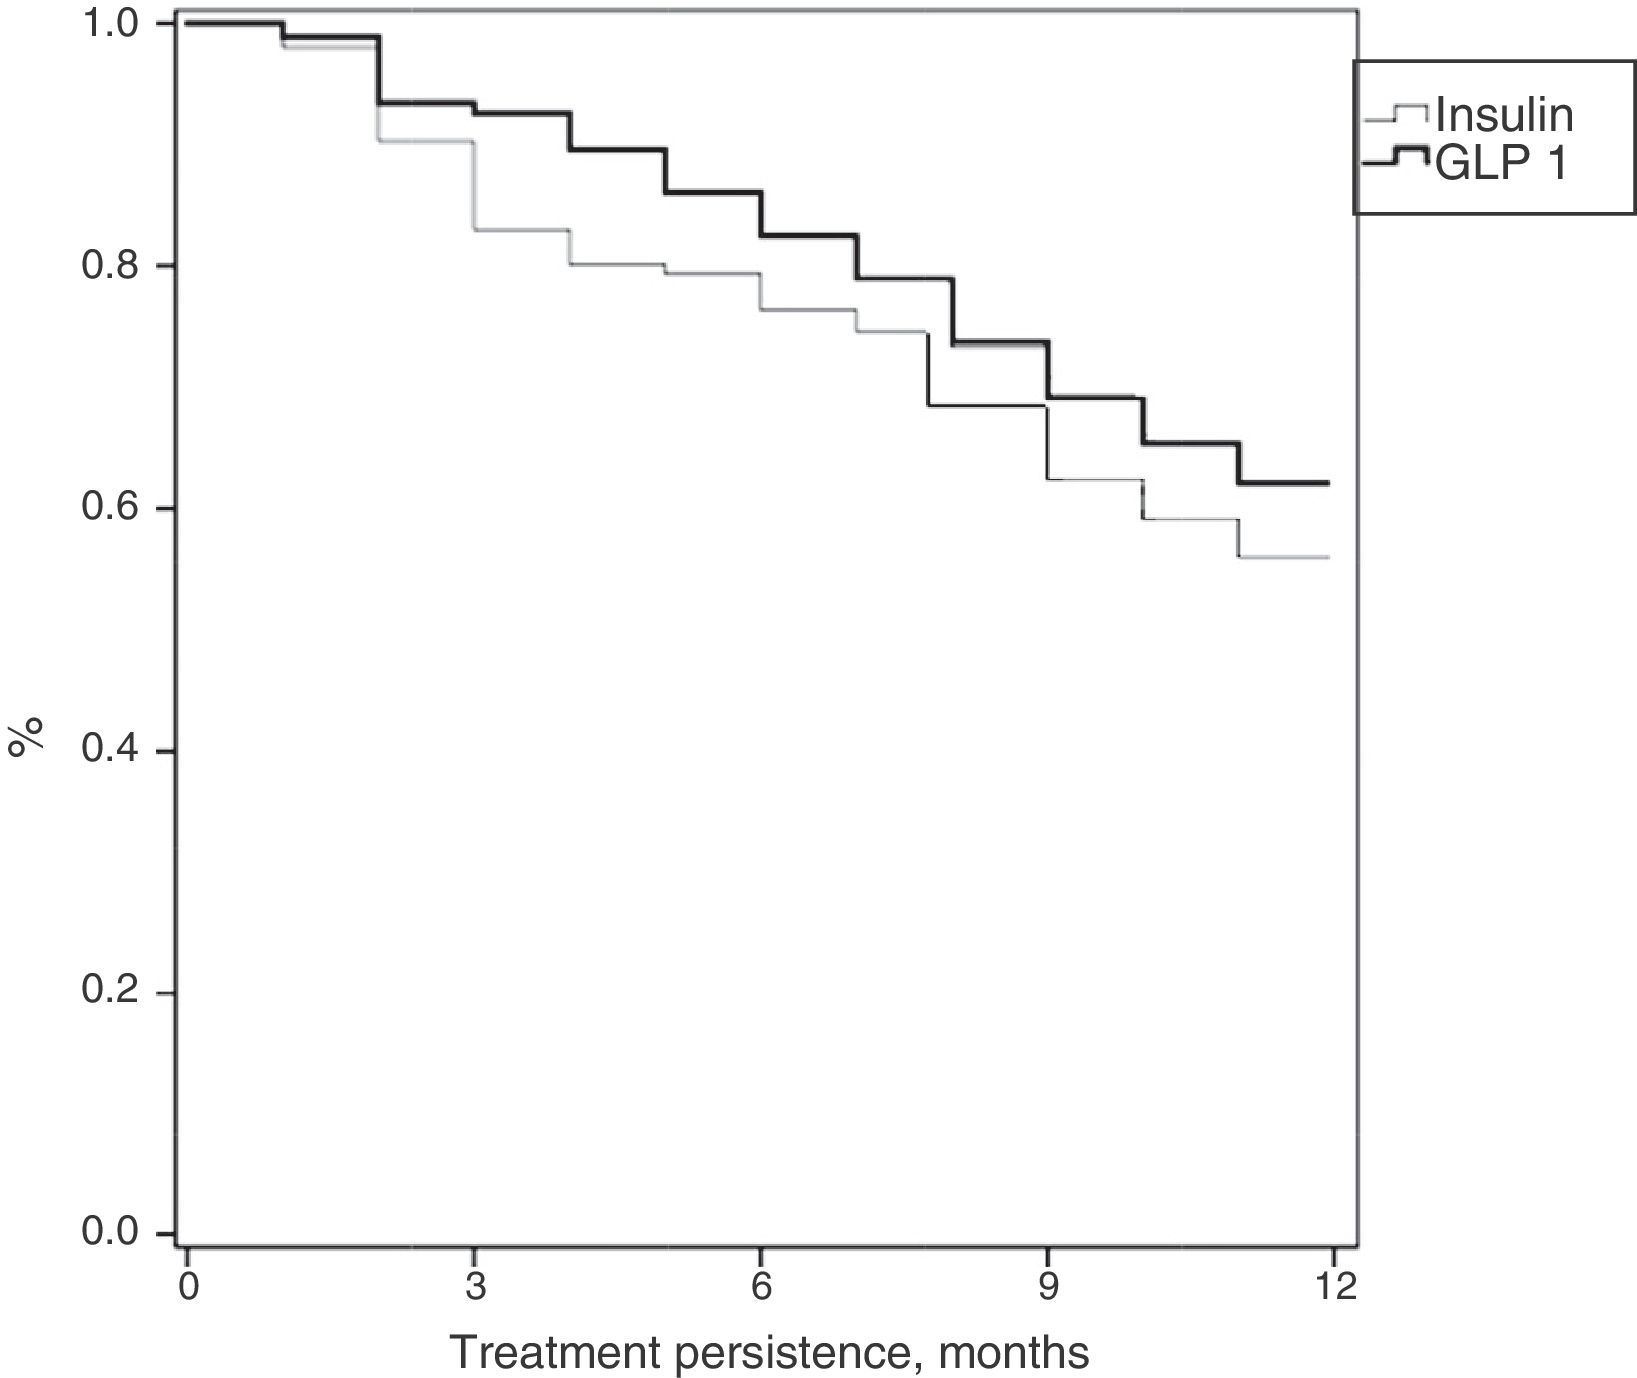
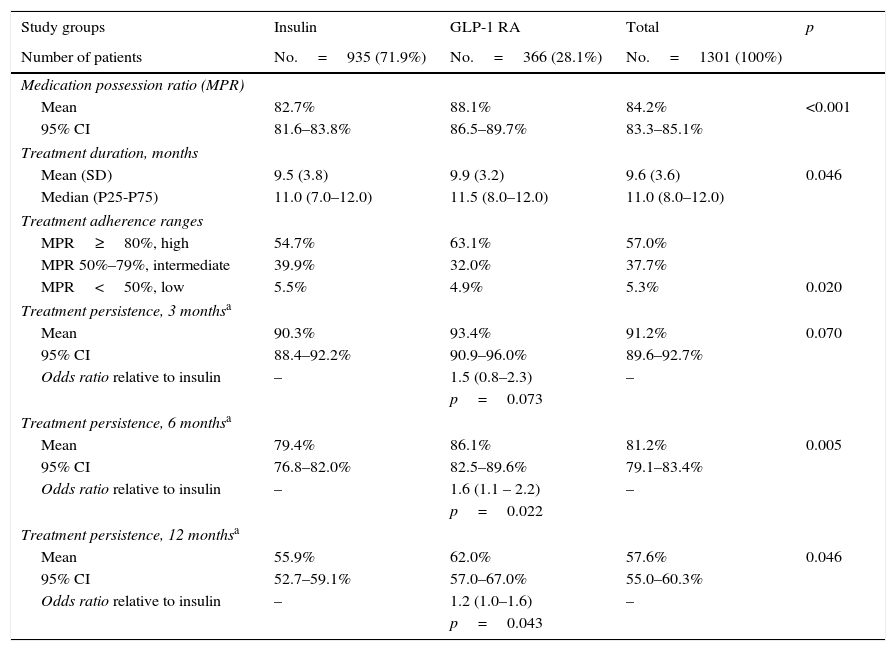
Table 3 shows treatment adherence and persistence. Patients treated with GLP-1 RAs showed greater treatment adherence (88.1% vs. 82.7%; p=0.001), mean treatment duration (9.9 vs. 9.5 months; p=0.046) and treatment persistence (620% vs. 55.9%; p=0.046). These differences in persistence remained six months after treatment start (86.1% vs. 79.4%; p=0.005). A Cox proportional hazard model (adjusted for covariates) was used to verify whether differences were due to the different characteristics of patient and the same result was found, i.e. differences in treatment persistence between patients treated with GLP-1 RAs and insulins continued at 6 and 12 months. Fig. 1 shows a comparison of the median treatment persistence with insulin or GLP-1 RA (Kaplan–Meier curve). In a persistence subanalysis performed 30 days after the initial prescription, differences persisted in both mean treatment duration (8.6 vs. 8.3 months; p=0.045) and persistence (57.2% vs. 51.0%; p=0.043).
Description of treatment adherence and persistence.
| Study groups | Insulin | GLP-1 RA | Total | p |
|---|---|---|---|---|
| Number of patients | No.=935 (71.9%) | No.=366 (28.1%) | No.=1301 (100%) | |
| Medication possession ratio (MPR) | ||||
| Mean | 82.7% | 88.1% | 84.2% | <0.001 |
| 95% CI | 81.6–83.8% | 86.5–89.7% | 83.3–85.1% | |
| Treatment duration, months | ||||
| Mean (SD) | 9.5 (3.8) | 9.9 (3.2) | 9.6 (3.6) | 0.046 |
| Median (P25-P75) | 11.0 (7.0–12.0) | 11.5 (8.0–12.0) | 11.0 (8.0–12.0) | |
| Treatment adherence ranges | ||||
| MPR≥80%, high | 54.7% | 63.1% | 57.0% | |
| MPR 50%–79%, intermediate | 39.9% | 32.0% | 37.7% | |
| MPR<50%, low | 5.5% | 4.9% | 5.3% | 0.020 |
| Treatment persistence, 3 monthsa | ||||
| Mean | 90.3% | 93.4% | 91.2% | 0.070 |
| 95% CI | 88.4–92.2% | 90.9–96.0% | 89.6–92.7% | |
| Odds ratio relative to insulin | – | 1.5 (0.8–2.3) | – | |
| p=0.073 | ||||
| Treatment persistence, 6 monthsa | ||||
| Mean | 79.4% | 86.1% | 81.2% | 0.005 |
| 95% CI | 76.8–82.0% | 82.5–89.6% | 79.1–83.4% | |
| Odds ratio relative to insulin | – | 1.6 (1.1 – 2.2) | – | |
| p=0.022 | ||||
| Treatment persistence, 12 monthsa | ||||
| Mean | 55.9% | 62.0% | 57.6% | 0.046 |
| 95% CI | 52.7–59.1% | 57.0–67.0% | 55.0–60.3% | |
| Odds ratio relative to insulin | – | 1.2 (1.0–1.6) | – | |
| p=0.043 | ||||
Values are percentages or mean. Treatment persistence was defined as time, measured in months, without discontinuation of initial treatment or with no change to another medication at least 60 days after initial prescription.
GLP-1 RAs, glucagon-like peptide type 1 receptor agonists; SD, standard deviation; HbA1c, glycosylated hemoglobin; CI, confidence interval; P, percentile; p, statistical significance; MPR, medication possession ratio.
. Kaplan–Meier curve: estimated median duration of initial treatment with insulin or GLP-1 RA. Group comparisons: log rank (Mantel–Cox) test: 9.541; p=0.003.")
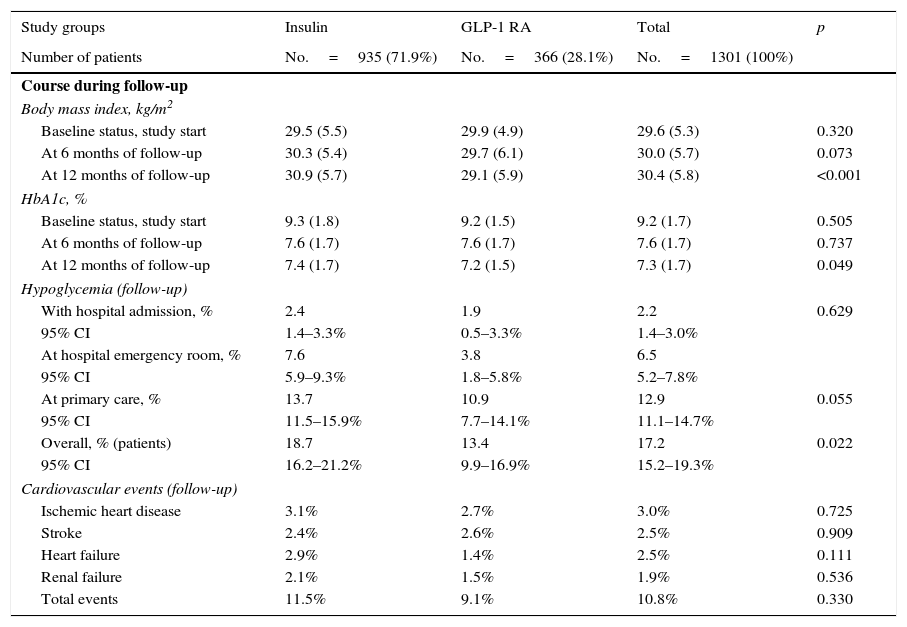
At treatment start, no significant differences were seen between patients treated with GLP-1 RAs as compared to insulin in BMI (29.9 vs. 29.5kg/m2; p=0.320) and HbA1c (9.2% vs. 9.3%; p=0.505), At 12 months of follow-up (baseline vs. final), BMI values were similar to those found at baseline in both groups (GLP-1 RAs: 29.9 vs. 29.1kg/m2; insulin: 29.5 vs. 30.9kg/m2; difference: −0.8; p<0.001), as was HbA1c reduction (GLP-1 RAs: 9.2 vs. 7.2%; insulin: 9.3 vs. 7.4%; difference: −2.0; p=0.048). Patients treated with GLP-1 RAs had greater BMI decreases and lower hypoglycemia rates (13.4% vs. 18.7%; p=0.022), while the proportion of cardiovascular events was similar (9.1% vs. 11.5%; p=0.330). These results are summarized in Table 4.
Clinical variables during follow-up (12 months).
| Study groups | Insulin | GLP-1 RA | Total | p |
|---|---|---|---|---|
| Number of patients | No.=935 (71.9%) | No.=366 (28.1%) | No.=1301 (100%) | |
| Course during follow-up | ||||
| Body mass index, kg/m2 | ||||
| Baseline status, study start | 29.5 (5.5) | 29.9 (4.9) | 29.6 (5.3) | 0.320 |
| At 6 months of follow-up | 30.3 (5.4) | 29.7 (6.1) | 30.0 (5.7) | 0.073 |
| At 12 months of follow-up | 30.9 (5.7) | 29.1 (5.9) | 30.4 (5.8) | <0.001 |
| HbA1c, % | ||||
| Baseline status, study start | 9.3 (1.8) | 9.2 (1.5) | 9.2 (1.7) | 0.505 |
| At 6 months of follow-up | 7.6 (1.7) | 7.6 (1.7) | 7.6 (1.7) | 0.737 |
| At 12 months of follow-up | 7.4 (1.7) | 7.2 (1.5) | 7.3 (1.7) | 0.049 |
| Hypoglycemia (follow-up) | ||||
| With hospital admission, % | 2.4 | 1.9 | 2.2 | 0.629 |
| 95% CI | 1.4–3.3% | 0.5–3.3% | 1.4–3.0% | |
| At hospital emergency room, % | 7.6 | 3.8 | 6.5 | |
| 95% CI | 5.9–9.3% | 1.8–5.8% | 5.2–7.8% | |
| At primary care, % | 13.7 | 10.9 | 12.9 | 0.055 |
| 95% CI | 11.5–15.9% | 7.7–14.1% | 11.1–14.7% | |
| Overall, % (patients) | 18.7 | 13.4 | 17.2 | 0.022 |
| 95% CI | 16.2–21.2% | 9.9–16.9% | 15.2–19.3% | |
| Cardiovascular events (follow-up) | ||||
| Ischemic heart disease | 3.1% | 2.7% | 3.0% | 0.725 |
| Stroke | 2.4% | 2.6% | 2.5% | 0.909 |
| Heart failure | 2.9% | 1.4% | 2.5% | 0.111 |
| Renal failure | 2.1% | 1.5% | 1.9% | 0.536 |
| Total events | 11.5% | 9.1% | 10.8% | 0.330 |
Values are percentages or mean. Renal failure defined as serum creatinine>133mmol/L in males and >124mmol/L in females, and proteinuria [>300mg/24h].
GLP-1 RA, glucagon-like type 1 peptide receptor agonists; SD, standard deviation; CI, confidence interval; p, statistical significance.
The above results show no great differences in this study in BMI or HbA1c reduction, nor in cardiovascular events despite the fact that their number was lower in patients treated with GLP-1 RAs. Significant differences were however seen in both persistence and number of hypoglycemic episodes, which may be the main components affecting healthcare costs in both treatment groups studied.
DiscussionThe study results demonstrate a decreased use of resources in primary and specialized care and less emergency room visits for hypoglycemia in patients treated with GLP-1 RAs as compared to insulin. This resulted in lower healthcare costs for the national health system. Few observational studies detailing use of these drugs in real conditions are available, which makes it difficult to compare results but should however be considered a strength of our study, which was a non-interventional study based on results in clinical practice and provides relevant information on the clinical and economic aspects of this type of patients.
Costs found in this study agree with those reported in a recent study where a review of Spanish studies on costs of T2DM showed total costs ranging from €1108 and €6268 and direct healthcare costs ranging from €687 and €3643.18 In addition, a 2013 study by Crespo et al.6 reported a direct healthcare cost of diabetes of €1798. This cost agrees with the results achieved in this study, where costs ranged from €1785 and €2005 for patients treated with GLP-1 RAs and insulin respectively. On the other hand, the INSTIGATE study,19 conducted in Spain on 188 patients, showed that the mean direct cost of care for diabetic patients increased after insulin therapy was started. Results of the present study support those of the INSTIGATE study, although comparisons of both studies are somewhat difficult because of the different methods used.
Taking into account the baseline characteristics of the population enrolled into this study, there are no differences between both groups in BMI and HbA1c values.
Some literature studies20,21 report that patients treated with GLP-1 receptor agonists have greater BMI and better diabetes control than patients treated with insulins. Differences between this study and the INITIATOR study20 may be explained by the fact that the latter was conducted in the United States, while our study recruited Spanish patients. Patient age could be another reason possibly explaining the differences seen. Patients recruited into this study were older, which would account for differences in BMI and for poorer blood glucose control at the start, because they possibly have longer disease duration and more marked pancreatic damage.
Our study results show that after one year of follow-up, patients treated with GLP-1 RAs had greater treatment adherence and persistence, with slight improvements in blood glucose and weight control and lower hypoglycemia rates as compared to patients treated with insulin. The reported studies reviewed suggest a low adherence to insulin therapy.22–24 Overall adherence ranges from 45% to 77% and depends on many factors: side effects, risk of weight increase, risk of hypoglycemia, cost of medication, complex treatments (as regards schemes or doses, or including multiple drugs), high HbA1c levels, young patients. It may even be associated to some diseases, to give some examples.16,24 Treatment non-adherence results in lower clinical effectiveness, with greater hospital admission and complication rates (resource utilization and healthcare costs). Some studies have related a 10% increase in MPR to an 8.6% decrease in healthcare costs.25 Our results agree with the literature reviewed.1,4,5 Our study data also show that patients treated with GLP-1 RAs and insulin have similar rates of cardiovascular events and renal failure. In this regard, various authors have shown that adequate blood glucose control, as shown by low HbA1c levels, results in a significant improvement in the incidence and course of vascular complications, a benefit that persists for years even if glucose control is impaired.8 Healthcare professionals, together with patients, should devise a custom-made treatment plan to achieve optimum treatment adherence and results.4
This study has the limitations inherent to retrospective studies, such as underreporting of the disease or potential variability of professionals and patients. It should be noted that this type of design is not free from bias (factors not considered, such as socioeconomic, cultural, or education levels; drug doses taken; treatment suitability; lack of differentiation of the different subgroups of oral antidiabetic drugs associated to GLP-1 RAs or insulin; or possible side effects, to give some examples), which should be minimized. The main study limitation is selection bias by the physician in charge when administering one or the other type of drug. Results should therefore be interpreted with caution. It should be noted, however, that this is a limitation inherent to studies in real clinical practice. Duration of treatment with the different types of oral antidiabetic drugs was not considered either because of the difficulty of its quantification during follow-up. On the other hand, there was no washout period before the start of injectable treatment to be able to directly relate healthcare resource utilization and costs to the treatment, but this is a common situation in retrospective studies. An additional study limitation refers to measurement of hypoglycemia, because only the episodes where patients required health care and this was documented were identified, which may have led to underreporting of these cases.
Further research should be conducted to confirm the results of this study. Moreover, successful care for patients with chronic diseases such as T2DM should be based on interventions by multidisciplinary teams that promote effective interventions in which patients are highly involved in self-care. In conclusion, despite the study limitations, it may be stated that patients treated with GLP-1 RAs as compared to insulin were associated to lower healthcare resource consumption, with the resultant decrease in healthcare costs for the national health system. Greater treatment adherence and persistence with lower hypoglycemia rates were also seen in patients treated with GLP-1 RAs, which may be related to the lower costs incurred by these patients.
FundingThis study (code HO-14-15005) was funded by GlaxoSmithKline (GSK).
AuthorshipAll authors meet the authorship criteria detailed in the Uniform requirements for manuscripts submitted to biomedical journals and have therefore substantially contributed to study conduct. Ruth Navarro and Antoni Sicras participated in data collection, analysis, and interpretation and in preparation of the final manuscript. Raúl Morano and Lucía Ruiz participated in data analysis and interpretation and in preparation of the final manuscript.
Conflicts of interestLucía Ruiz and Raúl Morano are employees at GSK Spain. Antoni Sicras received fees as principal investigator of the study and as clinician expert in the subject. Ruth Navarro states that she has no conflicts of interest.
We thank GlaxoSmithKline (GSK) for funding the study.
Please cite this article as: Sicras-Mainar A, Navarro-Artieda R, Morano R, Ruíz L. Consumo de recursos sanitarios y costes asociados al inicio del tratamiento con fármacos inyectables en pacientes con diabetes mellitus tipo 2. Endocrinol Nutr. 2016;63:527–535.