

The aim of the study was to examine the prevalence of protein-energy wasting (PEW) in hemodialysis (HD) and peritoneal dialysis (PD) patients in our center and determine whether adiponectin and leptin are involved in the development of PEW.
DesignProspective (18 months).
SettingUniversity Hospital of Heraklion, Crete, Greece.
SubjectsSeventy-four end-stage-renal-disease patients, 47 on HD and 27 on PD.
Main outcome measuresAt three sequential time points (baseline, 6 and 18 months) anthropometric, nutritional and inflammatory status data were collected. Serum adiponectin and leptin were also assessed at each time point. Patients were allocated to 3 strata according to PEW severity (0, 1–2 and ≥3 criteria for PEW).
ResultsAdiponectin and leptin levels were greater among PD compared to HD patients (p≤0.035). Adiponectin levels were incrementally greater across increasing strata of PEW (p≤0.002). Leptin showed the opposite trend, with lower levels in malnourished patients and higher levels in patients with zero PEW criteria (p≤0.042). Alterations of adiponectin levels during the observation period were dependent on PEW stratum (p≤0.021) and mode of dialysis (p≤0.002), after adjustment for age, dialysis vintage, gender and fat mass index. Particularly, adiponectin levels increased over time in HD patients with ≥3 criteria for PEW, whereas adiponectin levels decreased in PD patients with ≥3 criteria for PEW throughout the study. Leptin alterations over time were not affected by dialysis mode or PEW stratification.
ConclusionsOur study provides evidence that increased adiponectin and decreased leptin levels are independently associated with PEW and thus, poor prognosis.
El objetivo del estudio era analizar la prevalencia del desgaste proteico-energético (DPE) en los pacientes en hemodiálisis (HD) y diálisis peritoneal (DP) de nuestro centro, y determinar si la adiponectina y la leptina intervienen en el desarrollo del DPE.
DiseñoProspectivo (18 meses).
ÁmbitoHospital Universitario de Heraklion, Creta, Grecia.
SujetosSetenta y cuatro pacientes con nefropatía terminal, 47 en HD y 27 en DP.
Variables principalesSe recogieron datos antropométricos, nutricionales y sobre el estado inflamatorio. También los valores séricos de adiponectina y leptina en cada punto temporal. Se dividió a los pacientes en 3 estratos en función de la intensidad del DPE (0, 1-2 y ≥3 criterios de DPE.
ResultadosLas concentraciones de adiponectina y leptina eran mayores en los pacientes en DP que en los sometidos a HD (p≤0,035). Los valores de adiponectina eran incrementalmente mayores al aumentar el estrato de DPE (p≤0,002). La leptina mostraba la tendencia opuesta, con niveles más bajos en los pacientes desnutridos y más altos en los pacientes con ningún criterio de DPE (p≤0,042). Las alteraciones de las concentraciones de adiponectina durante el período de observación dependían del estrato de DPE (p≤0,021) y del modo de diálisis (p≤0,002), previo ajuste por edad, antigüedad de la diálisis, sexo e índice de grasa corporal. En particular, los valores de adiponectina aumentaban con el tiempo en los pacientes en HD con ≥3 criterios de DPE, mientras que descendían en los pacientes en DP con ≥3 criterios de DPE durante todo el estudio. Ni el modo de diálisis ni la estratificación en función del DPE influyeron en las alteraciones de la leptina.
ConclusionesNuestro estudio aporta pruebas de que el aumento de las concentraciones de adiponectina y el descenso de los valores de leptina se asocian independientemente con el DPE y, en consecuencia, con un mal pronóstico.
The syndrome of protein-energy wasting (PEW) is common among patients with end-stage renal disease (ESRD). It is characterized by anorexia, increased energy expenditure, decreased protein stores and loss of body weight, including muscle mass. Each component of the syndrome consists of an independent risk factor for the high mortality induced among ESRD patients,1–3 estimated to be 100–200 times greater than that of the general population.4
Several adipokines have been implemented in PEW pathophysiology, including interleukin-6 (IL-6), interleukin-8 (IL-8), tumor necrosis factor-α (TNF-α), leptin, resistin and adiponectin.5–7 The levels of leptin and adiponectin in particular, have been demonstrated to be three times higher in ESRD patients compared to the general population.5 However, research has shown conflicting results concerning the exact role of leptin and adiponectin in the nutritional status and outcome of ESRD patients. Some studies suggest the use of leptin levels as an index of adequate nutritional status,8–11 whereas others presented leptin as a suppressor of appetite, contributing to PEW and adverse outcome.12,13 As far as adiponectin is concerned, high levels have been correlated to increased morbidity and mortality in dialysis patients,9,14–16 but several studies postulated a protective role,17–19 thus the conundrum remains.20
Therefore, the aims of the present study were: (a) to examine the prevalence of PEW in hemodialysis (HD) and peritoneal dialysis (PD) patients in our clinic, and (b) to evaluate possible associations between baseline and longitudinal changes in adiponectin and leptin levels, with PEW criteria and stratum.
Materials and methodsPatients’ recruitmentThe study was performed at the dialysis unit of the University Hospital of Heraklion, situated in Crete, Greece. The recruitment period ranged from October 2007 until November 2008, during which time, forty-seven HD and 27 PD patients agreed to participate. All of them were of Caucasian origin, had been on maintenance dialysis for at least six months before entering the study, and aged between 18 and 80 years old. We excluded patients with concurrent diagnosis of cancer, sepsis, HIV, limb amputation or inflammatory diseases. All HD patients were on standard 4h×3times/week bicarbonate dialysate and high-flux (32%) or low flux (68%) dialysis membranes, aiming for a minimum KT/V target of 1.3. PD patients followed a standard continuous ambulatory PD (CAPD) plan (4–5exchanges/day), aiming to a weekly KT/V of 1.7 and a creatinine clearance rate of 70L/week. More details about the study have been previously reported.21 Institutional review board approval was obtained and all subjects provided written consent prior to participation. Data was handled anonymously, according to the Helsinki Declaration.
All patients, but the deceased, were assessed three times, i.e. at baseline, at 6th and 18th month of enrolment. Follow-up began on the date of baseline anthropometric and laboratory assessment and finished on either the 31st of December 2011 or at the time of death from-all-causes, depending of whichever came first. No patient withdrew during the follow-up. All patients completed the study, except from 6 that passed away and failed to complete the 18 months of follow-up. The cause of death was cardiovascular disease (n=3), infectious complications (n=2) and intestinal rupture (n=1).21 An additional 11 patients were not followed up throughout the study, due to several reasons such as relocation to other cities/hospitals, changes in the mode of dialysis (from HD to PD), including even a rare case of improvement in the GFR, in which dialysis was not further deemed needed.
Body composition analysisBody composition was assessed with Bioelectrical Impedance Analysis (BIA) by interpreting the values of resistance (R), reactance (Xc) and phase angle (PA).22 BIA was selected as a reliable tool for the assessment of body fat mass, correlating with prognosis among ESRD patients.23 Total body water and fat-free mass can be calculated with formulas that include BIA variables and individual characteristics.24 The analysis was performed in a 50kHz single frequency system, using Tetrapolar electrodes (BIA-101; RJL/Akern Systems, Clinton Township, MI, USA), according to the manufacturer's guidelines. Since preliminary work has shown that R and Xc remain constant and highly reproducible for two hours after the end of HD,24 we decided to perform BIA on the 10–20min following the HD sessions. PD patients were measured irrespectively of the peritoneal fill volume, since studies have demonstrated that changes of R and Xc values are independent of duel volumes.25 The average of two readings was obtained for all patients, in every visit, as previously suggested.26 All measurements were performed on the non-access side of the body.24
Anthropometric evaluationAnthropometric measurements included body dry weight, height, body mass index (BMI) calculation (kilograms of dry weight per height squared, expressed in m), triceps skinfold thickness (TSF), mid-arm circumference (MAC), waist (WC) and hip circumference (HC) and waist to hip ratio (WHR) calculation. All measurements were taken by the same researcher, on the non-access site for HD patients, with the use of a Seca 703 digital scale (Seca Gmbh & Co.) and stadiometer (Seca 220), a set of Harpenden skinfold calipers (HSB-BI, British Indicators), and a common inextensible tape. Anthropometry took place either 20–40min after the HD or during empty peritoneal cavity, for the PD patients. Each measurement was taken three times and the average value was recorded.27,28 Mid-arm muscle circumference (MAMC) and arm muscle area (AMA) were calculated with the use of the Blumenkrantz29 and Kopple30 formulas, respectively. Fat Mass Index (FMI) and Fat-free Mass Index (FFMI) were calculated for each patient as the fat mass or fat-free mass respectively, divided by their stature squared, expressed in m.31
Laboratory evaluationFor laboratory testing, fasting blood samples were drawn from a peripheral vein before dialysis. Those used in the determination of IL-6, IL-8, leptin and adiponectin levels were separated, centrifuged and stored at −80°C, until analysis of the serum samples. Leptin and adiponectin were measured by commercially available Enzyme-Linked Immunosorbent Assay (ELISA) kits (R&D Systems, Inc, Minneapolis, USA), according to manufacturer's guidelines. IL-6 and IL-8 were assessed with commercially available chemiluminensence immunometric assay kits, on an Immulite 1000 analyzer (Siemens Medical Solutions Diagnostics Limited, UK).
Hemoglobin, serum albumin, prealbumin, transferrin (TRF), total iron binding capacity (TIBC), creatinine, parathormone, total cholesterol, high-density lipoprotein (HDL) and low-density lipoprotein cholesterol (LDL), triglyceride (TG), calcium, phosphorus and magnesium levels were determined using standard laboratory techniques. C-reactive-protein (CRP) was measured via nephelometry.
Malnutrition-inflammation scoreMalnutrition-inflammation score (MIS)32 was calculated for all patients. MIS consists of 4 domains, assessing patients’ medical history, physical examination, BMI and laboratory parameters, and 10 components. The total score deriving from all MIS components ranges from 0 to 30, with higher scores reflecting increased risk of malnutrition and inflammation. Each MIS component has four levels of severity from 0 (normal) to 3 (very severe). MIS has been proved as a useful, short-term tool to risk-stratify HD and PD patients, capable to replace the routine patient's assessment in inflammatory markers, such as CRP and IL-6.27
PEW diagnosisPatients’ nutritional and inflammatory status was evaluated according to the nomenclature proposed for the diagnosis of kidney disease-related PEW by Fouque and associates.33 The diagnosis of PEW is based on four main categories, i.e. laboratory parameters, assessment of muscle and body mass, as well as dietary intake. A patient is diagnosed with PEW when one fulfills at least 1 criterion from each category, in 3 out of the 4 categories. In our study, five diagnostic criteria [albumin <3.8g/dl, prealbumin <30mg/dl, reduction of the arm muscle area (AMA) >10% relatively to the 50th percentile of the reference population, BMI<23kg/m2 and percentage of body fat (BF)<10% of body weight] were used, from three categories of the tool. As patients’ dietary intake was not recorded, no criterion from this category was included in the PEW diagnosis. Patients were allocated into three PEW categories according to the diagnostic process: (a) those with PEW diagnosis (≥3 PEW criteria fulfilled), (b) those at risk of PEW development (1–2 PEW criteria fulfilled) and (c) the well nourished ones (absence of fulfilled PEW criteria).
Statistical analysesWhen normally distributed, scale data were expressed as mean±standard deviation. When not normally distributed data were stressed as median (interquartile range). Students’ T-test and Mann–Whitney Rank Sum test were used for the comparison of baseline characteristics between groups, depending on the normality of the data. Spearman's Correlation coefficients were calculated for adipokine concentrations, clinical and laboratory variables. Univariate and multivariate regression analyses were used to determine associations between variables. Statistical analysis was performed using PASW Statistics 21.0 (SPSS Inc., Hong Kong). The significance level was set at 0.05.
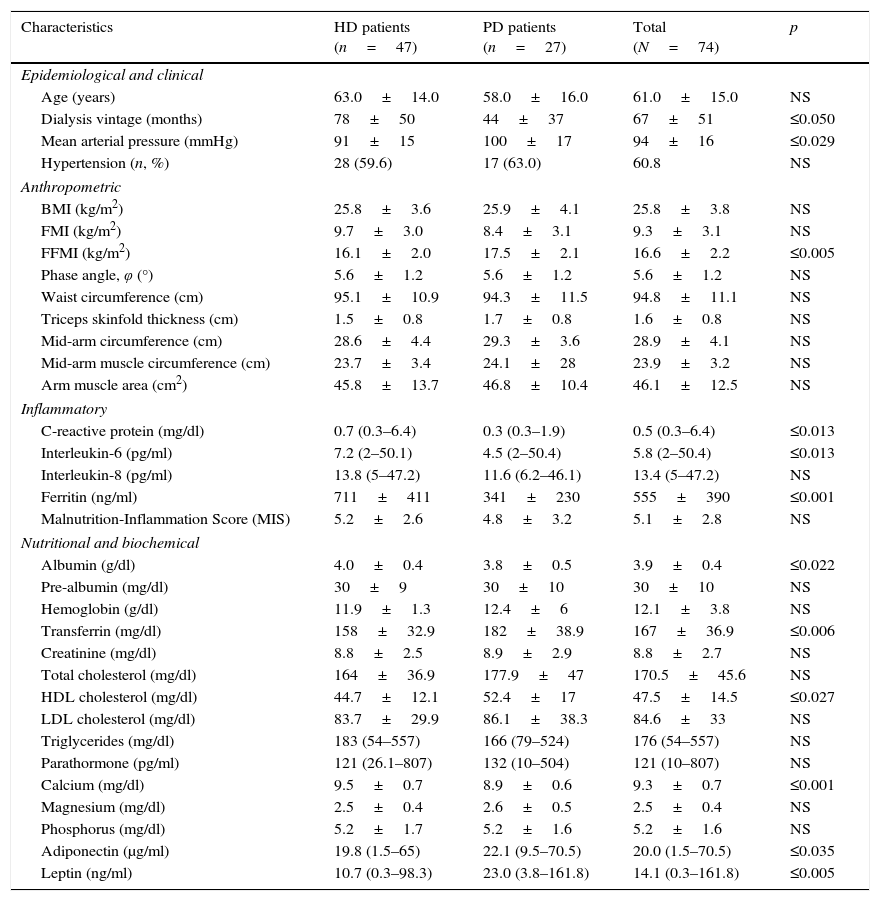
ResultsGeneral characteristicsComorbidities among participants involved type II diabetes mellitus (18.9%), cardiovascular disease (20.3%) and hypertension (60.1%). Duration of renal replacement therapy (RRT) was shorter in the PD compared to the HD patients (44±37 vs. 78±50 months, p≤0.05). Table 1 stresses the baseline characteristics of the sample.
Baseline characteristics of hemodialysis (HD) and peritoneal dialysis (PD) patients.
| Characteristics | HD patients (n=47) | PD patients (n=27) | Total (N=74) | p |
|---|---|---|---|---|
| Epidemiological and clinical | ||||
| Age (years) | 63.0±14.0 | 58.0±16.0 | 61.0±15.0 | NS |
| Dialysis vintage (months) | 78±50 | 44±37 | 67±51 | ≤0.050 |
| Mean arterial pressure (mmHg) | 91±15 | 100±17 | 94±16 | ≤0.029 |
| Hypertension (n, %) | 28 (59.6) | 17 (63.0) | 60.8 | NS |
| Anthropometric | ||||
| BMI (kg/m2) | 25.8±3.6 | 25.9±4.1 | 25.8±3.8 | NS |
| FMI (kg/m2) | 9.7±3.0 | 8.4±3.1 | 9.3±3.1 | NS |
| FFMI (kg/m2) | 16.1±2.0 | 17.5±2.1 | 16.6±2.2 | ≤0.005 |
| Phase angle, φ (°) | 5.6±1.2 | 5.6±1.2 | 5.6±1.2 | NS |
| Waist circumference (cm) | 95.1±10.9 | 94.3±11.5 | 94.8±11.1 | NS |
| Triceps skinfold thickness (cm) | 1.5±0.8 | 1.7±0.8 | 1.6±0.8 | NS |
| Mid-arm circumference (cm) | 28.6±4.4 | 29.3±3.6 | 28.9±4.1 | NS |
| Mid-arm muscle circumference (cm) | 23.7±3.4 | 24.1±28 | 23.9±3.2 | NS |
| Arm muscle area (cm2) | 45.8±13.7 | 46.8±10.4 | 46.1±12.5 | NS |
| Inflammatory | ||||
| C-reactive protein (mg/dl) | 0.7 (0.3–6.4) | 0.3 (0.3–1.9) | 0.5 (0.3–6.4) | ≤0.013 |
| Interleukin-6 (pg/ml) | 7.2 (2–50.1) | 4.5 (2–50.4) | 5.8 (2–50.4) | ≤0.013 |
| Interleukin-8 (pg/ml) | 13.8 (5–47.2) | 11.6 (6.2–46.1) | 13.4 (5–47.2) | NS |
| Ferritin (ng/ml) | 711±411 | 341±230 | 555±390 | ≤0.001 |
| Malnutrition-Inflammation Score (MIS) | 5.2±2.6 | 4.8±3.2 | 5.1±2.8 | NS |
| Nutritional and biochemical | ||||
| Albumin (g/dl) | 4.0±0.4 | 3.8±0.5 | 3.9±0.4 | ≤0.022 |
| Pre-albumin (mg/dl) | 30±9 | 30±10 | 30±10 | NS |
| Hemoglobin (g/dl) | 11.9±1.3 | 12.4±6 | 12.1±3.8 | NS |
| Transferrin (mg/dl) | 158±32.9 | 182±38.9 | 167±36.9 | ≤0.006 |
| Creatinine (mg/dl) | 8.8±2.5 | 8.9±2.9 | 8.8±2.7 | NS |
| Total cholesterol (mg/dl) | 164±36.9 | 177.9±47 | 170.5±45.6 | NS |
| HDL cholesterol (mg/dl) | 44.7±12.1 | 52.4±17 | 47.5±14.5 | ≤0.027 |
| LDL cholesterol (mg/dl) | 83.7±29.9 | 86.1±38.3 | 84.6±33 | NS |
| Triglycerides (mg/dl) | 183 (54–557) | 166 (79–524) | 176 (54–557) | NS |
| Parathormone (pg/ml) | 121 (26.1–807) | 132 (10–504) | 121 (10–807) | NS |
| Calcium (mg/dl) | 9.5±0.7 | 8.9±0.6 | 9.3±0.7 | ≤0.001 |
| Magnesium (mg/dl) | 2.5±0.4 | 2.6±0.5 | 2.5±0.4 | NS |
| Phosphorus (mg/dl) | 5.2±1.7 | 5.2±1.6 | 5.2±1.6 | NS |
| Adiponectin (μg/ml) | 19.8 (1.5–65) | 22.1 (9.5–70.5) | 20.0 (1.5–70.5) | ≤0.035 |
| Leptin (ng/ml) | 10.7 (0.3–98.3) | 23.0 (3.8–161.8) | 14.1 (0.3–161.8) | ≤0.005 |
HD patients exhibited significantly less muscle mass compared to PD patients, although both groups had a similar mean BMI. The HD group also demonstrated higher levels of serum CRP (p≤0.013), IL-6 (p≤0.013), ferritin (p≤0.001), albumin (p≤0.022) and calcium (p≤0.001) and lower levels of serum transferrin (p≤0.006), HDL-cholesterol (p≤0.027), adiponectin (p≤0.035) and leptin (p≤0.005) compared to the PD patients.
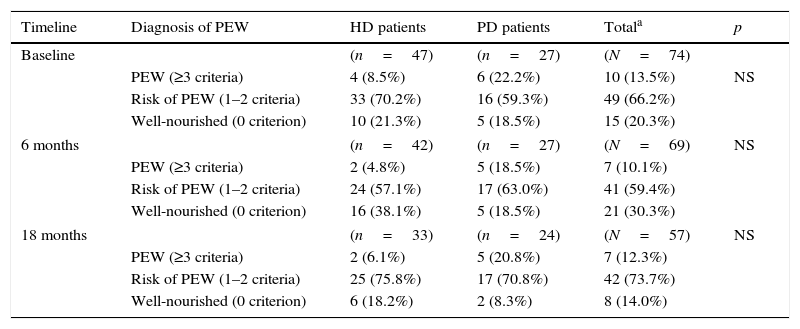
Prevalence of PEWTable 2 shows the prevalence of PEW in each group, in each time point of the study. In the total sample, 10/74 patients (13.5%) were diagnosed with PEW, 49 were at risk of developing PEW and 15 were considered well nourished. As far as nutritional status is concerned, although arithmetically a greater majority of HD patients were well nourished compared to PD patients (21.3% vs. 18.5%), the differences were not significant. None of the patients fulfilled the PEW diagnostic criterion of extremely low body fat percentage.
Prevalence of protein-energy wasting (PEW)33 in haemodialysis (HD) and peritoneal dialysis (PD) patients (n, %), in each stage of the study.
| Timeline | Diagnosis of PEW | HD patients | PD patients | Totala | p |
|---|---|---|---|---|---|
| Baseline | (n=47) | (n=27) | (N=74) | ||
| PEW (≥3 criteria) | 4 (8.5%) | 6 (22.2%) | 10 (13.5%) | NS | |
| Risk of PEW (1–2 criteria) | 33 (70.2%) | 16 (59.3%) | 49 (66.2%) | ||
| Well-nourished (0 criterion) | 10 (21.3%) | 5 (18.5%) | 15 (20.3%) | ||
| 6 months | (n=42) | (n=27) | (N=69) | NS | |
| PEW (≥3 criteria) | 2 (4.8%) | 5 (18.5%) | 7 (10.1%) | ||
| Risk of PEW (1–2 criteria) | 24 (57.1%) | 17 (63.0%) | 41 (59.4%) | ||
| Well-nourished (0 criterion) | 16 (38.1%) | 5 (18.5%) | 21 (30.3%) | ||
| 18 months | (n=33) | (n=24) | (N=57) | NS | |
| PEW (≥3 criteria) | 2 (6.1%) | 5 (20.8%) | 7 (12.3%) | ||
| Risk of PEW (1–2 criteria) | 25 (75.8%) | 17 (70.8%) | 42 (73.7%) | ||
| Well-nourished (0 criterion) | 6 (18.2%) | 2 (8.3%) | 8 (14.0%) | ||
NS, not significant.
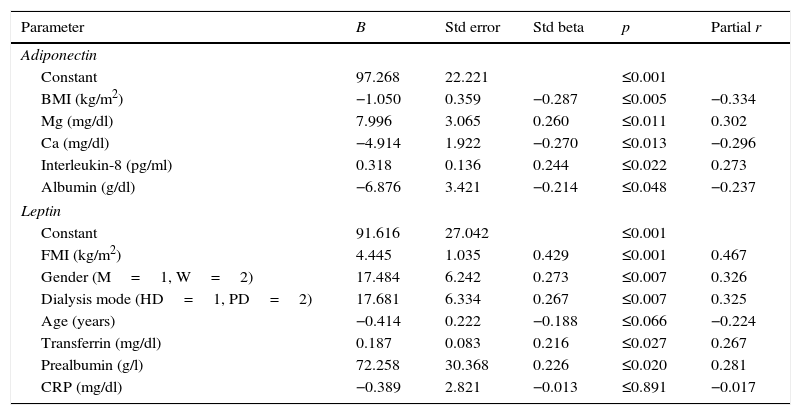
When significant variables in univariate analysis were included in the multiple regression model, higher adiponectin levels were associated with lower BMI, lower levels of albumin and serum Ca, and higher levels of Mg and IL-8 (Table 3). Higher leptin levels were associated with peritoneal dialysis, women and greater FMI, transferrin and pre-albumin levels.
Multiple regression analysis for assessing the predictors of serum adiponectin and leptin levels.
| Parameter | B | Std error | Std beta | p | Partial r |
|---|---|---|---|---|---|
| Adiponectin | |||||
| Constant | 97.268 | 22.221 | ≤0.001 | ||
| BMI (kg/m2) | −1.050 | 0.359 | −0.287 | ≤0.005 | −0.334 |
| Mg (mg/dl) | 7.996 | 3.065 | 0.260 | ≤0.011 | 0.302 |
| Ca (mg/dl) | −4.914 | 1.922 | −0.270 | ≤0.013 | −0.296 |
| Interleukin-8 (pg/ml) | 0.318 | 0.136 | 0.244 | ≤0.022 | 0.273 |
| Albumin (g/dl) | −6.876 | 3.421 | −0.214 | ≤0.048 | −0.237 |
| Leptin | |||||
| Constant | 91.616 | 27.042 | ≤0.001 | ||
| FMI (kg/m2) | 4.445 | 1.035 | 0.429 | ≤0.001 | 0.467 |
| Gender (M=1, W=2) | 17.484 | 6.242 | 0.273 | ≤0.007 | 0.326 |
| Dialysis mode (HD=1, PD=2) | 17.681 | 6.334 | 0.267 | ≤0.007 | 0.325 |
| Age (years) | −0.414 | 0.222 | −0.188 | ≤0.066 | −0.224 |
| Transferrin (mg/dl) | 0.187 | 0.083 | 0.216 | ≤0.027 | 0.267 |
| Prealbumin (g/l) | 72.258 | 30.368 | 0.226 | ≤0.020 | 0.281 |
| CRP (mg/dl) | −0.389 | 2.821 | −0.013 | ≤0.891 | −0.017 |
Std beta, standardized regression coefficients; r, correlation coefficient; HD, haemodialysis; PD, peritoneal dialysis; CRP, C-reactive protein; BMI, body mass index; FMI, fat mass index31; M, men; W, women.
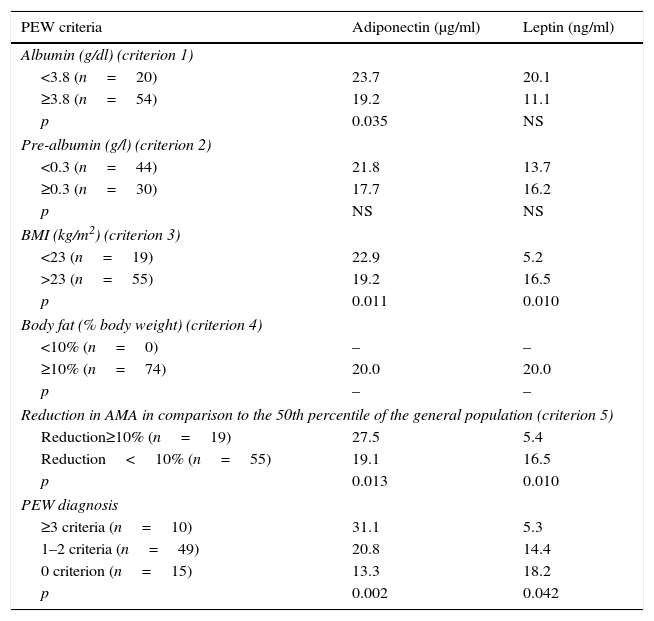
In Table 4 adiponectin and leptin serum levels at baseline above and below the threshold values are presented for each PEW criterion. Adiponectin was statistically higher at albumin values below 3.8g/dl (p≤0.035), BMI smaller than 23kg/m2 (p≤0.011), AMA reduction greater than 10% (in comparison to the 50th percentile of the general population) (p≤0.013) and at patients with PEW diagnosis (p≤0.002).
Comparison of adiponectin and leptin serum levels above and below the threshold values of each selected protein-energy wasting (PEW)33 criterion and at PEW strata in ESRD patients, at baseline (values expressed as median)a.
| PEW criteria | Adiponectin (μg/ml) | Leptin (ng/ml) |
|---|---|---|
| Albumin (g/dl) (criterion 1) | ||
| <3.8 (n=20) | 23.7 | 20.1 |
| ≥3.8 (n=54) | 19.2 | 11.1 |
| p | 0.035 | NS |
| Pre-albumin (g/l) (criterion 2) | ||
| <0.3 (n=44) | 21.8 | 13.7 |
| ≥0.3 (n=30) | 17.7 | 16.2 |
| p | NS | NS |
| BMI (kg/m2) (criterion 3) | ||
| <23 (n=19) | 22.9 | 5.2 |
| >23 (n=55) | 19.2 | 16.5 |
| p | 0.011 | 0.010 |
| Body fat (% body weight) (criterion 4) | ||
| <10% (n=0) | – | – |
| ≥10% (n=74) | 20.0 | 20.0 |
| p | – | – |
| Reduction in AMA in comparison to the 50th percentile of the general population (criterion 5) | ||
| Reduction≥10% (n=19) | 27.5 | 5.4 |
| Reduction<10% (n=55) | 19.1 | 16.5 |
| p | 0.013 | 0.010 |
| PEW diagnosis | ||
| ≥3 criteria (n=10) | 31.1 | 5.3 |
| 1–2 criteria (n=49) | 20.8 | 14.4 |
| 0 criterion (n=15) | 13.3 | 18.2 |
| p | 0.002 | 0.042 |
ESRD, end stage renal disease; BMI, body mass index; AMA, arm muscle area.
a Mann–Whitney U test.
On the contrary, leptin levels were statistically higher in patients with greater BMI values (p≤0.010) and AMA (p≤0.010) and at well-nourished patients (p≤0.042).
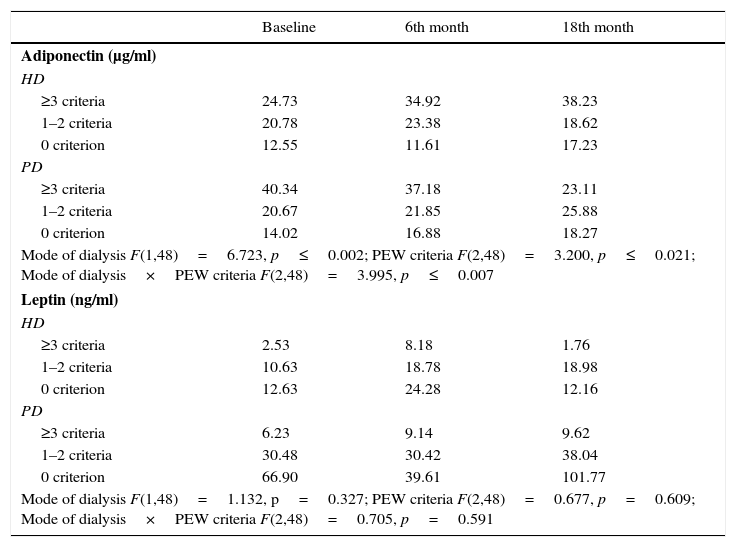
Longitudinal modeling of adiponectin and leptinIn Table 5, ANOVA repeated analysis of adiponectin and leptin serum levels at baseline, 6th and 18th month of study showed that, alterations of adiponectin levels during the observation period, were dependent on PEW stratum (p≤0.021) and mode of dialysis (p≤0.002), after adjustment for age (every 5 years), dialysis vintage, gender, and FMI. Particularly, adiponectin levels increased over time in HD patients with ≥3 criteria for PEW, whereas adiponectin levels decreased in PD patients with ≥3 criteria for PEW throughout the study. Leptin alterations over time were not affected by the mode of dialysis or the PEW stratification (Table 5).
Alterations in adiponectin and leptin levels during the 3 study time points, according to PEW33 strata and mode of dialysis (data are expressed as median).
| Baseline | 6th month | 18th month | |
|---|---|---|---|
| Adiponectin (μg/ml) | |||
| HD | |||
| ≥3 criteria | 24.73 | 34.92 | 38.23 |
| 1–2 criteria | 20.78 | 23.38 | 18.62 |
| 0 criterion | 12.55 | 11.61 | 17.23 |
| PD | |||
| ≥3 criteria | 40.34 | 37.18 | 23.11 |
| 1–2 criteria | 20.67 | 21.85 | 25.88 |
| 0 criterion | 14.02 | 16.88 | 18.27 |
| Mode of dialysis F(1,48)=6.723, p≤0.002; PEW criteria F(2,48)=3.200, p≤0.021; Mode of dialysis×PEW criteria F(2,48)=3.995, p≤0.007 | |||
| Leptin (ng/ml) | |||
| HD | |||
| ≥3 criteria | 2.53 | 8.18 | 1.76 |
| 1–2 criteria | 10.63 | 18.78 | 18.98 |
| 0 criterion | 12.63 | 24.28 | 12.16 |
| PD | |||
| ≥3 criteria | 6.23 | 9.14 | 9.62 |
| 1–2 criteria | 30.48 | 30.42 | 38.04 |
| 0 criterion | 66.90 | 39.61 | 101.77 |
| Mode of dialysis F(1,48)=1.132, p=0.327; PEW criteria F(2,48)=0.677, p=0.609; Mode of dialysis×PEW criteria F(2,48)=0.705, p=0.591 | |||
All analyses were adjusted for age (every additional 5 years), dialysis vintage, gender and FMI.
PEW, protein-energy wasting; HD, haemodialysis; PD, peritoneal dialysis; FMI, fat mass index.31
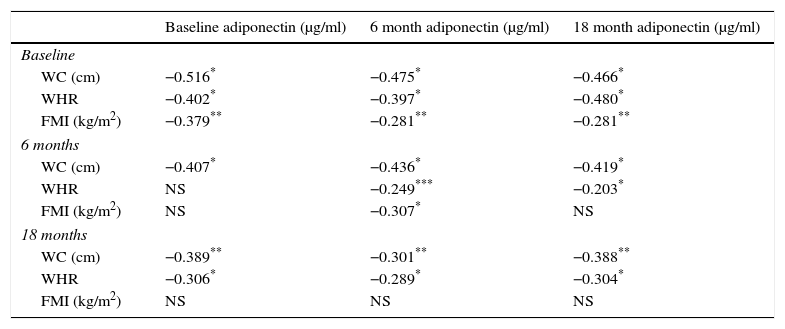
Adiponectin cross-correlates are presented in Table 6. Inverse correlations were determined between adiponectin concentrations at different time points and waist circumference, waist/hip ratio or FMI, with the strongest observed between adiponectin and waist perimeter.
Cross-correlates of serum adiponectin and anthropometric parameters at the 3 time points of the study (Spearman's rho).
| Baseline adiponectin (μg/ml) | 6 month adiponectin (μg/ml) | 18 month adiponectin (μg/ml) | |
|---|---|---|---|
| Baseline | |||
| WC (cm) | −0.516* | −0.475* | −0.466* |
| WHR | −0.402* | −0.397* | −0.480* |
| FMI (kg/m2) | −0.379** | −0.281** | −0.281** |
| 6 months | |||
| WC (cm) | −0.407* | −0.436* | −0.419* |
| WHR | NS | −0.249*** | −0.203* |
| FMI (kg/m2) | NS | −0.307* | NS |
| 18 months | |||
| WC (cm) | −0.389** | −0.301** | −0.388** |
| WHR | −0.306* | −0.289* | −0.304* |
| FMI (kg/m2) | NS | NS | NS |
NS, not significant; WC, waist circumference; WHR, waist-to-hips ratio; FMI, fat mass index.31
The present study showed significant differences in the fat-free mass, several inflammatory and biochemical characteristics between HD and PD patients. No difference was observed in the prevalence of PEW between the two-dialysis methods. Elevated adiponectin levels were associated with lower BMI, lower levels of circulating albumin and serum Ca, as well as with higher levels of Mg and IL-8. Elevated leptin levels were associated with peritoneal dialysis, female gender and greater FMI, transferrin and pre-albumin levels. During the course of the study, HD patients with PEW demonstrated an increase in adiponectin levels over time, with the contrary being exhibited by PD patients with PEW. No time-related pattern was determined for leptin levels.
Fairly recently, the MADRAD prospective cohort study showed that higher adiponectin levels were associated with a 3-fold greater death risk among HD patients, irrespectively of body composition status and lipid levels of the patients.34 While the MADRAD study has only focused on HD patients, increasing evidence suggests that gelsolin and adipokines in general,35 are in fact associated with PEW and could be used in the diagnosis of malnutrition among ESRD patients.
The findings suggest greater adiponectin and leptin levels, but lower IL-6 and CRP levels among PD patients compared to the HD ones, as seen in several studies.36,37 During the ESRD enhanced adipose tissue production of adiponectin is observed and this stimulus appears unaffected by the already elevated circulating levels.36 Whether this consists of the epiphenomenon of reduced mediators or hampered regulation, it is not yet clear. Additionally, our study associated high levels of adiponectin with lower BMI, reduced circulating albumin and serum Ca, and elevated levels of Mg and IL-8. It is possible that circulating IL-8 was increased in an attempt to down-regulate adiponectin production. Despite the high levels of adiponectin observed in chronic inflammatory states, pro-inflammatory cytokines like IL-6 and IL-8 have been shown to tamper adiponectin expression, and this mechanism might actually explain the observed increased circulating levels.36,38 Prospective studies on CKD patients have showed that an increase of 1-μg/ml in adiponectin levels subsequently increases all-cause and cardiovascular risk mortality,39 with visceral fat being the major determinant of adiponectin levels.40 In a previous study concerning the same sample herein we noted that patients who died demonstrated significantly greater adiponectin levels compared to surviving patients.21 In the present study, elevated adiponectin was observed among patients with low circulating albumin, BMI smaller than 23kg/m2, AMA reduction greater than 10% and PEW diagnosis, all suggesting an association between increased adiponectin levels, inflammation and wasting. Among PEW patients, adiponectin levels were increased over time in those following HD, and decreased in patients on PD. In a prospective 12 months study, Kamimura40 demonstrated an accumulation of visceral fat with a concomitant reduction of adiponectin concentration and postulated that the first was the main determinant of the latter. Thus, the accumulation of visceral fat shown in a plethora of longitudinal studies among PD patients41,42 irrespectively of PEW diagnosis, appears to be the factor lowering adiponectin levels, as observed in our study. This finding was further corroborated by the strong inverse correlations observed between adiponectin concentration and waist circumference at all 3 time points throughout the study.
As far as leptin is concerned, its role on CKD appears similarly confusing.43 Overall, CKD is characterized by increase plasma leptin levels, partly explained by the reduced renal clearance.43 According to Alix and associates,43 hyperleptinemia is involved in the pathogenesis of CKD complications like cachexia, PEW, inflammation, insulin resistance, cardiovascular and bone complications. In our study, greater leptin levels were associated with peritoneal dialysis, female sex, as well as greater FMI, transferrin and pre-albumin levels. When cutoffs were applied on several of the studied variables, greater leptin levels were observed among patients with higher BMI and AMA, as well as on adequately nourished patients. These findings are indicative of the modulating role of leptin in body weight regulation among eutrophic patients. Additionally, no time-related pattern was determined for leptin levels in either PD or HD patients and increased leptin levels were more prominent among eutrophic patients rather than malnourished ones. It is possible that the time frame of the study was not long enough to depict time-changes in leptin levels, and it is also likely that the prolonged rise in circulating leptin might induce loss of appetite and malnutrition in the long run.
Several studies have assessed the differences observed between HD and PD patients. The lower level of fat-free mass observed among HD patients has also been recorded in a multicenter study by van Biesen,44 as well as in other recent studies.45 Additionally, lower levels of serum albumin among PD patients, similar to the herein, have also been reported in the past.46 Low serum albumin levels are predictive of poor prognosis in all stages of CKD, consist of a “de facto index of clinical performance”,47–49 and are likely an epiphenomenon of combined inflammation, PEW and plasma volume expansion.50,51
In conclusion, our study provides evidence that increased circulating adiponectin and decreased leptin levels are independently associated with PEW. Further research is needed in order to establish whether adiponectin and leptin play a causative role, or simply act as markers of PEW. Additionally, the interaction of adiponectin-by dialysis mode-by time warrants further assessment.
FundingNo funding was received for the present study. No funding or financial assistance either direct or indirect, was provided for the study. No external material or financial support was attained for the present research.
Conflict of interestsThe authors have no conflicts of interest to declare.
The authors acknowledge the help of all participating patients.