


Central Counterparties (CCPs) are financial infrastructures designed to reduce counterparty risk. They do so by virtue of novation of trades, becoming the buyer to the seller and the seller to the buyer. CCPs manage the counterparty risk collecting Margins from its Members.
Interoperability among CCPs allows those Members that maintain positions in several CCPs (like big investment banks or HFTs) to concentrate all their trades in one CCP. After an Interoperability arrangement is implemented, these Members can reduce their total exposure by netting long and short positions, thus enjoying a reduction in the Margins they have to post.
But Interoperability reduces the Margins for some Members at the price of creating new risks for the whole system. These new risks have to be covered with Interoperability Margins, additional to the Position-related ones. As a consequence, Members with a below-average use of Interoperability – like local Banks or final investors – will suffer an increase in the Margins they have to post.
Interoperability – which is compulsory in Europe by virtue of EMIR – implies a transfer of capital from local Banks and final investors to big Investment Banks and HFTs. The rationale for defending such a policy should be openly discussed: it is not easy to realize why capital in the hands of HFTs and big Investment Banks is preferable to capital in the hands of local Banks and buy-side firms.
Las entidades de contrapartida central (ECC) son infraestructuras financieras diseñadas para reducir el riesgo de las contrapartes mediante la innovación comercial, convirtiéndose en compradores para los vendedores, y viceversa. Las ECC gestionan el riesgo de las contrapartes, recolectando los márgenes procedentes de sus miembros.
La interoperabilidad entre las ECC permite que aquellos miembros que mantienen posiciones en diversas ECC (tales como los grandes bancos de inversión, o las HFT) puedan concentrar todas sus operaciones en una única ECC. Una vez que se introduce un acuerdo de interoperabilidad, dichos miembros pueden reducir su exposición al compensar sus posiciones a largo y corto plazo, obteniendo de este modo una reducción de los márgenes que tienen que registrar.
Pero la interoperabilidad reduce los márgenes de algunos miembros, a costa de crear nuevos riesgos para el sistema en general, que deben cubrirse con los márgenes de interoperabilidad, además de los márgenes relativos a la posición. Como consecuencia de ello, los miembros que utilicen una interoperabilidad por debajo de la media –como es el caso de los bancos locales o los inversores finales– experimentarán un incremento de los márgenes que tienen que registrar.
La interoperabilidad –que es obligatoria en Europa en virtud de la normativa EMIR– implica la transferencia de capital de los bancos locales e inversores finales a los grandes bancos de inversión y a las HFT. Claramente, deberá analizarse la justificación para defender dicha política: no es fácil comprender por qué es preferible que el capital esté en manos de las HFT y los grandes bancos, en lugar de residir en los bancos locales y en las empresas compradoras.
Central Counterparties (CCPs) are financial infrastructures designed to reduce counterparty risk. They do so by virtue of novation of trades, becoming the buyer to the seller and the seller to the buyer and protect themselves from counterparty risk by collecting Margins from its Members. In the quest for a safer, more solid financial framework Central Counterparties (CCPs) have been promoted as instruments for managing counterparty risk in financial markets.
In Europe, efficiency and competition concerns have resulted in a demand for Interoperability among CCPs. Such forces have crystalized in the EMIR Regulation, which makes central clearing compulsory for many financial instruments and, at the same time, forces European CCPs to enter into interoperability agreements when required to do so.1
Without Interoperability, once a Member has cleared a trade through one CCP, such trade is irrevocably tied to that specific CCP. This situation has led to argue that each CCP has a monopoly and Interoperability has been presented as a tool to fight against this monopoly. This is a weak argument, though: a monopoly is defined by the presence or absence of close substitutes. If there are several CCPs offering the same instrument, it is obvious that there are close substitutes. If there are close substitutes, it is difficult to defend that there is a monopoly.2
At the same time, some Members usually trade in different trading venues. If these trading venues utilize different CCPs, the Member can find itself in a situation where a long position in one financial instrument cannot be offset against a short position in the same instrument just because the long and short positions are cleared through two different CCPs. This not only increases the capital requirement for the Member, which has to post double collateral, but could also increase systemic risk, because an essentially balanced position is treated as two separate, independent positions.
Interoperability among CCPs allows Members with activity in several trading venues to consolidate all their positions in just one CCP, saving capital and reducing their risks. This is a strong argument in favour of interoperability in Europe.3
In practical, and legal terms, Interoperability means that the interoperating CCPs become a kind of especial Member of each other. When one of the Member Banks wants to transfer its position from one CCP to the other, the only thing to do is for the Bank to move such position to the account of the corresponding CCP at the interoperated CCP.
The Bank can then consolidate all its positions in one CCP, realizing all the operational and cost advantages of such integration. The side effect is that the CCPs have an open position among them that can be a source of systemic risk.
European Authorities have recognized the risk of systemic disorders associated with Interoperability and have reacted by demanding that sufficient collateral be posted between the interoperating CCPs. Such guaranty should be additional to Position Margins, pre-funded and financed by the Members of the CCPs.4,5
Interoperability has, then, two opposing effects on Total Margins to be posted by Members: the new netting opportunities reduce Margins; but, at the same time, the new risks posed by the cross-CCPs relationships call for the need of an increase in Margins.
The effect on Total Margins of central clearing and Interoperability has been analyzed in several papers, like Duffie and Zhu (2011) or Mägerle and Nellen (2011). One common finding is that having several CCPs for the same instrument can reduce the efficiency of the system, measured in terms of the amount of collateral needed to cover the Margins demanded by the CCPs. Interoperability can increase the efficiency of the system, but, depending on the precise mechanism chosen to deal with systemic risk, it can do so at the cost of an overcollateralized clearing system,6 compared to the situation of just one CCP.
The effect of Interoperability on the distribution of Margins to post by the different Members has been less analyzed and is, precisely, the object of the present paper. The main finding is that Interoperability is not neutral in the distribution of Margins among Members: the savings of collateral are concentrated on some Members, while the increases in Margins have to be borne by other Members. This raises considerations of fairness and, in more general terms, on the impact of regulation.
The present paper, which is an extension of Mägerle and Nellen's (2011) model, develops a numeric example of interoperability between two CCPs, focusing on the distribution of Margins among Members. The example is developed in three steps. In the first step, we describe the market before Interoperability, and calculate the Margins to be posted by each Member when the CCPs are independent from each other. In the second step, Interoperability is introduced and Margins are recalculated for this new situation. Finally, the third step compares Margins before and after Interoperability.
A formal presentation of the model is included in the Technical Appendix.
2A review of the relevant literatureAcademic interest on central clearing and related issues gathered momentum when the G-20, at the 2009 Pittsburgh Summit, declared mandatory clearing for OTC derivatives. Since then, a number of papers have been published on this topic, analysing the impact of introducing a CCP in a previously bilaterally cleared market. A brief reference to some relevant papers on interoperability and the redistribution of collateral consumption among Members follows.
Applying the instruments of the Theory of Industrial Organization to financial markets, Pirrong (2007) shows that the amount of capital needed to ensure the performance of a CCP is subadditive: the capital required for the performance of just one single CCP is less than the amount needed by two or more CCPs. This is so because losses from a CCP default can be described as an option on a portfolio. The subadditivity comes from the fact that an option on a portfolio is less costly than a portfolio of options.
In Pirrong (2011) this line of reasoning is extended towards the conclusion that interoperability among CCPs that are clearing the same instrument can be desirable, although it is challenging to design robust interoperability arrangements. Further, the presence of heterogeneous participants will most likely lead to a redistribution of wealth among Members. In this context, it is crucial for regulators to clearly identify the market failure that they are trying to address.
Duffie and Zhu (2011), analysing the clearing of derivatives, illustrate that the counterparty risk and netting inefficiency in the clearing system of OTC derivatives are generally exacerbated if more than one CCP is involved. Clearing the different classes of derivatives in a single CCP is more efficient, from the point of view of collateral consumption, than clearing the different classes in different CCPs. They mention that interoperability can be a means of achieving the benefits of joint clearing, provided the legal, financial engineering, and business hurdles are overcome. In their paper, Duffie and Zhu assume that all the market participants have the same distribution of positions.
Mägerle and Nellen (2011), developing a model that is the basis of the one used in the present paper, find that interoperability achieves optimal netting efficiency similar to the reference case of a single CCP by enabling multilateral netting across all participants of linked CCPs. They demonstrate that interoperability minimizes Margins requirements and counterparties exposures in the clearing system. But, at the same time, they confirm regulator's concerns about systemic risk, because multilateral interoperability arrangements are generally prone to undercollateralization. The additional collateral required to eliminate the risk of contagion brings about a certain degree of overcollateralization in the clearing system. Mägerle and Nellen, with an approach similar to Duffie and Zhu, assume in their model that all the market participants make use of interoperability and that they are homogeneous among them.7
Garratt and Zimmerman (2015) extend the work of Duffie and Zhu by considering general cases of network structures. Instead of considering that all dealers are ex ante the same, Garratt and Zimmerman design a model with a more realistic network, including several well-connected nodes together with a larger number of poorly connected participants. They analyze both the expected exposure and the variance of the net exposures and find that depending on the number of asset classes relative to the number of dealers, introducing a CCP can either increase both the mean and the variance, reduce both or have opposite effects on the mean and the variance, leading to a trade-off. Garratt and Zimmerman find situations that could be socially efficient but are not Pareto-efficient. This could explain why market participants in OTC markets have not agreed upon central clearing and opens, like in Pirrong's work, the question of exactly what market failure is the regulator trying to address. In a different context and with a different model, some of the conclusions of Garratt and Zimmerman are also reached in the present paper.
Heath, Kelly, and Manning (2013) approach the problem in a different way. They take into consideration the consumption of collateral (high-quality liquid assets) that the different alternative setups bring about and the impact of such consumption on the Balance Sheets of the Members. They do so in the context of a core-periphery model. One of their findings is that the benefits of netting and central clearing accrue disproportionately to the core banks. The model of the present paper confirms this conclusion.
From a completely different point of view, ESMA (2013) analyses the systemic risk implications of interoperability arrangements and puts forward the guidelines to contain them. Bank of England (2015) develops the guidelines into a practical implementation policy reference.
Finally, ESMA (2016) is a balanced analysis of the implications of interoperability, enjoying the benefit of access to actual data of the interoperability arrangements implemented in Europe.
It has to be pointed out that while the actual interoperability arrangements implemented in Europe are restricted to money market or cash instruments, most of the academic analyses have referred to the case of derivatives. Except for Mägerlle and Nellen's, there are not many academic analyses on interoperability for cash instruments.
In the next sections, we present a numeric example of interoperability between two CCPs for cash instruments. We will focus on the distribution of collateral consumption among Members. The first step in the analysis is to describe the situation before interoperability is implemented.
3Initial situation before InteroperabilityThe situation before Interoperability is the following:
- 1.
There are two separate CCPs, namely CCP-A and CCP-B, both clearing the same financial instrument – cash equity.
- 2.
Each of the two CCPs has its own set of Members. Each Member clears only at one CCP, except for Member 1, who is Member of and maintains positions at the two CCPs. Thus, Member 1 is the candidate to benefit from the Interoperability Arrangement once it is implemented. This simplified setup highlights the impact of Interoperability without any significant loss of accuracy.
- 3.
There are five groups of Members:
- •
Members of CCP-A holding net long positions;
- •
Members of CCP-A holding net short positions;
- •
Members of CCP-B holding net long positions;
- •
Members of CCP-B holding net short positions;
- •
and, finally, Member 1, who maintains a long position at CCP-A and a short one at CCP-B.
- •
- 4.
Margins are calculated as a percentage (arbitrarily set at 10%) of the positions held by Members. Both CCPs are assumed to maintain the same margining policy. As Margins are necessary to cover the risk of adverse price movements, they are calculated on the absolute value of the position; to further simplify the example, the same probability is assigned to increases and decreases of prices.8 This simplification does not affect the generality of the conclusions.
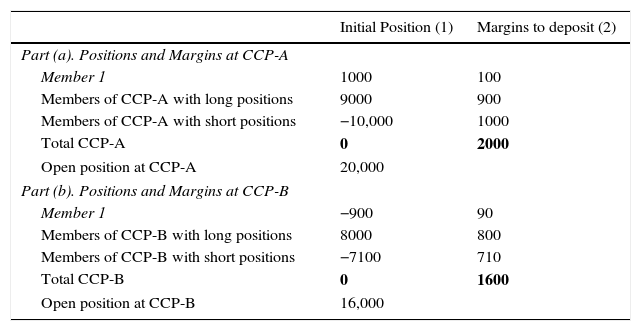
The value of the initial positions and the associated Margins are shown in Table 1. Short positions (obligation to deliver securities) are represented as negative figures, while long positions (obligation to receive and pay for securities) are presented as positive. The sum of long and short positions at each CCP equals zero, showing the balanced position of the CCP: it only buys if simultaneously sells and vice versa.
Initial Positions without Interoperability.
| Initial Position (1) | Margins to deposit (2) | |
|---|---|---|
| Part (a). Positions and Margins at CCP-A | ||
| Member 1 | 1000 | 100 |
| Members of CCP-A with long positions | 9000 | 900 |
| Members of CCP-A with short positions | −10,000 | 1000 |
| Total CCP-A | 0 | 2000 |
| Open position at CCP-A | 20,000 | |
| Part (b). Positions and Margins at CCP-B | ||
| Member 1 | −900 | 90 |
| Members of CCP-B with long positions | 8000 | 800 |
| Members of CCP-B with short positions | −7100 | 710 |
| Total CCP-B | 0 | 1600 |
| Open position at CCP-B | 16,000 | |
Part (a) of Table 1 contains the initial position at CCP-A. Column (1) presents the positions of the different Members: Member 1 is long 1000, the rest of Members with long positions are long 9000 and the Members with short positions are short (minus) 10,000. Margins for each group, presented at column (2), are 10% of these figures.
Part (b) of Table 1 has the same columns and contains the positions at CCP-B, where Member 1 is short (minus) 900, the rest of Members with short positions are short (minus) 7100 and the Members with long positions add up to 8000. Margins are, again, 10% of these figures and are presented in column (2).
Finally, the Table presents the Open Position at each CCP. At CCP-A it is 20,000, while at CCP-B, it amounts to 16,000. Open Position is the sum of the absolute value of the positions and is the basis for the calculation of risks. Margins are, in fact, a percentage of Open Position. Open Position is also called Open Interest; both expressions have the same meaning.
Table 2 is a summary of the Margins to be covered by each Member. It presents the information on Table 1 aggregated for the two CCPs analyzed. Member 1 has to contribute Margins to both CCPs, for a total of 190: 100 at CCP-A plus 90 at CCP-B. The rest of Members, clearing only through one CCP, have to contribute Margins only to their respective CCP. Without Interoperability, total Margins contributed by the whole market amount to 3600. CCP-A receives 2000 of such total, while 1600 go to CCP-B.
Summary: Margins to deposit without Interoperability.
| Margins at CCP-A (1a) | Margins at CCP-B (1b) | Total margins (3) | |
|---|---|---|---|
| Member 1 | 100 | 90 | 190 |
| Members of CCP-A with long positions | 900 | - | 900 |
| Members of CCP-A with short positions | 1000 | – | 1000 |
| Members of CCP-B with long positions | – | 800 | 800 |
| Members of CCP-B with short positions | – | 710 | 710 |
| Total market | 2000 | 1600 | 3600 |
Suppose that CCP-A and CCP-B enter into an Interoperability Arrangement, duly authorized and properly implemented. Member 1 can now make use of the new Arrangement and concentrate all its positions in its CCP of choice, say in CCP-A. For this concentration to effectively occur, the following legal movements have to take place:
- a)
Member 1 transfers its short position at CCP-B to the account opened in this CCP by CCP-A. From CCP-B's point of view, then, the counterparty of this position has changed to CCP-A. Member 1 needs no longer be a Member of CCP-B.
- b)
CCP-A simultaneously books the short position at Member 1's account in CCP-A. With all the long and short positions in the same clearing account, Member 1 can consolidate them and have its account at CCP-A reflect its true, reduced position.
- c)
To keep its balance, CCP-A books an opposing position at CCP-B's account. From CCP-A's point of view, the position recognized to Member 1's account is compensated by an opposing position held by CCP-B. This CCP-B's position at CCP-A mirrors the position of CCP-A at CCP-B mentioned in a) above.
European Authorities have realized that the crossing of positions between interoperating CCPs increases the risk of contagion from one CCP to the other should a problem appear in one of them. To contain the spreading of contagion – systemic risk – European Authorities9 have imposed on interoperating CCPs the obligation to cross-margin each other applying their respective standard margining procedures. Such crossed Margins have to be pre-funded, financed by the Members and additional to the standard position Margins. In practical terms and referred to the example, it means that CCP-A has to collect additional Margins from its Members to post them at CCP-B and that CCP-B has to ask its Members for extra Margins to cover the demand from CCP-A. These extra Margins are the Interoperability Margin.
Total Margins under Interoperability are, then, composed of two addends:
- 1.
Margins from Position, which in the example are a direct percentage of the Open Position of each Member, plus
- 2.
The part of the Interoperability Margin allocated to each Member.
Each addend is analyzed separately in the following paragraphs, before finding the total.
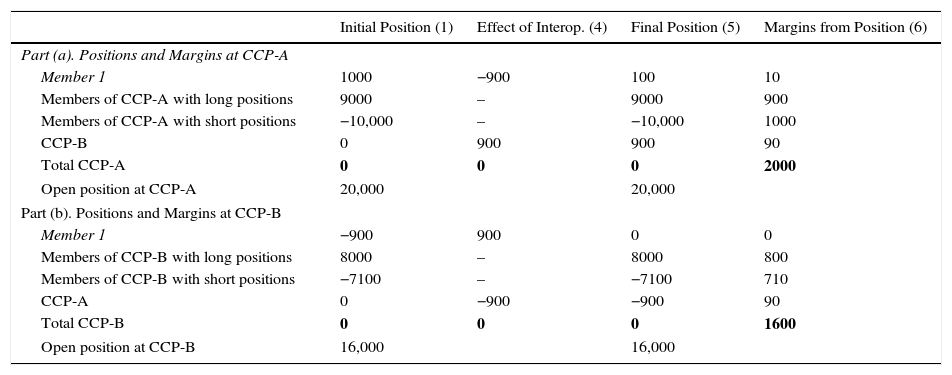
4.1Margins from PositionTable 3 presents the situation at both CCPs after Member 1 has made use of the Interoperability Arrangement, concentrating all its positions in CCP-A. The table has two parts: part (a) on the upper half, presents the positions at CCP-A; part (b), on the lower half, reflects the positions at CCP-B.
After Interoperability, Member 1 concentrates all its positions in CCP-A.
| Initial Position (1) | Effect of Interop. (4) | Final Position (5) | Margins from Position (6) | |
|---|---|---|---|---|
| Part (a). Positions and Margins at CCP-A | ||||
| Member 1 | 1000 | −900 | 100 | 10 |
| Members of CCP-A with long positions | 9000 | – | 9000 | 900 |
| Members of CCP-A with short positions | −10,000 | – | −10,000 | 1000 |
| CCP-B | 0 | 900 | 900 | 90 |
| Total CCP-A | 0 | 0 | 0 | 2000 |
| Open position at CCP-A | 20,000 | 20,000 | ||
| Part (b). Positions and Margins at CCP-B | ||||
| Member 1 | −900 | 900 | 0 | 0 |
| Members of CCP-B with long positions | 8000 | – | 8000 | 800 |
| Members of CCP-B with short positions | −7100 | – | −7100 | 710 |
| CCP-A | 0 | −900 | −900 | 90 |
| Total CCP-B | 0 | 0 | 0 | 1600 |
| Open position at CCP-B | 16,000 | 16,000 | ||
The first column10 in Table 3 is just the Initial Position before interoperability, presented at Table 1 as column (1). The second column, labelled Effect of Interoperability, (4), includes the movements of positions implied by Interoperability: reduction of Member 1's position at CCP-B, compensated by a “new” position booked at CCP-A's account; and booking of the interoperated position in Member 1's account at CCP-A, balanced by the registration of the opposite position at CCP-B's account in CCP-A. Interoperability used by just one Member does not affect the Total Open Position at either CCP.
Column (5) presents the Final Position of each group of Members at the two CCP's. The only difference with the positions before interoperability appears in Member 1 – not surprisingly, as it is the Member transferring the position – and in the appearance of CCP-B as position holder at CCP-B and, correspondingly, of CCP-A as position holder in CCP-B for exactly the same amount. This cross-position between the two CCP's is, in fact, the means and the consequence of Member 1 making use of Interoperability.
The final column (6) is the direct calculation of Margins to be covered by Members related to their respective positions. They are calculated as 10% of the Final Position, following the simple margining model used in this example.
Column (6) includes Margins to be posted by CCP-B at CCP-A and by CCP-A at CCP-B. As each CCP maintains a position at the other, it should be subject to the same margining rules than all the Members, to keep the CCP protected and to contain systemic risk. In terms of the example, it means that some allocation rule has to be applied: Members of CCP-B have to finance among them the 90 that this CCP have to deposit at CCP-A; and, in parallel, the Members of CCP-A have to finance the 90 that this CCP has to constitute at CCP-B. As the Interoperated Open Position is obviously the same and as both CCPs are applying the same margining model, the Interoperability Margin to be crossed between the two CCPs is the same in both directions.
4.2Interoperability MarginCCPs allocate the Interoperability Margin to its Members following a proportionality rule. The Interoperability Margin to be transferred to the interoperating CCP is financed by Members proportionally to their respective weight on Open Positions on Securities clearable through the Interoperability agreement.
The allocation rule utilized in this example is very simple: each CCP allocates the Interoperability Margin among its Members proportionally to the Position Margins of each Member. This allocation rule is a fair representation of the rules actually applied by CCPs in the real world.11
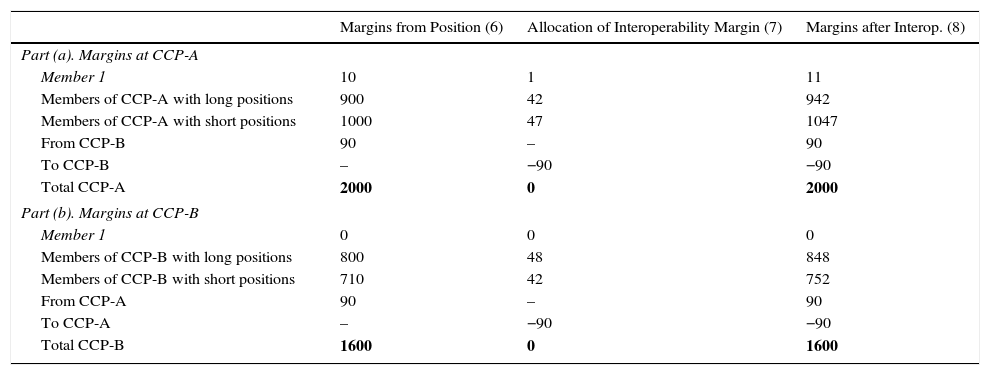
The allocation rule means that every Member will have to constitute Deposits additional to the pure position-related ones previously calculated in Table 3. The calculation of these extra Margins and its allocation among the different Members are presented in Table 4. This Table, again, includes in the upper half, Part (a), the situation at CCP-A, while the lower half, Part (b), presents the calculations for CCP-B.
Margins to Deposit after Interoperability.
| Margins from Position (6) | Allocation of Interoperability Margin (7) | Margins after Interop. (8) | |
|---|---|---|---|
| Part (a). Margins at CCP-A | |||
| Member 1 | 10 | 1 | 11 |
| Members of CCP-A with long positions | 900 | 42 | 942 |
| Members of CCP-A with short positions | 1000 | 47 | 1047 |
| From CCP-B | 90 | – | 90 |
| To CCP-B | – | −90 | −90 |
| Total CCP-A | 2000 | 0 | 2000 |
| Part (b). Margins at CCP-B | |||
| Member 1 | 0 | 0 | 0 |
| Members of CCP-B with long positions | 800 | 48 | 848 |
| Members of CCP-B with short positions | 710 | 42 | 752 |
| From CCP-A | 90 | – | 90 |
| To CCP-A | – | −90 | −90 |
| Total CCP-B | 1600 | 0 | 1600 |
The actual calculations for allocating the Interoperability Margin are very simple.
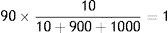
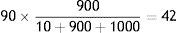
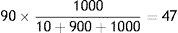
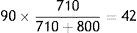
In the case of CCP-A, the Interoperability Margin to allocate is 90. The Margins from Position for the different groups of Members are, as per Table 3, 10 for Member 1, 900 for the Members with long positions and 1000 for the Members with short positions. The allocation of the Interoperability Margin is, then:
- a)
Member 1
- b)
Members with long positions
- c)
Members with short positions
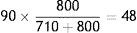
In the case of CCP-B, the Interoperability Margin to allocate is 90. The Margins from Position for the group of Members with short positions are 710, as per Table 3. The Members with long positions have to post 800. The allocation of the Interoperability Margin is:
- a)
Members with short positions:
- b)
Members with long positions:
These calculations are included in Table 4. The first column in Table 4, marked (6), is simply a reproduction of the last column of Table 3 and reflects the position-related Margins to post by each Member. This column includes the Margin that each CCP has to post to the other (90 each in the example). The second column distributes this last amount among the Members of each CCP, applying the allocation rule, with the figures rounded to the nearest integer. In this column, the Margin to post at the other CCP is presented with a minus sign, to reflect the fact that these assets will be transferred precisely to the other CCP. The third and final column (8) is the horizontal sum of the Position Margin plus the Interoperability Margin and is the total guarantee to provide by each Member to the corresponding CCP.
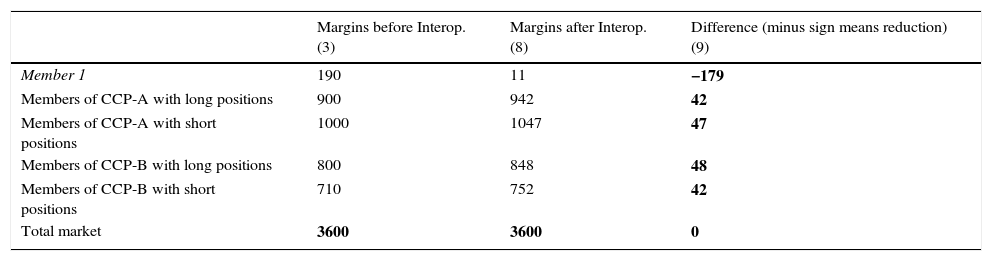
5Comparison: before and after InteroperabilityInteroperability changes the distribution of Margins among Members. Table 5 presents this re-distribution among Members in the case of the example of CCP-A and CCP-B.
Comparison of Margins to deposit before and after Interoperability.
| Margins before Interop. (3) | Margins after Interop. (8) | Difference (minus sign means reduction) (9) | |
|---|---|---|---|
| Member 1 | 190 | 11 | −179 |
| Members of CCP-A with long positions | 900 | 942 | 42 |
| Members of CCP-A with short positions | 1000 | 1047 | 47 |
| Members of CCP-B with long positions | 800 | 848 | 48 |
| Members of CCP-B with short positions | 710 | 752 | 42 |
| Total market | 3600 | 3600 | 0 |
Table 5 presents in two columns the Margins to be covered by Members before and after Interoperability. The column “Margins before Interoperability”, marked (3), comes from Table 2 and includes the Margins to be covered by each Member before the two CCPs entered into the Interoperability Arrangement. Member 1 had to post 190 in collateral; all the other Members of CCP-A had to cover 1900 (=900+1000); and the rest of CCP-B's Members had to deposit 1510 (=800+710).
The second column, marked (8), comes from Table 4. It includes the Margins to be covered by each Member after the two CCPs have entered into their Interoperability Arrangement and Member 1 has made use of it, concentrating all its positions in CCP-A. In this new institutional setup, with the two CCPs linked to each other, Member 1's Margin has reduced to 11; the rest of CCP-A's Members have to post 1989 (=942+1047); and all the other Members of CCP-B have to post 1600 (=848+752).
The third column, (9), is the difference between the previous two columns. It is calculated as “Margins After” minus “Margins Before”. Thus, a negative sign in this column means that the corresponding Member is enjoying a reduction in Margins (Margins After are minor than Margins Before). A positive sign in this column means that the affected Member has to post more collateral after Interoperability. In the example, Member 1 – the Member that made use of Interoperability – saves 179 in collateral (equivalent to 94% of its total before).
The rest of Members of CCP-A face an increase in Margins of 89 (=42+47) while the rest of Members of CCP-B have to increase their deposits in 90 (=48+42) as compared to the situation prior to Interoperability. The savings of Member 1 are exactly equal to the extra Margins called on the rest of Members. In other words: the rest of Members finance the savings of the Member making use of Interoperability.
Particularly worth of attention is the situation of the Members remaining at CCP-B (the CCP “losing” the position). As their CCP has to post (new) Margins to CCP-A, these Members have to provide more collateral just because Member 1 has decided to move its position to a different CCP through Interoperability. This conclusion is very robust and is not dependant on the example used.
Members can only escape the negative impact of Interoperability by making use of it, reaching a level of savings such that they get a reduction in Margins higher than the increase caused by the emergence of the Interoperability Margin. Members who are active in only one market, or do not maintain significant offsetting positions (buy-side firms), or are not big enough to become Members of several CCPs, are forced to provide more collateral as a consequence of Interoperability.
In the real world, Interoperability is not a one-movement, one-player game: each and every Member can make use of it, concentrating all its positions in one CCP, netting them as much as possible, thus minimizing collateral claims. But, each movement by a different Member will produce exactly the same kind of consequences just described: that particular Member will enjoy a reduction in collateral and will affect the cross-CCP Open Position and the Interoperability Margin accordingly. The final effect of all this moves by all Members is not straightforward to estimate. It depends on three things: the relative size of the Members affected; the percentage of netting achieved by each of them (with greater benefits for the Members with higher offsetting positions); and the balancing effects of the positions being transferred from one CCP to the other, that is, the size of the Interoperability Margin. The Technical Appendix gives some further insights on these aspects.
6Conclusions of the comparisonThe main conclusions of the simple example presented are the following:
- 1.
Each Member making use of the Interoperability Arrangement saves Margins proportionally to the netting effect materialized. This is accompanied by an increase in the Margins to be posted by the rest of Members.
- 2.
With just one Member interoperating, it is a zero-sum game: the gain of one player is exactly equal to the loss of the other players.
- 3.
When several Members make use of Interoperability, each of them will benefit from the netting-related savings and will have to contribute to the Interoperability Margin. The final impact on each Member will depend on its own size, its own netting percentage and the total size of the Interoperability Margin.
- 4.
At the end, some Members will gain and others will lose. Interoperability will change the distribution of Margins among Members. Not much can be said in general terms about the specific shape of such redistribution, except that Members with a netting percentage above the average will win and Members whose netting ratio is below the average will lose. With this information, we can make a guess on likely winners and likely losers:
- •
Likely winners: Members very active in several trading venues with big netting opportunities. This points to HFTs, big international Investment Banks, and hedge funds. “Core banks”, in other words.
- •
Likely losers: players not having significant offsetting opportunities. This points to small Brokers, local Members and final investors, i.e. “Periphery participants”.
- •
As Interoperability implies a transfer of capital from losers to winners, it is not a Pareto-optimal solution: the gains for some Members are achieved at the expense of other Members, whose situation is worsened. In this sense, Interoperability is not a solution that is unambiguously better than the alternatives.
7Final remarksInteroperability brings about winners and losers and a redistribution of capital among Members. Why are European Authorities promoting it?
One possible rational answer is that capital in the hands of HFTs, big Investment Banks and Hedge Funds is socially preferred to capital in the hands of Local Banks and Final Investors. This idea is, to say the least, debatable.
It can be expressed in a different way: if the only reason for legally enforcing Interoperability is the increase in efficiency, it is a wrong argument. In fact, even if Interoperability reduced Total Margins to be posted by the whole market, it does so at the price of having some Members worsening their position. This is not an efficiency improvement in the traditional economic sense. It implies a redistribution of wealth among participants that can only be justified if either the social cost of the market failure being addressed is high enough or if the profits of the winners have more social value than the losses of the losers.
Something to remember is that Members making use of Interoperability have positions in several CCPs because they have found it profitable to do so. They have not been forced to trade at different trading venues by the legislation or in pursuit of the social good; they have traded at different trading venues because it maximizes their private profits. No doubt, Interoperability will increase the profitability of such operations, but at an opportunity cost. Interoperability is not a free lunch.
This cost is paid by the smaller, local, buy-side Members who have to come up with more capital. For these Members, Interoperability is not necessarily a winning operation: they have to bear the cost of extra capital consumption and added systemic risk in exchange for facilitating the operations of the big Members.
The main conclusion is that Interoperability desirable effects do not come about for free: they have consequences on the distribution of capital consumption among Members. This is not a minor consequence that can be lightly disregarded: the level of capital is now one of the most sensitive topics in the banking industry. By affecting the distribution of capital among Members, Interoperability is improving the competitive position of a selected group of Members while worsening the position of all the other market participants. This consideration should be included as one of the valid legal reasons for rejecting an Interoperability Arrangement.
The author wishes to thank the very helpful comments made to previous versions of this paper by Nadia Calviño, Santiago Carrillo, Domingo GarcíaCoto, Javier Garrido, Ignacio Solloa, Mikel Tapia, Jorge Yzaguirre, Jose Antonio Zamora, Antonio Zoido and an unkown editor. Their assistance does not mean that they share the views expressed in the paper, which are, like any remaining errors, the exclusive responsibility of the author.
The author has been CEO of MEFF (a derivatives exchange with an embedded CCP) and is currently an employee of BME, a European listed company that manages a CCP, among other financial market infrastructures. The views expressed in this paper do not necessarily reflect those of BME or any of its affiliates.
This appendix includes an outline of the model underlying the example presented in this paper. This model is an extension of Mägerle and Nellen's (2011). The main difference is that in the present version of the model we explicitly allow for different kinds of participants in each CCP, looking for impacts on the distribution of Margins among Members. This idea is present in Heath, Kelly, and Manning (2013) with their core-periphery description; Pirrong (2007, 2011), in the context of derivatives clearing, also analyses clearing setups with different kinds of participants, which he labels “heterogeneity”. Garratt and Zimmerman (2015) develop a similar setup, in the context of a realistic financial network.
Like Mägerle and Nellen's, this model considers CCP clearing of a cash instrument, which is the case for the Interoperability links actually implemented in Europe.
The structure of the market defined for the model is the following:
- 1.
There are two CCPs, CCP-A and CCP-B, both clearing the same cash instrument.
- 2.
CCP-A has K Members, while CCP-B has R Members.
- 3.
The CCPs have some Members in common:
- a
Members from 1 to na have positions in both CCPs and will concentrate all their positions at CCP-A, once interoperability is implemented.
- b
Members from na+1 to nb also maintain positions at both CCPs and will move all their positions into CCP-B once the interoperability arrangement is in place.
- c
Members from nb+1 to nK work only with CCP-A and they will continue clearing only with CCP-A after interoperability.
- d
Members from nK+1 to nR work only with CCP-B and they will continue clearing only with CCP-B.
- a
In this technical appendix, we analyze the situation of one of the Members, generically identified as Member i. This Member will make use of Interoperability once it is established and will concentrate all its positions at CCP-A.
Let xm,i be the mth transaction of Member i at CCP-A. Long positions (obligation to receive the security and pay in cash for it) are presented with positive sign, while short positions (obligation to deliver the security) have negative sign. Then, if Member i has entered into a total of Ti transactions, we have that

Xi is the net position at CCP-A of Member i, which can be positive or negative.
If μ (0<μ<1) is the rate applied to the position for calculating the Margins and denoting by CMiA the Margins to be posted by Member i at CCP-A, we have:

That is, Margins to be posted by Member i at CCP-A are the product of the absolute value of the positions at that CCP, multiplied by μ.
Doing the same for CCP-B, and denoting by yl,i the lth transaction of Member i at CCP-B:
where Yi is the net position at CCP-B of Member i. Again, Yi can be positive or negative.
Assuming that both CCPs apply the same margining policy, μ is also the rate applied for calculating the Margins at CCP-B; denoting by CMiB the Margins to be posted by Member i at CCP-B, we have:

Total Margins to be posted by Member i before interoperability are the sum of (2) plus (4):
If we now suppose that CCP-A and CCP-B implement an interoperability arrangement, allowing their respective Members to move positions from one CCP into the other, Member i will concentrate all its positions at CCP-A, moving the positions that it previously had at CCP-B to CCP-A.
The position that Member i transfers to CCP-A from CCP-B is Yi. Member i increases its position at CCP-A in this amount, diminishing at the same time its position at CCP-B in an equal sum.
If we call Xi* the position of Member i at CCP-A after interoperability, we have:

Obviously, the position of Member i at CCP-B after interoperability is zero:
And Margins to post at CCP-A by Member i after interoperability, denoted by CMPiA are:

We can make two additional simplifying assumptions:
- a)
After interoperability, Members concentrate all their clearing activity on the CCP where they had the bigger position before such facility was implemented.
- b)
Members only undertake the transfer of balances from one CCP to the other if it allows them to net offsetting positions.
These two assumptions applied to the case of Member i mean the following:
- a)
Xi≥Yi
- b)
Xi+Yi=Xi−Yi=Xi*
And substituting b) in (8), we get:

Expression (9) is no more than:

In (10), we have made use of (2) and (4). The meaning of this expression is straightforward: after interoperability, Total Margins to post by a Member making use of the transfer-of-positions facility are the difference between such Member's Margins1212 If b) does not hold, the Member would not be netting. Then CMPiA would be equal to CMiTOT, and Member i would not save any collateral. As interoperability implies the need to finance the Interoperability Fund, it would mean that Member i was consciously making the decision to raise its own consumption of collateral. Thus b) can be considered an assumption of Member i's rational behaviour.
On top of posting its position-related Margins according to (10), after interoperability Member i will have to contribute to financing its pro-rata part of the Interoperability Margin. Denoting by IOPM the total Interoperability Margin to be funded by all the Members, and expressing by αi the fraction of the Interoperability Margin that has to be funded by Member i, we have the following:

Obviously, ∑αi=1.
Once the allocation fraction for each Member is defined, the actual amount to finance by each of them is simply:

Total Margins to post by Member i after Interoperability, denoted by CMPTiA, are the sum of the position-related Margins (9) plus the allocation of the Interoperability Margin (12). Note that, as Member i is only clearing with CCP-A after Interoperability, Margins at CCP-A are the same than Total Margins, because, as a consequence of Interoperability, Member i no longer maintains a position at CCP-B nor has to post any Margins at this CCP.

Making use of (10), Eq. (13) can also be formulated

Finally, to compare Margins before and after the implementation of the Interoperability arrangement, and denoting by DiTOT the difference in Margins after minus Margins before, i.e. expression (14) minus expression (5) yields the result:

In words, after Interoperability, Member i will concentrate all its positions at CCP-A. As a consequence, it will have a difference in Margins that can be positive or negative, depending on the relative size of the allocated part of the Interoperability Margin and on the double of Margins previously posted at CCP-B, the CCP it is no longer using.
Savings in collateral for Member i are twice the Margins that it was posting at the smaller CCP before interoperability. This result is quite intuitive: one source of savings comes from the fact that Margins at CCP-B do not have to be posted any more, because the position has been transferred to CCP-A. The Member also saves Margins at CCP-A, because the transferred positions are netting the “old” ones (in the example at a 100% rate), in precisely the amount corresponding to the netting effect achieved. In summary, the transfer of positions generates double savings, one at each CCP, in one case because the position disappears and in the other because of netting.
On the other hand, Member i will have to finance its allocated part of the Interoperability Margin. This comes as a negative effect of interoperability. The final result for Member i will depend on the combination of these two components.
At this stage, not much can be said about the final impact on Member i's Margins, without making more assumptions on the values (or their distribution) of the different variables involved. In any case, from (15) it stands out that:
- •
The bigger the position at CCP-B (where the Member had its smaller position), the bigger the saving of collateral.
- •
The smaller the Interoperability Margin, the bigger the saving of collateral.
- •
The smaller the allocation quota (αi) of the Interoperability Margin, the bigger the saving of collateral. At the same time, αi is a function of the netting achieved by Member i, expressed in the first point of this list.
- •
Obviously, even if Member i is not making use of interoperability, it will still have to finance its allocated part of the Interoperability Margin: the second part of (15) will be zero, but the first part will have a positive value.
EMIR, art.51.3. “Entering into an interoperability arrangement… shall be rejected or restricted only in order to control any risk arising from that arrangement”.
It would be like defending that Ford has a monopoly because it is the only manufacturer of the Fiesta model.
In the US, interoperability is not a pressing issue, probably due to a different institutional setup.
ESMA's Guidelines and Recommendations (ESMA, 2013).
Implementation by the Bank of England of ESMA's Guidelines and Recommendations (Bank of England, 2015).
This is precisely the assumption modified in the present paper, where we explicitly introduce a higher degree of heterogeneity among Members.
Following Mägerle and Nellen (2011).
As mentioned in Notes 4 and 5 above.
The number of each column is maintained throughout the paper, to facilitate tracking the different figures presented.
For instance, EuroCCP's Regulation of the Interoperability Fund states: “1.2. Percentage per Clearing Participant. The percentage which will be allocated to each Clearing Participant as referred to in paragraph 7.2.3 (b) of the Clearing Rule Book will be determined as follows: The average Margin based on the previous thirty (30) Clearing Days of the Clearing Participant's Open Positions in Securities which can be settled through the Co-operating Clearing Houses divided by the average Margin based on the previous thirty (30) Clearing Days of all Open Positions in Securities which can be settled through the Co-operating Clearing Houses. This calculation is performed on a monthly basis by EuroCCP at the beginning of each month. Reporting of the percentage will be done within two (2) Clearing Days after the calculation, but always within the first five (5) Clearing Days of each month. The percentages will apply as from the first Monday following reporting.” (EuroCCP, 2014).
If b) does not hold, the Member would not be netting. Then CMPiA would be equal to CMiTOT, and Member i would not save any collateral. As interoperability implies the need to finance the Interoperability Fund, it would mean that Member i was consciously making the decision to raise its own consumption of collateral. Thus b) can be considered an assumption of Member i's rational behaviour.