


Non-HDL cholesterol (non-HDL-C) is becoming relevant both in its participation in cardiovascular risk assessment and as a therapeutic target. The objective of the present study was to assess the independent predictive capacity of both non-HDL-C and LDL-C (the main priority in dyslipidemias to reduce cardiovascular risk), in cardiovascular morbidity in a population-based sample.
MethodsA prospective cohort study involving 1186 individuals in the non-HDL-C group and 1177 in the LDL-C group, followed for 10.7years (SD=2.2), who had not had any previous cardiovascular event. The predictor variables included in the adjustment were: gender, age, arterial hypertension, diabetes mellitus, smoker status and non-HDL-C in one group. In the other group, consisting of patients presenting TG levels of 400mg/dl, non-HDL-C was replaced by LDL-C. Survival curves (Kaplan–Meier) were calculated and two Cox regression models were applied, one for each group.
ResultsNon-HDL-C group presented 6.2% of non-fatal cardiovascular episodes during follow-up and the LDL-C group 6.0%. After adjustment, for each 30mg/dl increase in non-HDL-C, the incidence of new non-fatal cardiovascular events increased by 31% (HR=1.31, 95% CI: 1.06–1.61; p=0.018) and in the LDL-C group by 27% (HR=1.27, 95% CI: 0.97–1.61, p=0.068).
ConclusionsAfter a follow-up of 10.7years, non-HDL-C has been shown in our population as a prognostic factor of non-fatal cardiovascular disease, but not LDL-C, although its HR is close to statistical significance.
El colesterol no transportado por las lipoproteínas de alta densidad (c-no-HDL) está adquiriendo relevancia en su participación en la valoración del riesgo cardiovascular y como diana terapéutica. El objetivo del presente estudio ha sido valorar la capacidad predictiva independiente, tanto del c-no-HDL como del colesterol de las lipoproteínas de baja densidad (cLDL), principal prioridad en las dislipidemias para reducir el riesgo cardiovascular (RCV), en la morbilidad de causa cardiovascular, en una muestra de origen poblacional.
MétodosEl diseño del estudio corresponde a una cohorte prospectiva en la que han participado 1.186 individuos en el grupo c-no-HDL y 1.177 en el grupo cLDL, seguidos durante 10,7años (DE=2,2), los cuales no habían padecido ningún episodio cardiovascular (CV) previo. Las variables predictoras incluidas en el ajuste han sido: género, edad, hipertensión arterial, diabetes mellitus, estado de fumador y c-no-HDL en un grupo. En el otro grupo, formado por pacientes que presentaban niveles de triglicéridos ≤400mg/dl, se sustituyó el c-no-HDL por el cLDL. Se calcularon curvas de supervivencia (Kaplan-Meier) y se aplicaron dos modelos de regresión de Cox, uno por cada grupo.
ResultadosEl grupo c-no-HDL presentó un 6,2% de episodios CV no mortales durante el seguimiento, y el grupo cLDL, un 6,0%. Después del ajuste, por cada aumento de 30mg/dl de c-no-HDL, la incidencia de nuevos episodios CV no mortales aumentó un 31% (HR=1,31; IC 95%: 1,06-1,61; p=0,018) y en el grupo del cLDL un 27% (HR=1,27; IC 95%: 0,97-1,61; p=0,068).
ConclusionesTras un seguimiento de 10,7años, el c-no-HDL se ha mostrado en nuestra población como un factor pronóstico de enfermedad CV no mortal, pero no el cLDL, aunque su HR se encuentra próxima a la significación estadística.
It is now more than 100 years since 1910 when Adolf Windaus1 first observed that caseous plaques from human aortas contained 25-fold more cholesterol than normal aortas, and the Miller brothers2 later observed the protective effect of high-density lipoprotein cholesterol (HDL-C) against coronary heart disease. Since that time, the concept of cardiovascular disease risk factors (CVRF), a generalised term coined in the Framingham cohort study,3 has been consolidated to include total cholesterol (TC) and decreased HDL-C levels.
Numerous prospective cohort studies, clinical trials and meta-analyses have provided sufficient evidence of the impact of such factors on the onset of cardiovascular morbidity and mortality, and have therefore been used as the basis for successive guidelines in order to prevent cardiovascular diseases (CVD) due to atherosclerosis, which continues to be of paramount importance.4 Recently, the latest two guidelines published on CVD prevention5 and the diagnosis and management of dyslipidaemias6 both consider low-density lipoprotein cholesterol (LDL-C) to be the primary target of therapy. This does not tend to be calculated by direct measurement but rather indirectly using the Friedewald formula (FF),7 which in turn depends on fasting triglyceride (TG) levels, and can only be estimated if TG≤400mg/dl. Nevertheless, other authors consider that lower TG figures (between 200 and 400mg/dl) may still distort the actual LDL-C value and should be used with caution in certain pathologies, such as diabetes mellitus (DM), kidney failure and liver disease.8
However, in addition to LDL-C, non-HDL cholesterol (non-HDL-C), calculated by subtracting HDL-C from total cholesterol, represents the cholesterol content present in atherogenic lipoproteins (i.e. apolipoprotein B (apoB)-containing lipoproteins: very low-density lipoproteins (VLDL), VLDL remnants, intermediate-density lipoproteins (IDL) and lipoprotein(a)) and could therefore be an alternative to LDL-C as the treatment target since, in addition to avoiding fasting and problems with applying the FF in the aforementioned pathologies, it has been observed to possibly be a better or at least a similar predictor of CVD than LDL-C, although this aspect has not yet been clarified.6
Therefore, the main objective of this study was to assess the predictive capacity of both non-HDL-C and LDL-C, when the FF (TG≤400mg/dl)6 is applicable to its calculation, in the onset of new non-fatal cardiovascular events in a prospective Spanish population-based cohort.
Material and methodsThe cohort study involved two examinations: the first in 1992–1994 and the second in 2004–2006. The study sample was taken from the general population aged 18 years or above and was obtained by two-stage, stratified, random sampling with stages proportional to the size of the population from which participants were selected. A description of the population included at the first examination cycle has already been given in other publications.9,10 At the second examination cycle, 10–14 years after the first examination, data on non-fatal cardiovascular events, individuals with no such events at the end of the study and losses to follow-up were collected, along with the date of each event that occurred. This information was obtained through face-to-face interviews and confirmation from the patient's medical records.
Non-fatal CVDs recorded during follow-up included: any kind of clinically documented angina; myocardial infarction with a clinical report including enzyme activity, ultrasound and/or angiography, or definitive determination with baseline ECG; stroke in the event of permanent and objectified neurological deficit, or when neurological symptoms and/or signs were observed and resolved ad integrum and which attending physicians attributed to a transient ischaemic attack and peripheral artery disease, documented in the clinical report. Data on events were collected on a single occasion and for the first time.
Participants and variables included in the studyParticipants from the cohort who had not suffered any CVD were included in this study. The variables included in the analysis were the main CVRFs and those variables included in the adjusted multivariable analysis, which were similar to those assessed by the SCORE system6: age, gender, hypertension (HTN), DM, smoker status and non-HDL-C in one model, and the same variables in the other model but with LDL-C instead of non-HDL-C, for the population with TG≤400mg/dl in order to be able to calculate this parameter using the FF (LDL-C=TC−[HDL-C+TG/5]).7 A patient was considered to have hypertension when systolic blood pressure (SBP) or diastolic blood pressure (DBP) was greater than or equal to 140 and 90mmHg, respectively, or the patient was receiving drug treatment,11 and to have DM when fasting plasma glucose levels were ≥126mg/dl (checked on two occasions) or the patient was being treated with oral antidiabetic drugs or insulin.12 Any participant who smoked on a daily basis was considered a smoker, regardless of the quantity smoked.13 Body mass index (BMI) was calculated by dividing the weight in kilograms by the square of the height in metres (kg/m2) and obesity was divided into 3 categories according to BMI values: healthy weight between 18.5 and 24.9; overweight between 25 and 29.9, and obese≥30.14
Statistical analysisData were analysed using the software SPSS 15.0 (SPSS for Windows, 15.0, SPSS Inc., Chicago, IL). Qualitative variables are expressed as an exact value and percentage, while quantitative variables are expressed as the mean and standard deviation (SD). The association between qualitative variables was examined using the chi-square test or the Mantel–Haenszel test to test for a linear trend across groups. Means were compared using the Student's t-test for independent groups or the Mann–Whitney U test if the conditions of normality (using the Kolmogorov–Smirnoff or Shapiro–Wilk tests) were not met. When comparing more than two means, a one-way analysis of variance with Bonferroni a posteriori contrast was used. Both non-HDL-C and LDL-C were categorised based on tertile distribution of the sample. The probability of survival in these three groups was calculated by means of the Kaplan–Meier method, using the log-rank test to compare groups. The survival analysis takes into consideration both the time until the outcome of interest occurs and the time to end of follow-up due to other causes, such as not having any event at the end of the study or losses to follow-up for any reason, with participants in this situation known as censored individuals (and the time known as censored time), i.e. when follow-up ends in these individuals for a reason other than the event studied. The Cox regression model was used to identify variables with prognostic significance, checking the proportional hazards assumption using the Schoenfeld residual analysis.15 In this model, the relationship between non-HDL-C and LDL-C and the onset of new cardiovascular events was adjusted for age, gender, HTN, DM and smoker status. In hypothesis tests, the maximum error rate, alpha, was set at equal to or less than 5%.
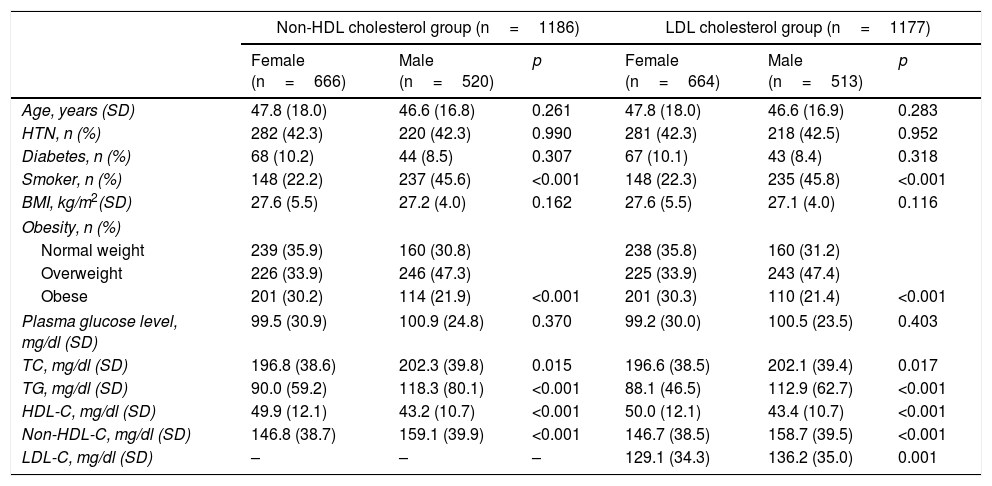
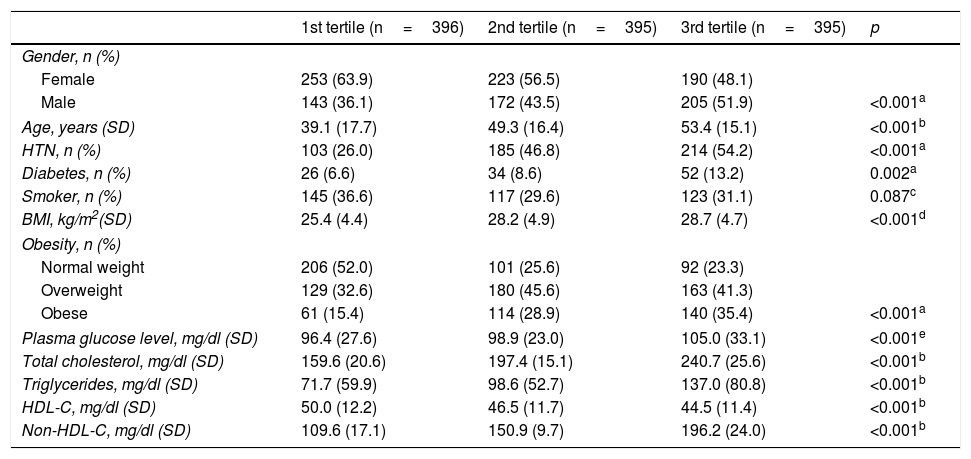
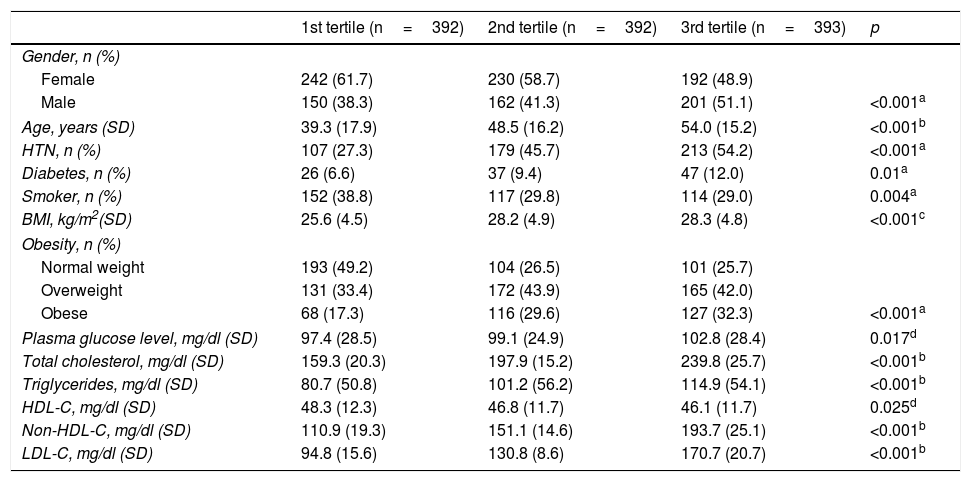
ResultsA total of 1322 individuals over the age of 18 from the census population of the province of Albacete participated in the first examination. After excluding 80 patients due to prior CVD and 56 due to a lack of laboratory results, 1186 participants were left in the non-HDL-C group. After then excluding 9 patients due to having TG>400mg/dl, the sample left to assess the prognostic value of LDL-C included 1177 individuals. Table 1 shows the main CVRFs in the non-HDL-C and LDL-C groups distributed by gender. Given that most cholesterol is transported in LDL, the results in both groups follow the same trend, with the table showing that CVRFs are more common in men (except for obesity) than women, and there are no significant differences in age, DM and HTN. Tables 2 and 3 show the relationship between these variables split into tertiles and the main CVRFs. These tables show that patients included in the third tertile, for both non-HDL-C and LDL-C, have significantly higher age, HTN, DM, BMI and obesity and a more unfavourable lipid profile, with this group therefore having a higher cardiovascular risk (CVR).
Cardiovascular risk factors associated with non-HDL and LDL cholesterol, distributed by gender.
| Non-HDL cholesterol group (n=1186) | LDL cholesterol group (n=1177) | |||||
|---|---|---|---|---|---|---|
| Female (n=666) | Male (n=520) | p | Female (n=664) | Male (n=513) | p | |
| Age, years (SD) | 47.8 (18.0) | 46.6 (16.8) | 0.261 | 47.8 (18.0) | 46.6 (16.9) | 0.283 |
| HTN, n (%) | 282 (42.3) | 220 (42.3) | 0.990 | 281 (42.3) | 218 (42.5) | 0.952 |
| Diabetes, n (%) | 68 (10.2) | 44 (8.5) | 0.307 | 67 (10.1) | 43 (8.4) | 0.318 |
| Smoker, n (%) | 148 (22.2) | 237 (45.6) | <0.001 | 148 (22.3) | 235 (45.8) | <0.001 |
| BMI, kg/m2(SD) | 27.6 (5.5) | 27.2 (4.0) | 0.162 | 27.6 (5.5) | 27.1 (4.0) | 0.116 |
| Obesity, n (%) | ||||||
| Normal weight | 239 (35.9) | 160 (30.8) | 238 (35.8) | 160 (31.2) | ||
| Overweight | 226 (33.9) | 246 (47.3) | 225 (33.9) | 243 (47.4) | ||
| Obese | 201 (30.2) | 114 (21.9) | <0.001 | 201 (30.3) | 110 (21.4) | <0.001 |
| Plasma glucose level, mg/dl (SD) | 99.5 (30.9) | 100.9 (24.8) | 0.370 | 99.2 (30.0) | 100.5 (23.5) | 0.403 |
| TC, mg/dl (SD) | 196.8 (38.6) | 202.3 (39.8) | 0.015 | 196.6 (38.5) | 202.1 (39.4) | 0.017 |
| TG, mg/dl (SD) | 90.0 (59.2) | 118.3 (80.1) | <0.001 | 88.1 (46.5) | 112.9 (62.7) | <0.001 |
| HDL-C, mg/dl (SD) | 49.9 (12.1) | 43.2 (10.7) | <0.001 | 50.0 (12.1) | 43.4 (10.7) | <0.001 |
| Non-HDL-C, mg/dl (SD) | 146.8 (38.7) | 159.1 (39.9) | <0.001 | 146.7 (38.5) | 158.7 (39.5) | <0.001 |
| LDL-C, mg/dl (SD) | – | – | – | 129.1 (34.3) | 136.2 (35.0) | 0.001 |
BMI: body mass index; HDL: high-density lipoproteins; HDL-C: cholesterol bound to HDL; HTN: hypertension; LDL-C: cholesterol bound to low-density lipoproteins; n: number of participants; non-HDL-C: non-HDL cholesterol; TC: total cholesterol; TG: triglycerides.
Quantitative variables are expressed as mean and standard deviation (SD); qualitative variables are expressed as exact value and percentage. The association between qualitative variables was examined using the chi-square test and means were compared using the Student's t-test for independent groups.
Cardiovascular risk factors associated with non-HDL cholesterol, split into tertiles.
| 1st tertile (n=396) | 2nd tertile (n=395) | 3rd tertile (n=395) | p | |
|---|---|---|---|---|
| Gender, n (%) | ||||
| Female | 253 (63.9) | 223 (56.5) | 190 (48.1) | |
| Male | 143 (36.1) | 172 (43.5) | 205 (51.9) | <0.001a |
| Age, years (SD) | 39.1 (17.7) | 49.3 (16.4) | 53.4 (15.1) | <0.001b |
| HTN, n (%) | 103 (26.0) | 185 (46.8) | 214 (54.2) | <0.001a |
| Diabetes, n (%) | 26 (6.6) | 34 (8.6) | 52 (13.2) | 0.002a |
| Smoker, n (%) | 145 (36.6) | 117 (29.6) | 123 (31.1) | 0.087c |
| BMI, kg/m2(SD) | 25.4 (4.4) | 28.2 (4.9) | 28.7 (4.7) | <0.001d |
| Obesity, n (%) | ||||
| Normal weight | 206 (52.0) | 101 (25.6) | 92 (23.3) | |
| Overweight | 129 (32.6) | 180 (45.6) | 163 (41.3) | |
| Obese | 61 (15.4) | 114 (28.9) | 140 (35.4) | <0.001a |
| Plasma glucose level, mg/dl (SD) | 96.4 (27.6) | 98.9 (23.0) | 105.0 (33.1) | <0.001e |
| Total cholesterol, mg/dl (SD) | 159.6 (20.6) | 197.4 (15.1) | 240.7 (25.6) | <0.001b |
| Triglycerides, mg/dl (SD) | 71.7 (59.9) | 98.6 (52.7) | 137.0 (80.8) | <0.001b |
| HDL-C, mg/dl (SD) | 50.0 (12.2) | 46.5 (11.7) | 44.5 (11.4) | <0.001b |
| Non-HDL-C, mg/dl (SD) | 109.6 (17.1) | 150.9 (9.7) | 196.2 (24.0) | <0.001b |
BMI: body mass index; HDL: high-density lipoproteins; HDL-C: cholesterol bound to HDL; HTN: hypertension; n: number of participants; non-HDL-C: non-HDL cholesterol.
Significant differences between the 1st tertile and the 2nd tertile and between the 1st tertile and the 3rd tertile, but not between the 2nd and 3rd tertiles.
Significant differences between the 1st tertile and the 3rd tertile and between the 2nd tertile and the 3rd tertile, but not between the 1st and 2nd tertiles.
Quantitative variables are expressed as mean and standard deviation (SD); qualitative variables are expressed as exact value and percentage. The association between qualitative variables was examined using the chi-square test or the Mantel–Haenszel test and means were compared using a one-way analysis of variance with Bonferroni a posteriori contrast.
Cardiovascular risk factors associated with low-density lipoprotein cholesterol, split into tertiles.
| 1st tertile (n=392) | 2nd tertile (n=392) | 3rd tertile (n=393) | p | |
|---|---|---|---|---|
| Gender, n (%) | ||||
| Female | 242 (61.7) | 230 (58.7) | 192 (48.9) | |
| Male | 150 (38.3) | 162 (41.3) | 201 (51.1) | <0.001a |
| Age, years (SD) | 39.3 (17.9) | 48.5 (16.2) | 54.0 (15.2) | <0.001b |
| HTN, n (%) | 107 (27.3) | 179 (45.7) | 213 (54.2) | <0.001a |
| Diabetes, n (%) | 26 (6.6) | 37 (9.4) | 47 (12.0) | 0.01a |
| Smoker, n (%) | 152 (38.8) | 117 (29.8) | 114 (29.0) | 0.004a |
| BMI, kg/m2(SD) | 25.6 (4.5) | 28.2 (4.9) | 28.3 (4.8) | <0.001c |
| Obesity, n (%) | ||||
| Normal weight | 193 (49.2) | 104 (26.5) | 101 (25.7) | |
| Overweight | 131 (33.4) | 172 (43.9) | 165 (42.0) | |
| Obese | 68 (17.3) | 116 (29.6) | 127 (32.3) | <0.001a |
| Plasma glucose level, mg/dl (SD) | 97.4 (28.5) | 99.1 (24.9) | 102.8 (28.4) | 0.017d |
| Total cholesterol, mg/dl (SD) | 159.3 (20.3) | 197.9 (15.2) | 239.8 (25.7) | <0.001b |
| Triglycerides, mg/dl (SD) | 80.7 (50.8) | 101.2 (56.2) | 114.9 (54.1) | <0.001b |
| HDL-C, mg/dl (SD) | 48.3 (12.3) | 46.8 (11.7) | 46.1 (11.7) | 0.025d |
| Non-HDL-C, mg/dl (SD) | 110.9 (19.3) | 151.1 (14.6) | 193.7 (25.1) | <0.001b |
| LDL-C, mg/dl (SD) | 94.8 (15.6) | 130.8 (8.6) | 170.7 (20.7) | <0.001b |
BMI: body mass index; HDL-C: cholesterol bound to high-density lipoproteins; HTN: hypertension; LDL-C: cholesterol transported by low-density lipoproteins; n: number of participants.
Significant differences between the 1st tertile and the 2nd tertile and between the 1st tertile and the 3rd tertile, but not between the 2nd and 3rd tertiles.
Significant differences between only the 1st and the 3rd tertiles.
Quantitative variables are expressed as mean and standard deviation (SD); qualitative variables are expressed as exact value and percentage. The association between qualitative variables was examined using the chi-square test or the Mantel–Haenszel test and means were compared using a one-way analysis of variance with Bonferroni a posteriori contrast.
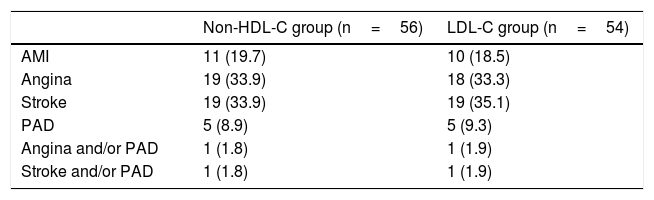
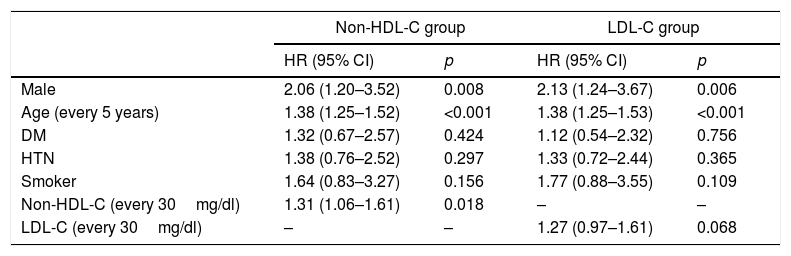
The mean follow-up is the same in both groups: 10.7 years (SD=2.2). Table 4 shows the first non-fatal events that occurred during this period, affecting 6.2% of the total follow-up sample in the non-HDL-C group (56 events) and 6.0% in the LDL-C group (54 events). Table 5 shows the hazard ratios (HR) of the variables that were independent predictors after adjusting for gender, age, DM, HTN, smoker status and non-HDL-C in one model and for LDL-C in the second model. For each 30mg/dl increase in non-HDL-C, the hazard ratio was 31% (HR=1.31; 95% CI: 1.06–1.61; p=0.018) and for each 30mg/dl increase in LDL-C, the hazard ratio was 27% (HR=1.27; 95% CI: 0.97–1.61; p=0.068), which in this case did not reach statistical significance.
Non-fatal cardiovascular events observed during follow-up.
| Non-HDL-C group (n=56) | LDL-C group (n=54) | |
|---|---|---|
| AMI | 11 (19.7) | 10 (18.5) |
| Angina | 19 (33.9) | 18 (33.3) |
| Stroke | 19 (33.9) | 19 (35.1) |
| PAD | 5 (8.9) | 5 (9.3) |
| Angina and/or PAD | 1 (1.8) | 1 (1.9) |
| Stroke and/or PAD | 1 (1.8) | 1 (1.9) |
AMI: acute myocardial infarction; LDL-C: low-density lipoprotein cholesterol; n: frequency of events during follow-up; non-HDL-C: cholesterol not included in high-density lipoprotein cholesterol; PAD: peripheral artery disease.
Results are expressed as exact value and percentage.
Incidence of adjusted risk factors, predictors of cardiovascular morbidity, in models including non-HDL and LDL cholesterol.
| Non-HDL-C group | LDL-C group | |||
|---|---|---|---|---|
| HR (95% CI) | p | HR (95% CI) | p | |
| Male | 2.06 (1.20–3.52) | 0.008 | 2.13 (1.24–3.67) | 0.006 |
| Age (every 5 years) | 1.38 (1.25–1.52) | <0.001 | 1.38 (1.25–1.53) | <0.001 |
| DM | 1.32 (0.67–2.57) | 0.424 | 1.12 (0.54–2.32) | 0.756 |
| HTN | 1.38 (0.76–2.52) | 0.297 | 1.33 (0.72–2.44) | 0.365 |
| Smoker | 1.64 (0.83–3.27) | 0.156 | 1.77 (0.88–3.55) | 0.109 |
| Non-HDL-C (every 30mg/dl) | 1.31 (1.06–1.61) | 0.018 | – | – |
| LDL-C (every 30mg/dl) | – | – | 1.27 (0.97–1.61) | 0.068 |
CI: confidence interval; DM: diabetes mellitus; HDL: high-density lipoproteins; HR: hazard ratio; HTN: hypertension; LDL-C: low-density lipoprotein cholesterol; non-HDL-C: non-HDL cholesterol.
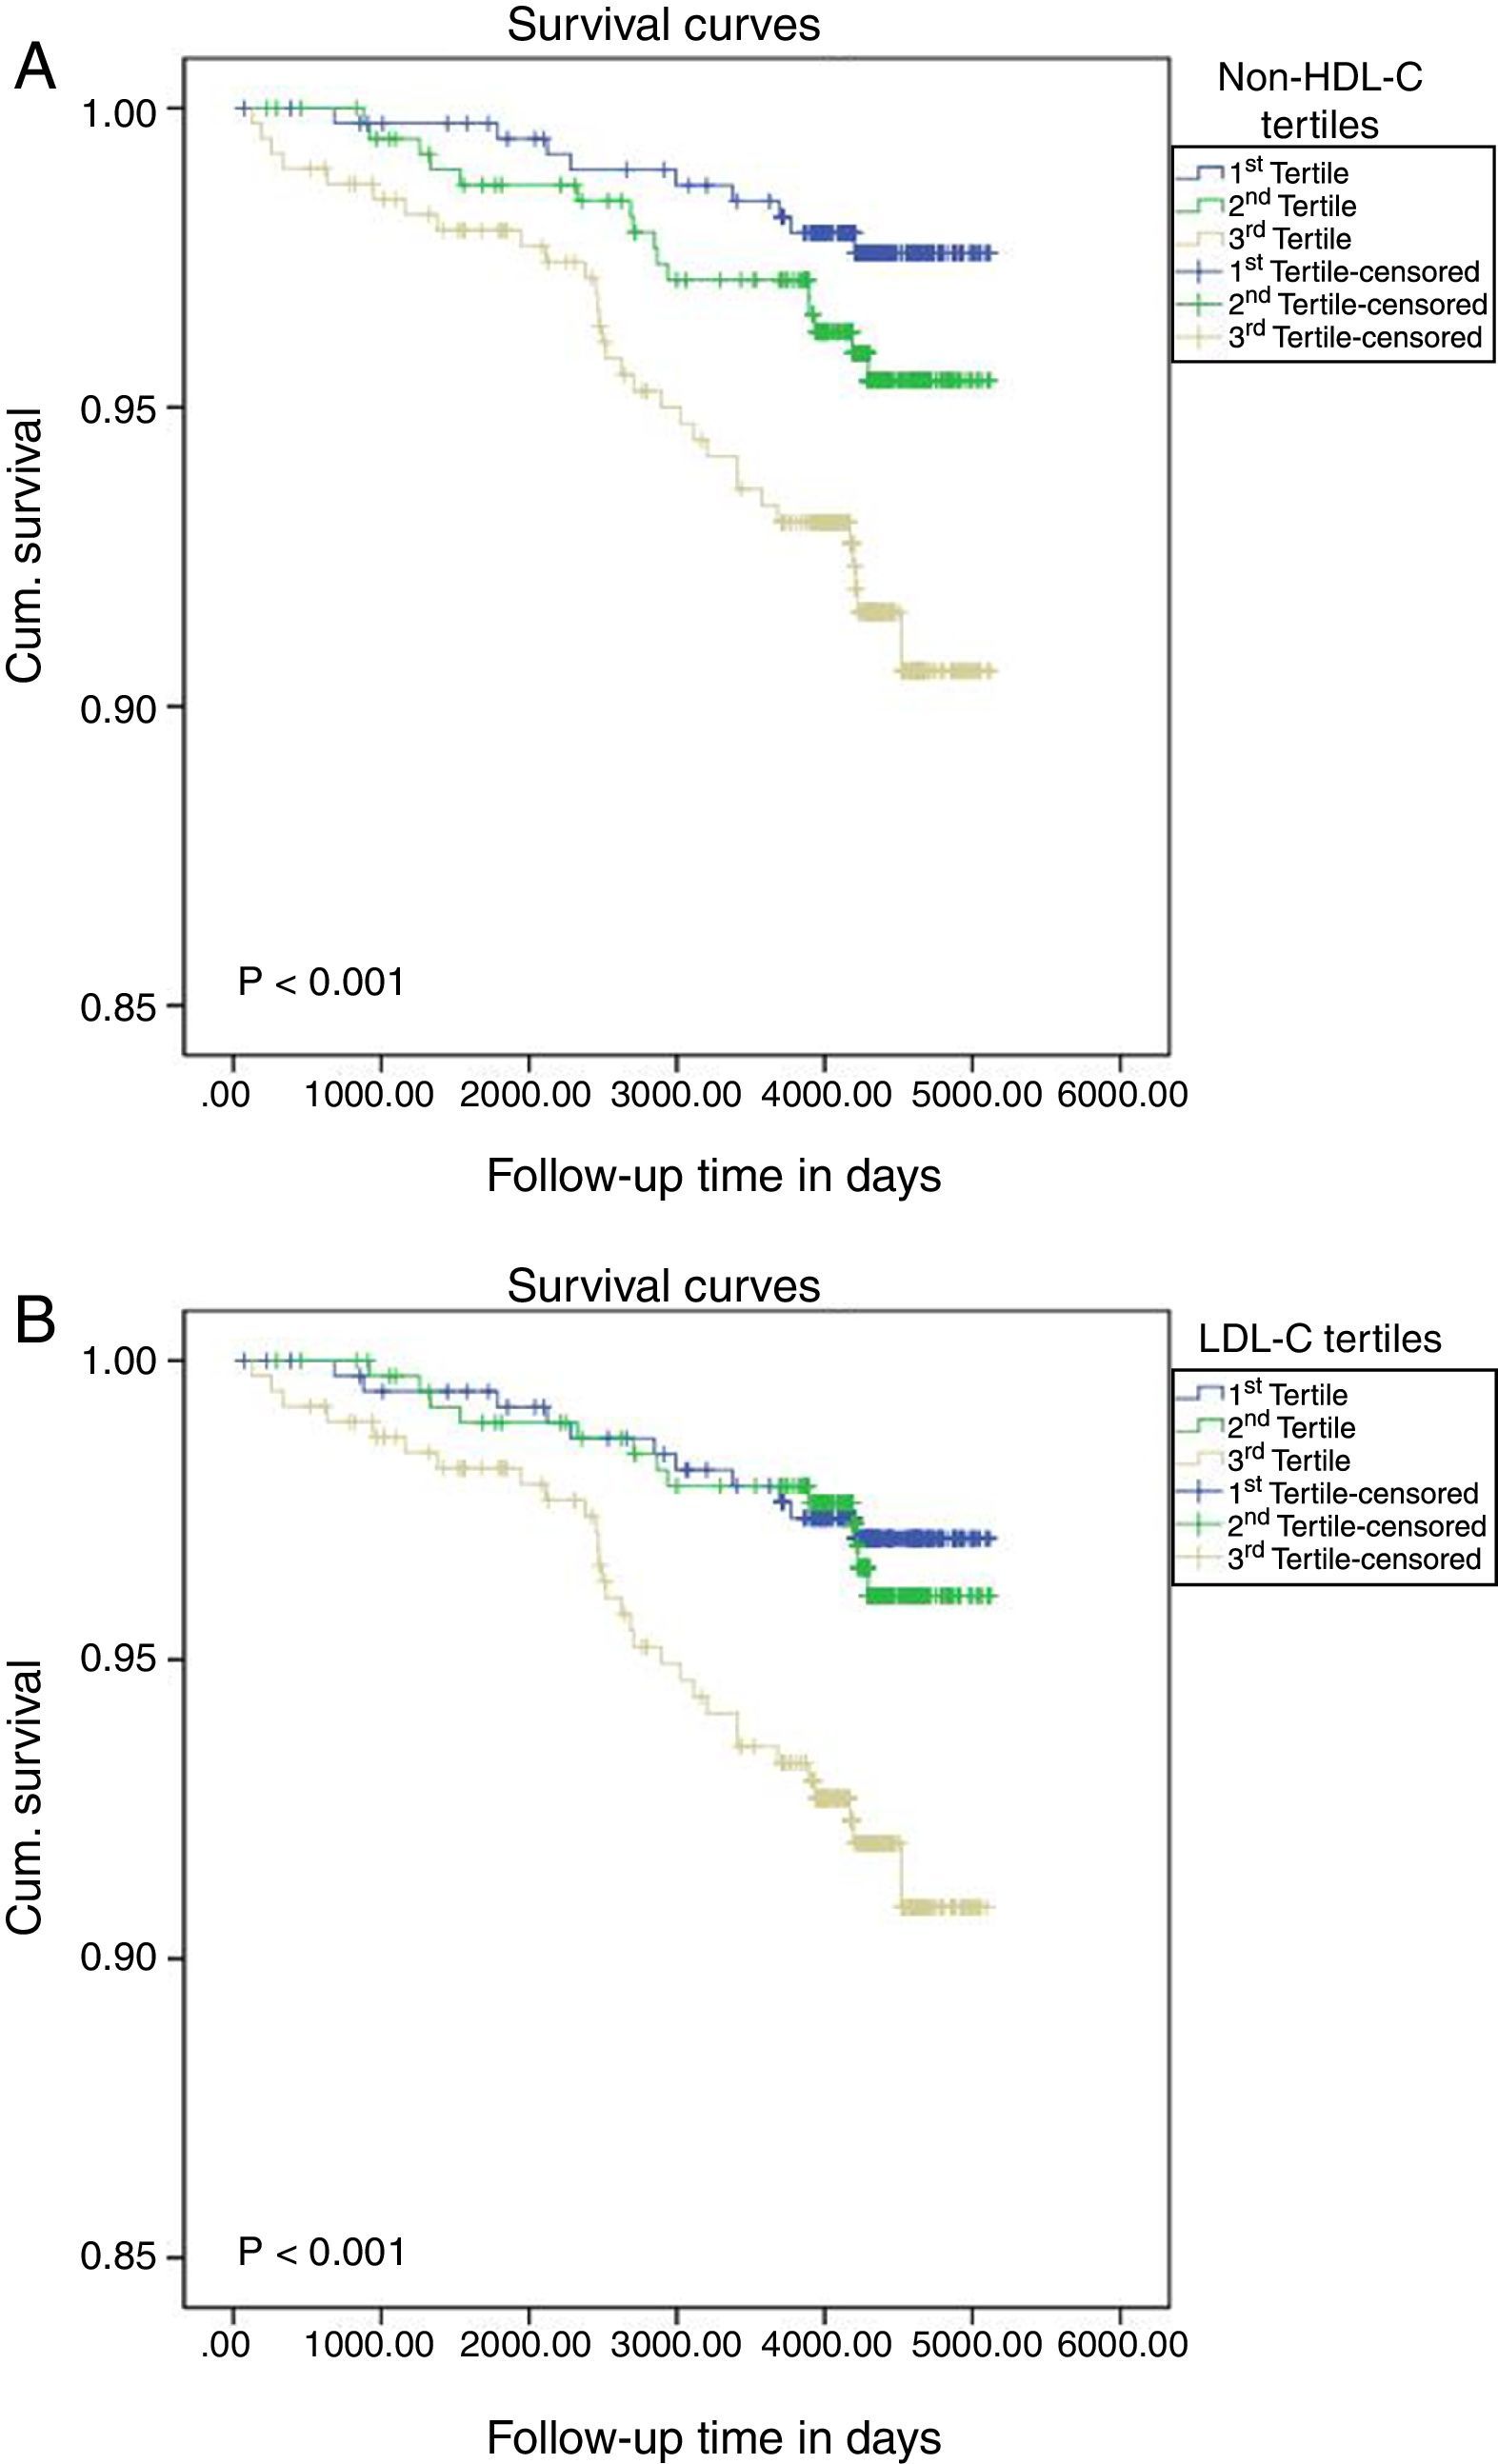
Finally, Fig. 1 shows significant differences between the tertiles of each group, non-HDL-C and LDL-C, in the onset of new non-fatal CVD events (p<0.001 in both groups).
 or LDL cholesterol (B). The Kaplan–Meier method was used and the difference between the groups was calculated using the log-rank test.")
Cumulative survival probabilities on assessing the onset of initial non-fatal cardiovascular events according to the classification of non-HDL cholesterol in tertiles (A) or LDL cholesterol (B). The Kaplan–Meier method was used and the difference between the groups was calculated using the log-rank test.
This study has shown that non-HDL-C is a predictor of non-fatal CVD, but LDL-C is not. In other words, when all apoB-containing lipoprotein particles included in non-HDL-C are taken into account, non-fatal CVD prediction rates are higher. This finding is in line with the high prevalence of metabolic syndrome in Spain16 and changes in our study when no patients with high triglyceride levels are included in the sample, indicating the weight of the atherogenic nature of this type of particle.17 These results are also consistent with a meta-analysis conducted in patients treated with statins, which shows a stronger association between the risk of future major cardiovascular events and non-HDL-C than LDL-C and apoB.18 There is no doubt that controlling LDL-C to prevent CVD is a primary objective,19 as is the reduction of non-HDL-C.20 However, as plasma triglyceride levels rise, as tends to occur with metabolic syndrome, insulin resistance, type 2 diabetes and obesity, apoB-containing lipoprotein cholesterol increases as LDL particles are transformed in these conditions into smaller and denser particles, with LDL-C remaining stable.21 This indicates that LDL-C values underestimate the risk of elevated apoB-containing atherogenic lipoproteins. Underestimated LDL-C values have also been observed in patients with a very high or high cardiovascular risk with LDL-C target of less than 70mg/dl, less than 100mg/dl and TG value ≥150mg/dl, just when more accurate CVR calculations are required.22 Therefore, non-HDL-C is profiled as an outstanding therapeutic target for the prevention of CVD, especially in patients with atherogenic dyslipidaemia and in high and very high risk patients, with the advantage that it is a robust test that can be calculated in all lipid profiles and requires no fasting.23 The importance of apoB-containing particles in the onset of initial non-fatal cardiovascular events is reflected in this study since, by excluding patients with TG>400mg/dl, LDL-C no longer has a predictive capacity and the HR of non-HDL-C is instead significant.
Strengths and limitationsThe main strength of this study is the fact that results are for a random sample drawn from the general population. It therefore presents solid rates of external validity and results can be extrapolated at least to the population from which the sample was taken. The main limitation is that the sample size is not very large and very few non-fatal cardiovascular events have been recorded. This may explain why LDL-C has not shown significant HRs, although the difference between the two HRs is small, indicating that, when the sample is taken from the general population, there are very few absolute differences in prognostic importance between LDL-C and non-HDL-C in non-fatal CVD.
ConclusionsIn the general population, the results of our study show that, even when a population with high TG levels are included in the prediction, as occurs in metabolic syndrome (shown especially by abdominal obesity, prediabetes and diabetes), non-HDL-C gives the best prediction, even giving more accurate information regarding CVR. Like Ascaso and Carmena,24 we believe that, in this group of patients, the therapeutic target should be non-HDL-C or apoB and not LDL-C.
Conflicts of interestThe authors declare that they have no conflicts of interest.
In addition to the authors of the article, the following are members of the group and have assisted with the article:
Carlos Sanchis Domènech, MD.
Lucinio Carrión Valero, MD.
Javier Massó Orozco, MD.
Enrique López de Coca and Fernández-Valencia, MD.
Juan López-Abril, MD.
Francisco García Gosálvez, MD.
Beatriz Rodríguez-Paños, MD.
Esperanza Martínez Navarro, MD.
Rosalina Martínez López, MD.
Pilar Torres Moreno, MD.
Josefina Monedero Laorden, MD.
Beatriz González Lozano, MD.
Lourdes Navarro Sánchez, MD.
Miriam Martínez Ramírez, MD.
Eva Argandoña Palacios, Registered Nurse.
Alfonso Campayo Serrano, IT technician.
Members of the Grupo de Enfermedades Vasculares de Albacete (GEVA) are listed in Appendix.
Please cite this article as: Carbayo Herencia JA, Simarro Rueda M, Palazón Bru A, Molina Escribano F, Ponce García I, Artigao Ródenas LM, et al. Valoración del colesterol no HDL como predictor de episodios cardiovasculares no mortales en una cohorte prospectiva de origen poblacional. Clin Investig Arterioscler. 2018;30:64–71.
A presentation relating to this study, entitled “Non-HDL cholesterol as a predictor of non-fatal cardiovascular events in a prospective population cohort”, was given at the 30th National Congress of the Sociedad Española de Arteriosclerosis (Spanish Atherosclerosis Society) (Cádiz, 2017) and awarded a 2017 Special Mention Award.